Article

Experimental Research of Rubber Composites Subjected to Impact Loading

by
Ľubomír Ambriško
* and
Daniela Marasová
Faculty of Mining, Ecology, Process Control and Geotechnologies, Technical University of Košice, Letná 9, 042 00 Košice, Slovakia
*
Author to whom correspondence should be addressed.
Appl. Sci. 2020, 10(23), 8384; https://doi.org/10.3390/app10238384
Submission received: 3 November 2020 / Revised: 22 November 2020 / Accepted: 23 November 2020 / Published: 25 November 2020
(This article belongs to the Special Issue Multifunctional Polymers and Composites)

Abstract

:
This paper investigates rubber composites subjected to impact loading. One of the objectives was to determine the effect of the support system on the impact force value. Another objective was to identify the correlations between the force characteristics of the impact process, i.e., between the impact force and the tensile force. The identified correlations between the impact process characteristics have been subjected to regression analyses, and their outputs were regression models describing the dynamic stress of rubber composites during the testing of their impact resistance. At dynamic loading, the key factor was the support system, which eliminates the force effects of the falling material that damages the rubber composite, in particular a conveyor belt, and may even lead to the loss if its functionality. In real operations, conveyor belts are stressed by the impact of the transported material onto the belt surface at sites where the conveyor is filled or at chutes, and this often results in belt damage. In many cases, such a belt is no longer usable, and significant financial loss is therefore incurred due to the need for replacement of the damaged belt and due to consequent downtimes.

1. Introduction

The process of vulcanisation of natural or synthetic rubber is applied to produce an elastic material, namely rubber, whose properties facilitate a vast spectrum of applications. Extremely high elongation with very low strength [1] and high absorption and insulation properties of elastomer materials are suitable for a wide range of industrial applications, such as electric insulation, medical devices and transportation. Elastomer materials are exposed to extreme load conditions, such as complex mechanical loads, high temperatures, UV radiation, oxygen and humidity. Their mechanical and utility properties are therefore affected by particular operating conditions. Mechanical and utility properties of elastomers strongly depend on their loading history and exposure to chemical and physical ageing. These properties are directly affected by changes in the macromolecular mesh structure induced by a chemical reaction [2]. Elastomers are widely used in various industries thanks to their remarkable dissipation properties: they endure high mechanical loads, i.e., high deformation velocities and large strains [3].
Rubber represents an important component of a rubber composite, i.e., a conveyor belt. The conveyor belt is the basic structural component of a belt conveyor, which is very important in mining, transport and processing of bulk materials [4] and in many other areas. The belt conveyor is one of the most commonly used conveyor types thanks to its high transportation efficiency and velocity, long-distance transport capacity, low energy consumption, operational safety and simple operation and maintenance [5]. Conveyor belts, i.e., the carrying and tractive elements of conveyors, are used in practically all industries [6]; they are also widely used in the transport of grainy materials [7]. However, the costs of purchase, maintenance, repairs and renewal of the conveyor belt often exceed the costs of the remaining parts of the conveyance system, such as support systems and drives. It is therefore still a great priority to extend the belt service life, which may be achieved by reducing the conveyor belt wear.
A conveyor belt is a composite consisting of different materials. The properties of its individual components significantly affect the final properties of the belt as such and determine its suitability for a particular function and application in real operations. From the structural point of view, both fabric and steel-cord conveyor belts have the same cover layer materials. Rubber cover layers protect the belt carcass and provide the required resistance to forces to which the conveyor belt is exposed. The top cover layer is in direct contact with the transported material, which damages it during the operation. Fabric conveyor belts, which are the ones most frequently used [8], usually consist of a wear-resistant top cover layer, with the fabric carcass providing the tensile strength of the belt, the adhesive mixture between the rubber and the carcass, and the bottom rubber cover layer covering the carcass and providing sufficient friction on the driving pulley [9]. The structure of different steel-cord conveyor belts is basically the same, and only the carcass material is different. In real operations, special attention is paid to the top cover layer as it is tribologically the most stressed belt part.
Conveyor belt wear is characterised by abrasion [10]. It is very important to describe the wearing process in rubber products exposed to high stresses, for example, in belts transporting sharp-edged materials. Sharp edges and rough surfaces gradually abrade the rubber parts. Such wear significantly damages individual belt parts and eventually destroys the belt [11].
The service life of conveyor belts used in quarries depends on operating conditions and may last a few years or even more than 10 years, while belts with steel cords have longer service lives [12]. In underground mines, the service lives of conveyor belts are reduced to several years, and the average service life of fabric belts used in mines is approximately 3–4 years [13].
The issues regarding the examination of belt conveyor properties and the monitoring of belt wear or damage have been discussed in many papers. Hardygora [14] stated that basic experimental methods used to assess reliability and quality of conveyor belts made of rubber and fabric include the monitoring of puncture resistance, cut resistance, stress-strain testing and belt joints examination. Bocko et al. [15] tested mechanical properties of rubber conveyor belts by exposing them to impact loading, and the resulting belt failures were assessed by computed tomography. Andrejiová and Grinčová [16] categorised the types of impact damage that occur in fabric conveyor belts. In laboratory conditions, they tested various types of conveyor belts (unused, used and used ones with renovated top cover layers).
In order to evaluate belt properties and quality, it is necessary to determine conventional mechanical, physical and special properties that provide complex data on the behaviour of used belts in complicated loading conditions. The operational service life of a conveyor belt depends on multiple factors—transported material, operating conditions, conveyor belt quality and material properties [17]. One of the material properties of conveyor belts is the tensile strength, which is determined primarily by the strength of fabric plies forming the carcass.
The belt’s cover layer material is rubber, and its elastic properties change as it ages. Ageing of polymers, such as rubber, may be caused by various chemical and mechanical processes, accelerated high loading and temperatures, or by the effects of ozone or sunlight. High temperatures in particular may accelerate oxidation and radical-activated processes of chain cleavage. These processes may be referred to as chemical degradation, which affects the properties of the material. As elastomers age, their efficiency is affected not only by chemical degradation (bond-breaking and bond-making processes) but also by molecular regrouping affecting entropic processes that are crucial for elasticity [18]. The purpose of paper [19] was the experimental testing of rubber hardness and identification of the impact of natural ageing on that particular mechanical property. The issues regarding conveyor belt ageing at higher temperatures and its impact on abrasive properties of rubber have been dealt with by Edgea et al. [20], who investigated the oxidation stability of natural rubber at the temperature of 150 °C. It has been demonstrated that after the absorption of even 1% of oxygen, natural rubber completely loses its elasticity, and its abrasive resistance is hence impaired. This has also been confirmed in paper [4], which discusses the experimental investigation of abrasive resistance and hardness of fabric belts. It was confirmed that oxygen reacting with sulphur transversally bound among rubber molecules reduces the rubber’s elastic properties. The fact that rubber in conveyor belts loses its tensile strength due to ageing was confirmed by Turnbull [21]. This process may also cause the reduction of the polymerisation degree, and as a result, the chemical composition of the belt changes. In [22], rubber hardness and abrasive resistance were identified, and the effects of natural ageing on rubber properties were investigated. The test results confirmed that even at the ambient temperature, the ageing of rubber increased its hardness and that this affected the functional properties of the rubber cover layer.
The present paper deals with the identification of the effects of the support system on the impact force and the identification of correlations between the impact force and the tensile force based on the measured data.

2. Materials and Methods

2.1. Experimental Material

The experiments were carried out with rubber composites used for the transport of materials on belt conveyors. The cover layers of conveyor belts are intended to protect the fabric or steel-cord carcass against mechanical damage and corrosion. Cover layers of belts must meet the following requirements [23]: high abrasive resistance; good elasticity; high strength; and increased resistance to ageing, ozone and fatigue. The cover layer thickness should be chosen on the basis of the type and properties of the transported material, its nature (pieces or bulk), weight, sharpness of edges, degree of abrasive effects, impact energy, drop height of the transported material, method of filling a conveyor, etc.
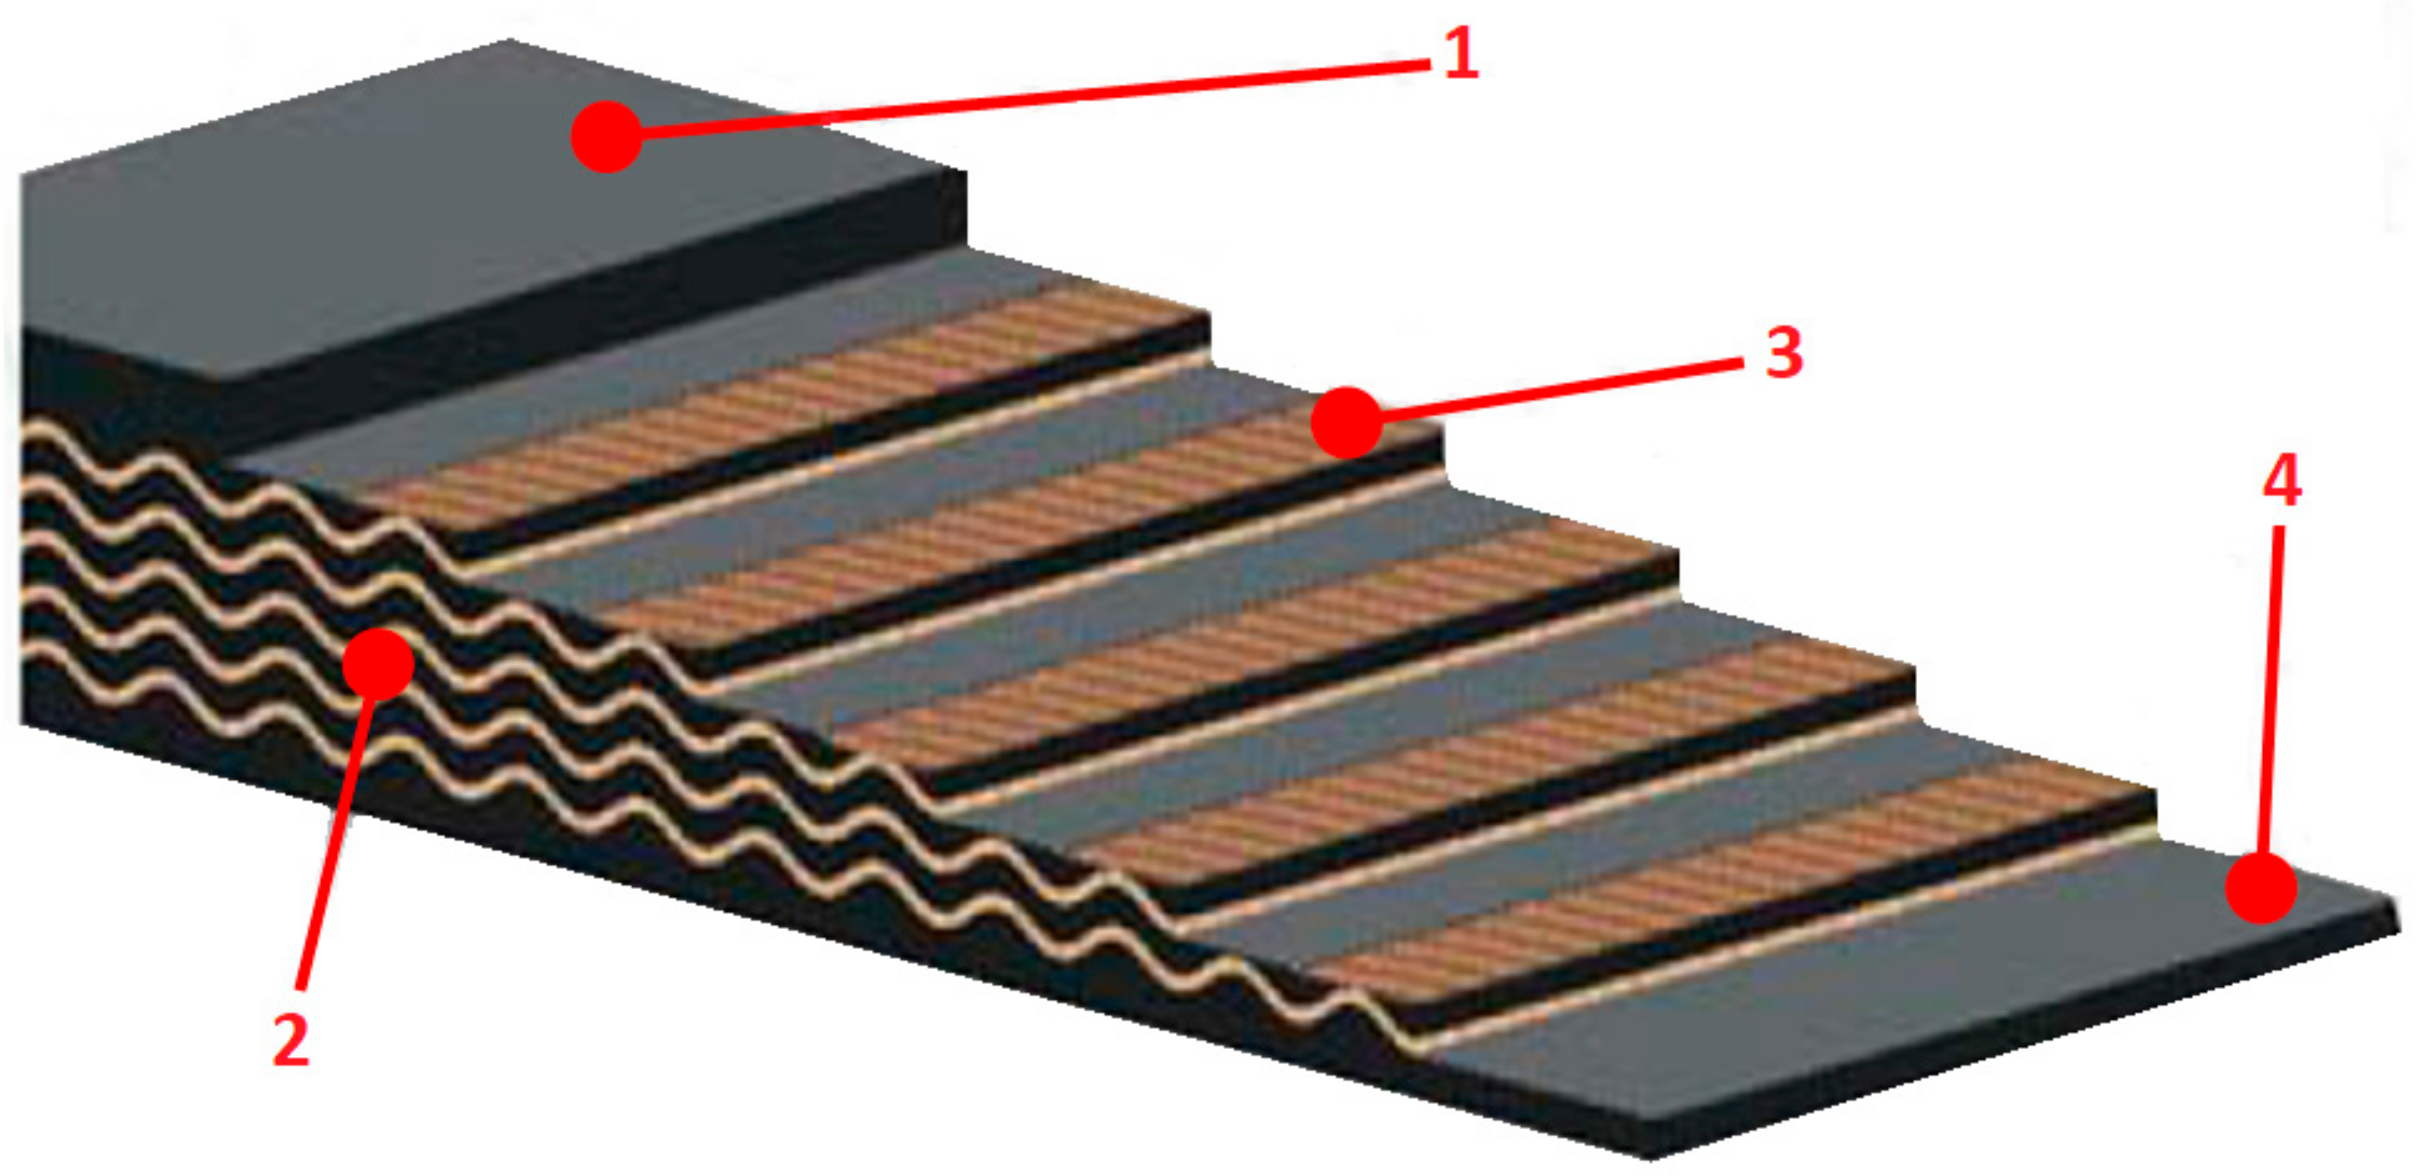
The conveyor belt carcass’s role is to transfer tensile forces from the driving pulley to the belt itself; it also provides the required strength and puncture resistance of the conveyor belt. The top cover layer and the protective edge enclose the carcass and protect it against mechanical damage caused by the transported material, against the effects of humidity and against chemical and thermal effects to which the conveyor belt is exposed. The bottom cover layer comes into contact with conveyor pulleys and protects the carcass against their negative effects. An important factor is the adhesion of the cover layer to the carcass, as it facilitates the transmission of torque of the driving pulley to the entire conveyor belt [24]. The carcass of the conveyor belt comprises a ply, which may be fabric or steel, and its individual components are connected using an elastic material. The carcass of fabric conveyor belts consists of one or more fabric plies (Figure 1). The plies are impregnated and rubber-coated fabrics possessing required mechanical and physical properties. Typically, the carcass of the conveyor belt also comprises a bumper, which increases the puncture resistance of the belt. Such belts are used in the technology for surface mining, quarries and transport of heavy large-piece materials. The bumper is made of polyamide, polyester, steel cord or aramid. These belts exhibit higher resistance to the development and propagation of punctures caused by the falling material at improper drop heights. In the case of steel-cord conveyor belts, the carcass consists of steel cords in the core rubber.
The carcass of fabric belts is made of natural or synthetic fibres with properties that determine their applications. Currently used types of fibres may be divided into the following groups based on various criteria, the most common one being their origin [23]:
  • Natural fibres—made of natural macromolecular substances of animal or herbal origin and mineral substances; the fibres are produced mechanically (e.g., cotton);
  • Chemical fibres—made of natural or synthetic polymers in a chemical process (e.g., polyamide, polyester, aramid);
  • Metallurgical fibres—made of inorganic substances in a metallurgical process (e.g., steel or glass).
Tensile properties of conveyor belts depend on the carcass material. In the case of fabric belts, the carcass consists of several layers of fabric plies. The fabric plies are produced by crossing warps and wefts. A warp is a set of threads in the longitudinal direction, and a weft is a set of threads in the transversal direction. Such a fabric structure directly determines the tensile properties of the belt itself. In order to improve these properties, a combination of different fabrics in warps and wefts is sometimes used. In EP-type conveyor belts, it is a combination of polyester fabrics in the warp and polyamide fabrics in the weft. Such structure exhibits good resistance to dynamic fatigue and protects the belt against the development and propagation of punctures [26].
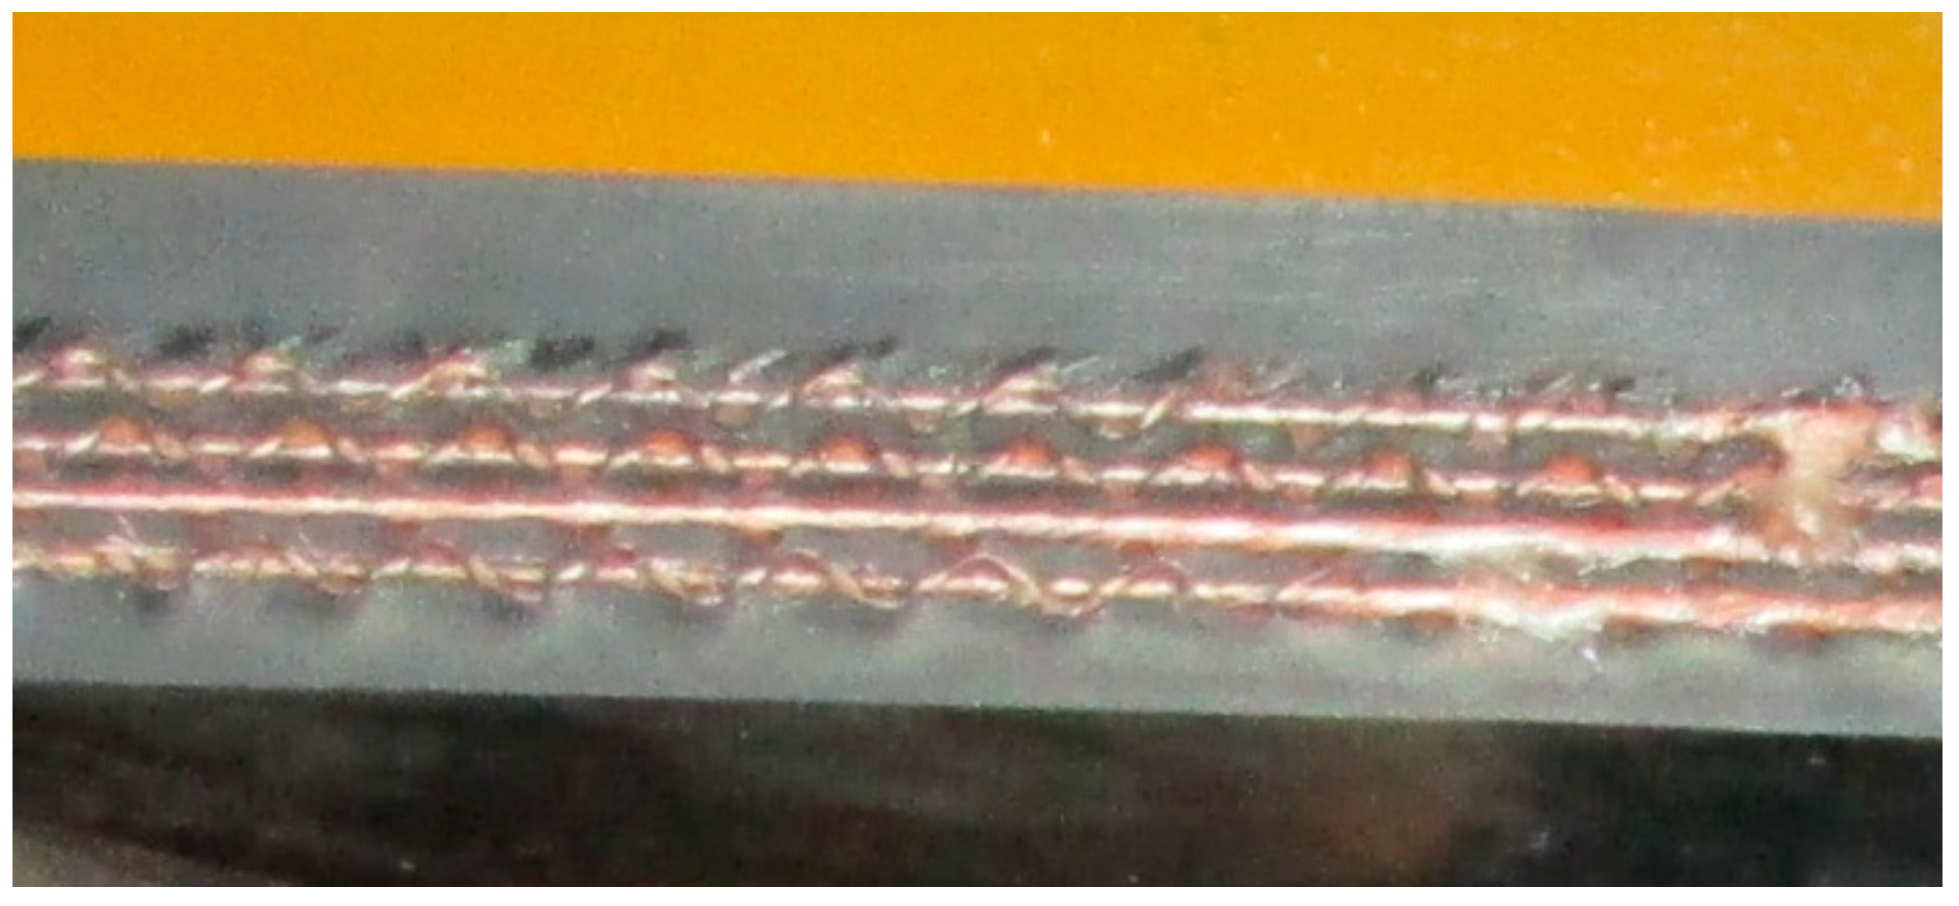
Experimental testing was carried out using the specimens (1200 × 150 mm) of fabric conveyor belts of the P 2000/4 8 + 4 201A type. These belts are used in the transport of abrasive and sharp-edged materials in large pieces, and they comprise a 4-ply fabric—polyamide carcass (Figure 2) with the nominal strength of 2000 N.mm−1, an 8 mm thick top cover layer and a 4 mm thick bottom cover layer. During the tests, each specimen was stretched by applying a force of 30 kN, corresponding to 1/10 of the nominal strength of the belt, and the support system used was an idler with the following dimensions: idler diameter of 92 mm, idler length of 445 mm and idler spacing of 200 mm.

2.2. Impact Loading

An object falling vertically onto a conveyor belt possesses at the moment of the impact the kinetic energy corresponding to the potential energy determined by the drop height and the object weight. At the beginning of the free fall, the object moves at a horizontal velocity parallel to the impact plane. Then the object maintains this horizontal velocity, provided the air resistance is ignored, and falls onto the belt at the velocity representing the resultant of the horizontal and vertical velocities. Its direction is identified by geometric summation of both velocity components. At the impact site on the belt, the particles of the transported material change their direction and velocity. For the purpose of further transport, only the horizontal velocity component may be used, whereas the vertical velocity component exerts an impact force perpendicular to the conveyor belt. The point impact loading is one of the causes of conveyor belt damage. Maximum values of the loading to which the belt is exposed at such a point are caused by the impact of the transported material, which is concentrated on a small area of the belt. At the moment when the material of a certain weight and velocity touches the belt, the elastic–plastic impact occurs. The value characterising the impact course is the impulse of the impact force, while its magnitude and direction depend mainly on the chute design [27]. At the vertical impact of the transported material, especially a lump material, strong impact forces are exerted against the conveyor belt, and they cause punctures. A physical contact between the material and the conveyor belt only lasts 0.03 to 0.12 s [28]. During this period, the conveyor belt is exposed to a force that is several times stronger than the material weight. As the conveyor belt is in motion, the material receives a strong horizontal impulse after the physical contact with the belt. The impact energy is absorbed by the deformation work of the conveyor belt and impact idlers. If the belt–idlers system is not able to absorb the impact energy of the falling material, a puncture occurs [23]. Maximum values of loading at the impact site occur as a result of the dynamic effects of impact loading, which are present in a small area of the belt.
As for the utility properties of conveyor belts, in addition to tensile strength, the puncture resistance of conveyor belts is also of great importance. It is defined as the ability of a conveyor belt to absorb the impact energy produced when a material falls onto a belt, i.e., to absorb the impact energy through the deformation work of the conveyor belt without any belt damage being present [28]. If the impact energy is larger than the ability of the conveyor belt and the support system to absorb such energy, damage to the conveyor belt occurs, especially to its top cover layer, in the form of transversal and longitudinal scratches, pricks or punctures; this may even damage the carcass of the conveyor belt. Subsequently, longitudinal cuts may appear on the belt, and this causes serious failures of the conveyor and incurs high financial losses.
The rate and form of the conveyor belt damage at the chutes depend mainly on the following:
  • Belt structure and properties of its structural elements;
  • Forces exerted upon the part of the belt where the point force is present;
  • Rigidity of the support elements (spring-loaded support idlers) of the belt [24].

2.2.1. Experimental Impact Testing of Belts

Experimental impact testing of conveyor belts has proven to be very important, and it contributes to extending the belt service life. It is very important to understand the factors affecting the belt wear and damage during the operation, as such knowledge is used in designing the thickness and category of conveyor belt cover layers and the belt structure. The analysis of the effect of the support system confirms that the support system is an element eliminating the damage to conveyor belts and that it has a significant effect on puncture resistance of conveyor belts and hence also on their service lives [28].
At the moment of the maximum deflection of the belt, kinetic energy is fully transformed into the energy of elastic strain of the belt and the energy dispersed at the point where the belt contacts the falling object. A portion of this energy is absorbed by the belt and causes dispersion of a certain amount of heat or even damage to the belt carcass [23].
The testing devices available on the market facilitate adjustments of the drop height using a software-controlled [29] motor drive with semi-automatic drop hammer lifting, which may be smoothly adjusted. A different kind of the test stand intended for identification of puncture resistance of conveyor belts is available in Wroclaw [30]. The stand used in this work has a laser sensor measuring the drop height of the drop hammer.
Another type of equipment is drop test equipment, which is not used to test conveyor belts, but facilitates testing of large objects for impact-induced deflection caused by a falling weight i.e., in the DWTT (Drop Weight Tear Test). The purpose of impact testing is to identify the transient temperature of steel sheets for pressure piping. The testing is carried out using drop test equipment, which comprises a recording device measuring the consumed impact energy [31]. The drop test equipment also has an electric engine for lifting the drop hammer, and it facilitates the electronic measurement of the drop hammer’s velocity. After certain modification, the device might also be used for testing conveyor belts.

2.2.2. Description of the Test Equipment

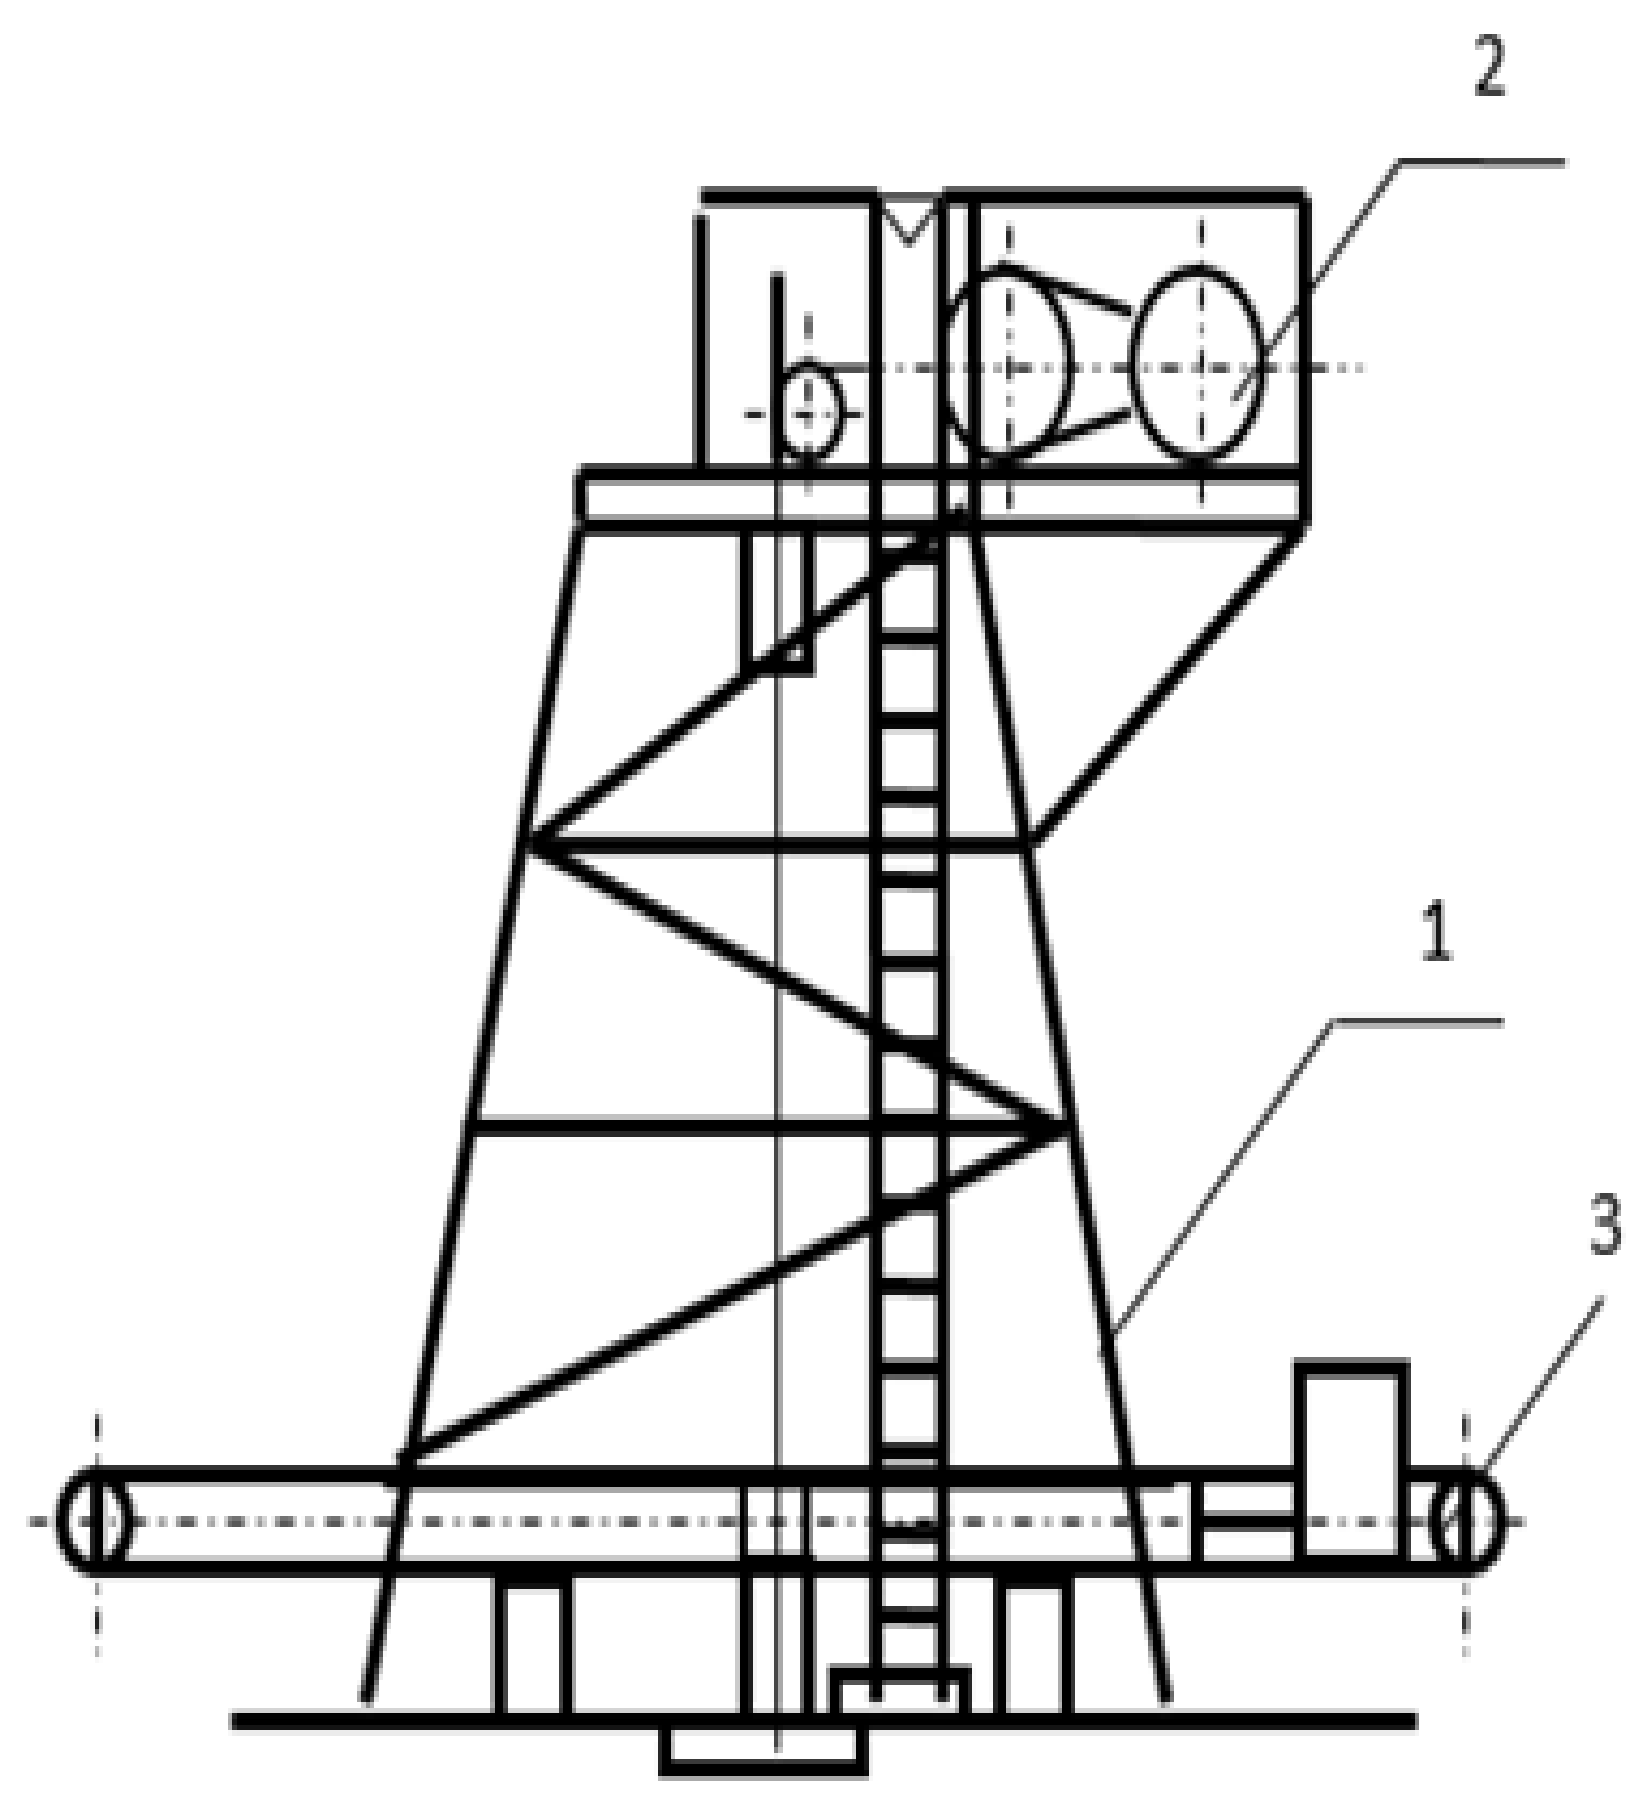
For the purpose of conveyor belt testing for puncture resistance, the test equipment was designed and assembled a few years ago at the Faculty of Mining, Ecology, Process Control and Geotechnologies of the Technical University of Košice (Figure 3). The test equipment consisted of a tower, a frame table with a belt conveyor and the measuring apparatus. The frame table design combined a 4 m long belt conveyor and the basic frame. The maximum height to which the drop hammer was lifted was 3.5 m. The design of the conveyor with a fixed table facilitated testing of moving as well as fixed conveyor belts. The tensile force of the belt was produced using the tension screws. The values of the impact force were measured using a measuring head with attached tensometers recording the following physical parameters: vertical impact force in the Z direction; horizontal impact force in the X direction—along the belt; and horizontal impact force in the Y direction—perpendicularly to the belt. The measurements were carried out with different drop heights, weights of the falling object, shapes of the falling object (cone, pyramid and sphere), conveyor belt types, tensile forces and idlers [28].
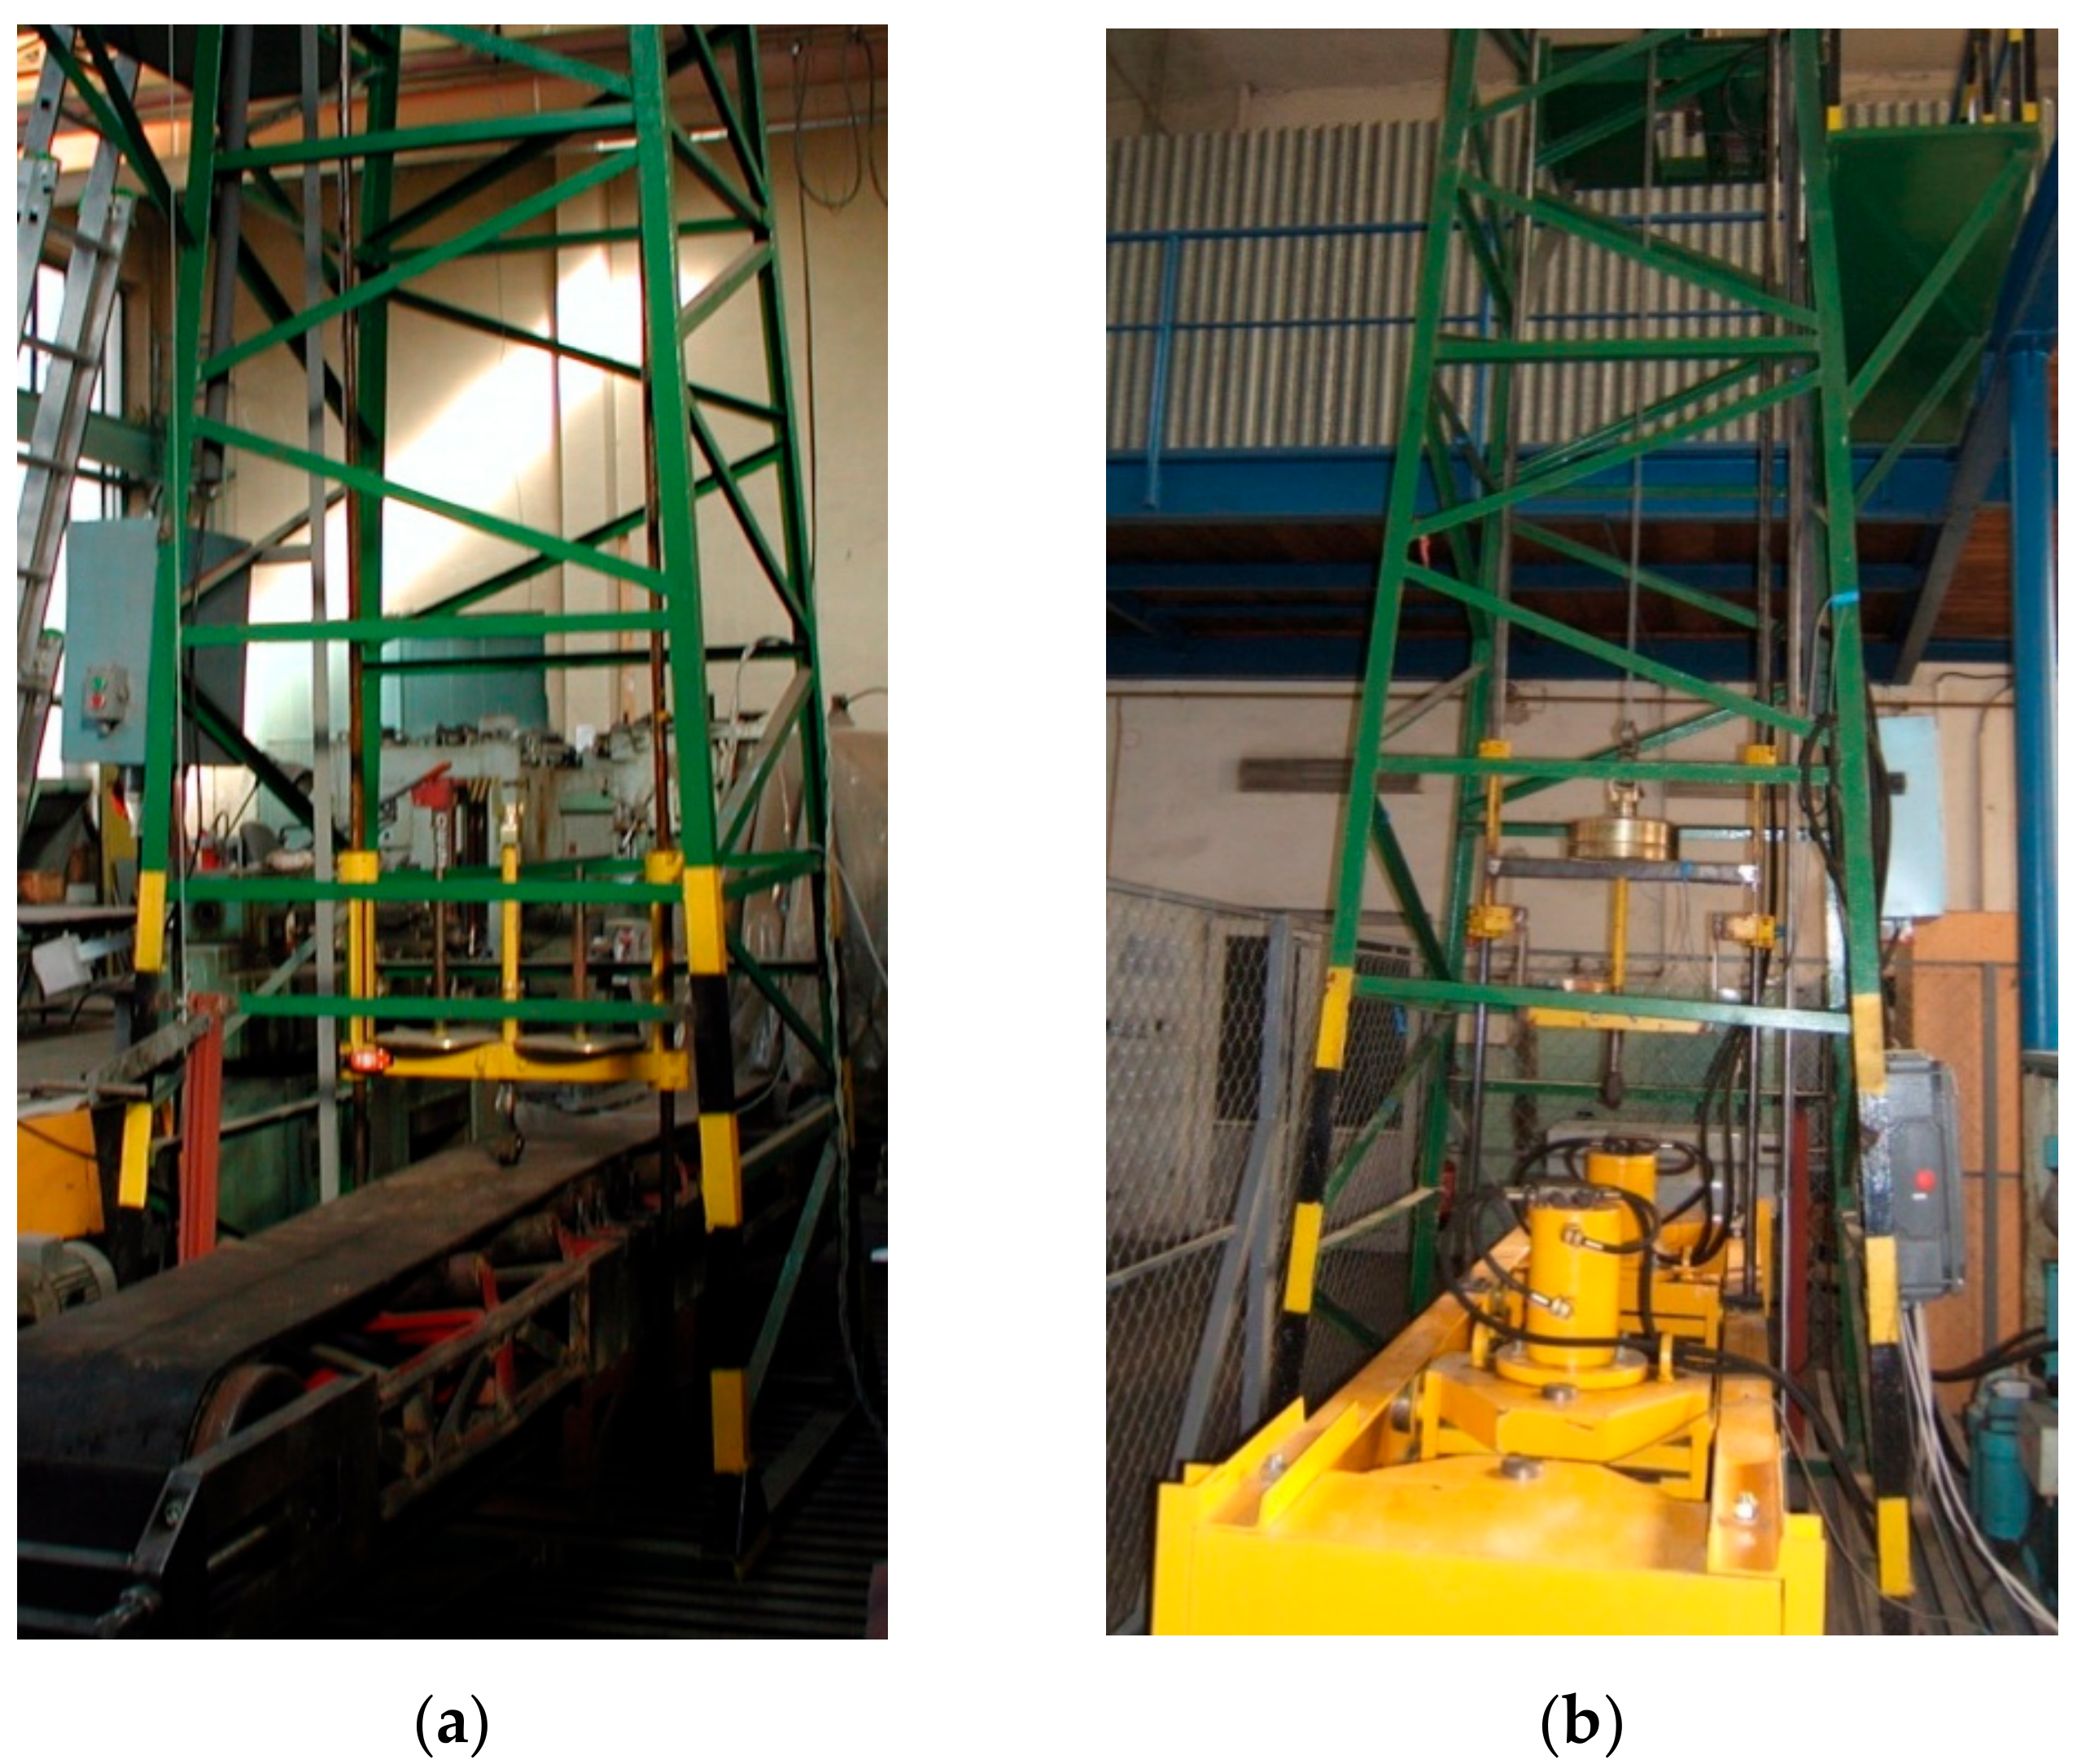
In 2006, innovations were made to the test equipment (Figure 4a) to reduce the length of the test specimen from 10 m to approximately 1.5 m. Another reason for the innovation was to facilitate a more accurate setting of the tensile force for the conveyor belt. Prior to the innovation, the stretching was rigid, using a screw. The innovation of the equipment consisted in adding hydraulic jaws (Figure 4b), which facilitate fixation and stretching of a belt specimen while applying an adjustable force. The jaws replaced the previously used belt conveyor. The tower design remained unchanged—latticed—and the drop hammer lifting winch was not eliminated from the platform; together with a free and fixed pulley, it forms the pulley block of the tower.

2.2.3. Experiment Methodology

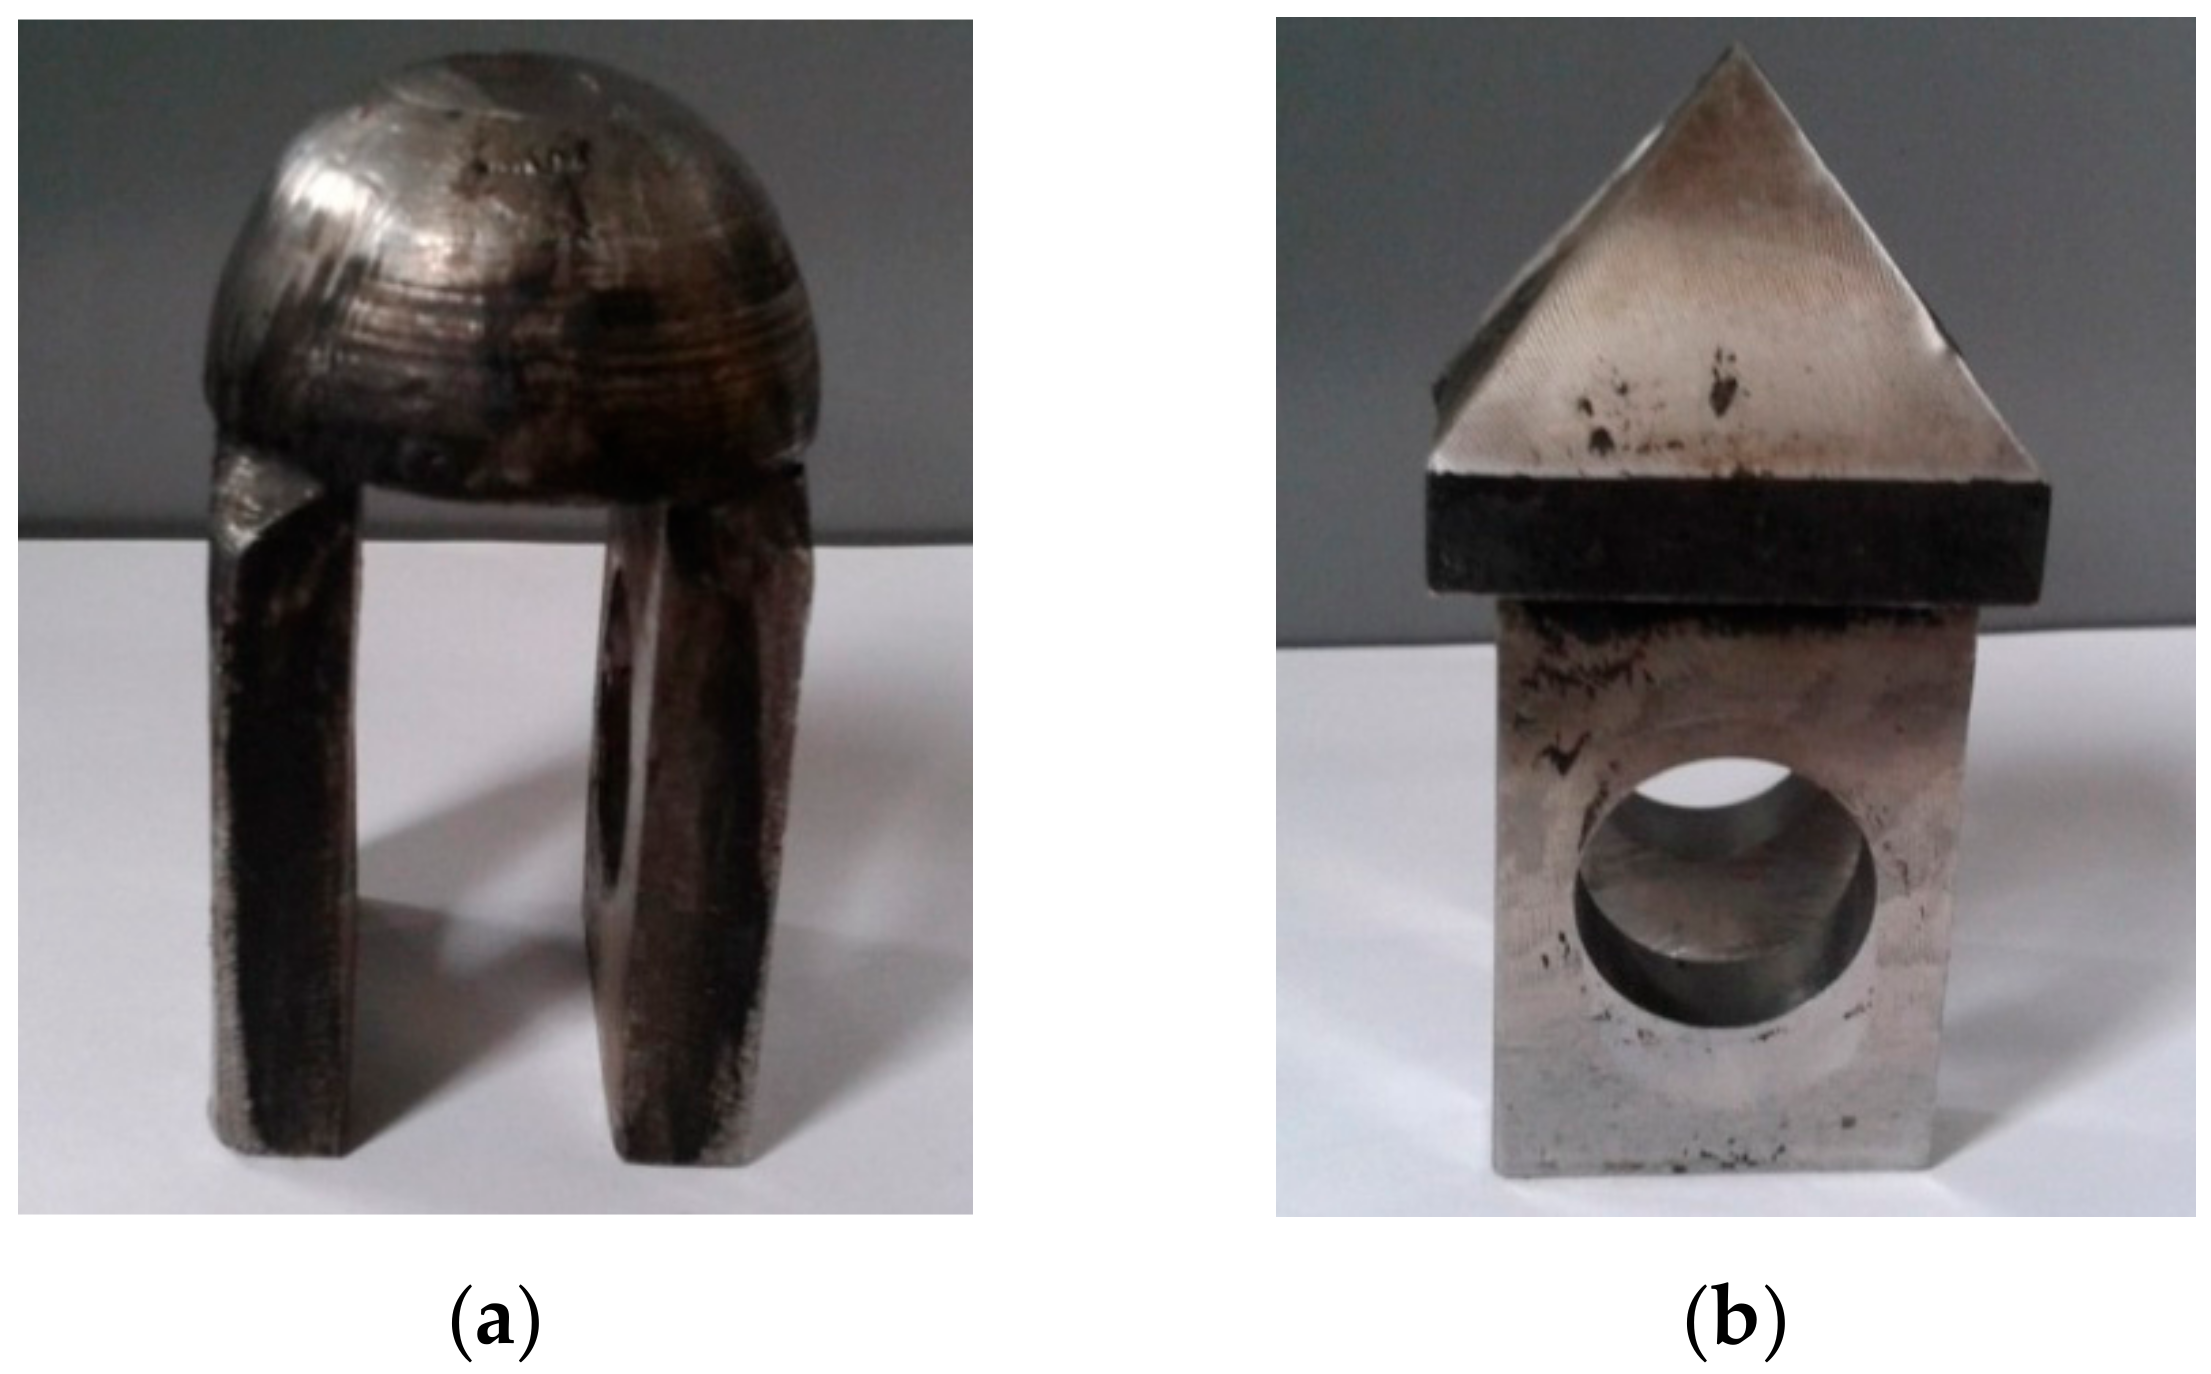
During the testing, the drop hammer with a semi-spherical impactor of the diameter of 25 mm (Figure 5a) or a pyramidal impactor with the base size of 50 × 50 mm (Figure 5b) was lifted by the pulley block to the selected height from which it is dropped in a free-fall onto the tested 1.2 m long conveyor belt specimen. The maximum weight of the drop hammer, including additional calibrated weights, was 105 kg, and the maximum drop height of the drop hammer was 2.6 m. The impact energy was changed by changing the drop height [24].
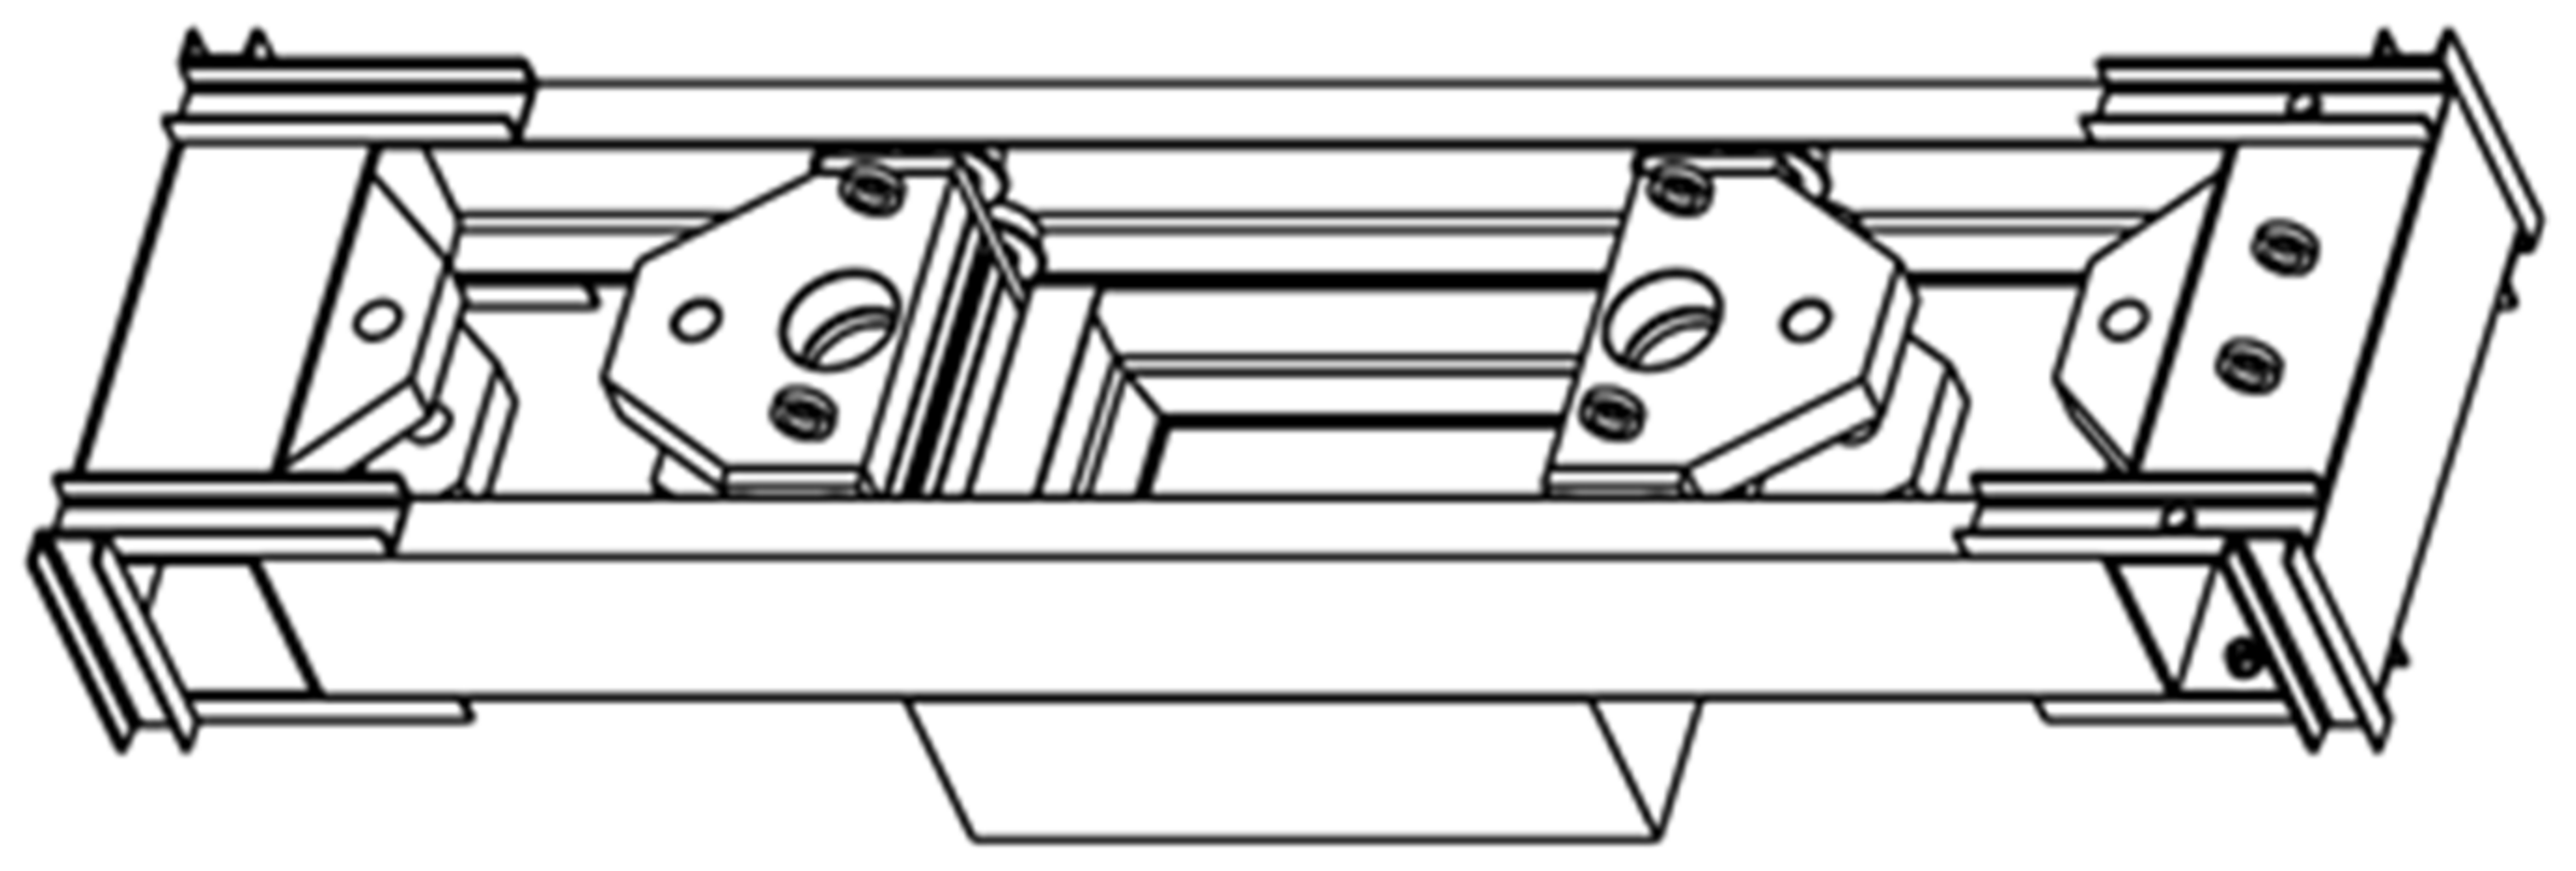
The belt specimen was stretched in hydraulic jaws (Figure 6) while applying the force corresponding to 1/10 of the nominal strength of the belt, which represents the allowed load to which the conveyor belt may be exposed during the operation. Using 2 tensometric sensors, the magnitude of the tensile force FN was measured (accuracy of ±500 N) and the magnitude of the impact force FR (accuracy ±30 N). Drop heights were measured using the L-GAGE LT3 Long-Range Time-of-Flight Laser Sensor, which measures lengths in the interval from 0.3 to 5 m using a 90% whitecard. During the entire measurement, the measured data were recorded using the PP065 electronics, which also comprised a programmable control panel with analogue and digital inputs and outputs and a serial communication channel. The channel may be used not only as a transducer but also as a small control panel. The output of the software processing the recorded values was a text file containing the times t (ms), drop heights h (mm), tensile force magnitudes FN (kN) and impact force magnitudes FR (kN), while each line of the file represented the values of these parameters measured during the testing. In one measurement cycle lasting 10 s, 10,000 values were recorded for each of the above-listed parameters at 1000 Hz.
After the testing, the conveyor belt damage degree was visually assessed, and the impact force magnitude at the moment of the impact was identified in order to examine the concurrence between the impact force magnitude and the conveyor belt damage. This was carried out using available mathematical, physical and statistical procedures. The measured values were used to identify the time course of the entire measurement.
The weight of the drop hammer was 50 kg, and it was changed in each measurement within a range from 60 to 100 kg. The drop height of the drop hammer was gradually elevated from 0.6 m to 2.6 m for each tested weight. The testing was carried out in two alternatives: with the support system—an idler set; and without the support system. The shape of the impactor was a pyramid, simulating the impact of a sharp-edged material.

3. Results and Discussion

The tests were carried out with and without the support system and at drop hammer weights of 60, 80, 90 and 100 kg. The drop hammer was dropped onto the conveyor belt from the maximum height of 2.6 m. A puncture of the belt was observed when the drop hammer weighing 80 kg was dropped from the height of 1.8 m, when the drop hammer weighing 90 kg was dropped from the height of 1.6 m and when the drop hammer weighing 100 kg was dropped from the height of 1.6 m. In testing without the support system, the impact loading lasted longer than in testing with the support system. At the drop hammer weight of 90 kg, the impact loading without the support system lasted 0.98 s to 3.36 s. At the drop hammer weight of 100 kg, the impact loading without the support system lasted 0.9 s to 3.74 s. In testing without the support system, the puncture did not occur, not even at the maximum height of 2.6 m. When the idler set (support system) was used, at the drop hammer weight of 90 kg, the impact loading lasted 0.62 s to 1.82 s, and at the drop hammer weight of 100 kg, the times were similar, i.e., from 0.62 s to 1.92 s. In both cases of the impact loading of the conveyor belt using the support system, the puncture occurred at the drop height of 1.6 m. At the weight of 90 kg, the idler set reduced the impact process duration to 0.3 s to 1.54 s. At the weight of 100 kg, the idler set reduced the impact process duration to 0.16 s to 1.82 s.
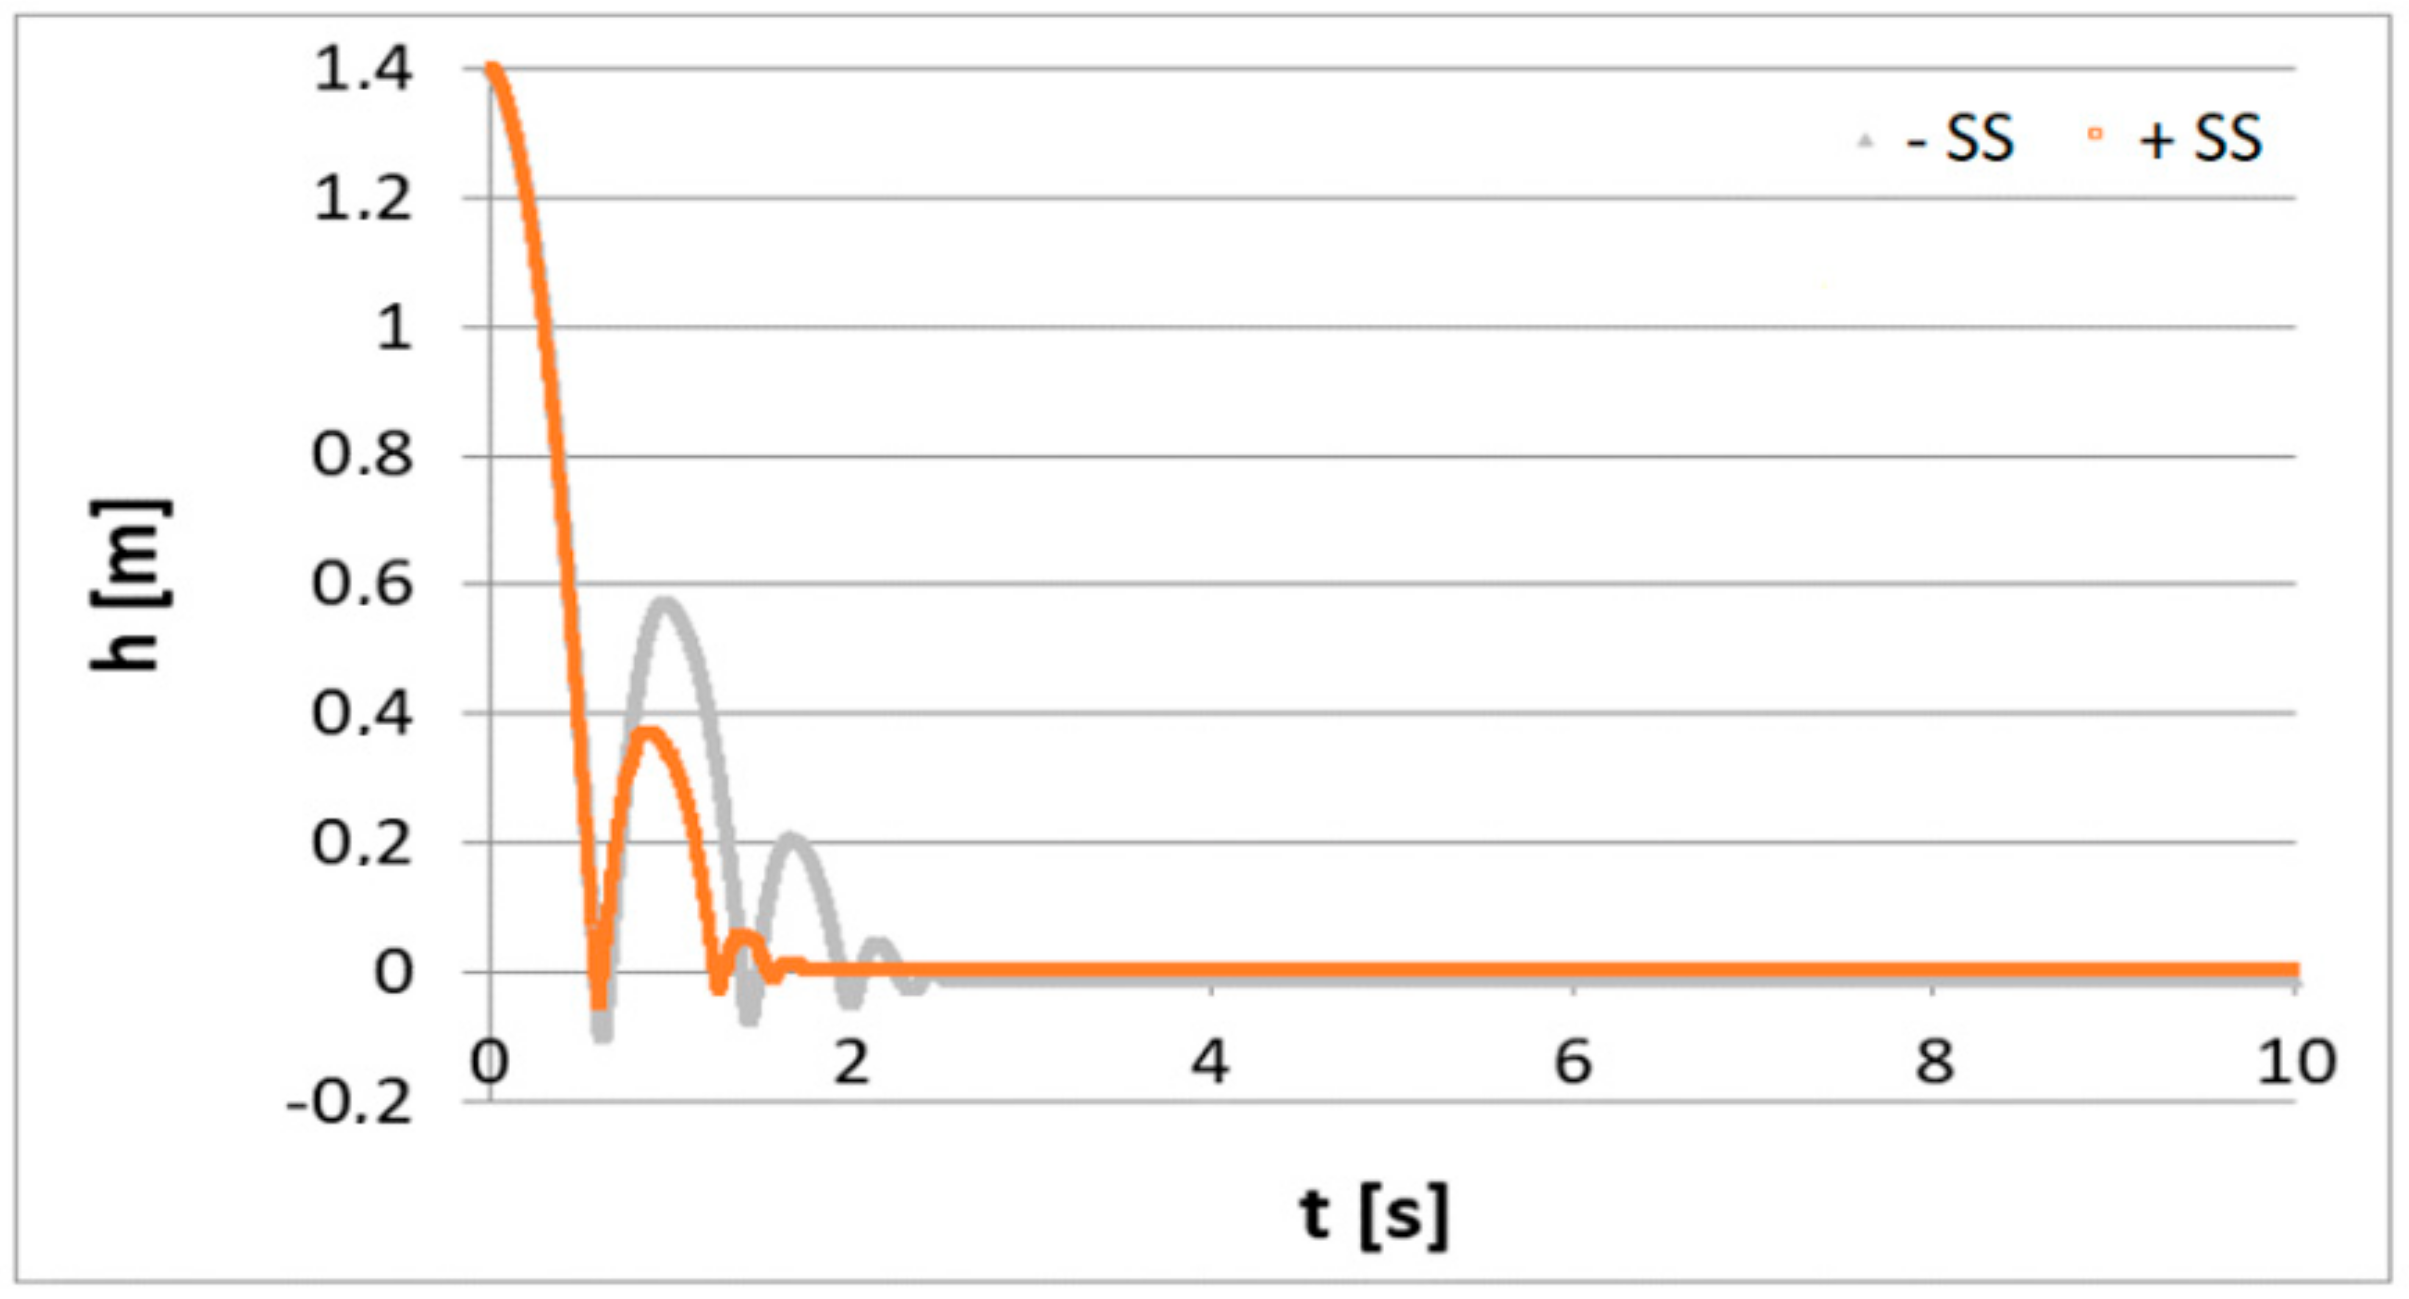
In both cases, the drop hammer weighing 90 kg was dropped onto the belt from the height of 1.4 m. The impact with the use of the support system lasted less time than without the support system. With the support system, it lasted approximately 1.8 s, and without the support system, it lasted more than 2 s. The drop hammer weight was identical in both cases. At the impact loading with the idler set, the puncture of the belt occurred when the drop hammer was dropped from the height of 1.6 m, and without the idler set, the puncture did not occur at all.
Figure 7 shows the comparison of the impact duration without and with the support system when the drop hammer was dropped from the drop height of 1.4 m and with a weight of 90 kg. The comparison indicates that the support system reduced the impact duration, as the idler set prevented the conveyor belt specimen from bending and hence absorbed the impact energy. Without the support system, the belt specimen was free to bend, and due to different bumping effects, the impact lasted longer.
The first contact between the drop hammer and the tested specimen and the subsequent decay of the impact process are shown in Figure 8. At the impact loading with the support system, at the first contact between the drop hammer and the belt specimen, the impact force was higher than without the support system, as the idler set absorbed the effects of the impact. Without the support system, the decay of the impact force lasted longer than in the testing carried out with the support system.
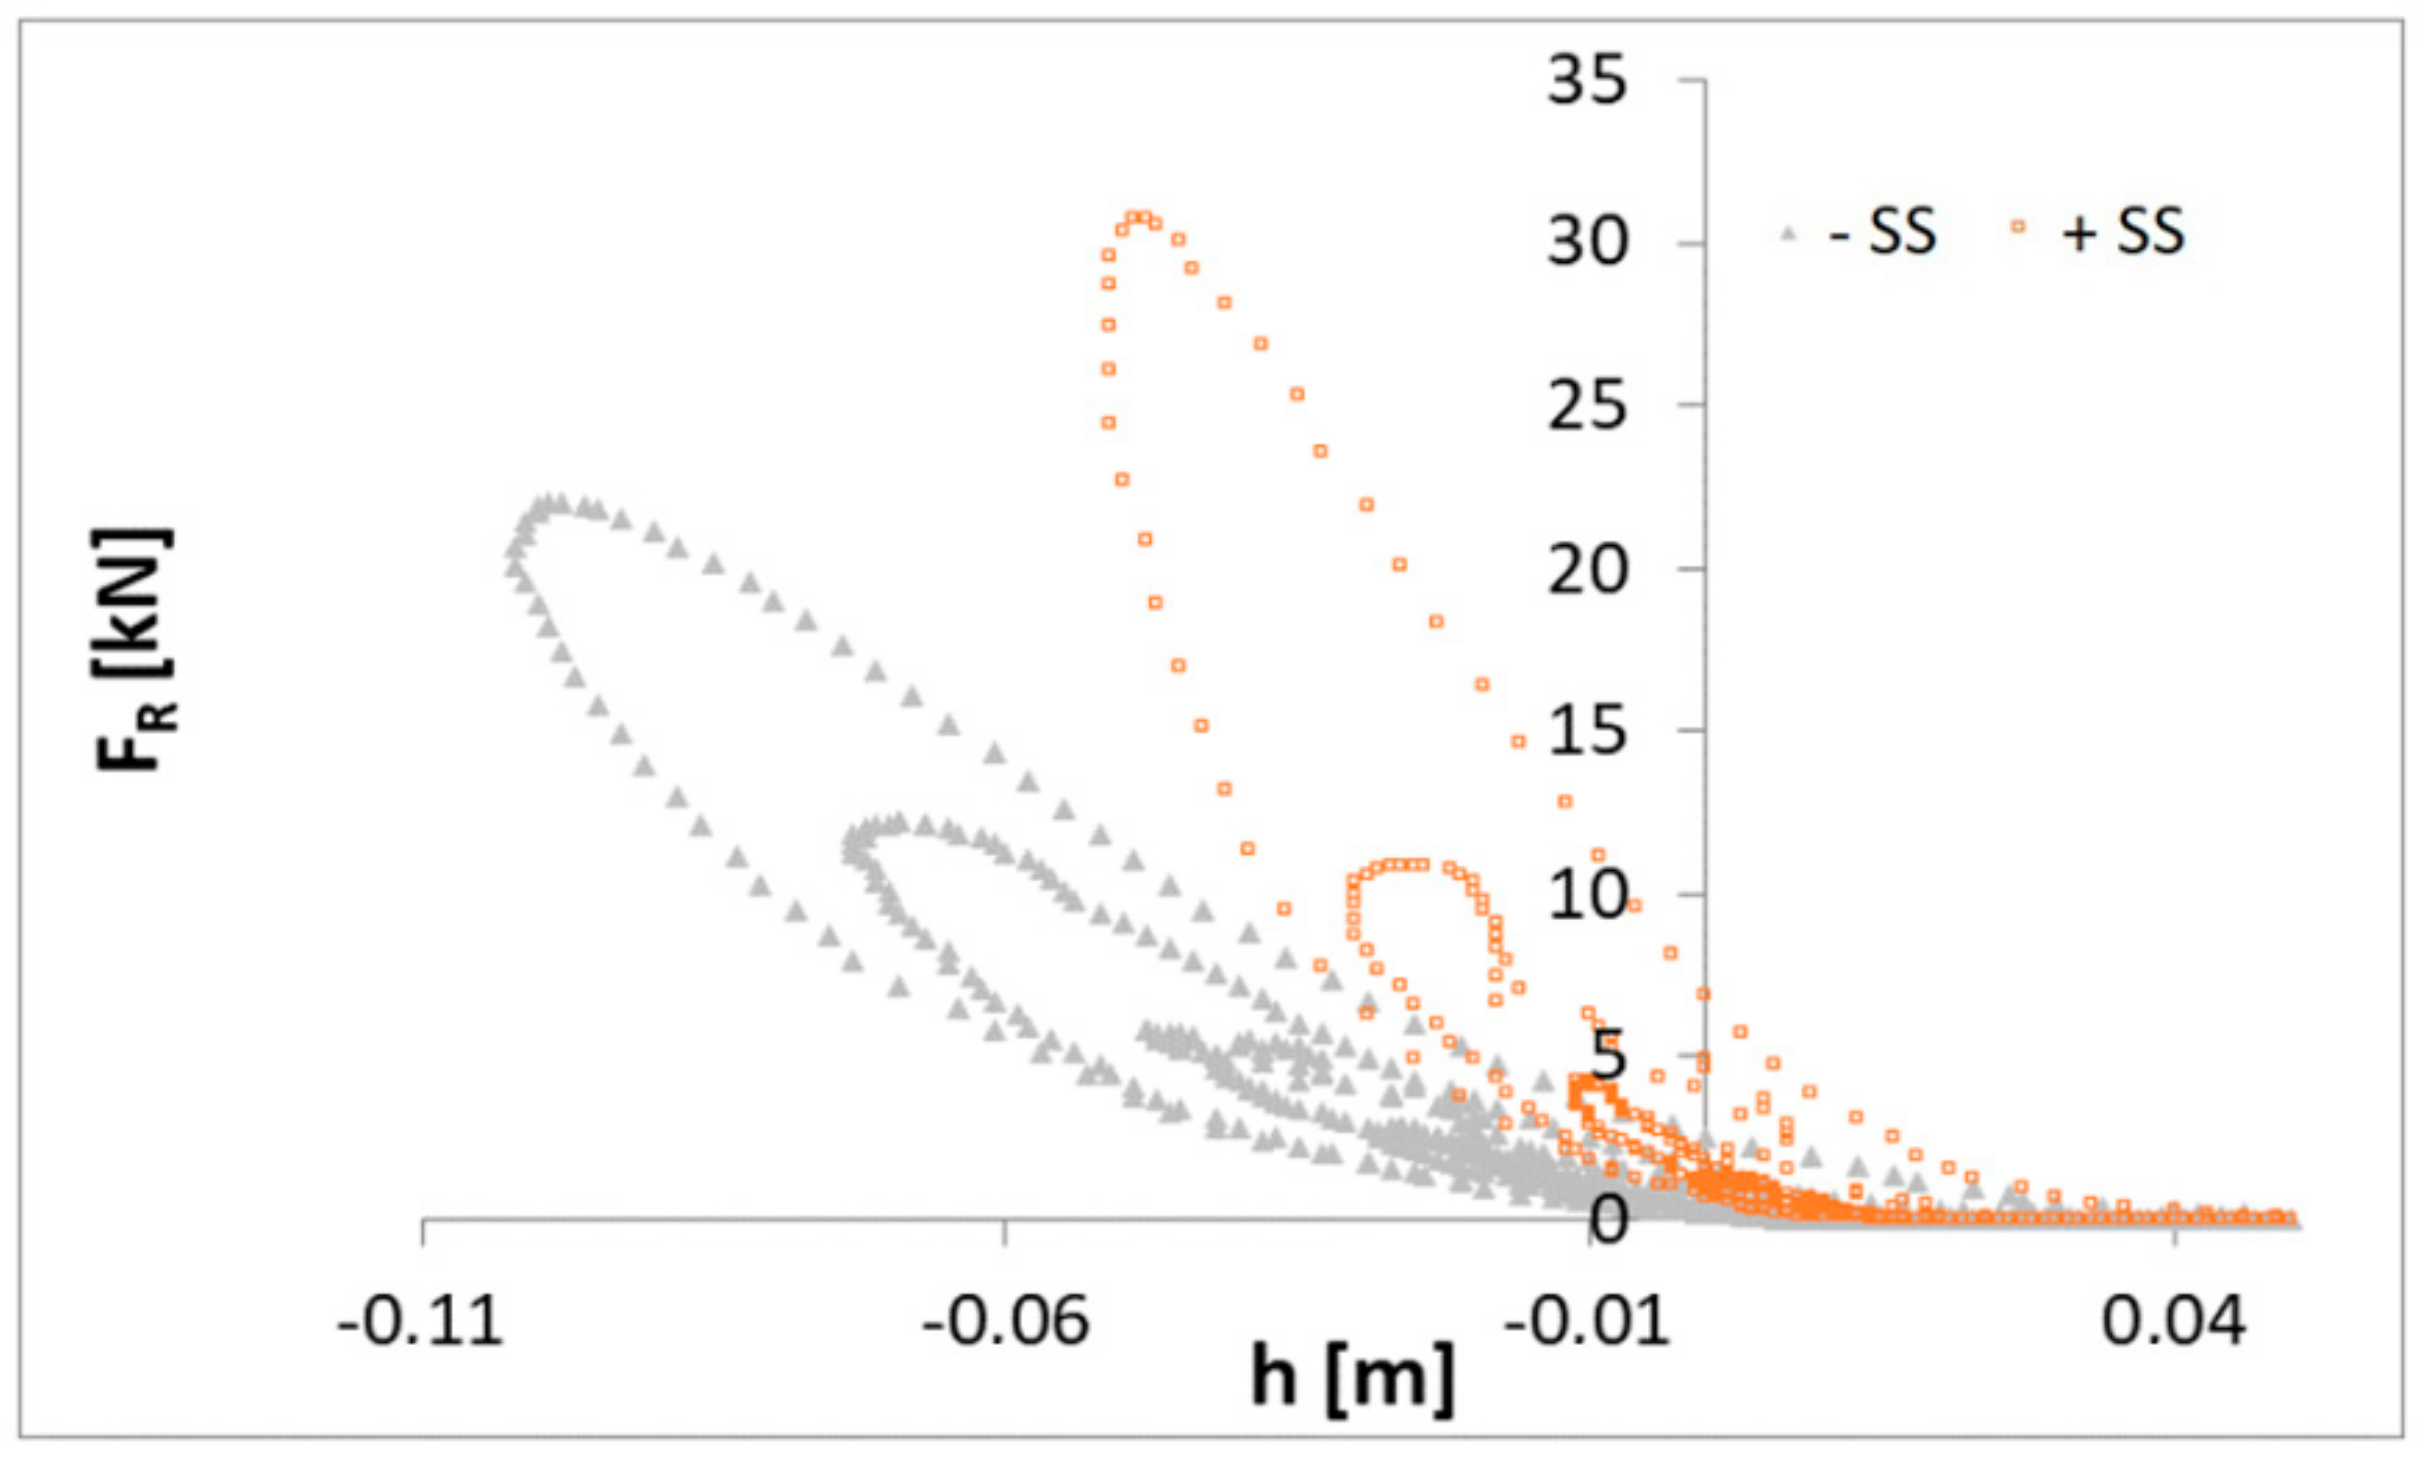
Figure 9 shows the correlation between the impact force and the height; at the impact loading without the support system, there are larger height variations than in cases when the support system was used, because the tested belt was not supported. The figure shows the changes in the impact force and the height when the drop hammer contacted the tested specimen. The impact force and height increased, reached their peaks and then decreased.
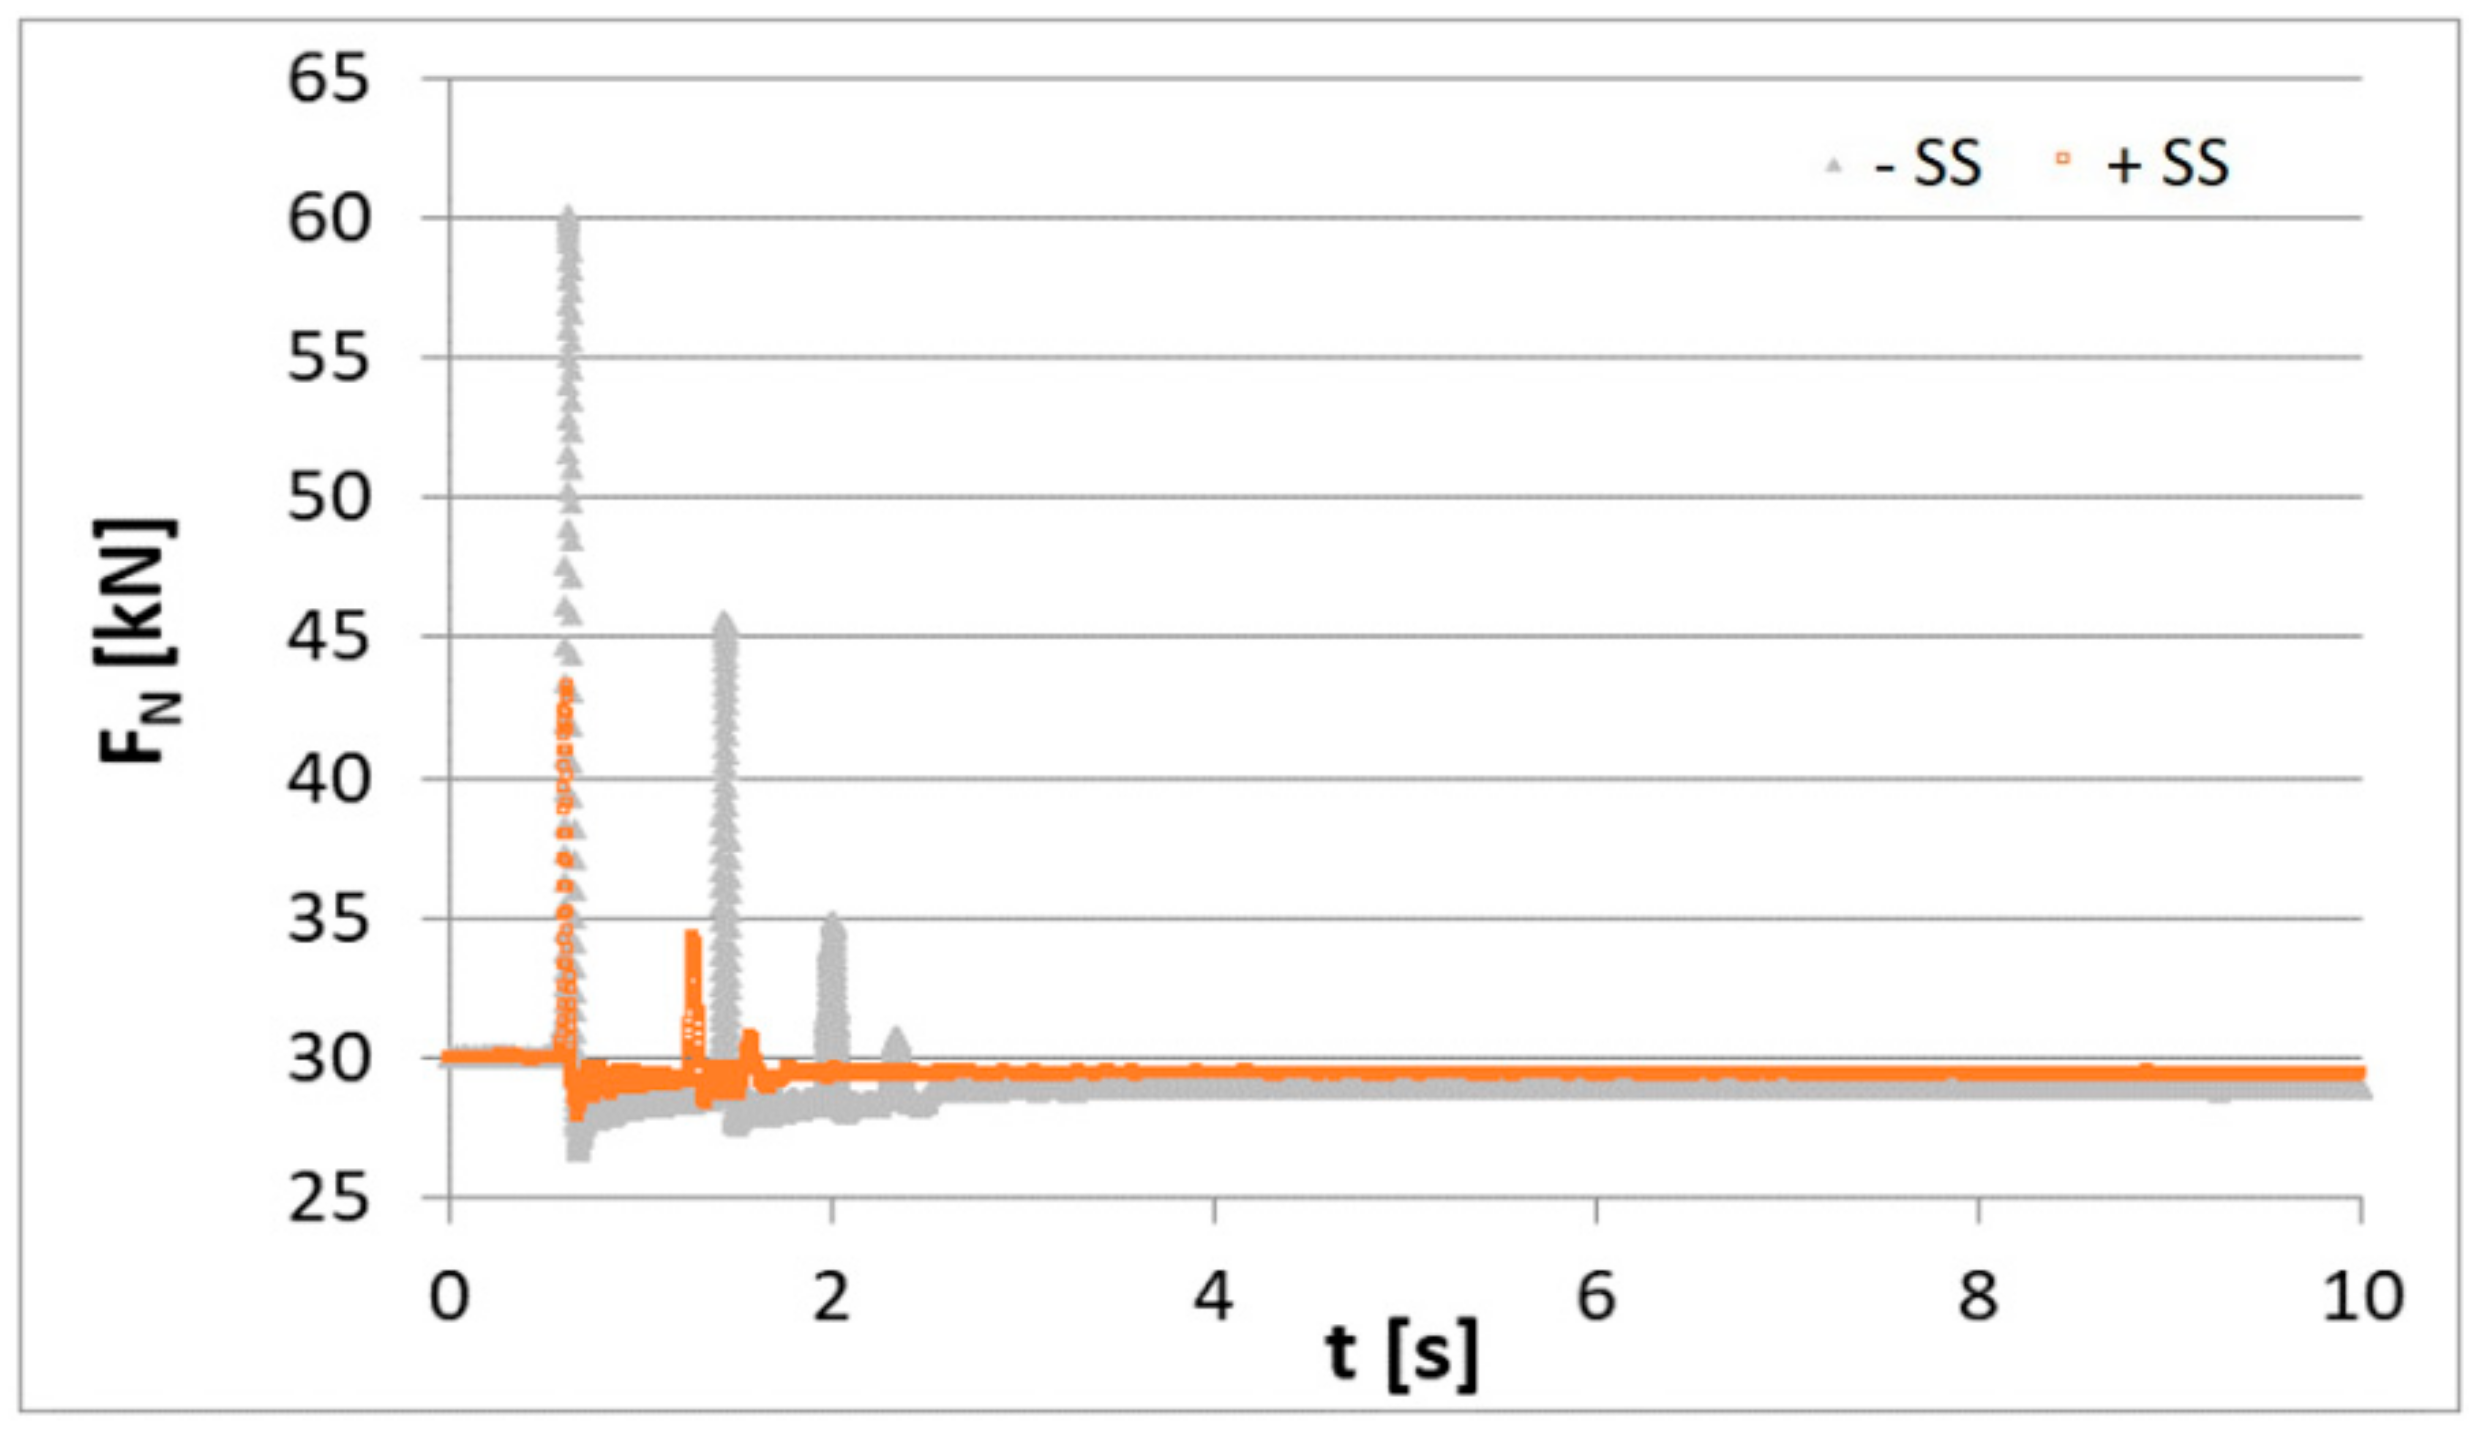
Figure 10 shows the influence of the support system on the correlation between the tensile force and the time. When the support system was used, the tensile force was lower, and its decay lasted less time than under the impact loading without using the support system; in the latter case, at the first contact between the drop hammer and the specimen, the tensile force was the highest and reached its peak and subsequently decreased.
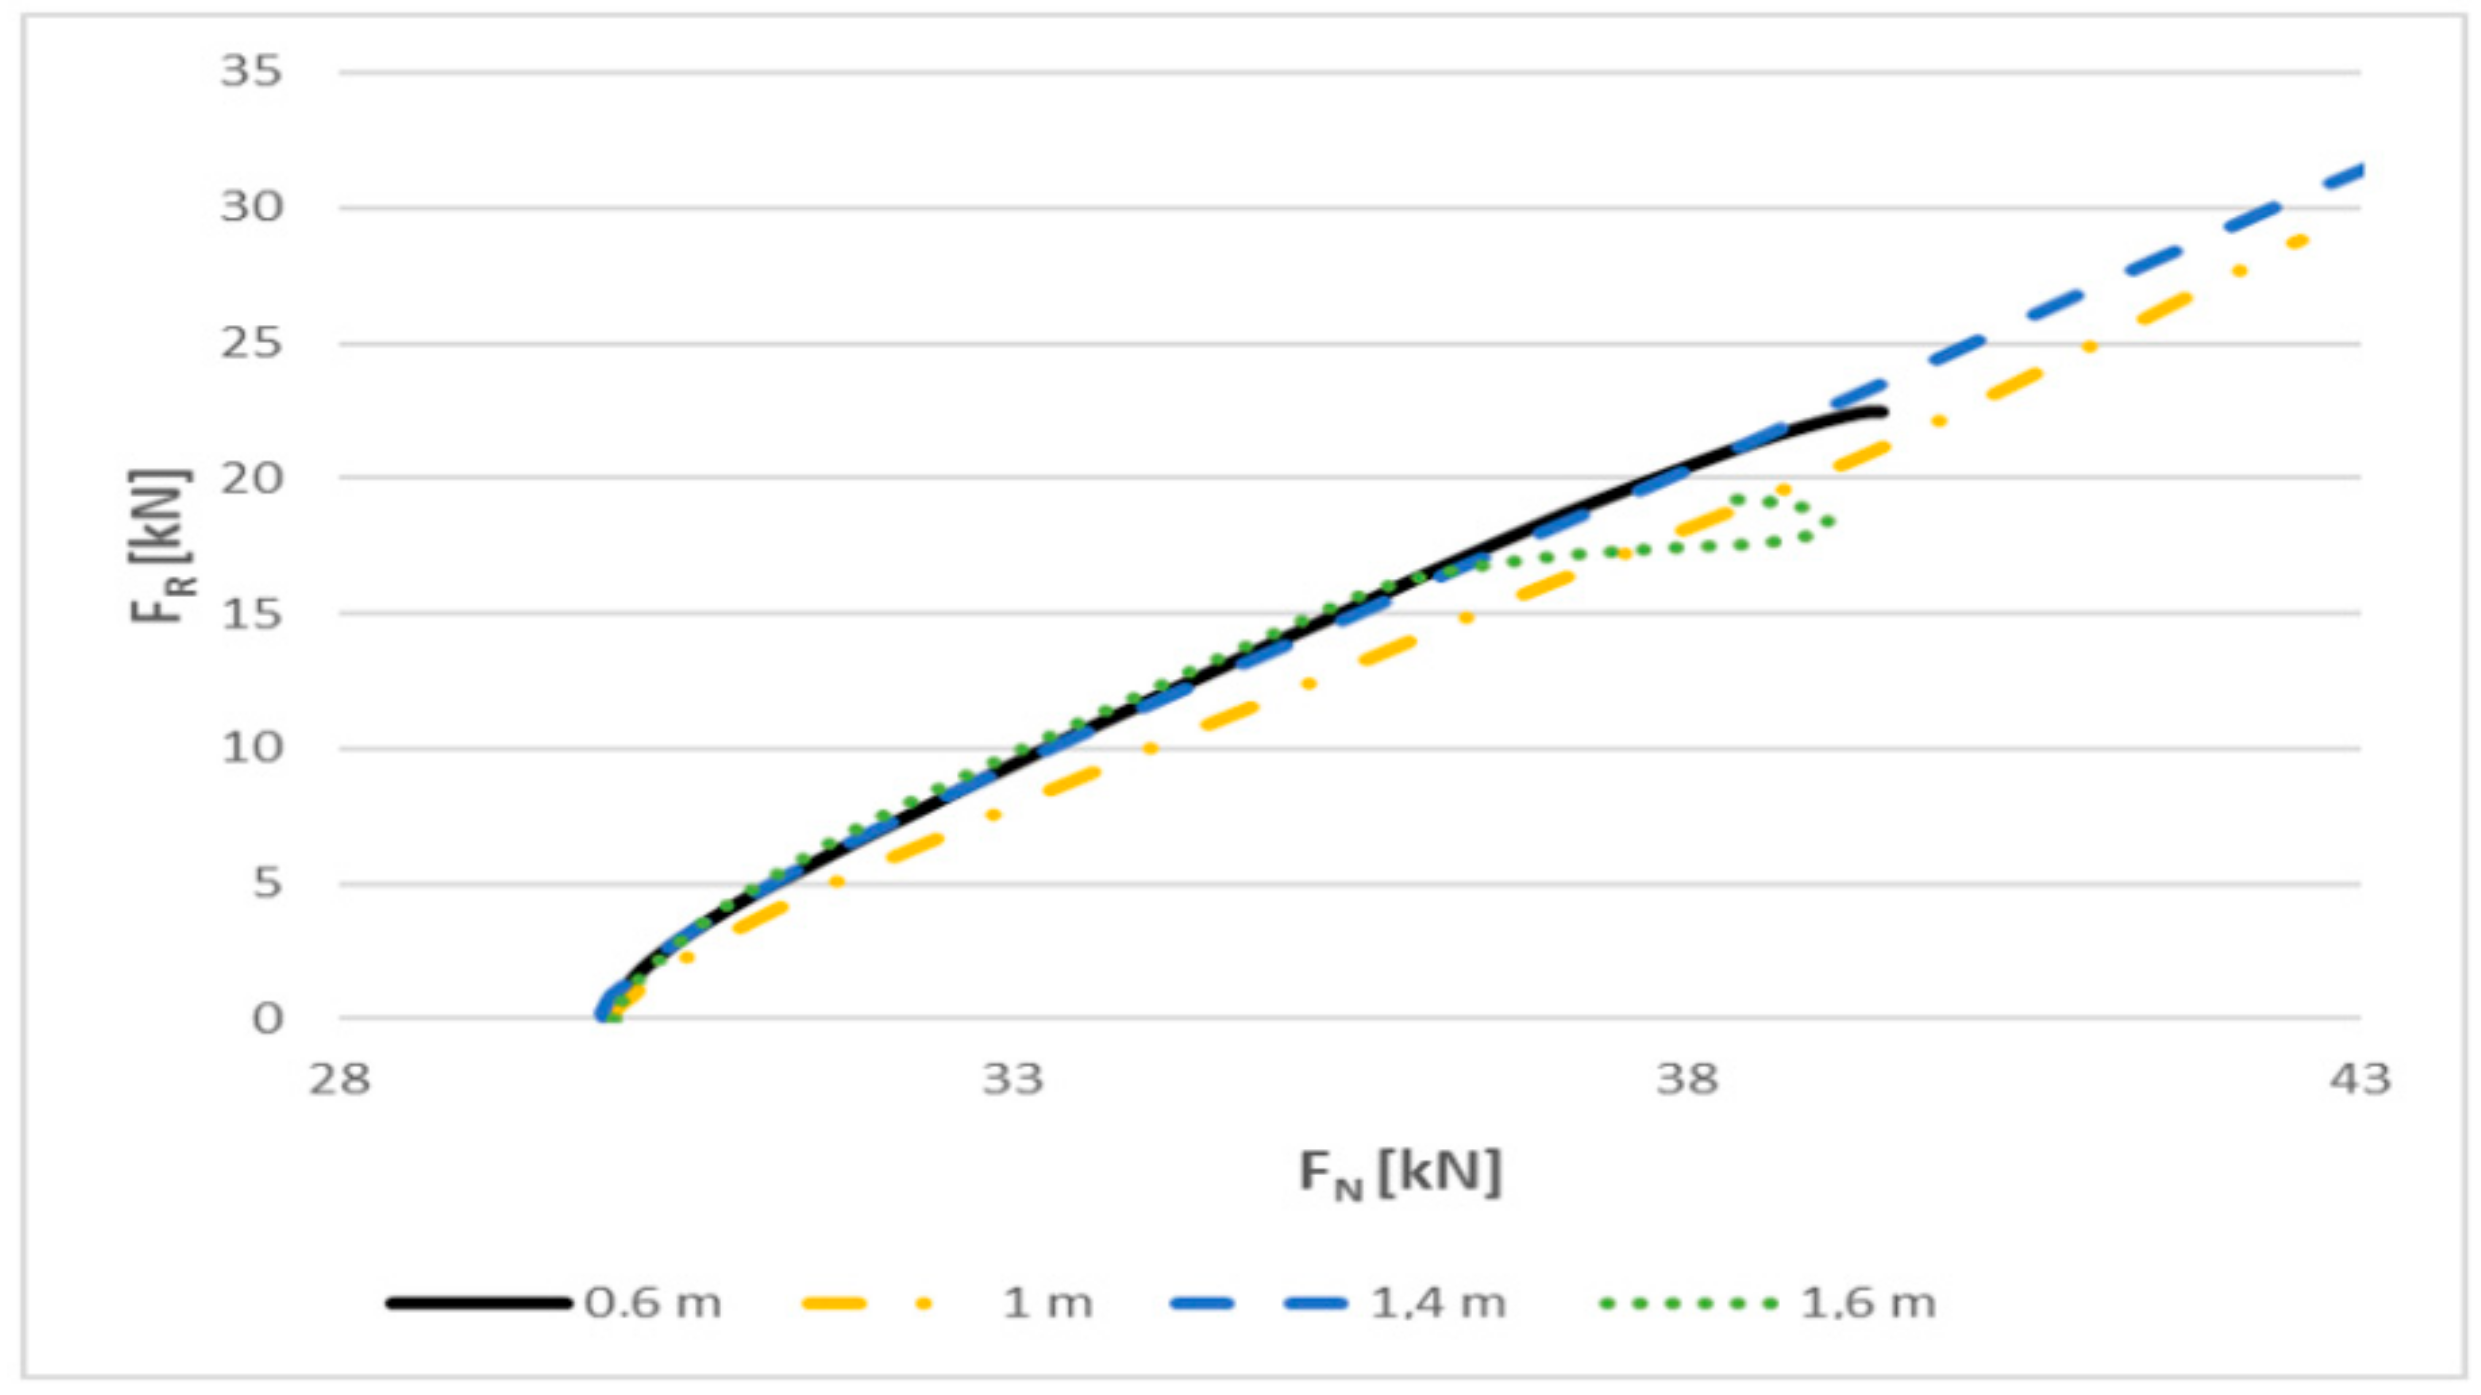
Figure 11 shows the correlation between the impact force and the tensile force and indicates that as the impact force increased, the tensile force increased as well. When the support system was used, the impact force was higher and the tensile force was lower, and in the absence of the support system, the opposite was the case. The correlation between the impact force and the tensile force when the support system was used exhibits a steeper slope than without the support system.

3.1. Correlation between the Impact Force and the Drop Height

To identify the correlation between the impact force and the drop height, the experimentally measured data were evaluated with the method of mathematical regression. In the analysis of conveyor belt damage caused by the falling material described in paper [31], polynomials were used as the most appropriate ones for the impact process. The correlations were described by applying the functions selected based on the value of the coefficient of determination. The data were evaluated and processed, and specific parameters of the tested puncture resistance were selected for the relevant documentation.
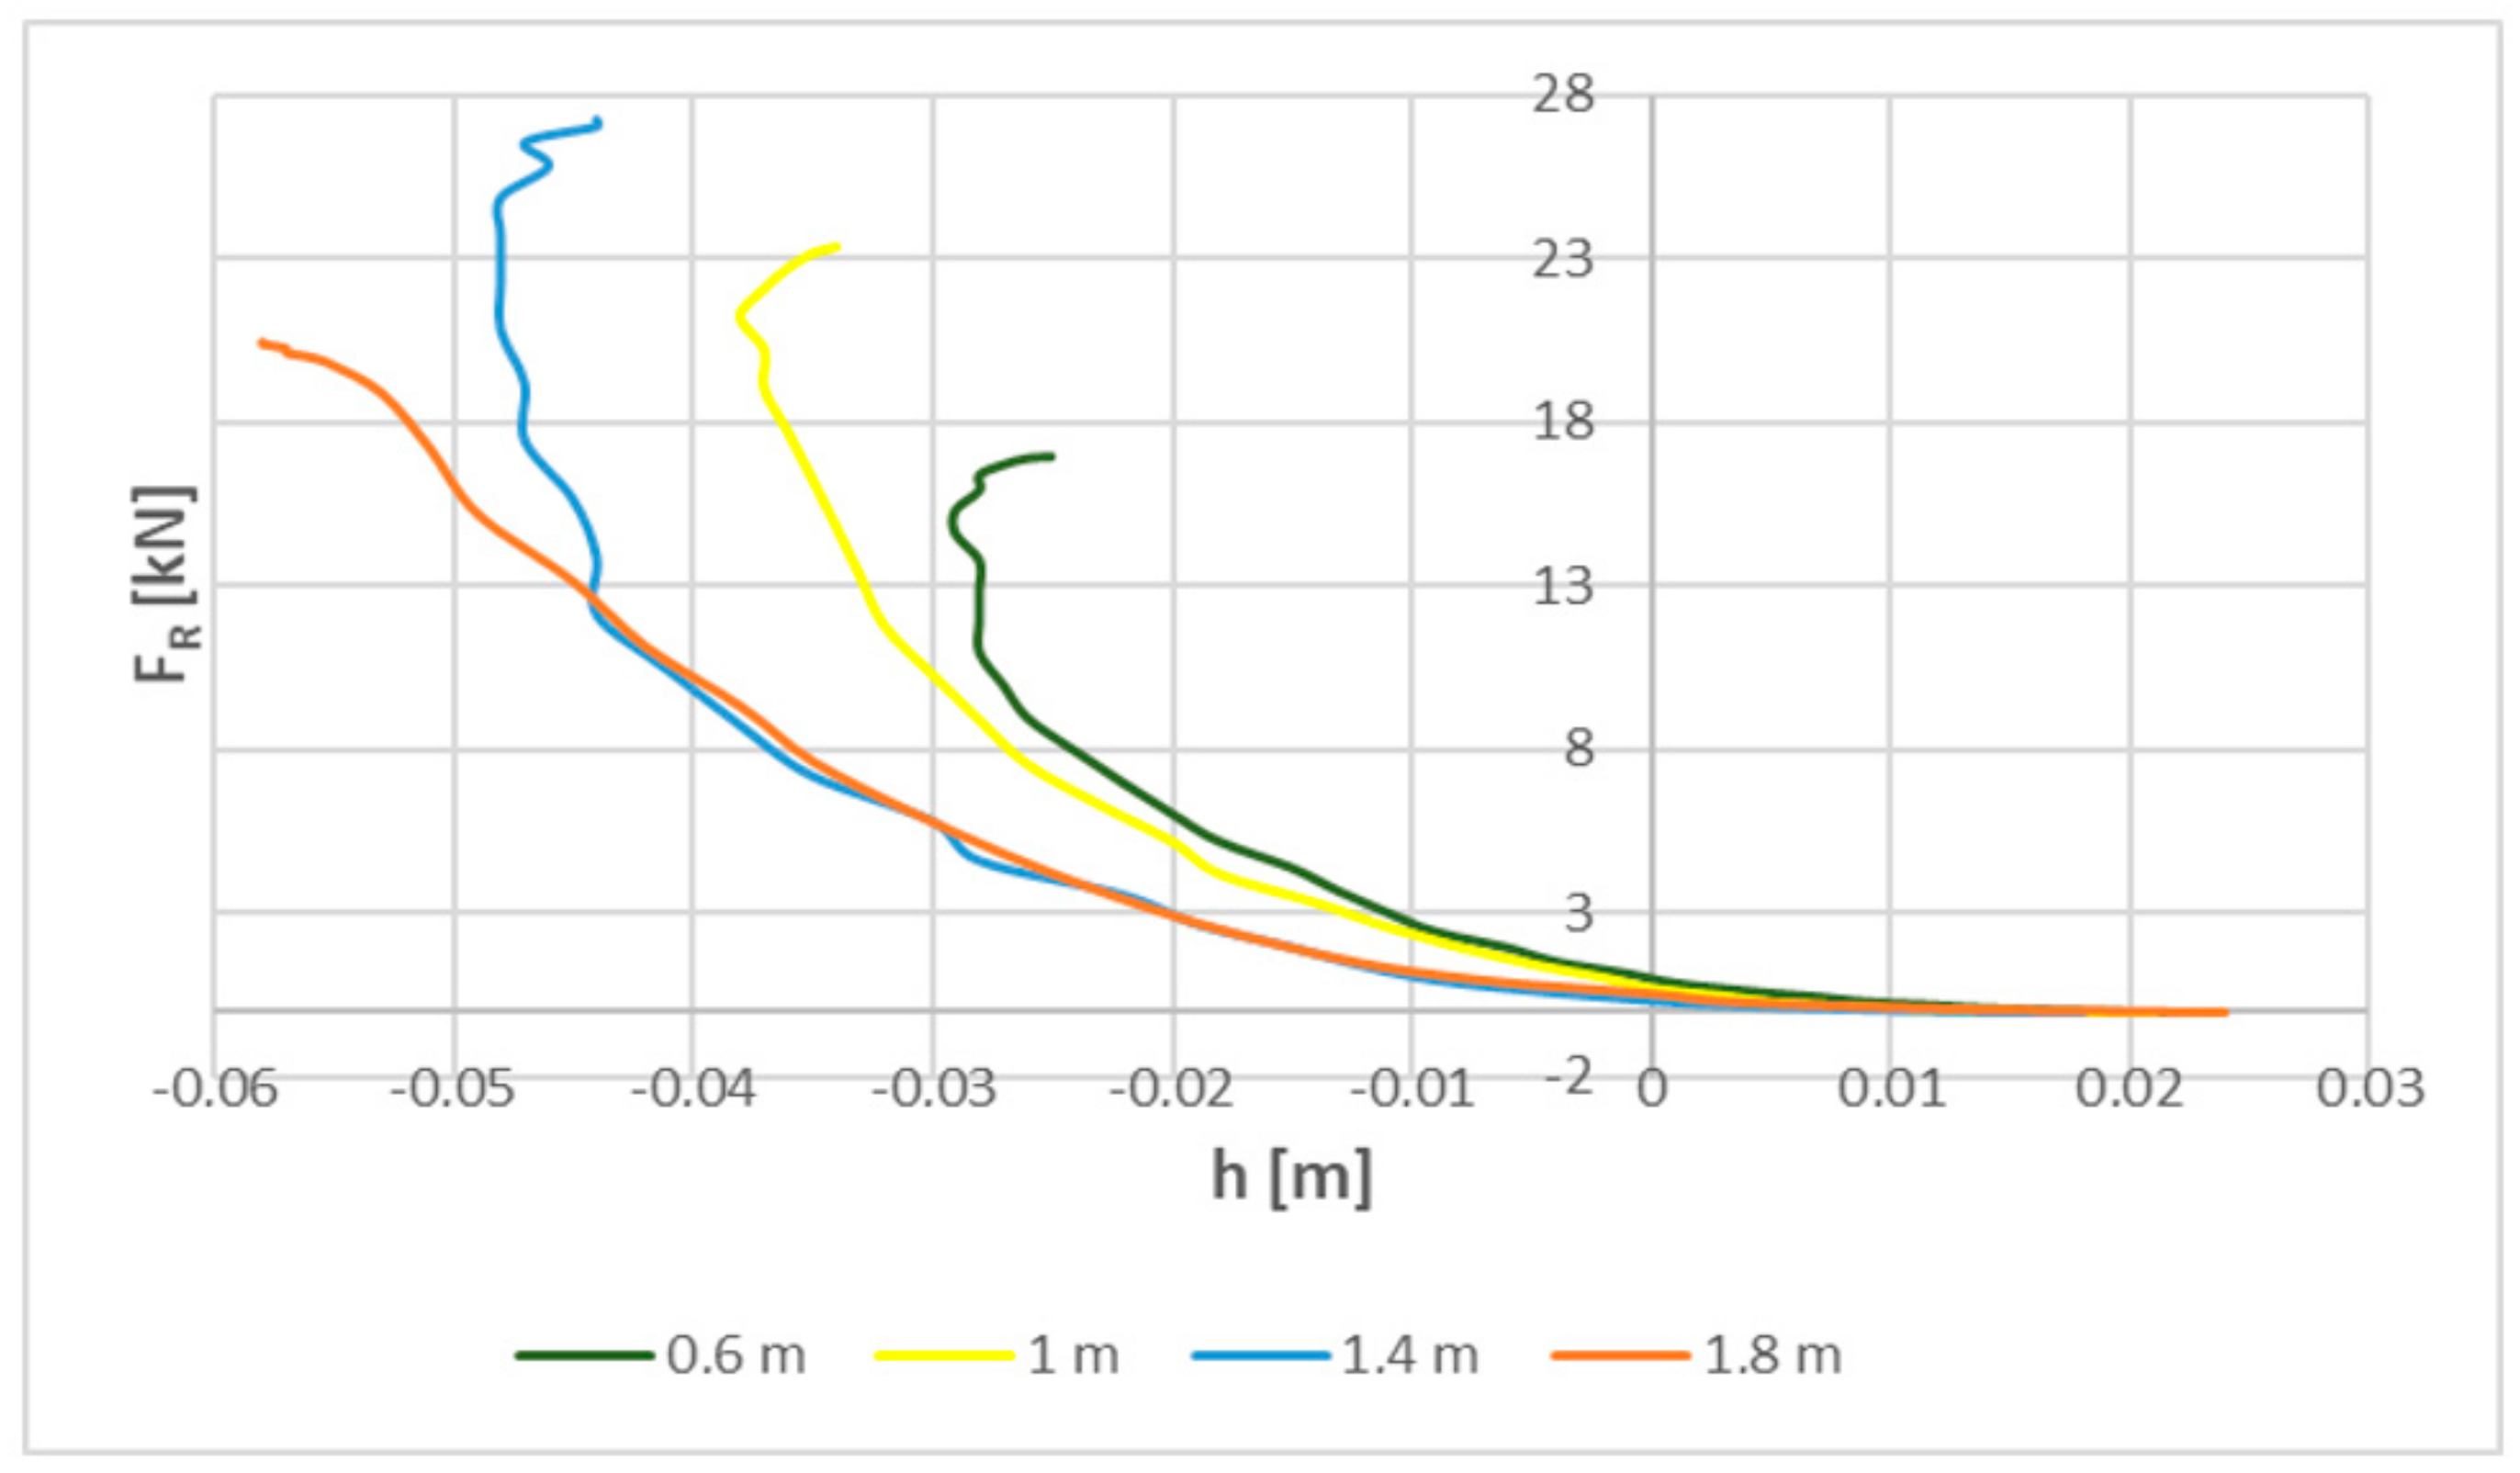
With regard to the correlation between the impact force and the height at the drop hammer weight of 100 kg and the drop height of 1.6 m (Figure 12), under the impact loading with the support system, the puncture of the belt occurred (orange data series in Figure 12). In this case, the correlation was described using a 4th-degree polynomial on the basis of the elevated value of the coefficient of determination R2. In the absence of the support system and with identical test parameters, the puncture did not occur, and such correlation was described using the exponential function on the basis of the elevated value of the coefficient of determination R2.
The correlations between the impact force and the height at the drop hammer weight of 100 kg and the drop height of 1.4 m (Figure 13) are described using more appropriate exponential functions, while the coefficient of determination R2 achieved higher values than for the correlations with the 4th-degree polynomial.

3.1.1. Use of the Support System

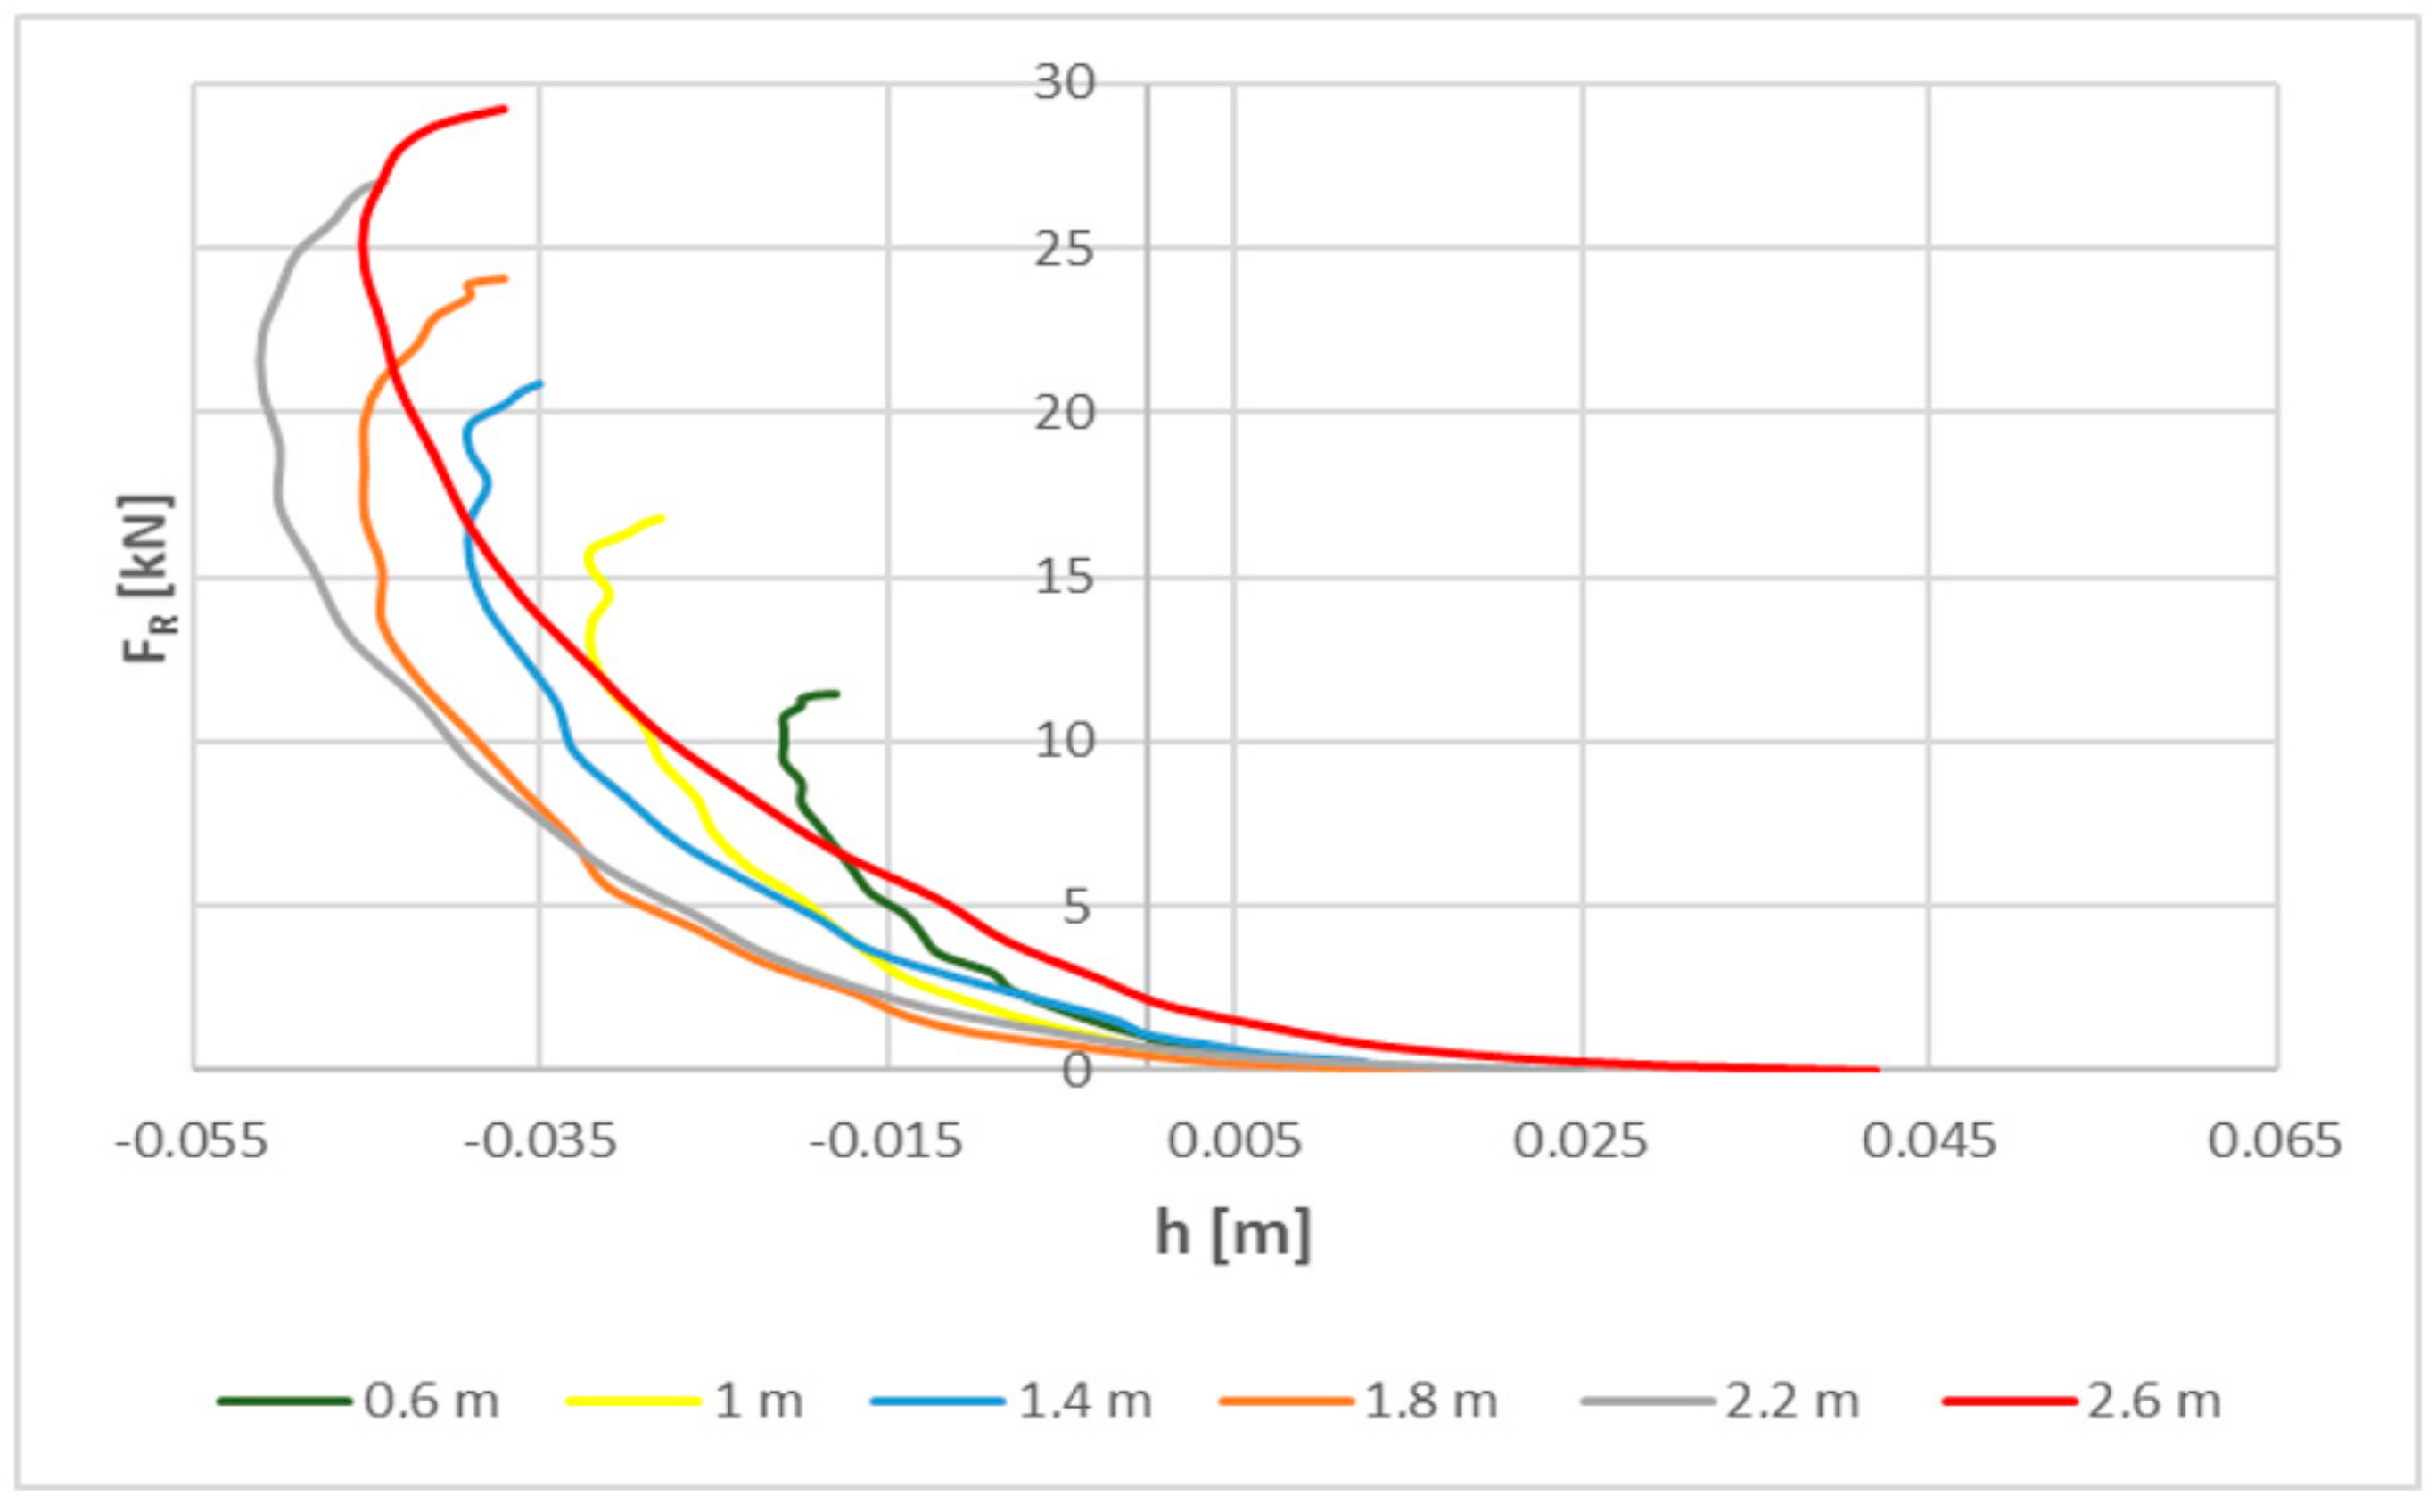
The curves of the impact process for the correlation between the impact force and the height at the drop hammer weight of 60 kg and with the use of the support system (Figure 14) indicate that as the drop height increased, the impact force increased too. An increase in the impact force with an increasing height in the monitored correlations exhibited similar behaviour.
The regression equations obtained from the evaluated correlations, including the coefficient of determination R2, are listed in Table 1.
The curves of the impact process for the correlation between the impact force and the height at the drop hammer weight of 80 kg with the use of the support system (Figure 15) indicate that both the drop height and the impact force increased. In the event of a puncture, the curve takes a smoother shape than at lower heights, and at the end of the curve, there is a sharp increase in the impact force. Similar curves were observed with drop hammer weights of 90 kg and 100 kg.
The regression equations obtained from the evaluated correlations, including the coefficient of determination R2, are listed in Table 2, Table 3 and Table 4.

3.1.2. Absent Support System

It was confirmed that even when the support system was absent, the correlation between the impact force and the drop height for the drop hammer weights of 90 and 100 kg (Table 5 and Table 6) shows that the impact force increased, but its value was lower than when the support system was used; as a result, a puncture did not occur.

3.1.3. Correlation between the Impact Force and the Tensile Force with the Use of the Support System

The curve of the impact process for the correlation between the impact force and the tensile force at drop hammer weights of 60, 80, 90 and 100 kg with the use of the support system indicates that as the drop height increased, the impact force, as well as the tension force, also increased. At the drop height of 1.8 m (weight of 80 kg), the tensile force peak occurred sooner than the puncture, i.e., the maximum impact force. When the carcass was damaged, the tensile force decreased because the carrying puncture of the tested specimen was weaker. The same was also confirmed at the drop height of 1.6 m at drop hammer weights of 90 and 100 kg (Figure 16). The regression equations obtained from the evaluated correlations for drop hammer weights of 60, 80, 90 and 100 kg, including the coefficient of determination R2, are listed in Table 7, Table 8, Table 9 and Table 10. When the support system was used, the correlation between the impact force and the tensile force was described using the 4th-degree polynomial on the basis of higher values of the coefficient of determination than for the exponential function.

3.1.4. Correlation between the Impact Force and the Tensile Force without the Support System

During the impact process in which the support system was absent, the impact force was correlated with the tensile force at the drop hammer weight of 100 kg (Figure 17), no puncture of the tested belt occurred, and the same result was observed with the drop hammer weighing 90 kg. Experiments confirmed that as the drop height increased, both the impact force and the tensile force increased too. Regression equations with the coefficient of determination R2 of the evaluated correlations are listed in Table 11 and Table 12.

4. Conclusions

The tests with impact loading were carried out with and without the support system (the idler set). The experimental investigation confirmed that the support system reduces the duration of the impact; in particular, this means that tests without the support system lasted longer. During the testing of the rubber composite (conveyor belt) without the support system, no puncture occurred, not even at the maximum drop height of 2.6 m. When the support system was used, the puncture occurred at the drop hammer weight of 80 kg at the drop height of 1.8 m, and at the drop hammer weights of 90 and 100 kg at the drop height of 1.6 m. At the first contact between the drop hammer and the belt, the impact force was higher when the support system was used than when it was absent, but the decay of the impact lasted longer than when the support system was absent. For the correlation between the impact force and the height without the support system, there were more significant height variations than with the use of the support system. When the support system was used, the tensile force was lower, and its decay was shorter than in tests without the support system. At the first contact between the drop hammer and the belt specimen, the tensile force reached its peak and then decreased. When the idler set was used, the impact force was higher and the tensile force was lower, but in the absence of the idler set, the opposite was the case.
The correlation between the impact force and the tensile force when the support system was used exhibits a steeper slope than when it was absent. The correlation between the impact force and the height for the tested belts, determined by the regression analysis, is described using the 4th-degree polynomial, and the belts were punctured under the impact loading (80 kg/1.8 m; 90 kg/1.6 m; and 100 kg/1.6 m). In all the remaining evaluated tests in which the belt was not punctured, the correlation between the impact force and the height was described using the exponential function, because the coefficients of determination reached higher values than when the 4th-degree polynomial was applied. The regression analysis of the correlation between the impact force and the tensile force confirmed that the best alternative was the 4th-degree polynomial for all the evaluated cases, i.e., conveyor belt specimens with or without punctures, which were tested with and without using the support system.
Author Contributions

Conceptualization, Ľ.A.; methodology, Ľ.A. and D.M.; software, Ľ.A.; validation, Ľ.A. and D.M., formal analysis, Ľ.A.; investigation, Ľ.A.; resources, Ľ.A.; data curation, Ľ.A.; writing—original draft preparation, Ľ.A.; writing—review and editing, Ľ.A.; visualization, Ľ.A.; supervision, D.M.; project administration, Ľ.A.; funding acquisition, Ľ.A. All authors have read and agreed to the published version of the manuscript.

Funding

This research was funded by NATIONAL RESEARCH AGENCY OF SLOVAKIA, grant number VEGA 1/0429/18.

Conflicts of Interest

The authors declare no conflict of interest.

References

  1. Ambrisko, L.; Marasova, D.; Knapcikova, L.; Saderova, J.; Cehlar, M.; Khouri, S. Mechanical properties and chemical composition of rubber gaskets. Przem. Chem. 2020, 99, 598–601. [Google Scholar]
  2. Abdelaziz, M.N.; Ayoub, G.; Colin, X.; Benhassine, M.; Mouwakeh, M. New developments in fracture of rubbers: Predictive tools and influence of thermal aging. Int. J. Solids Struct. 2019, 165, 127–136. [Google Scholar] [CrossRef]
  3. Petiteau, J.-C.H.; Othman, R.; Guégan, P.; Le Sourne, H.; Verron, E. Dynamic uniaxial extension of elastomers at constant true strain rate. Polym. Test. 2013, 32, 394–401. [Google Scholar] [CrossRef] [Green Version]
  4. Molnar, W.; Varga, M.; Braun, P.; Adam, K.; Badisch, E. Correlation of rubber based conveyor belt properties and abrasive wear rates under 2- and 3-body conditions. Wear 2014, 320, 1–6. [Google Scholar] [CrossRef]
  5. Szrek, J.; Wodecki, J.; Błażej, R.; Zimroz, R. An inspection robot for belt conveyor maintenance in underground mine—Infrared thermography for overheated idlers detection. Appl. Sci. 2020, 10, 4984. [Google Scholar] [CrossRef]
  6. Cordero, M.J.; Pugnaloni, L.A. Dynamic transition in conveyor belt driven granular flow. Powder Technol. 2015, 272, 290–294. [Google Scholar] [CrossRef]
  7. Andrejiová, M.; Grinčová, A.; Kimaková, Z. Quality assessment of the rubber-textile conveyor belts at the dynamic impact loading. Qual. Access Success 2019, 20, 28–32. [Google Scholar]
  8. Röthemeyer, F.; Sommer, F. Kautschuktechnologie, 2nd ed.; Carl Hanser Verlag GmbH & Co. KG: Wien, Austria, 2006; p. 1080. [Google Scholar]
  9. Manas, D.; Stanek, M.; Manas, M.; Ovsik, M.; Pata, V.; Cerny, J. Visualization of tire tread behaviour at wear process. In Proceedings of the 22nd International DAAAM Symposium, Vienna, Austria, 23–26 November 2011; pp. 415–416. [Google Scholar]
  10. Cerny, J.; Kyas, K.; Krumal, M.; Martin, M.; Manas, D.; Manas, M.; Michal, M. Wear process of tires. In Proceedings of the 21st International DAAAM Symposiu, Zadar, Croatia, 20–23 October 2010; pp. 1189–1190. [Google Scholar]
  11. Bajda, M.; Blazej, R.; Jurdziak, L. Partial replacements of conbeyor belt loop analysis with regard to its reliability. In Proceedings of the 17th International Multidisciplinary Scientific GeoConference Surveying Geology and Mining Ecology Management SGEM 2017, Albena, Bulgaria, 29 June–5 July 2017; Volume 17, pp. 645–652. [Google Scholar]
  12. Bajda, M.; Blazej, R.; Jurdziak, L.; Kirjanow, A. Condition monitoring of textile belts in the light of research results of their resistance to punctures investigations. In Proceedings of the 16th International Multidisciplinary Scientific GeoConference, SGEM 2016: Science and Technologies in Geology, Exploration and Mining: Conference Proceedings, Albena, Bulgaria, 30 June–6 July 2016; pp. 165–172. [Google Scholar]
  13. Hardygóra, M. Trends in conveyor belt research. Transp. Logist. Int. J. 2002, 2, 1–12. [Google Scholar]
  14. Bocko, P.; Marada, O.; Bouda, T. Material and component testing of conveyor belts and its numerical analyses. In Lecture Notes in Mechanical Engineering, Modern methods of Construction Design: Proceedings of ICMD; Springer: Cham, Switzerland, 2013; Volume 2014, pp. 565–571. [Google Scholar]
  15. Andrejiová, M.; Grinčová, A. Classification of impact damage on a rubber-textile conveyor belt using Naïve-Bayes methodology. Wear 2018, 414–415, 59–67. [Google Scholar] [CrossRef]
  16. Andrejiová, M.; Grinčová, A.; Kimaková, Z. Analysis of the selected factors on the conveyor belt quality using the design of experiment. Qual. Access Success 2019, 20, 47–52. [Google Scholar]
  17. Rodriguez, N.; Dorogin, L.; Chew, K.T.; Persson, B.N.J. Adhesion, friction and viscoelastic properties for non-aged and aged Styrene Butadiene rubber. Tribol. Int. 2018, 121, 78–83. [Google Scholar] [CrossRef]
  18. Ambriško, Ľ.; Marasová, D., Jr. Investigation of the ageing influence on the hardness of essential belt component. In Proceedings of the SGEM 2018 Conference, 1.3. Science and Technologies in Geology: Exploration and Mining: International Multidisciplinary Scientific Geoconference, Albena, Bulgaria, 30 June–9 July 2018; pp. 529–536. [Google Scholar]
  19. Edgea, M.; Allen, N.S.; Gonzales-Sanchez, R.; Liauwa, C.M.; Reada, S.J.; Whitehouse, R.B. The influence of cure and carbon black on the high temperature oxidation of natural rubber, I. Correlation of physico-chemical changes. Polym. Degrad. Stab. 1999, 64, 197–205. [Google Scholar] [CrossRef]
  20. Turnbull, A. Polymer degradation. Mater. World 1995, 3, 182–183. [Google Scholar]
  21. Ambrisko, L.; Saderova, J.; Marasova, D. Determination of mechanical properties of rubber intended for use at high temperatures. In Proceedings of the International Multidisciplinary Scientific GeoConference Surveying Geology and Mining Ecology Management, SGEM19(1.3), Albena, Bulgaria, 28 June–7 July 2019; pp. 193–200. [Google Scholar]
  22. Marasová, D.; Taraba, V.; Grujič, M.; Fedorko, G.; Bindzár, P.; Husáková, N. Belt Transport, 1st ed.; FBERG TU: Košice, Slovakia, 2006; p. 280. (In Slovak) [Google Scholar]
  23. Sava TRADE. Available online: http://savatrade.cz/dopravni-pasy/katalog-dopravnich-pasu (accessed on 1 July 2020).
  24. Taraba, V.; Marasová, D.; Mikušová, N.; Burget, M. Belt Transport: Basics of Production, Connection and Use of Conveyor Belts, 1st ed.; FBERG TU: Košice, Slovakia, 2017; p. 156. (In Slovak) [Google Scholar]
  25. Saderova, J. Laboratory research of a conveyor belts with a textile carcass for mine conveying. In Proceedings of the International Multidisciplinary Scientific GeoConference Surveying Geology and Mining Ecology SGEM 2018, Albena, Bulgaria, 2–8 July 2018; pp. 537–544. [Google Scholar]
  26. Benjamin, C.; Donecker, P.; Huque, S.; Rozentals, J. The Transfer Chute Design Manual for Conveyor Belt Systems, 1st ed.; Conveyor Transfer Design Pty Ltd.: Hong Kong, China, 2010; p. 272. [Google Scholar]
  27. Marasová, D. Mathematical Modeling of Puncture Resistance of Conveyor Belts, 1st ed.; AD Servis: Český Těšín, Czech Republic, 2001; p. 100. (In Slovak) [Google Scholar]
  28. Draganová, K.; Moucha, V.; Volčko, T.; Semrád, K. Non-stationary noise analysis of magnetic sensors using Allan Variance. Acta Phys. Pol. A 2017, 131, 1126–1128. [Google Scholar] [CrossRef]
  29. Komander, H.; Hardygóra, M.; Bajda, M.; Komander, G.; Lewandowicz, P. Assessment methods of conveyor belts impact resistance to the dynamic action of a concentrated load. Eksploat. Niezawodn. 2014, 16, 579–584. [Google Scholar]
  30. Veles, P. Mechanical Properties and Testing of Metals, 2nd ed.; Alfa: Bratislava, Slovakia, 1989; p. 401. (In Slovak) [Google Scholar]
  31. Fedorko, G.; Molnár, V.; Marasova, D.; Grincova, A.; Dovica, M.; Živčák, J.; Tóth, T.; Husáková, N. Failure analysis of belt conveyor damage caused by the falling material. Part I: Experimental measurements and regression models. Eng. Fail. Anal. 2014, 36, 30–38. [Google Scholar] [CrossRef]
Figure 1. Fabric conveyor belt structure: (1) top cover layer; (2) carcass; (3) fabric ply; (4) bottom cover layer [25].
Applsci 10 08384 g001
Figure 2. The tested conveyor belt in a cross-section.
Applsci 10 08384 g002
Figure 3. Schematic of the original design of the test equipment: (1) tower; (2) drop hammer lifting winch; (3) belt conveyor [28].
Applsci 10 08384 g003
Figure 4. Test equipment: (a) original stand [28]; (b) innovated stand.
Applsci 10 08384 g004
Figure 5. Used impactor types: (a) semi-spherical impactor, (b) pyramidal impactor.
Applsci 10 08384 g005
Figure 6. Fixation table of the test equipment [28].
Applsci 10 08384 g006
Figure 7. Comparison of the impact process times.
Applsci 10 08384 g007
Figure 8. Correlation between the impact force FR and time t, with and without using the support system SS.
Applsci 10 08384 g008
Figure 9. Influence of the support system on the correlation between the impact force FR and the height h.
Applsci 10 08384 g009
Figure 10. Influence of the support system on the time course of the tensile force FN.
Applsci 10 08384 g010
Figure 11. Influence of the support system on the correlation between the impact force FR and the tensile force FN.
Applsci 10 08384 g011
Figure 12. Correlation between the impact force FR and the height h at the drop hammer weight of 100 kg and the drop height of 1.6 m.
Applsci 10 08384 g012
Figure 13. Correlations between the impact force FR and the height h at the drop hammer weight of 100 kg and the drop height of 1.4 m.
Applsci 10 08384 g013
Figure 14. Curves of the impact process for the correlations between the impact force FR and the height h at the drop hammer weight of 60 kg and with the use of the support system.
Applsci 10 08384 g014
Figure 15. Curves of the impact process for the correlation between the impact force FR and the height h at the drop hammer weight of 80 kg with the use of the support system.
Applsci 10 08384 g015
Figure 16. Correlation between the impact force FR and the tensile force FN for the drop hammer weight of 100 kg.
Applsci 10 08384 g016
Figure 17. Correlation between the impact force FR and the tensile force FN at the drop hammer weight of 100 kg without the support system.
Applsci 10 08384 g017
Table 1. Correlation between the impact force FR and the height h for the drop hammer weight of 60 kg with the use of the support system.
Drop Height (m)FR = f(h)R2
0.6FR = 0.6675e−140.6h0.9673
1FR = 0.4992e−112.6h0.9794
1.4FR = 0.6112e−92.62h0.9346
1.8FR = 0.3523e−94.34h0.9605
2.2FR = 0.5283e−77.94h0.9625
2.6FR = 1.5546e−68.04h0.9685
Table 2. Correlation between the impact force FR and the height h for the drop hammer weight of 80 kg.
Drop Height (m)FR = f(h)R2
0.6FR = 0.6733e−113.7h0.9532
1FR = 0.4338e−111.1h0.9534
1.4FR = 0.2541e−97.73h0.9576
1.8 (puncture)FR = −1.106 h4 − 109,287 h3 + 3081 h2 − 24.251 h + 0.4490.9982
Table 3. Correlation between the impact force FR and the height h for the drop hammer weight of 90 kg.
Drop Height (m)FR = f(h)R2
0.6FR = 0.6022e−106.5h0.9637
1FR = 0.5248e−98.32h0.952
1.4FR = 0.4669e−83.35h0.9772
1.6 (puncture)FR = −967,762 h4 − 60,161 h3 + 4875.1 h2 − 43.146h − 0.08040.9923
Table 4. Correlation between the impact force FR and the height h for the drop hammer weight of 100 kg.
Drop Height (m)FR = f(h)R2
0.6FR = 0.4188e−109h0.963
1FR = 0.3129e−97.75h0.983
1.4FR = 0.5053e−73.18h0.968
1.6 (puncture)FR = −797,954 h4 − 33,669 h3 + 4601.9h2 − 65.708h − 0.06010.9944
Table 5. Correlation between the impact force FR and the height h for the drop hammer weight of 90 kg without the support system.
Drop Height (m)FR = f(h)R2
0.6FR = 0.2563e−56.66h0.9398
1FR = 0.2315e−50.55h0.9324
1.4FR = 0.3147e−43.39h0.9387
1.6FR = 0.3241e−41.3h0.9474
Table 6. Correlation between the impact force FR and the height h for the drop hammer weight of 100 kg without the support system.
Drop Height (m)FR = f(h)R2
0.6FR = 0.3052e−57.48h0.9162
1FR = 0.3165e−48.21h0.9316
1.4FR = 0.3118e−44.46h0.9109
1.6FR = 0.3294e−42.81h0.925
Table 7. Correlation between the impact force FR and the tensile force FN for the drop hammer weight of 60 kg.
Drop Height (m)FR = f(FN)R2
0.6FR = −0.0571 FN4 + 7.423 FN3 − 361.43 FN2 + 7819 FN − 63,4270.9994
1FR = −0.0106 FN4 + 1.4454 FN3 − 74.06 FN2 + 1686.4 FN − 14,4070.9994
1.4FR = −0.005 FN4 + 0.7086 FN3 − 37.757 FN2 + 894.93 FN − 7964.20.9996
1.8FR = −0.0011 FN4 + 0.1678 FN3 − 9.8669 FN2 + 256.8 FN − 2498.20.9997
2.2FR = −0.0005 FN4 + 0.0812 FN3 − 4.9349 FN2 + 133.38 FN − 1353.30.9998
2.6FR = −0.0016 FN4 + 0.2401 FN3 − 13.528 FN2 + 340.12 FN − 3218.40.9996
Table 8. Correlation between the impact force FR and the tensile force FN for the drop hammer weight of 80 kg.
Drop Height (m)FR = f(FN)R2
0.6FR = −0.0149 FN4 + 2.0116 FN3 − 101.91 FN2 + 2294.5 FN − 19,3820.9996
1FR = −0.0051 FN4 + 0.7321 FN3 − 39.017 FN2 + 924.85 FN − 8230.80.9994
1.4FR = −0.0018 FN4 + 0.267 FN3 − 14.865 FN2 + 368.28 FN − 3428.60.9999
1.8 (puncture)FR = −0.005 FN4 + 0.6941 FN3 − 36.226 FN2 + 840.84 FN − 7330.10.9997
Table 9. Correlation between the impact force FR and the tensile force FN for the drop hammer weight of 90 kg.
Drop Height (m)FR = f(FN)R2
0.6FR = −0.0084 FN4 + 1.156 FN3 − 59.412 FN2 + 1357.5 FN − 11,6430.9998
1FR = −0.0028 FN4 + 0.4069 FN3 − 22.26 FN2 + 541.93 FN − 4956.70.9996
1.4FR = −0.0019 FN4 + 0.2907 FN3 − 16.251 FN2 + 403.8 FN − 3764.70.9997
1.6 (puncture)FR = −0.0078 FN4 + 1.0763 FN3 − 55.841 FN2 + 1287.8 FN − 11,1450.9992
Table 10. Correlation between the impact force FR and the tensile force FN for the drop hammer weight of 100 kg.
Drop Height (m)FR = f(FN)R2
0.6FR = −0.0064 FN4 + 0.8941 FN3 − 46.86 FN2 + 1092.5 FN − 9564.20.9994
1FR = −0.0009 FN4 + 0.1373 FN3 − 7.8871 FN2 + 201.88 FN − 1945.20.9998
1.4FR = −0.0013 FN4 + 0.1948 FN3 − 11.023 FN2 + 278.27 FN − 2644.70.9998
1.6 (puncture)FR = −0.0067 FN4 + 0.9309 FN3 − 48.626 FN2 + 1132 FN − 9911.70.9979
Table 11. Correlation between the impact force FR and the tensile force FN at the drop hammer weight of 90 kg without the absent support system.
Drop Height (m)FR = f(FN)R2
0.6FR = −0.0002 FN4 + 0.0381 FN3 − 2.2957 hFN2 + 61.827 FN − 625.930.9994
1FR = −6.10−5 FN4 + 0.0102 FN3 − 0.6827 FN2 + 20.691 FN − 235.730.9996
1.4FR = −2.10−5 FN4 + 0.0044 FN3 − 0.3208 FN2 + 10.826 FN − 136.710.9997
1.6FR = −1.10−5 FN4 + 0.0022 FN3 − 0.1736 FN2 + 6.5441 FN − 90.8220.9997
Table 12. Correlation between the impact force FR and the tensile force FN for the drop hammer weight of 100 kg without the support system.
Drop Height (m)FR = f(FN)R2
0.6FR = −0.0001 FN4 + 0.0185 FN3 − 1.1798 FN2 + 33.808 FN − 363.930.9995
1FR = −5.10−5 FN4 + 0.0085 FN3 − 0.5803 FN2 + 18.022 FN − 210.120.9997
1.4FR = −1.10−5 FN4 + 0.0031 FN3 − 0.233 FN2 + 8.258 FN − 108.960.9998
1.6FR = −1.10−5 FN4 + 0.0024 FN3 − 0.1906 FN2 + 7.0828 FN − 97.3060.9997
Publisher’s Note: MDPI stays neutral with regard to jurisdictional claims in published maps and institutional affiliations.