Article

Data-Driven Health Assessment in Flight Control System

1
The School of Civil Aviation, Northwestern Polytechnical University, Xi’an 710072, China
2
The 28th Research Institute of China Electronics Technology Group Corporation, Nanjing 210007, China
*
Author to whom correspondence should be addressed.
Appl. Sci. 2020, 10(23), 8370; https://doi.org/10.3390/app10238370
Submission received: 28 October 2020 / Revised: 19 November 2020 / Accepted: 23 November 2020 / Published: 25 November 2020
(This article belongs to the Special Issue Aerospace System Analysis and Optimization)

Abstract

:
The aircraft critical system’s health state will affect flight safety dramatically, such as flight control system, and its health state awareness or assessment is very important to avoid flight accident. A data-driven health assessment based on fuzzy comprehensive evaluation and rough set reduction is proposed for flight control system. Through the working principle and failure mode analysis, the system’s characteristic parameters are constructed to represent health state, and then the comprehensive health index construction is proposed to quantify health state. In the end, case calculation based on some aircraft’s flight data is presented to show the effectiveness of the proposed method.

1. Introduction

For modern advanced aircraft, flight control system is indispensable to complete normal flight mission and ensure flight safety, which means to stabilize attitude and track scheduled path. So such system’s health assessment is necessary to assist maintenance decision, operation schedule, and logistical support optimization, in which it is essential to avoid catastrophic accidents or even loss of human life. A great many scholars have paid attention to flight control or other airborne system’s health monitoring and assessment, which may use system’s theoretical model, system measured information, or system knowledge and so on.
In this paper, a data-driven health assessment method based on fuzzy comprehensive evaluation and rough sets reduction for flight control system is proposed. Compared with other health assessment methods, the algorithm based on fuzzy comprehensive evaluation and rough set reduction proposed in this paper still has better performance when the data sample size is small. In addition, by introducing the rough set reduction algorithm, it is also possible to objectively calculate the weight of each subsystem, which makes the evaluation results more comprehensive and reliable.The fuzzy comprehensive evaluation is introduced to complete each factor’s evaluation based on optimal evaluation valueand so as to avoid the less fault samples problem. Moreover, the rough set reduction is used to calculate the importance or weight of each evaluation factor, which eliminates the subjective and noise effects. Finally, the actual flight data is used to analyze the health state of the flight control system, which proves the effectiveness of the proposed method. The corresponding literature review about this problem is completed as follows.

2. Literature Review

Various system health condition estimation or state assessment based on measured data or information in different fields has been a topic of considerable interest. NASA [1,2] has done a lot of work on theoretical research and engineering application of aircraft system health management. At present, for both the military and civil aircraft, health monitoring functions or equipmenthave become essential for mainstream aircraft, such as Boeing 787, A350, and F35 [3,4]. Theoretically, there are two main methods for health assessment/monitoring: model-based and data-driven method. The model-based method can be divided into parameter estimation, states estimation, and equivalent space method [5]. All these model driven methods use the system mathematical model to complete the measured data processing, which constructs the observer to estimate the system output and then compares it with the measured value of the output (such as residual) to obtain information [6]. The data-driven method is to establish a health assessment model based on the acquired monitoring data and define the health state of the system by the failure threshold or health level [7]. Common data-driven methods mainly include Artificial Neural Networks [8], Support Vector Machine [9], Principal Component Analysis [10], etc. Jiang [11] used Gated Recurrent Unit (GRU) neural network to evaluate flap position sensor’s health state; however, due to the small number of fault samples used in neural network training, it was difficult to identify the fault state so that the assessment accuracy was not high. Chen [12] proposed a state monitoring method for flight control system based on Bayesian network and converted thefault signals, whichare difficult to detect, into deviation information which is easy to detect; however, the selection of deviation proportional coefficient was not determined by the distribution characteristics’ variation of eigenvectors. Cui [13] combined the parameters’weights of the hydraulic system by entropy weight and Analytic Hierarchy Process (AHP) and used Grey Correlation and Fuzzy Clustering method to evaluate its health state, but there were obvious subjective factors in the weight selection. Yang [14] established a health assessment model with independent and nonindependent performance parameters to achieve health assessment based on multiple performance parameters degradation. Shen [15] used the TradaBoost algorithm to evaluate the bearing’s health state, but the training data noise increased the classifier training difficulty, which affects each parameter’s variable weight. In general, the small number of fault samples in practical engineering will lead to inaccurate fault classification, and such subjective factors and multisource noise will also affect the weight distribution of assessment index.

3. Health Assessment Model and Comprehensive Health Index

In this section, the flight control system health assessment method is proposed, which constructs the health assessment model through the system failure mode, system fault components, and structure analysis. Then with this model and historical flight data, the characteristic parameters are extracted to calculate the health index and carry out system health assessment.

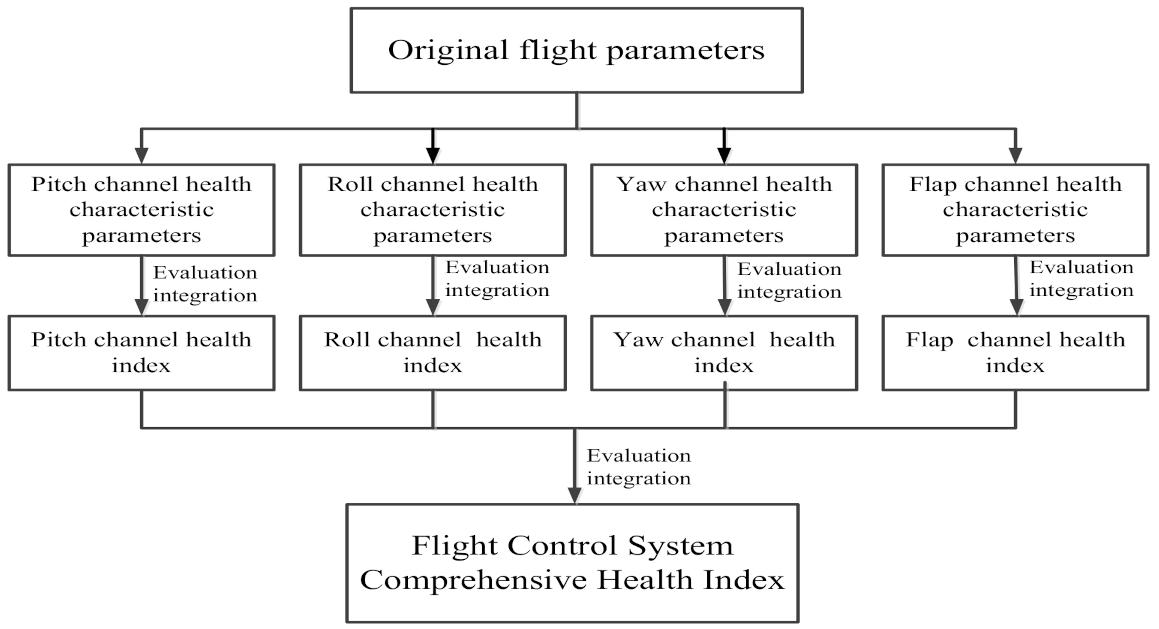
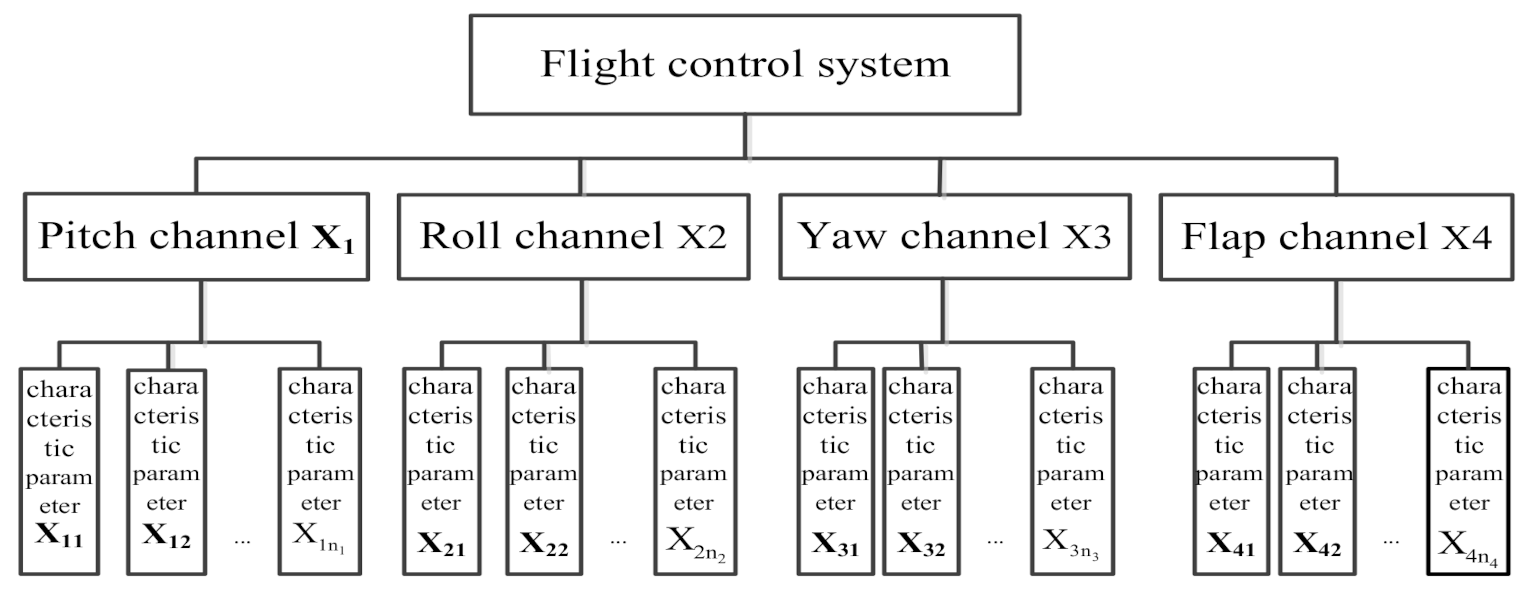
3.1. Health Assessment Model

Flight control system is generally composed of main and auxiliary control system. The main control system uses the different control surfaces to complete the pitch, roll, and yaw motion; for the viewpoint of system operation, it can be divided into pitch, roll, and yaw channels. Furthermore, the auxiliary control system is used to carry out lift enhancement and other auxiliary functions.
The failure mode analysis shows thatthe flight safety is mainly impacted by the main control system and the flaps in the auxiliary control system. In this paper, the system health assessment model is constructed by four channels, e.g., the three main channels and flap channel, which can be shown in Figure 1.
In this figure, based on system analysis and flight monitoring parameters selection, thecharacteristic parameters can be extracted to reflect each channel’s health state. Furthermore, the weight of each channel’s characteristic parameters are given by rough sets reduction and the health assessment is completed at the different channels with fuzzy comprehensive evaluation. Finally, the comprehensive integration is carried out at the flight control system level to get the total quantitative assessment of system health state.
Four channels’ characteristic parameters are selected according to Failure Mode and Effect Analysis (FMEA) of flight control system, which is shown in Table 1 and Table 2.
Therefore, the following three transmission coefficients are selected as parameters that characterize the health status of the main control system:
(1)
Pitch channel: steering column to elevator transmission coefficient.
(2)
Rolling channel: transmission coefficient from steering wheel to aileron.
(3)
Yaw channel: pedal to rudder transmission coefficient.
According to the flap system FMEA, the common failures of the flaps including jamming and inability to retract, etc., will cause the main hydraulic pressure to be abnormal and increase the retraction time. Therefore, the main hydraulic pressure and the flap retraction time can reflect the health status of the flap system, but the flap retraction time is only counted once in each sortie. It is impossible to obtain enough initial samples, so the Main Hydraulic Pressure is selected as the characteristic parameter to characterize the health status of the flap system.

3.2. Comprehensive Health Index

In Figure 1, Comprehensive Health Index (CHI) is used to quantify the whole system’s health state, whose value is set from 0 to 1. If the characteristic parameters are deviated, which means the corresponding channel health state is abnormal, and the CHI will be varied. Therefore, the system’s CHI can be calculated as follows:
C H I = W 1 S C H I 1 + W 2 S C H I 2 + + W n S C H I n ,
where CHI is thesystem comprehensive health index, Subsystem Comprehensive Health Index (SCHI) is thehealth index of each channel in Figure 1, W i is the weight of each channel, S C H I i is obtained by the characteristic parametersevaluation of each channel.Taking the pitch channel as an example to illustrate SCHI’s calculation process, firstly, the pitch channel’s characteristic parameters are extracted, and then the membership of each characteristic parameter is obtained to construct the evaluation matrix and determine the characteristic parameters’ weight vector.Finally, the weight vector and evaluation matrix are multiplied to get the evaluation vector, and the SCHI is calculated after quantification. The detailed integration process is described in Section 3.1 below.

4. Health Assessment Method

4.1. Fuzzy Comprehensive Evaluation

The failure record in actual system operation data may be less inevitable, which leadsto the commonly used neural network method and the gray clustering method being less accurate. The fuzzy comprehensive evaluation fuzzily divides the characteristic parameters into several intervals, which constructs the characteristic parameters’ fuzzy evaluation matrix in a specific channel, and then performs a row-by-row weighted calculation on this matrix to obtain a channel evaluation vector and gets the channel’s health index. During this process, each factor’s evaluation is completed by the best value, so it is only necessary to obtain the evaluation value through the comparison benchmark for the fault sample, which avoids the classification boundary ambiguity caused by the fewer fault samples [16]. The specific steps are shown as follows:
(1) Selecting characteristic parameters: characteristic parameters that reflect each channel’s health state are selected as in Figure 2, which are used as evaluation factors.
In this figure, n 1 , n 2 , n 3 , and n 4 are the number of characteristic parameters contained in the four channels.
(2) Establishing the health state interval set: The interval set is hierarchical set of health state of each characteristic parameter and channel. Assuming that there are m levels, the health state interval set can be expressed as:
L = l 1 l 2 l m ,
Where L means the health state of each characteristic parameter. Then the relative degradation degree analysis is introduced to normalize each characteristic parameter and construct a membership function with this relative deterioration degree.
(3) Calculating the membership row vector of each characteristic parameter: With the above-mentioned health state interval fuzzily calculation, the corresponding factor membership row vector can be obtained as:
r i j = r i j 1 r i j 2 r i j m ,
where, i = 1 , 2 , 3 , 4 represents the four channels, j = 1 , 2 n i , n i indicates the number of characteristic parameters in channel X i in Figure 2. m is the interval number of health stateinterval sets.
(4) Constructing the fuzzy evaluation matrix: With the membership row vector calculation of each characteristic parameter, the membership row vectors of all characteristic parameters in thechannel are combined to construct the fuzzy evaluation matrix:
R i = r i 1 1 r i 1 m r i n i 1 r i n i m = r i 1 r i 2 r i m ,
where i = 1 , 2 , 3 , 4 , m is the health state interval number, n i is the characteristic parameters number of channel X i .
(5) Determining the weight vector of the characteristic parameters in the channel: Based on the characteristic parameters selection in Equation (1), the rough sets reduction described in Section 3.2 below is used to identify the importance of factors for the upper level factors, and then the weight vector is constructed as:
w i = { w i 1 w i 2 w i n i } ,
(6) Calculating evaluation vector: With the weights w i of the characteristic parameters in the same channel and the fuzzy evaluation matrix R i , the evaluation vector of the channel X i is computed as:
b i = w i R i = b i 1 b i 2 b i m ,
(7) Calculating the health index of the channel: As the evaluation vector for channel X i is obtained, the evaluation vector b i is weighted summed and normalized to obtain the health index of the channel S C H I i , which can be shown as:
S C H I i = k = 1 m b i k m k + 1 m k = 1 m b i k ,
where m is the interval number of health state interval sets, k is the sequence number of elements in b i , k = 1 , 2 m

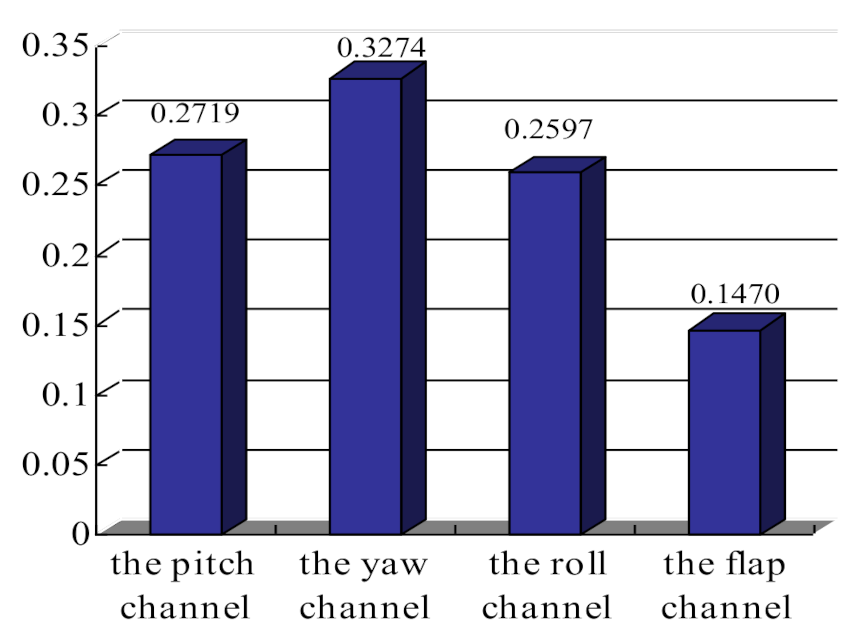
4.2. Weight Assignment Based on Rough Sets Reduction Algorithm

For the two-level weight calculation in Figure 2, there are three commonly used assignment methods [17]: subjective, objective, and subjective/objective weighting methods. During the weight assignment process, it is necessary to minimize the subjective factors’ impact, and an objective weighting method based on rough sets reduction is used in this section, which removes an attribute from the set firstly and evaluates its importance to determine its weight.
The main idea of rough set is to ensure that the classification ability of the information itself does not change. A new classification method is formed by the relative simplicity of information knowledge, under the condition that the simplicity of knowledge does not change the original classification, and then the expression of new knowledge is formed. The brief process of knowledge in each message can be described using specific mathematical formulas, which makes it capable of processing most rough sets of data. As the knowledge structure of the information is preserved, rough sets processing method is widely used in machine learning, pattern recognition, and data mining.
Rough set algorithm does not need priori data, it only needs to mine the hidden rules from the knowledge itself and extract the importance of attribute components. So, we can obtain the importance of component attributes on information classification, which can be integrated with a weighted comprehensive model to establish objective feature parameter weight distribution methods.
Based on this, the idea of rough sets reduction is to continuously remove certain attributes from the original complete attribute set, and then observe whether the postclassification state has changed greatly; if it does, the importance of this attribute is higher, otherwise the importance is lower. When using the rough set reduction algorithm to calculate the weight of each channel, the membership function of the relative degradation degree of each channel is first constructed, and then the weight value is derived from the attribute importance of each channel, which can reduce the inaccurate weight setting caused by the bias of human subjective judgment, thereby improving the robustness of the evaluation results.
The specific assignment steps are shown as follows:
(1) Constructing decision table: Constructing a decision table with different attributes and importance, the lower evaluation factor in Figure 2 is used as the condition attribute in decision table C = c 1 c 2 c n , and the upper factor is used as decision attribute D = d 1 d 2 d 3 d 4 , n = n 1 + n 2 + n 3 + n 4 .
(2) Calculating the attribute conditional information entropy: Supposing X is a subset of attributes in the flight control system evaluation factors, and the x is a specific attribute, the conditional information entropy of x for X is:
I ( X ) = 1 i = 1 n X i 2 U ,
where U is a finite nonempty set of flight control system.
(3) Calculating the importance of a single attribute: Excluding an attribute c , the importance of c in C based on conditional information entropy is computed as:
S i g ( c ) = I ( D / C ) I ( D / C c ) ,
(4) Calculating the weights: Based on the importance calculation of a single attribute, the weight of the attribute can be obtained as:
w ( c i ) = s i g ( c i ) i = 1 n s i g ( c i ) ,

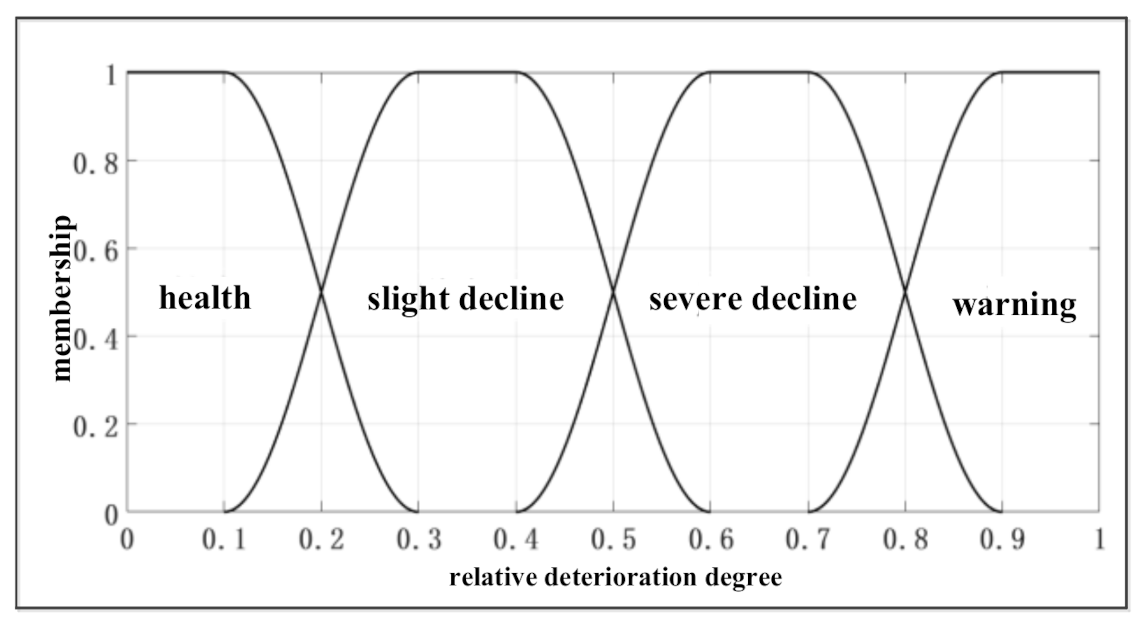
4.3. Relative Deterioration Degree

Each characteristic parameter has its special physical meaning and dimension, the relative deterioration degree method [18] is used for normalization, and then the membership function is constructed in this subsection. The relative deterioration degree refers to the similarity between the current state of the characteristic parameter and fault state; the value range is set as [0,1]. The value 1 indicates the fault state, and the value 0 is the healthy state. For characteristic parameters analysis of the flight control system, the intermediate type calculation method is adopted to calculate the relative deterioration degree, and its degradation degree function parameters include the maximum x max , minimum x min , and optimal range x a , x b , which is shown as:
d ( x ) = 1 x < x min x x min x a x min x min x x a 0 x a x x b x x b x max x b x b x x max 1 x > x max ,

5. Certain Type Aircraft Flight Control System Health Assessment

In this section, the flight data of certain types of commercial short-range twin-turboprop aircraft is used to verify the above data-driven health assessment method. Due to the small number of aircraft in service, 60 flights’ data are obtained for this verification.
The detailed flight data in Excel table is shown in Figure 3 below.

5.1. Health Assessment for a Single Flight

The characteristic parameters of four channels need to be determined firstly for comprehensive health index, and then the health state assessment of the single flight can be completed.
Take the flap channel as an example, the pilot inputs the command by position handle and the hydraulic electromagnetic switch will be open according to this command signal; the high-pressure oil will enter the pipeline through the electromagnetic valve to drive motor, which drives the flap drive shaft to rotate. During this process, the main hydraulic pressure’s variation will directly change the flap retracting force and affect the flap system’s performance. So, the main hydraulic pressure is taken as the characteristic parameter of the flap’s health state. Moreover, based on the flap failure mode, the jamming of the transmission mechanism component will slow down the retracting speed or even stop retracting, so the flap retraction and extension time is introduced as the second characteristic parameter.
To get the membership, the main hydraulic pressure needs to be normalized with the relative degradation degree, and Table 3 gives the parameters of relative degradation function in Equation (11), and then the relative deterioration degree of the main hydraulic pressure is obtained as 0.
As the evaluation steps shown in Section 3.1, health state interval set with four levels is established as: health, slight degradation, severe degradation, and warning. Since the characteristic parameter has become a normalized value by relative deterioration degree analysis, the distribution functions of the descending, intermediate, and ascending types are selected to construct the membership function to cover the deterioration interval:
r l 1 = 1 d < 0.1 1 2 1 2 sin π 0.2 d 0.2 0.1 d 0.3 0 d > 0.3 ,
r l 2 = 0 d < 0.1 1 2 + 1 2 sin π 0.2 d 0.2 0.1 d 0.3 1 0.3 d 0.4 1 2 1 2 sin π 0.2 d 0.5 0.4 < d < 0.6 0 d 0.6 ,
r l 3 = 0 d < 0.4 1 2 + 1 2 sin π 0.2 d 0.5 0.4 d 0.6 1 0.6 d 0.7 1 2 1 2 sin π 0.2 d 0.8 0.7 < d < 0.9 0 d 0.9 ,
r l 4 = 0 d 0.7 1 2 + 1 2 sin π 0.2 d 0.8 0.7 d 0.9 1 d 0.9 ,
which are shown in Figure 4.
Then the membership of the main hydraulic pressure can be obtained as follows:
r 41 = 0.0886 0.9114 0 0 ,
Since the sampling time interval of the original data is 1 s, the normalized data has a smaller discrimination. Therefore, 20 experts are invited to judge the flap’s retraction and extension time, and there are 17 experts who believe that flap system is healthy, three experts think the flap is slightly damaged, and no experts think the flap is failed. The single factor membership value of the retraction and extension time is obtained as follows:
r 42 = 0.85 0.15 0 0 ,
The membership vectors of two characteristic parameters are combined as follows:
R 4 = 0.0886 0.9114 0 0 0.85 0.15 0 0 ,
Meanwhile, the rough sets reduction algorithm is used to assign weights of main hydraulic pressure and retracting time as follows:
w = 0.3766 0.6234 ,
According to the above Equation (6), the evaluation vector is:
b 4 = w r = 0.5633 0.4367 0 0 ,
The evaluation vector is quantified based on Equation (7) above to obtain the health index of the flap channel S C H I = 0.8908 .
Similarly, the deterioration degree function parameters of the other three channels are constructed in Table 4. In which, the transfer coefficient is defined as the slope of control surface deflection and joystick displacement curve. The deterioration degree of the characteristic parameters is obtained and the membership value is calculatedand finally the health index of the channel can be obtained.
The relative deterioration degrees of the above characteristic parameters are calculated as follows:
d = ( 0.5706 0.5160 1 ) ,
Based on the membership function above, the membership vectors of three channels are obtained as:
R 1 = 0 0.0524 0.9676 0 ,
R 2 = 0 0.3758 0.6242 0 ,
R 3 = ( 0 0 0 1 ) ,
The weights of characteristic parameter in each channel are setas: w i = 1 , i = 1 , 2 , 3 .Using the above method, the health indices of the pitch channel, the yaw channel, and the roll channel are obtained as 1, 1, and 1. With the rough sets reduction algorithm, the weights of the four channels are obtained again as in Figure 5.
Based on Equation (1), the comprehensive health index is obtained as: C H I = 0.6206 .
The ability of the flight control system to carry out system or channel functions under different health states is different; according to gray health index theory [19], the health state of flight control system is divided into four levels, which establishes a mapping relationship between the comprehensive health index and the flight control system’s health state. The definition of the system comprehensive health index interval is shown in Table 5.
Compared with Table 5, the flight control system for this flight is in “functional degradation” state.

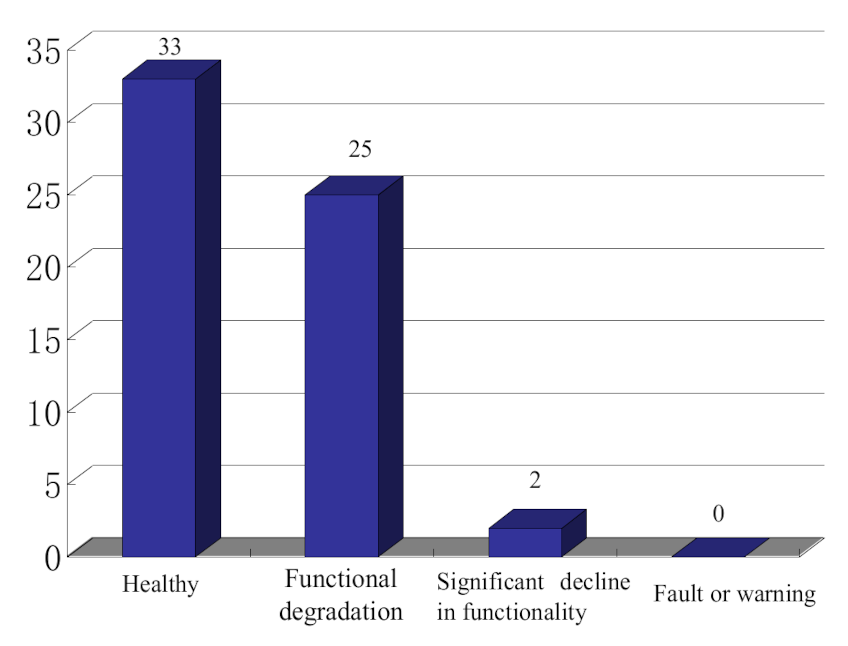
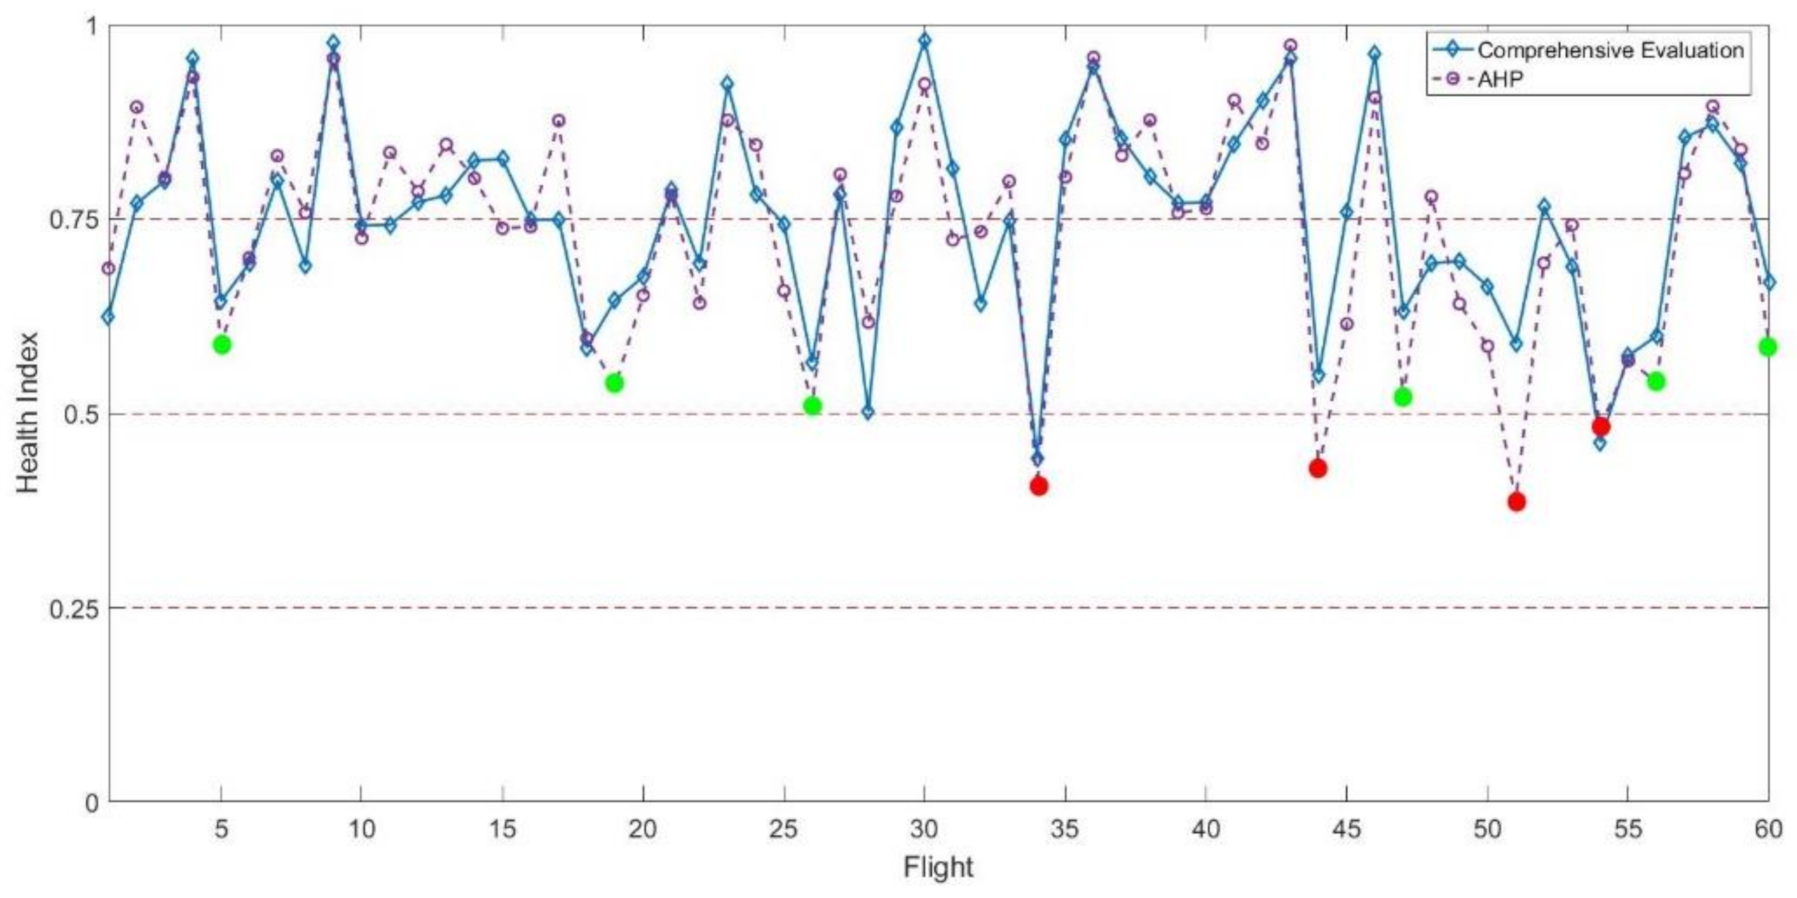
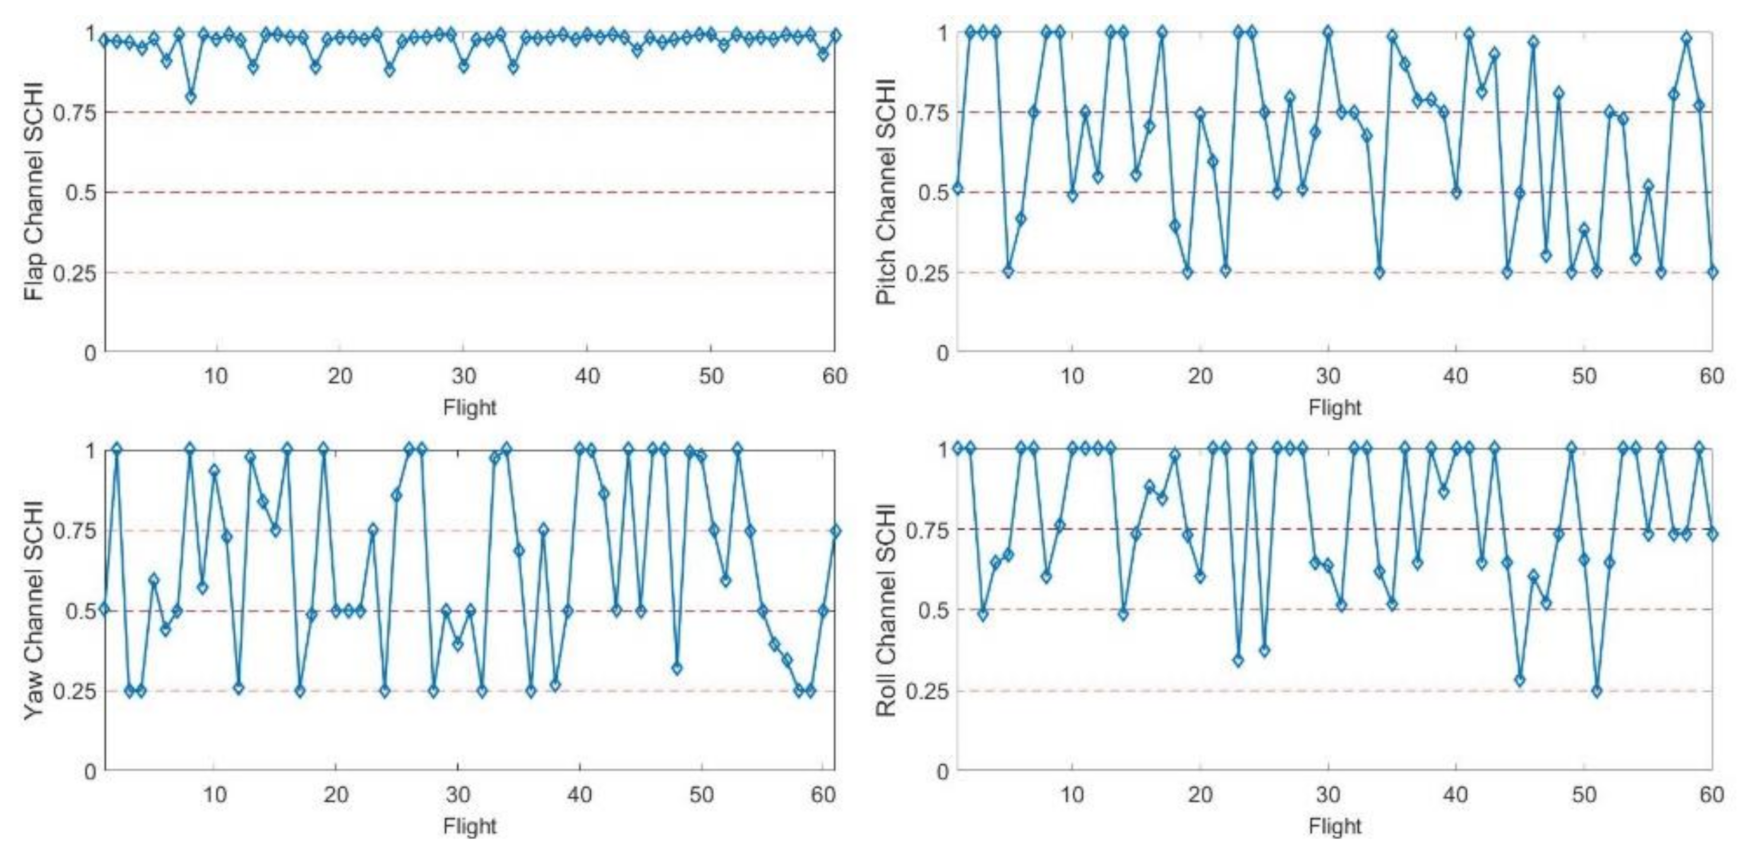
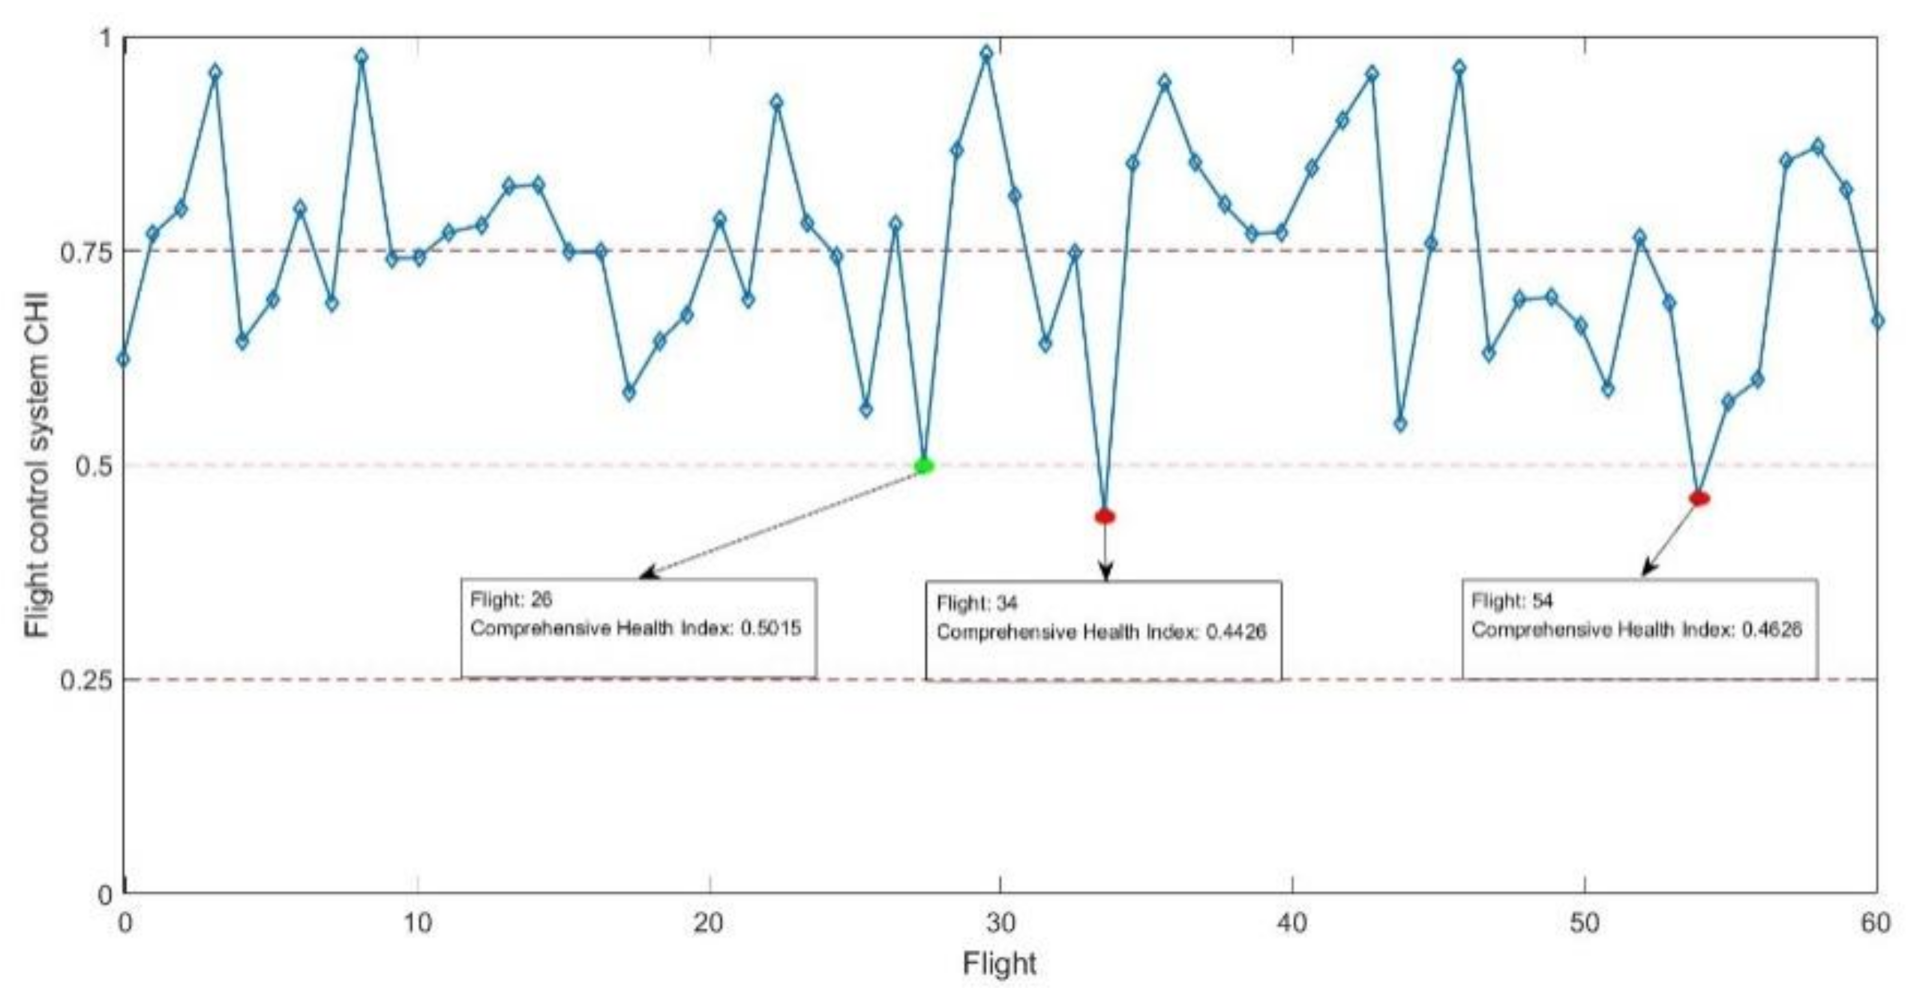
5.2. Health Assessment for 60 Flights

With health assessment calculation for 60 flights of this aircraft, the health index of the four channels and the comprehensive health index of the flight control system are shown in Figure 6 and Figure 7, respectively.
With the health index interval in Table 5, the health state distributions for 60 flights are shown in Figure 8.
In these 60 flights, flight control system is healthy in 33 flights, functional degradation in 25 flights, and significant decline in functionality in 2 flights. Moreover, the 34th and the 54th flights show significant decline in functionality as the red dot in Figure 9, and the 26thflight shows significant decline in functionality as the green dot in Figure 9. The four channels’ health indexes for the three flights (26, 34, and 54 flights) are listed in Table 6 below.
This shows that, in the 26th flight, the SCHI for yaw channel and roll channel are lower, which causes the health state to decline, and in the 34th and 54th flights, the SCHI for pitch channel and yaw channel are lower, which causes the health state to have a significant decline in functionality. According to the health characteristics of the three flights, the main reason is that the transfer coefficient K 1 of the pitch channel, the transfer coefficient K 2 of the yaw channel, and the transfer coefficient of the roll channel are not in normal range.
In addition, the Analytic Hierarchy Process (AHP) [20] was used to evaluate the health status of the flight control system for 60 sorties, and compared with the evaluation results based on fuzzy comprehensive evaluation and rough set reduction algorithm(comprehensive evaluation) mentioned in the article, the results are as follows:
It shows that the results obtained by the two evaluation methods are mostly consistent, but there are some differences in detail. Compared with the proposed method, in the assessment results obtained by AHP, the number of flights approaching and reaching severe functional degradation has increased, as shown by the green and red dots in Figure 9 and Table 7 (green dots indicate that the flight approaching severe functional degradation, and red dots indicate the flight has reached functional degradation). Further study of the channels’health status of these sorties can concludethat their pitch channels have experienced different degrees of functional degradation, which led to the decline in the health status of the flight control systems of these flights.

5.3. Discussions

In the comparison of the above two methods, the AHP evaluation result has more flights that are close to or have reached functional degradation. However, even some flights whose channel function has not reached severe degradation are assessed as severely degraded (such as the 51st flight in Table 7); this is obviously inaccurate. The reason for this is that when constructing the judgment matrix of the AHP method, the weight of the pitch channel’s SCHI in Table 7 is set too high, which results in the overall health of some flights whose function is close to severe functional degradation being evaluated as severe functional degradation; in other words, human subjective judgment magnifies the degree of actual failure.
In contrast, the evaluation method based on fuzzy comprehensive evaluation and rough set reduction algorithm proposed in this paper is based on the membership function to solve the weight of each channel; it reduces the inaccurate evaluation caused by the bias of subjective judgment, which improves the reliability and robust of evaluation result and reduces the false alarm rate of the evaluation process.
Furthermore, the evaluation method proposed in this article still has some shortcomings. For the selected characteristic parameters that characterize the health status of the flight control system, although these parameters are set in the standard range when the aircraft leaves the factory, they are constantly changing during the actual flight. Therefore, it is necessary to analyze this impact of uncertainty in future studies.

6. Conclusions

Based on the health monitoring and maintenance requirement of flight control systems, the health assessment model is established firstly in this paper. With this model, some data-driven methods are introduced to evaluate the health state. Finally, the case study is completed to show the effectiveness of the proposed method, and the following conclusions can be obtained:
(1)
The calculation results are close to the actual operating condition, which proves that the model is suitable for the flight control system’s health assessment.
(2)
For the weight assignment of each level of the assessment model, the rough sets reduction is introduced to eliminate the subjective factors’ influence and overcome the defects based on expert experience.
(3)
The membership classification error can be avoided by membership value determination method based on the relative deterioration degree, which makes the evaluation matrix more accurate.

Author Contributions

Conceptualization, J.C.; methodology, C.W.; software, Y.Z.; formal analysis, Y.Z.; resources, J.C.; writing—original draft preparation, C.W.; writing—review and editing, J.C.; visualization, Q.X.; funding acquisition, J.C. All authors have read and agreed to the published version of the manuscript.

Funding

This research was funded by National Nature Science Foundation of China (Grant no.61873203), Natural Science Basic Research Plan in Shaanxi Province of China (program No.2019JM-003), the Research funds for interdisciplinary subject, NWPU and key laboratory fund (6142806190504).

Conflicts of Interest

The authors declare no conflict of interest.

References

  1. Fox, J.J.; Glass, B.J. Impact of integrated vehicle health management (IVHM) technologies on ground operations for reusable launch vehicles (RLVs) and Spacecraft. IEEE Aerosp. Conf. 2000, 2, 179–186. [Google Scholar]
  2. Bailey, R.; McSharry, M. K-1 Integrated Vehicle Health Management System: Design for Operational Efficiency. Proc. IEEE Aerosp. Conf. 2000, 4, 323–327. [Google Scholar]
  3. Yedavalli, R.K.; Belapurkar, R.K. Application of wireless sensor networks to aircraft control and health management systems. J. Control Theory Appl. 2011, 9, 28–33. [Google Scholar] [CrossRef]
  4. Donald, L.S. An overview of the NASA aviation safety program propulsion health monitoring element. In Proceedings of the 36th AIAA/ASME/SAE/ASEE Joint Propulsion Conference and Exhibit, Huntsville, AL, USA, 16 July 2000. [Google Scholar]
  5. Wu, M.X. Study of Health Simulation and Evaluation Technology for Vehicle’s Control System. Master’s Thesis, National University of Defense Technology, Changsha, China, 2012. [Google Scholar]
  6. Garcia, E.A.; Frank, P.M. On the relationship between observer and parameter identification based approaches to fault detection. Proc. IFAC World Congr. 2001, 29, 25–29. [Google Scholar]
  7. Yi, X.J. Health Estimation and Prognostics for Complex Electromechanical System Based on Semi-Quantitative Information. Master’s Thesis, ChangChun University of Technology, Changchun, China, 2017. [Google Scholar]
  8. Sun, K. Complex Electromechanical System State Analysis Method Based on System Map. Master’s Thesis, Northwestern Polytechnical University, Xi’an, China, 2016. [Google Scholar]
  9. Shu, J.T.; Jin, L.; Lin, L. Fuzzy Support Vector Regression-Based Link Quality Prediction Model for Wireless Sensor Networks. J. Comput. Res. Dev. 2015, 52, 1842–1851. [Google Scholar]
  10. Khedher, L.; Ramirez, J.; Gorriz, J.M. Early diagnosis of Alzheimer’s disease based on partial least squares, principal component analysis and support vector machine using segmented MRI images. Neurocomputing 2015, 151, 139–150. [Google Scholar] [CrossRef]
  11. Jiang, Z.N.; Zuo, H.F.; Li, L.R. Research on Fault Prediction Method of Trailing Edge Flap Position Sensor Failure. Aeronaut. Comput. Tech. 2018, 2, 75–78. [Google Scholar]
  12. Chen, Y.C.; Yang, W. Fly-by-wire Flight Control System State Monitoring and Health Management Base on Bayesian Decision. Comput. Meas. Control 2012, 6, 1449–1451. [Google Scholar]
  13. Cui, J.G.; Lin, Z.L.; Lv, R. Comprehensive assessment method of aircraft health status based on fuzzy fray clustering and combination weighting. Acta Aeronaut. Astronaut. Sin. 2014, 35, 764–772. [Google Scholar]
  14. Yang, Y.; Fu, G.C.; Wan, B. Component storage reliability evaluation method based on multi-performance parameters degradation analysis. In Proceedings of the 2011 Prognostics and System Health Management Conference, Washington, DC, USA, 23–25 May 2011. [Google Scholar]
  15. Shen, F.; Chen, C.; Yan, R. Bearing fault diagnosis transfer learning classification. In Proceedings of the Prognostics and System Health Management Conference 2015, Beijing, China, 21–23 October 2015; pp. 1–6. [Google Scholar]
  16. Zhang, K.F.; Guo, J.; Xiao, Z.H. Research on state evaluation method of transformer based on fusion of fuzzy comprehensive evaluation and improved D-S evidence theory. Wuhan Univ. J. Eng. Sci. 2016, 2, 279–284. [Google Scholar]
  17. Xu, H.L.; Peng, L.Y.; Wang, S.P. Research on Weight Allocation Method of Operation Quality Evaluation Indicator of Power Communication Network. Electr. Power Inf. Commun. Technol. 2019, 17, 45–51. [Google Scholar]
  18. Huang, B.Q.; He, Y.; Wang, T.Y. Fuzzy synthetic evaluation of the operational status of offshore direct-drive wind turbines. J. Tsinghua Univ. Sci. Technol. 2015, 55, 543–549. [Google Scholar]
  19. Kalgren, P.W.; Byington, C.S.; Roemer, M.J.; Watson, M.J.; Defining, P.H.M. A Lexical Evolution of Maintenance and Logistics. In Proceedings of the 2006 IEEE Autotestcon, Anaheim, CA, USA, 18–21 September 2006; pp. 353–358. [Google Scholar]
  20. Li, Q.; Wang, Y.; Zhang, K.; Cheng, Z.; Tao, Z. Life-Cycle Performance Assessment and Distress Prediction of Subgrade Based on an Analytic Hierarchy Process and the PSO–LSSVM Model. Appl. Sci. 2020, 10, 7529. [Google Scholar] [CrossRef]
Figure 1. Health assessment model.
Applsci 10 08370 g001
Figure 2. Flight control system characteristic parameter.
Applsci 10 08370 g002
Figure 3. Flight data in Excel table.
Applsci 10 08370 g003
Figure 4. The membership function.
Applsci 10 08370 g004
Figure 5. The weight of 4 channels.
Applsci 10 08370 g005
Figure 6. The Subsystem Comprehensive Health Index (SCHI) of the four channels.
Applsci 10 08370 g006
Figure 7. The CHI of flight control system.
Applsci 10 08370 g007
Figure 8. The distribution of the different health status of 60 sorties.
Applsci 10 08370 g008
Figure 9. Comparison of Analytic Hierarchy Process (AHP) and comprehensive evaluation.
Applsci 10 08370 g009
Table 1. Failure Mode and Effect Analysis (FMEA) of the main control system (part).
NameFailure ModeReason of FailureInfluence on SystemInfluence Degree
Steering wheelstuckBolts are over tightened.Aileron stuckII
Steering columnassembly stuckBolts are over tightened, rotating bearing is dry and worn.Elevator stuckII
RockerComponent disconnectedConnector breakFlight control system failureI
Tie rodTie rod breakCracks and scratches on tie rod pipes Main control system failureI
Table 2. FMEA of the flap system (part).
NameFailure ModeReason of FailureInfluence on SystemInfluence Degree
Transmission componentsFlaps are not synchronized on both sidesTransmission components fractureFlaps’ retraction stopsIII
Transmission components stuckSpline or cross joint stuckFlaps cannot be retractedIII
ActuatorActuator transmission failure or stuckGears are wornTransmission components are stuck and flaps cannot be retractedIII
Flap position signal mechanismFlap position signal mechanism does not workCircuit is blocked or the switch is in poor contactFlaps cannot be retractedIII
Fulcrum bearing of flap assemblyTransmission components deform and become stuckSupport shell is brokenTransmission component is stuck and the flaps cannot be retractedIII
Table 3. Relative deterioration degree parameters of main hydraulic pressure.
Function ParametersValue
x max 2229
x min 80.566
x a 1900
x b 2185
Table 4. The deterioration degree function parameters of the other three channels.
Characteristic Parameters X max X min X a X b
pitch channel’s transfer coefficient K 1 0.23310.11130.12760.1575
yaw channel’s transfer coefficient K 2 2.77780.24450.30740.3758
roll channel’s left transfer coefficient K 3 -0.1840-0.4146-0.2335-0.1911
Table 5. The system comprehensive health index interval.
CHIHealth State
0.75–1Healthy
0.5–0.75Functional degradation
0.25–0.5Significant decline in functionality
0.0–0.25Fault or warning
Table 6. SCHI of the 26th, 34th, and 54th sorties.
FlightsChannelSCHI
26flap channel0.9127
pitch channel0.5000
yaw channel0.3933
roll channel0.3449
34flap channel0.7883
pitch channel0.2500
yaw channel0.2687
roll channel0.5138
54flap channel0.9766
pitch channel02946
yaw channel0.2500
roll channel0.6456
Table 7. Pitch channel’s SCHI of the flights in functional degradation.
FlightsSCHI of Pitch ChannelSystem CHI by the Proposed MethodSystem CHI byAHP
50.55480.64420.5896
190.53100.67550.5353
260.50000.50150.5106
340.25000.44260.4060
440.54000.75920.4275
470.59090.69270.5194
510.58900.76590.3876
540.29460.46260.4813
Publisher’s Note: MDPI stays neutral with regard to jurisdictional claims in published maps and institutional affiliations.

