Study on the Applicability of Dynamic Factor Standards by Comparison of Spring Constant Based Dynamic Factor of Ballasted and Concrete Track Structures


Abstract
1. Introduction
2. Theoretical Discussion
2.1. Dynamic Factor Considering the Stiffness or Modulus of the Track
2.2. Application of Track Stiffness for Calculation of Dynamic Factor
2.3. Dynamic Factor Calculation Methods Outlined
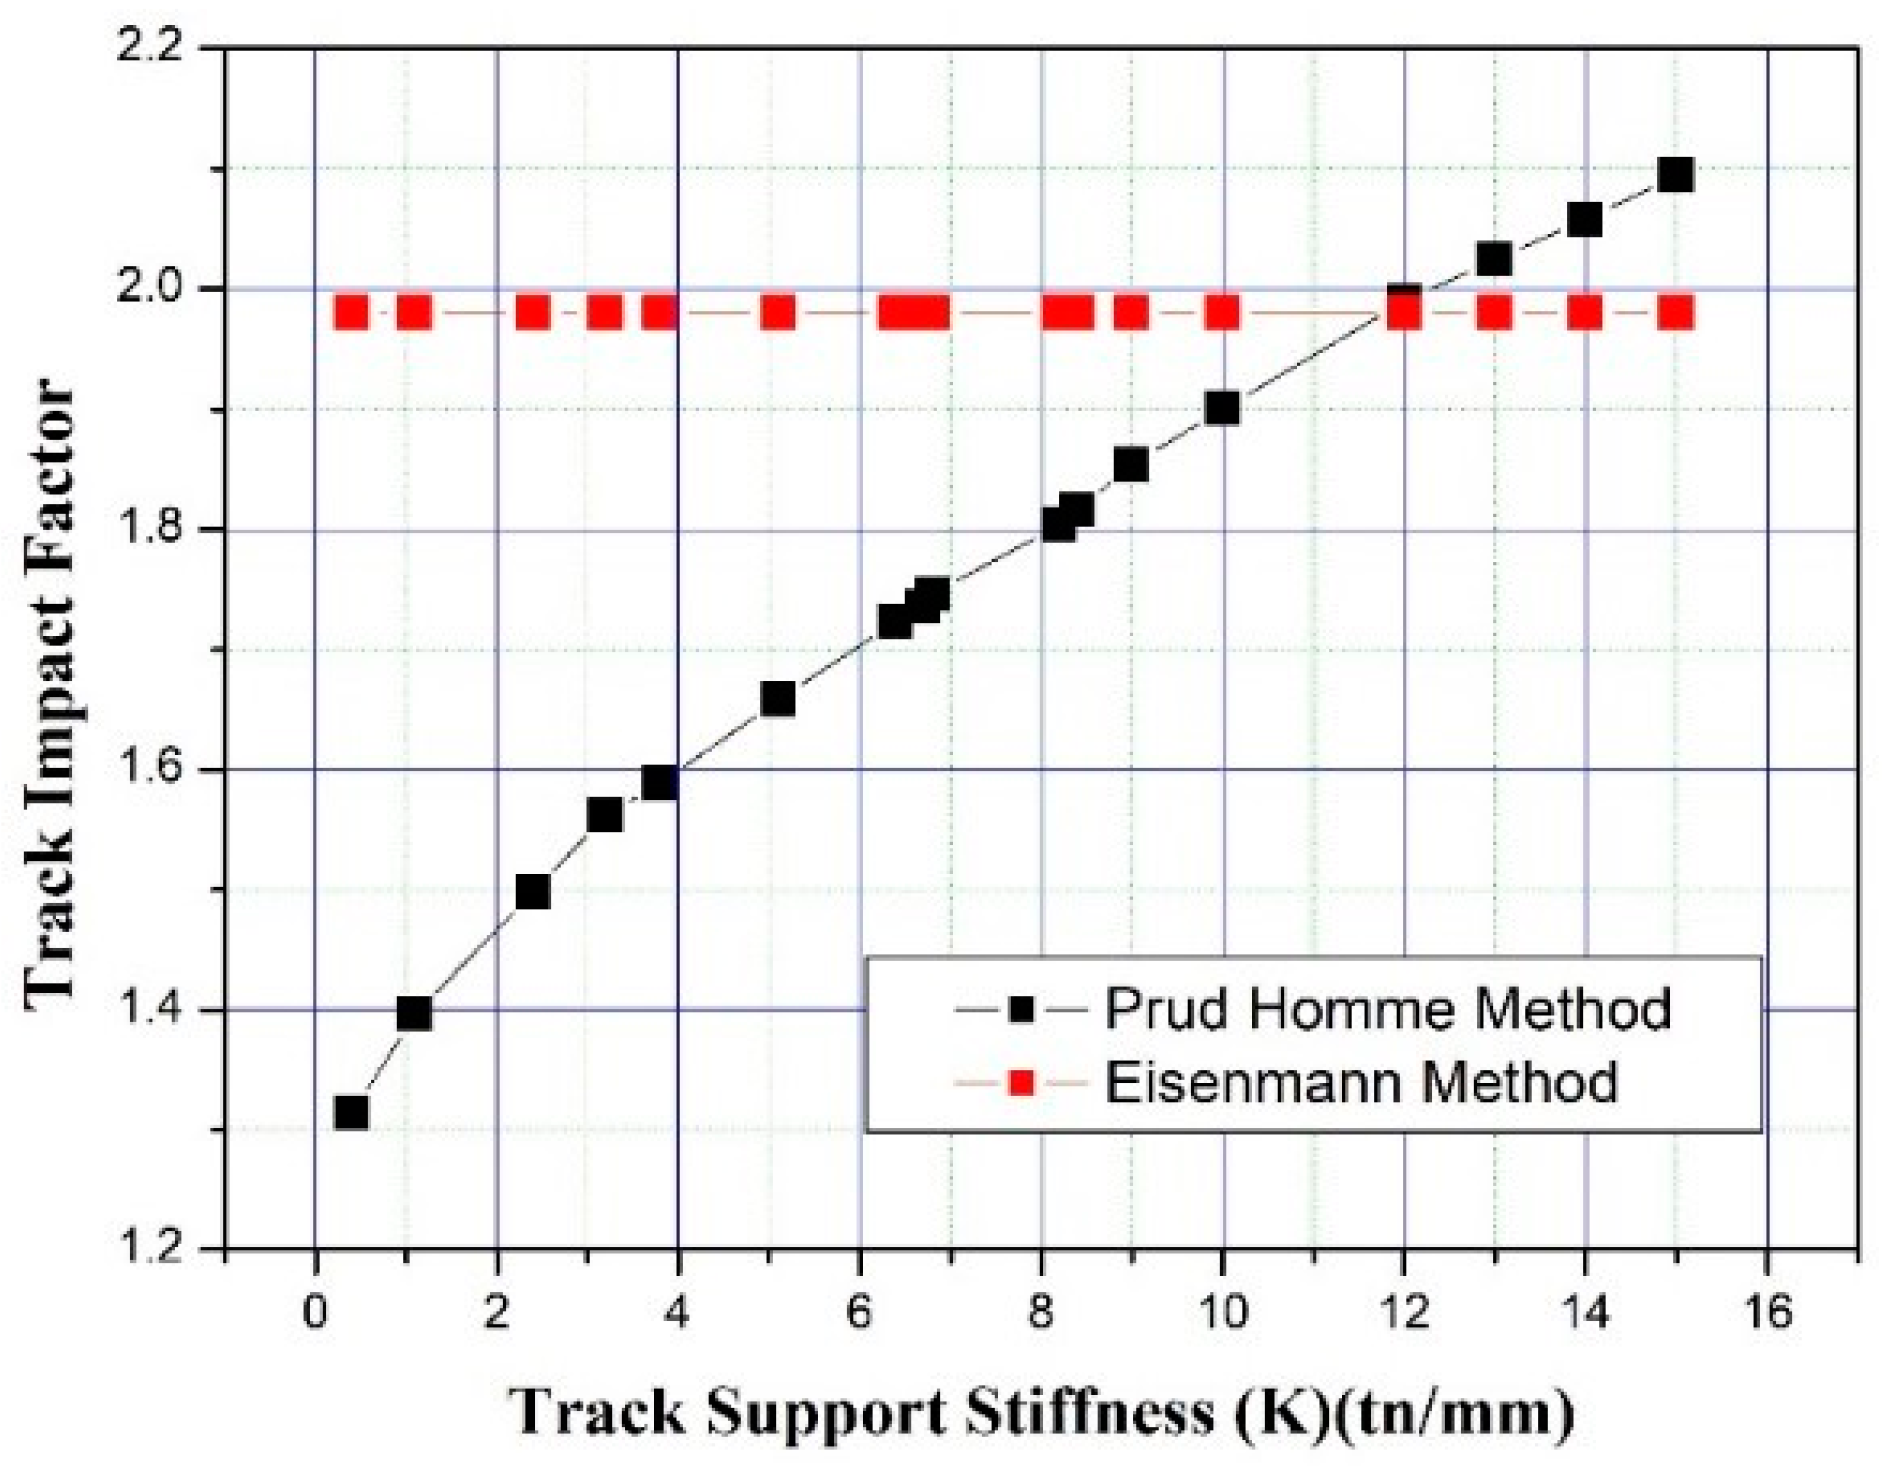
2.3.1. Eisenmann Calculation Method (DAFEisenmann)
2.3.2. AREA Calculation Method (DAFArea)
2.3.3. Trackside Measurement Based Calculation Method (DAFField)
3. Spring Constant of Track Types and Field Measurement for Dynamic Factor Comparison
3.1. Trackside Measurement Conditions and Finite Element Analysis for Spring Constant Comparison
3.1.1. Track Sites for Conducting Trackside Measurement and Finite Element Modeling Reference
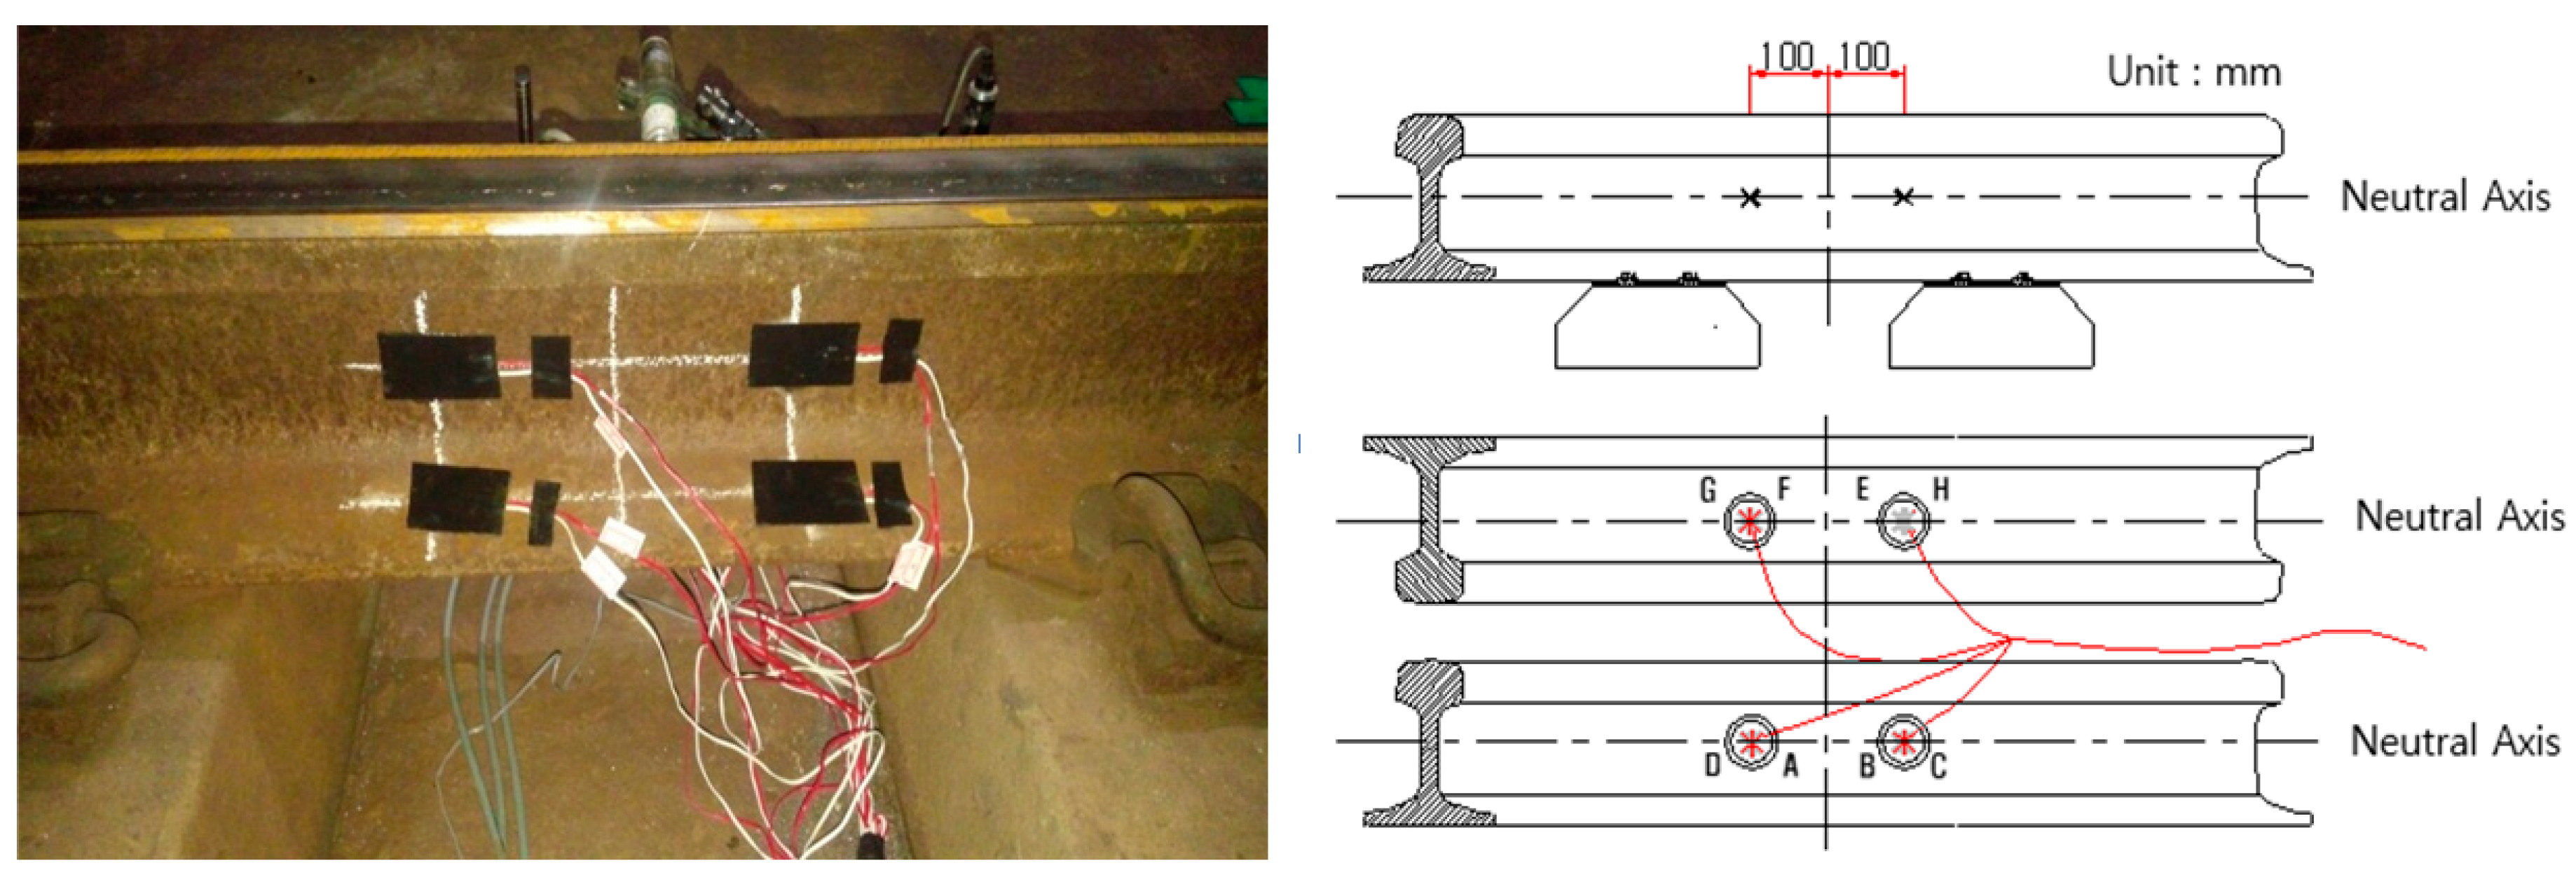
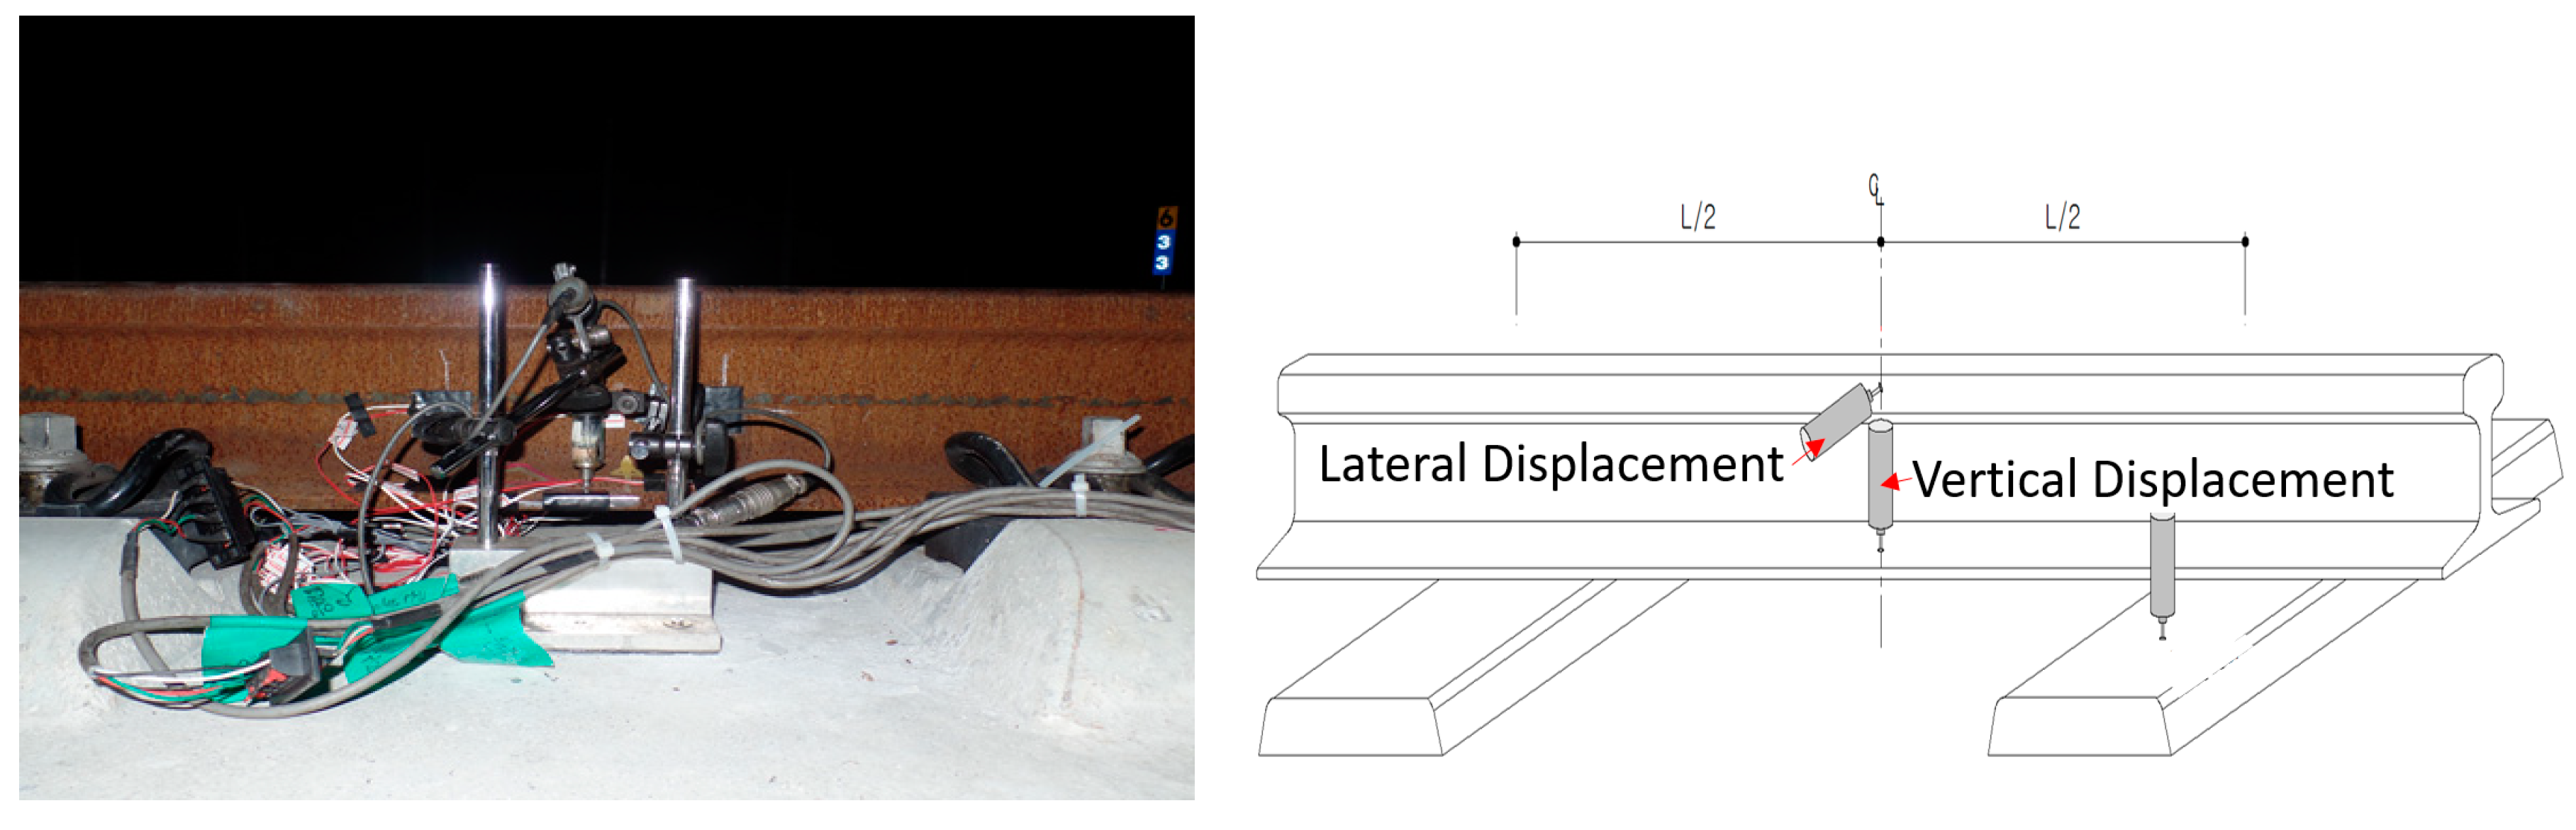
3.1.2. Measuring Equipment
3.1.3. Field Measurement Method
3.2. Vehicle Specification
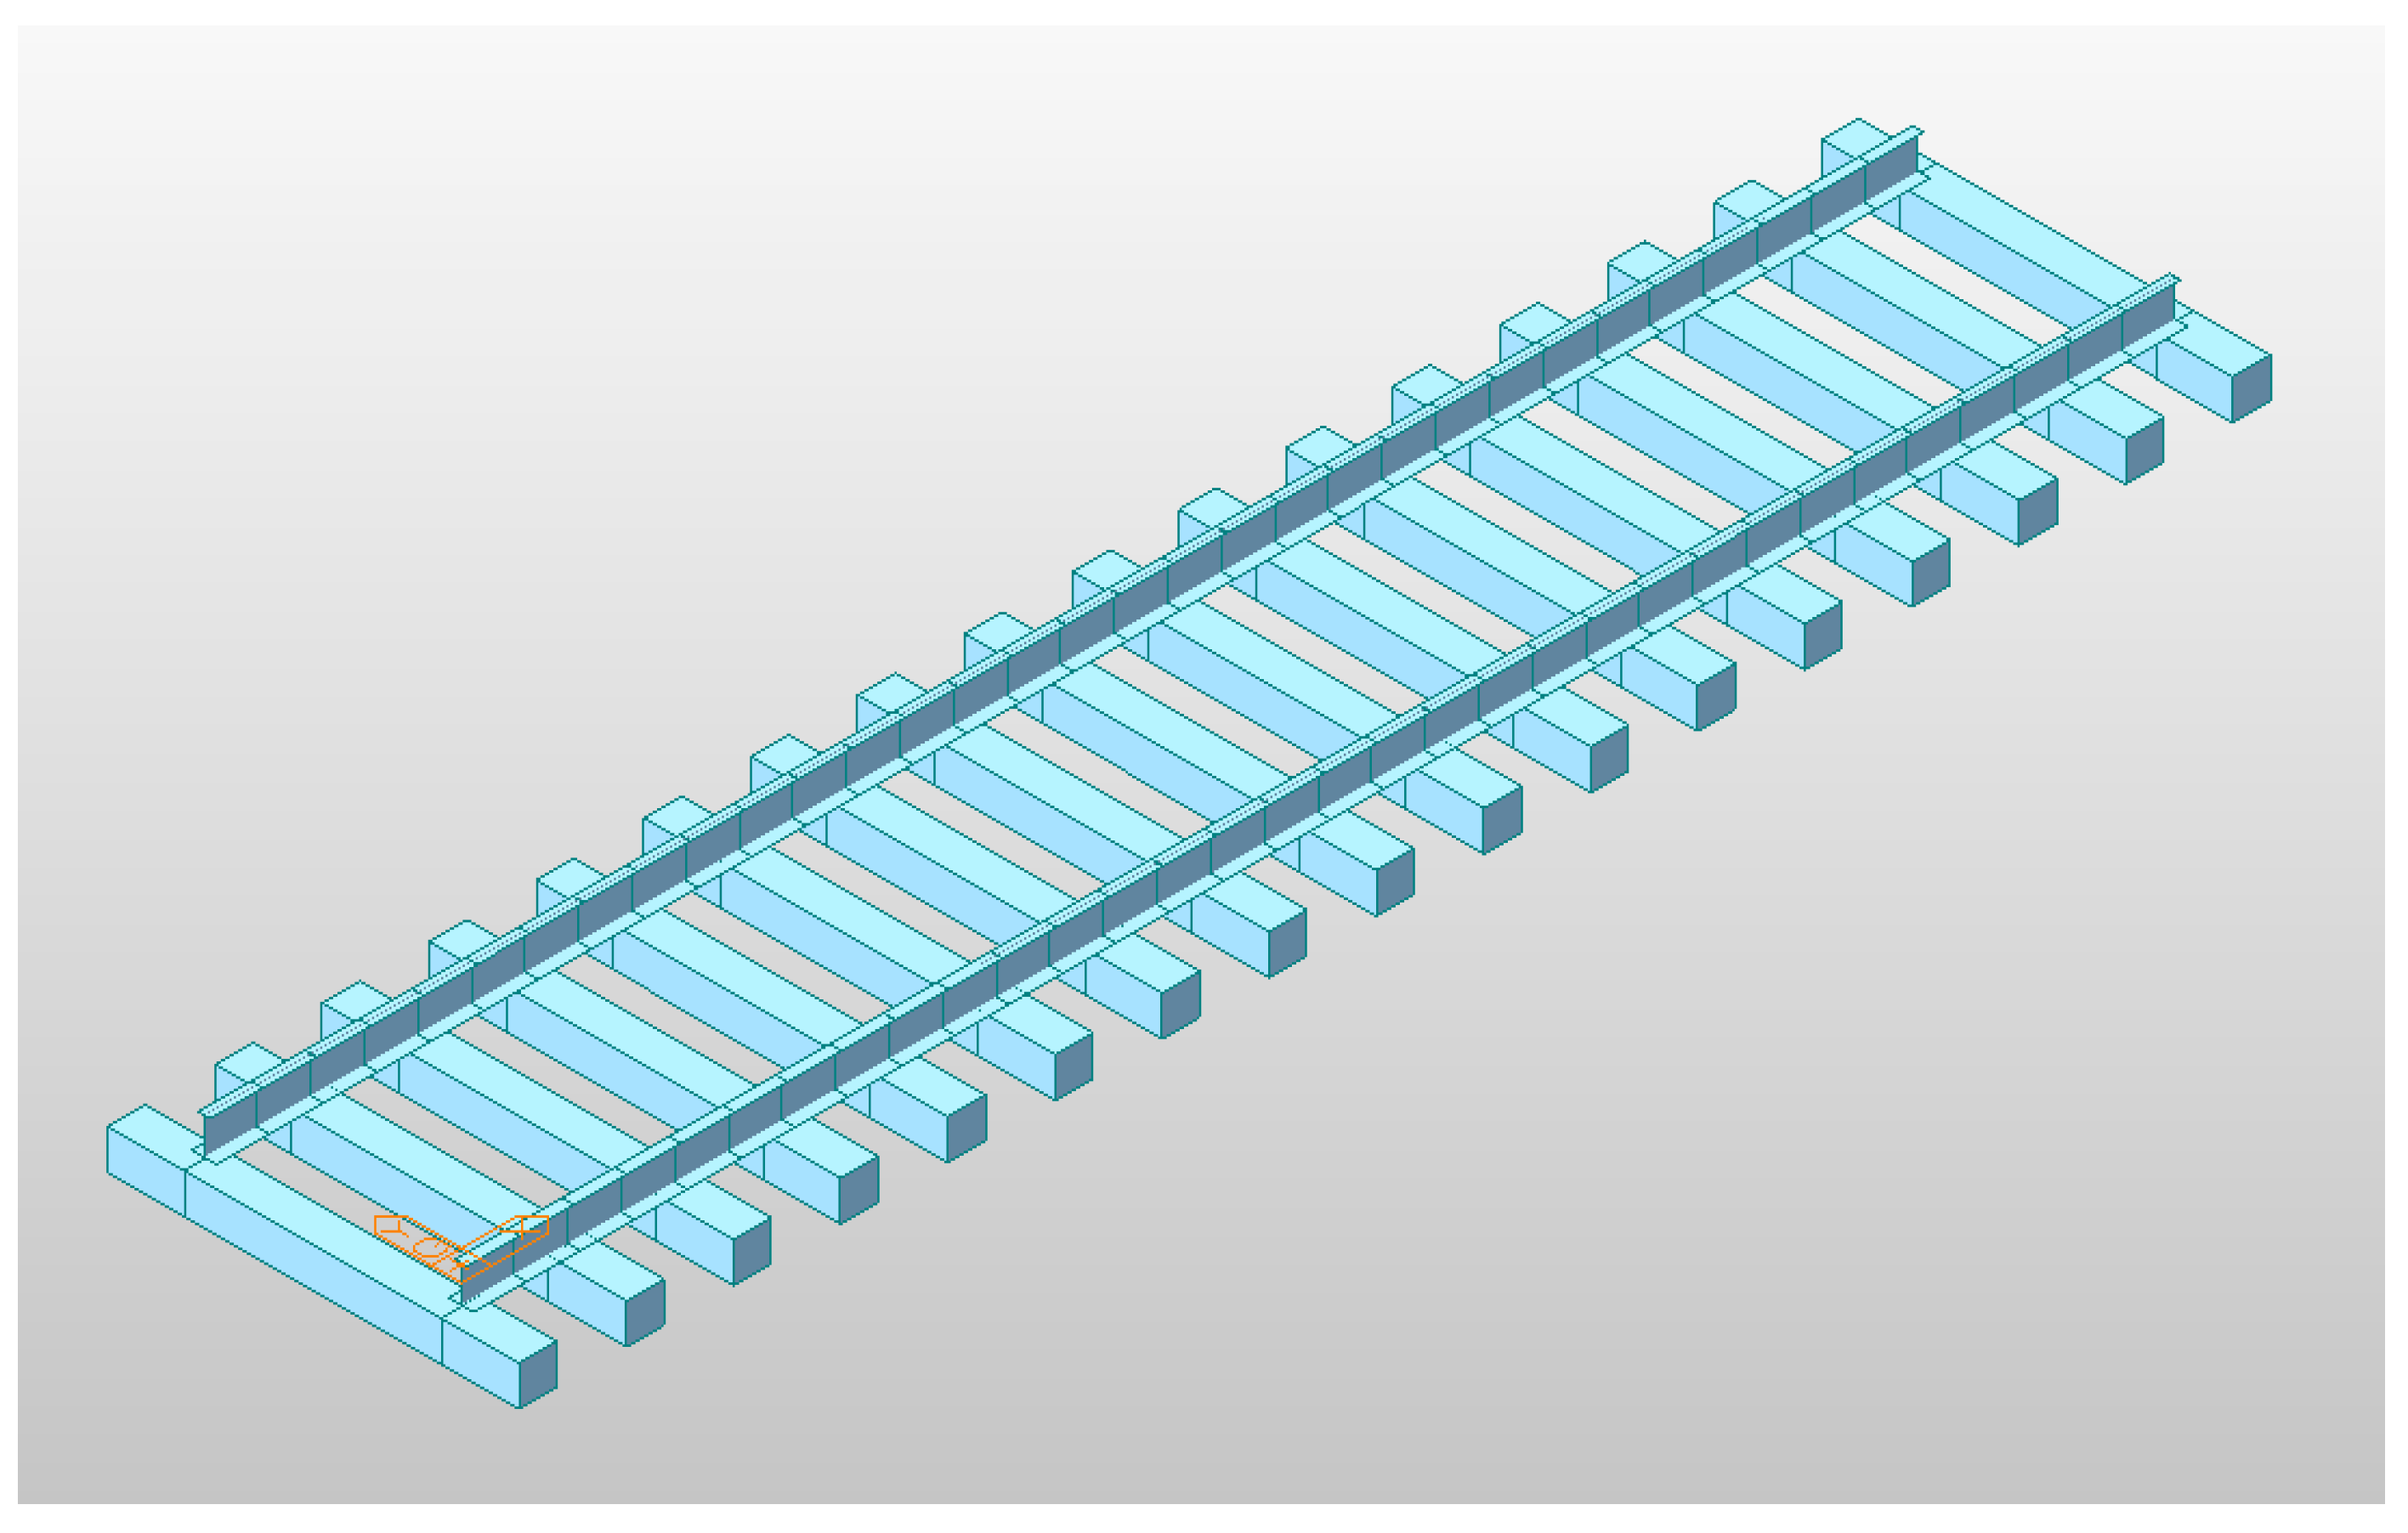
3.3. Finite Element Model Configuration
4. Results and Discussion
4.1. Finite Element Model Results
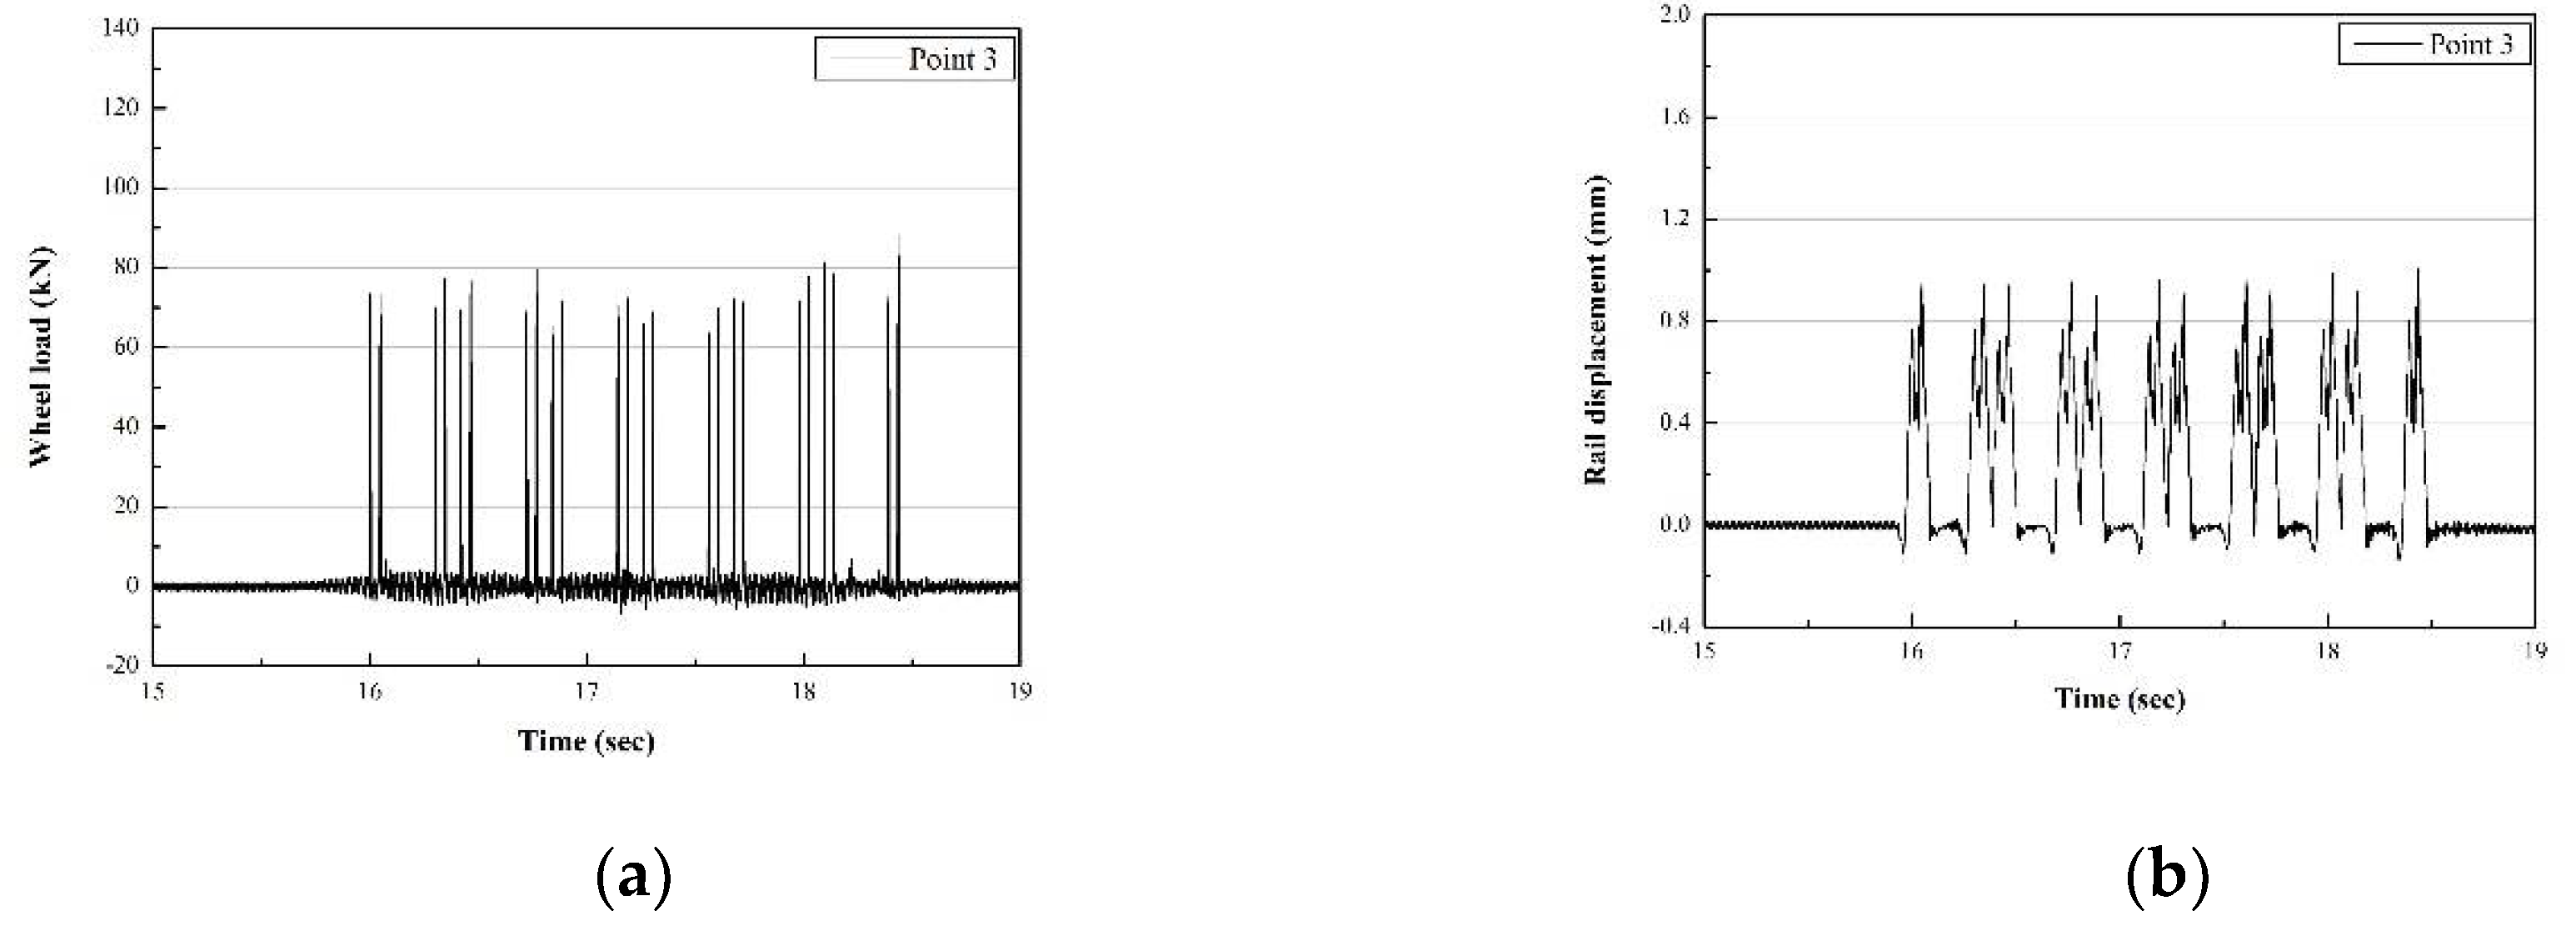
4.2. Field Measurement Results
4.3. Total Spring Constant of the FEM Models and Track Calculation Result
5. Dynamic Factor Calculation Result
6. Result and Conclusions
Author Contributions
Funding
Conflicts of Interest
References
- Kim, J.W.; Kim, M.C.; Park, Y.G. An Experimental Study on the Evaluation of Track Impact factor on the Various Track Type in Urban Transit. In Proceedings of the KSR Conference; The Korean Society for Railway: Seoul, Korea, 2011; Volume 24, pp. 12–23. [Google Scholar]
- Noh, G.T.; Lim, H.J.; Lee, J.Y.; Park, Y.G. Evaluation of Track Support Stiffness and Track Impact factor for Ballast and Concrete Type Tracks. Korean Soc. Railw. 2018, 21, 389–395. [Google Scholar] [CrossRef]
- LEE, S.H. A Study for Correlation of Track Support Stiffness and Track Impact Factor According by Track Structures. Ph.D. Thesis, Seoul National University of Science and Technology, Seoul, Korea, 2017. [Google Scholar]
- Shin, D.U.; Park, Y.G. Analysis of Noise Reduction Effect of Concrete Slab by the Sound Absorption Block in Urban Railway. Spring Academic Conference, Korean Society Railway. 2017. Available online: https://dbpia.co.kr/journal/articleDetail?nodeId=NODE07266383 (accessed on 17 December 2019).
- Choi, J.Y.; Park, Y.G.; Lee, S.M. The Evaluation of Track Impact Factor on the Various Track Type in Urban Transit. Korean Soc. Railw. 2011, 143, 248–255. [Google Scholar] [CrossRef]
- Park, H.S.; Song, B.H.; Choi, J.Y.; Kim, M.C.; Park, Y.G. A study on the Track Impact factor for Curved Ballast Track According to Cant excess or deficiency. In Proceedings of the Autumn Conference of Korean Society for Railway 2015, Yeosu, Korea, 15 August 2015; pp. 929–933. [Google Scholar]
- Van Dyk, B.J.; Dersch, M.S.; Edwards, J.R.; Ruppert Conrad, J., Jr.; Barkan Christopher, P.L. Evaluation of Dynamic and Impact Wheel Load Factors and their 3 Application for Design, TRB 14-4714. In Proceedings of the Transportation Research Board 93rd Annual Meeting, Washington, DC, USA, 12 January 2013. [Google Scholar]
- Pita, A.L.; Teixeira, P.L.; Robuste, F. High speed and track deterioration: The role of vertical stiffness of the track. Proc. Inst. Mech. Eng. Part F J. Rail Rapid Transit 2004, 218, 31–40. [Google Scholar] [CrossRef]
- Bisadi, M.; Ma, Q.; Beskyroun, S. Evaluation of the dynamic amplification factor for railway bridges subjected to a series of moving mass. In Proceedings of the 5th International Conference on Computational Methods in Structural Dynamics and Earthquake Engineering Methods in Structural Dynamics and Earthquake Engineering, Crete Island, Greece, 25–27 May 2015. [Google Scholar] [CrossRef]
- Kouroussis, G.; Cauchetuer, C.; Kinet, D.; Alexandrou, G. Review of Trackside Monitoring Solutions: From Strain Gages to Optical Fibre Sensors. Sensors 2015, 15, 20115–20139. [Google Scholar] [CrossRef] [PubMed]
- Zhao, X.; Yang, J.; An, B.; Liu, C.; Cao, Y.; Wen, Z.; Jin, X. Determination of dynamic amplification factors for heavy haul railways. Proc. Inst. Mech. Eng. Part F J. Rail Rapid Transit 2016, 232, 514–528. [Google Scholar] [CrossRef]
- Youliang, D.; Gaoxin, W. Evaluation of Dynamic Load Factors for a High-Speed Railway Truss Arch Bridge. Shock Vib. 2016, 2016. [Google Scholar] [CrossRef]
- Priest, J.A.; Powrie, W. Determination of Dynamic Track Modulus from Measurement of Track Velocity during Train Passage. J. Geotech. Geoenviron. Eng. 2009, 135, 1732–1740. [Google Scholar] [CrossRef]
- Arnold, R.; Lu, S.; Hogan, C.; Farritor, S.; Fateh, M.; El-Sibaie, M. Measurement of vertical track modulus from a moving railcar. In Proceedings of the 2006 American Railway Engineering and Maintenance-of-Way Association Annual Conference, Louisville, KY, USA, 17–20 September 2006. [Google Scholar]
- Korea Rail Network Authority (KR). KR C-14080: Interaction between Track, Vehicle, Signal, Structure, Electricity; Railway Industry Information Center: Seoul, Korea, 2012. [Google Scholar]
- Celestin, N. Influence of Spatial Variations of Railroad Track Stiffness and Material Inclusions of Fatigue Life. Ph.D. Thesis, University of Nebraska, Lincoln, NE, USA, 2015. [Google Scholar]
- Sanudo, R.; Dell’Oli, L.; Casado, J.A.; Carrascal, I.A.; Diego, S. Track transitions in railways: A review. Constr. Build. Mater. 2016, 112, 140–157. [Google Scholar] [CrossRef]
- Frohling, R.D. Deterioration of Railway Track Due to Dynamic Vehicle Loading and Spatially Varying Track Stiff-Ness. Ph.D. Thesis, University of Pretoria, Pretoria, South Africa, 1997. [Google Scholar]
- Kerr, A.D. On the determination of the rail support modulus k. Int. J. Solids Struct. 2000, 37, 4335–4351. [Google Scholar] [CrossRef]
- Track Design Technical Report (2005); Structural Technical Report (Track Division), Shinbundang Line; Railway Industry Information Center: Seoul, Korea, 2005.
- Track Design Technical Report (2006); Structural Technical Report (Track Division), Seoul city Metro Line 9; Railway Industry Information Center: Seoul, Korea, 2006.
- Track Design Technical Report (2020); Structural Technical Report (Track Division); Railway Industry Information Center: Seoul, Korea, 2020.
- KR C–14060. In Track Components Design; Korea Rail Network Authority: Seoul, Korea, 2019.
- Winkler, E. Die Lehre von der Elasticitaet und Festigkeit mit Besondere Ruecksicht auf ihre Anwendung in der Technik, fuer Polytechnische Schuhlen, Bauakademien, Ingenieure, Maschienenbauer, Architecten, etc.; H. Dominicus: Prague, Czech Republic, 1867. [Google Scholar]
- Jenks, C.W. Design of Track Transitions; Transportation Research Board: Washington, DC, USA, 2006. [Google Scholar]
- Henrik, L. Transition Zones between Ballasted and Ballastless Tracks, Lunds University. 2014. Available online: http://lup.lub.lu.se/luur/download?func=downloadFile&recordOId=4498421&fileOId=8961741 (accessed on 9 January 2020).
- KR C-14030. In Ballasted Track Structure; Korea Rail Network Authority: Seoul, Korea, 2018.


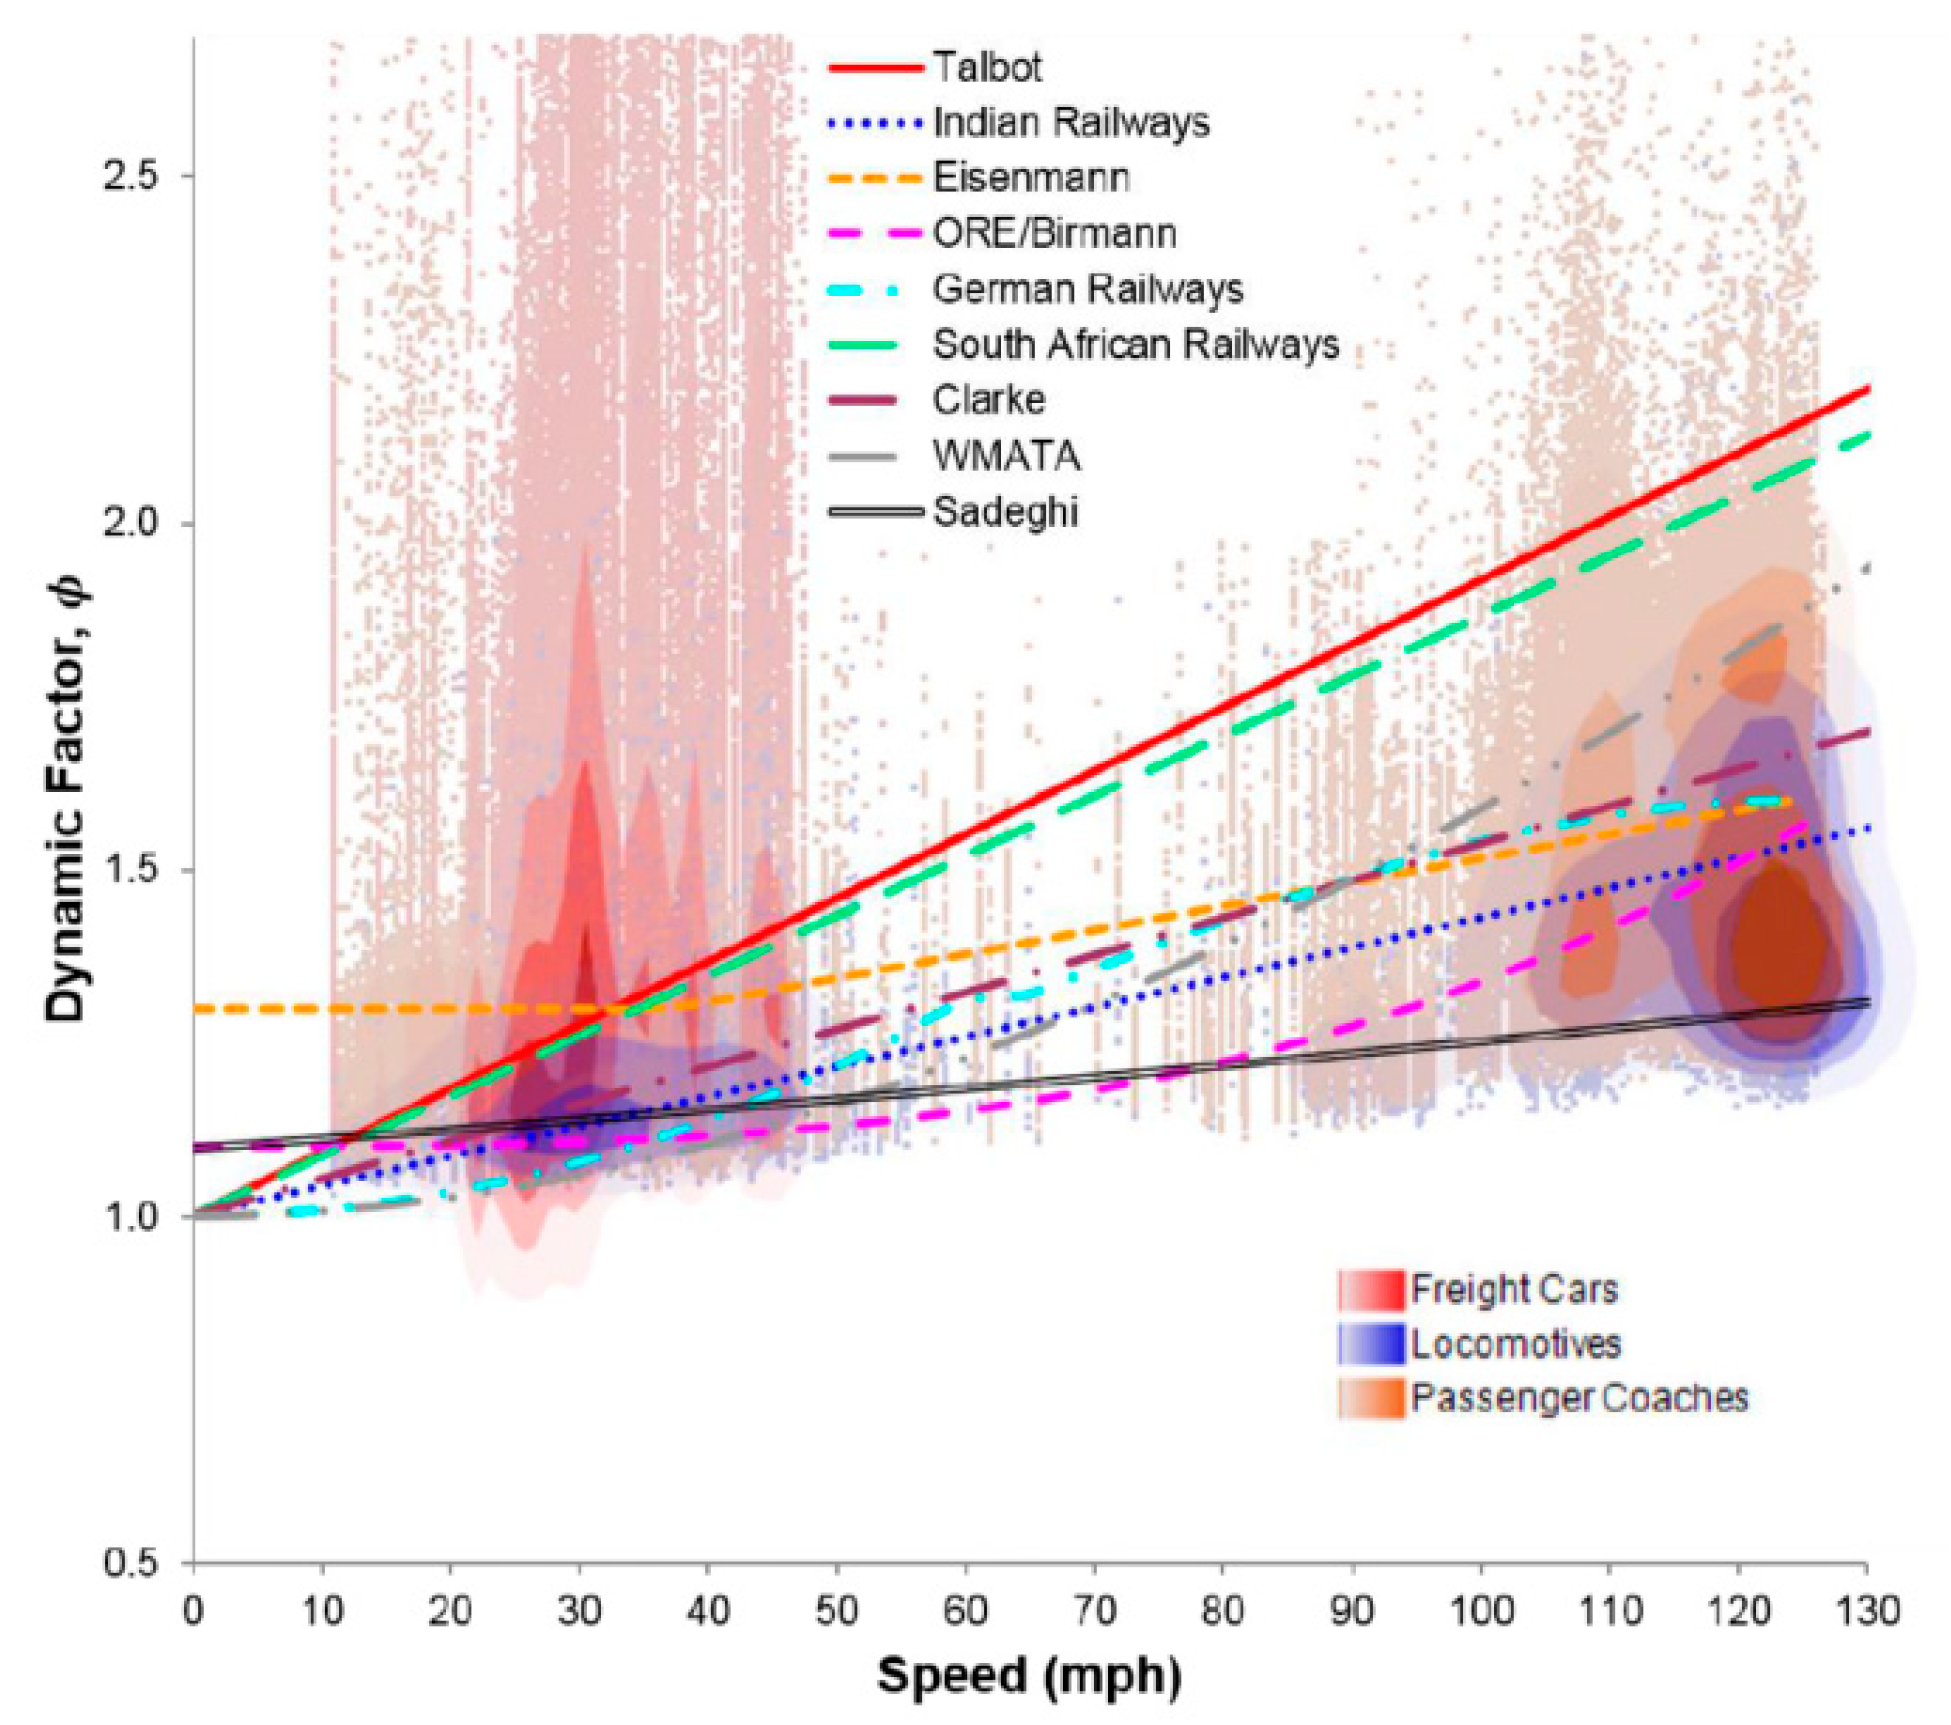
| Evaluation Metric | Talbot | Indian Railways | Eisenmann | ORE/ Bimann | German Railways | South African Railways | Clarke | WMATA | Sadeghi |
|---|---|---|---|---|---|---|---|---|---|
| Precent Exceeding | 0.23 | 0.61 | 0.37 | 0.75 | 0.56 | 0.25 | 0.45 | 0.48 | 0.89 |
| Mean Signed Difference | 0.20 | −0.19 | −0.081 | −0.25 | −0.16 | 0.16 | −0.10 | −0.074 | −0.31 |
| Mean percentage error | 18 | −7.6 | 0.23 | −12 | −5.9 | 16 | −1.9 | −0.38 | −16 |
| Root Mean Square Deviation | 0.61 | 0.53 | 0.51 | 0.57 | 0.56 | 0.59 | 0.52 | 0.57 | 0.57 |
| 0.37 | −0.12 | −0.031 | −0.18 | −0.058 | 0.38 | −0.009 | 0.079 | −0.29 | |
| 0.24 | −0.13 | −0.018 | −0.19 | −0.11 | 0.20 | −0.051 | −0.027 | −0.25 |
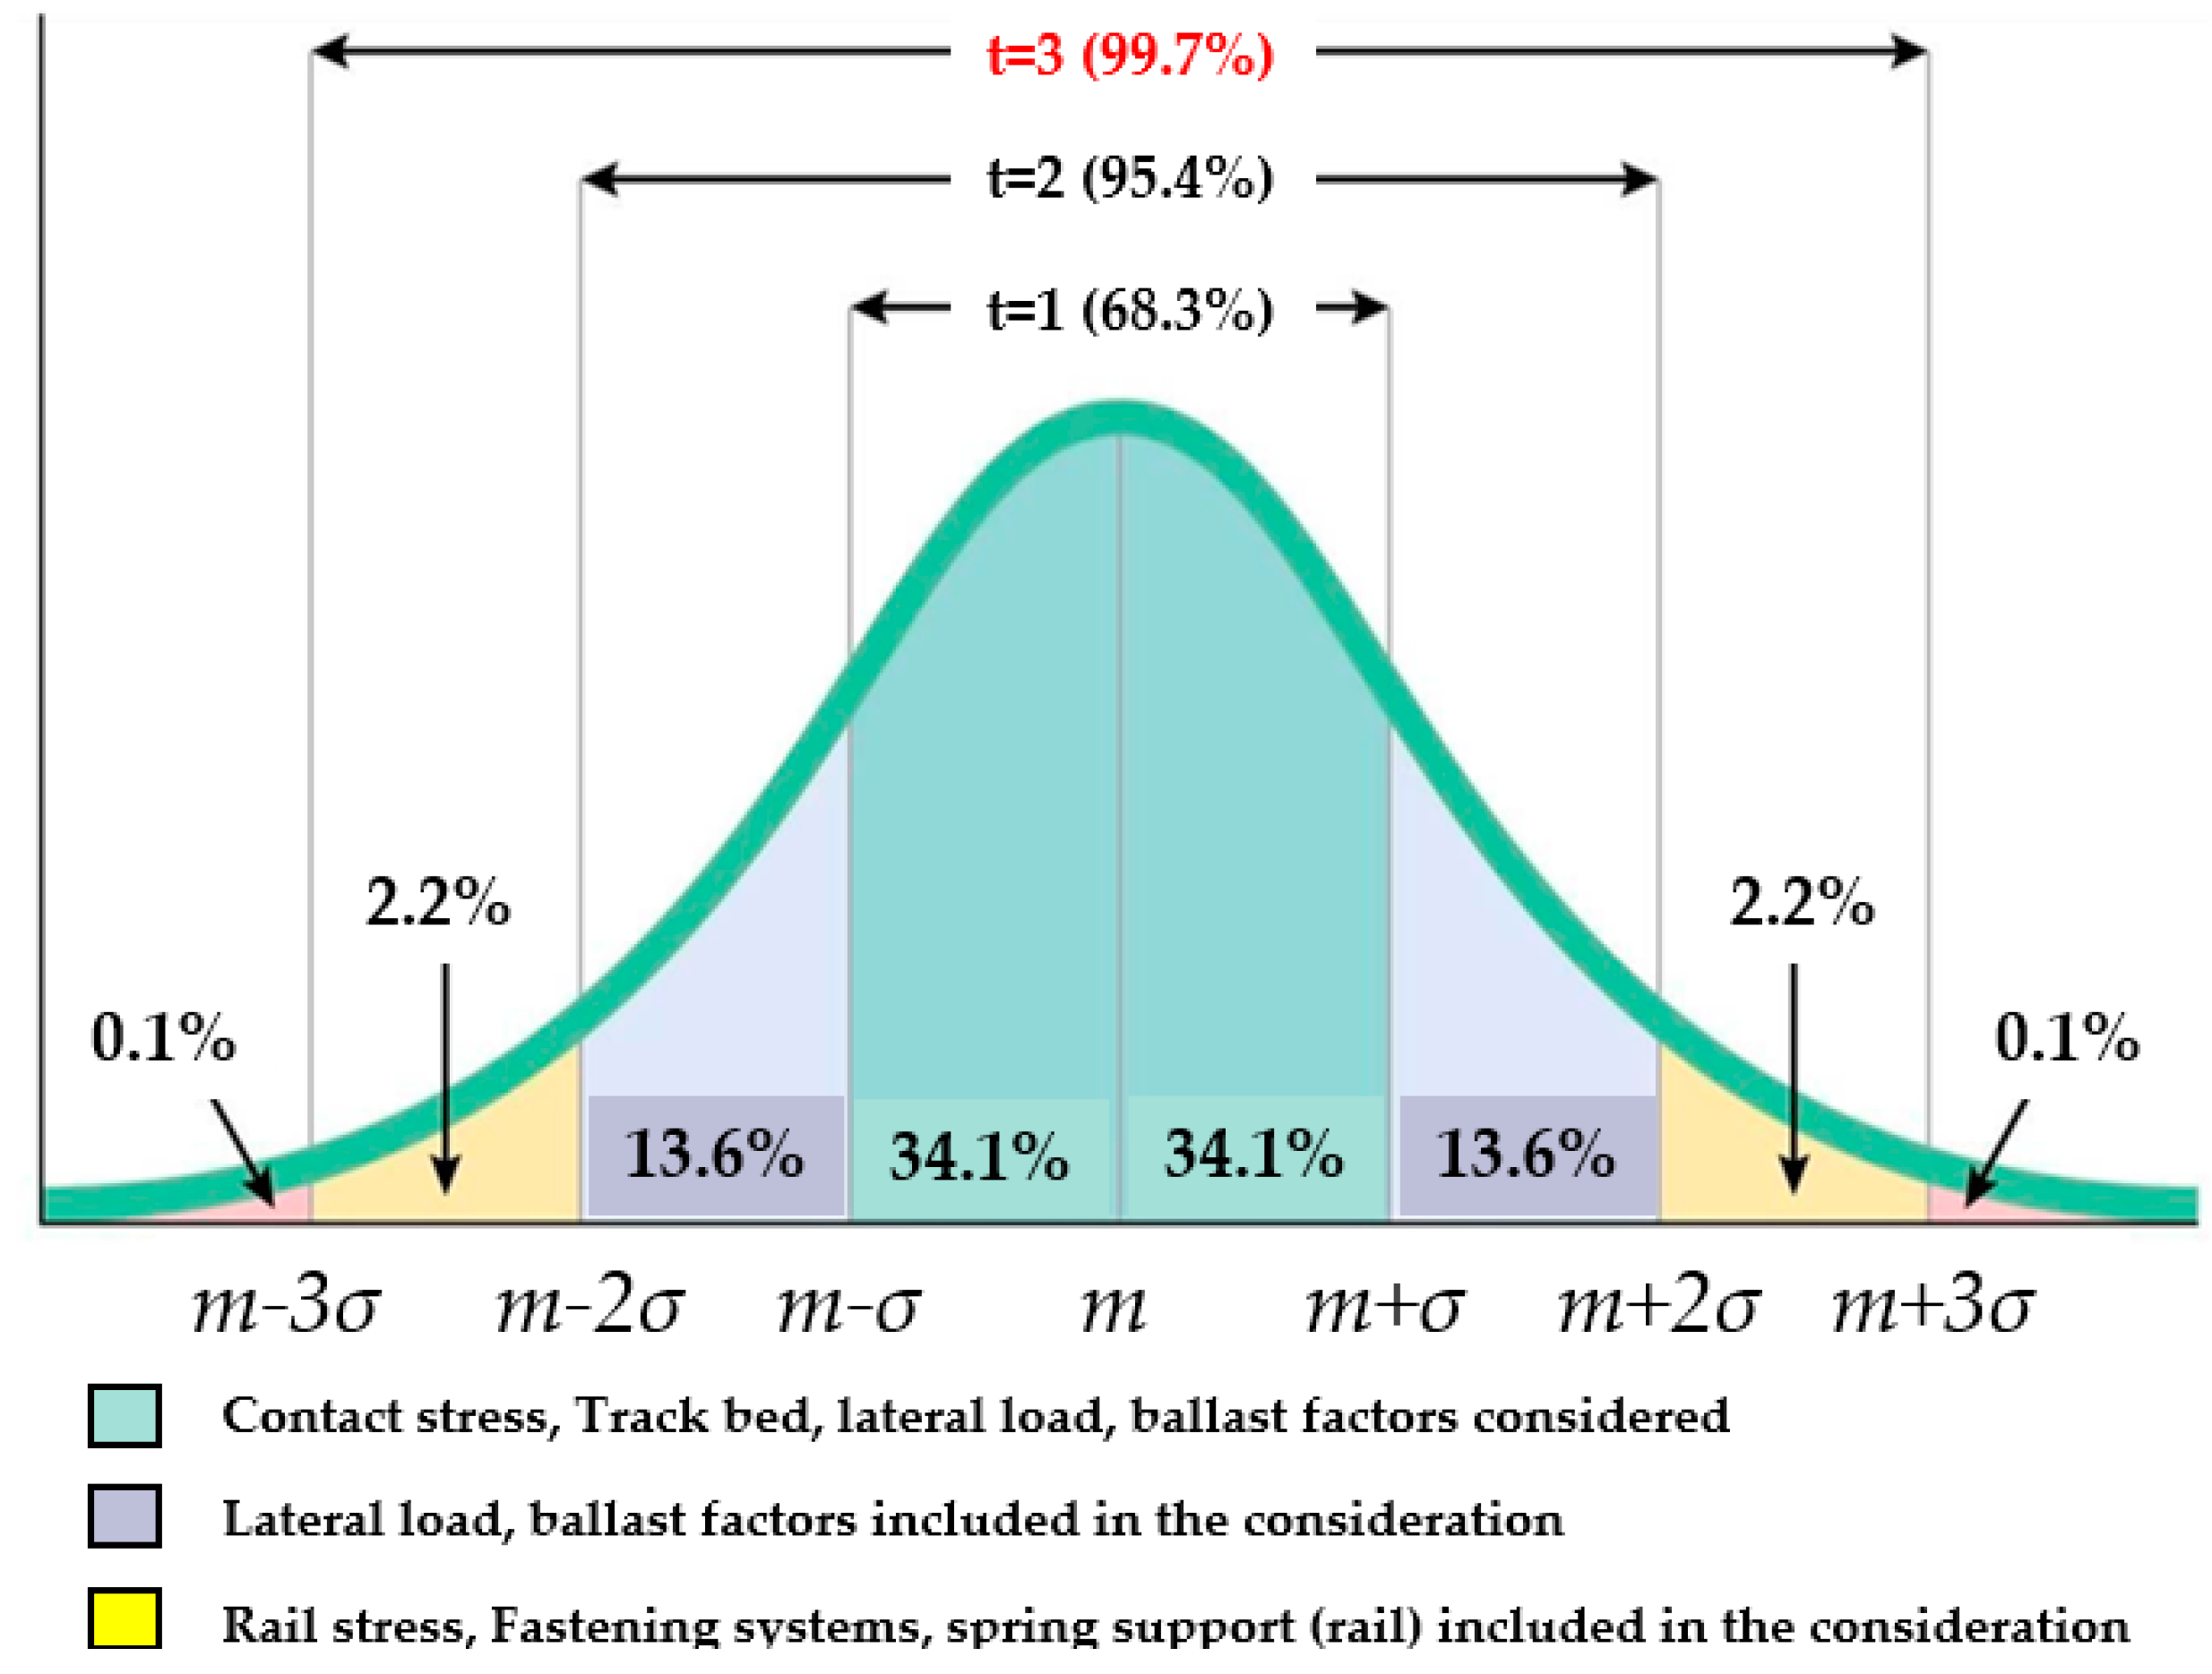
| Exceeding Probability (%) | t | Application | Note |
|---|---|---|---|
| 68.3 | 1 | Contact Stress, Track bed | t: Increase rate of standard deviation that depends on the confidence interval, value 3 is recommended for safety and reliability |
| 95.4 | 2 | Lateral load, Ballast | |
| 99.7 | 3 | Rail stress, Fastening systems, spring support (rail) |
| Track Quality | Φ | Note |
|---|---|---|
| Very good | 0.1 | Φ: Coefficient dependent on track quality |
| Good | 0.2 | |
| Poor | 0.3 |
| Track Types | Track Geometry (Lines) | Structure Type | Fastening System | Track Condition (Φ) |
|---|---|---|---|---|
| Ballasted track | Straight line | Earthwork Tunnel | E-clip | 0.3 |
| Concrete track | Straight line | Bridge Tunnel | System-300 | 0.3 |
| Category | Type | Model | Manufacture Co. | Measurement Item |
|---|---|---|---|---|
| Sensor | 2 axis-strain gauge | FCA-5-11-1L | Tokyo Sokki | Vert./lateral Wheel load |
| 1 axis-strain gauge | FLA-5-11-1L | Tokyo Sokki | Bending stress in rail | |
| Lateral Vertical Displacement Transducer (LVDT) | CDP-10 (10mm) | Tokyo Sokki | Vert./lateral dis. of rail, Vert. Dis. of sleeper | |
| Measurement instrument | Data acquisition device for dynamic responses | MGC plus | HBM | |
| SDA-810 (8ch) | Tokyo Sokki | |||
| Bridge box | DB-120 (1ch, 8ch) | Kyowa | ||
| Laptop | Windows 10 | Samsung |
| Division | Vehicle Specification (KTX) | Full Length (mm) | 2970 |
|---|---|---|---|
| Control method | VVVF(Variable Voltage Variable Frequency control) - IGBT(Insulated/Isolated Gate Bi-polar Transistor) | Max. speed (km/h) | 305 |
| Vehicle formation | PC1-T1-T2-T3-T4-T5-T6-T7-T8-PC2 PC: Power Car, T: Trailer car | Design max. speed (km/h) | 330 |
| Weight | Curb weight: 403ton, Full weight: 434ton | Gauge (mm) | 1435 |
| Whole length (m) | 201.00 | Design wheel load (kN) | 85 |
| Division | Element | Item | Input Data |
|---|---|---|---|
| Rail | 3-dimensional solid element | Type | UIC 60 |
| Modulus of elasticity (kN/mm2) | 206 | ||
| Weight density (kN/m2) | 0.785 | ||
| Poisson’s ratio | 0.30 | ||
| Height (mm) | 172 | ||
| Width of rail head (mm) | 72 | ||
| Width of rail base (mm) | 150 | ||
| Area (mm2) | 76.86 | ||
| X axis moment of inertia (mm2) | 3.05 × 10⁻⁶ | ||
| Z axis moment of inertia (mm2) | 5.13 × 10⁻⁶ | ||
| Tensile strength (N/mm2) | 880 | ||
| Rail pad | 3-dimensional spring-damper element | Height (mm) | 195 |
| Z axis moment of inertia (mm2) | 1.41 × 10⁸ | ||
| Vertical direction stiffness (kw)(kN/mm) | 100 | ||
| Vertical direction of damper coefficient, (kN●sec/mm) | 0.098 |
| Item | Vertical Rail Displacement (mm) | |||
|---|---|---|---|---|
| Track Types | Speed (km/h) | Finite Element Analysis | Field Measurement Data | |
| Min. | Max. | |||
| Ballasted | 85 | 0.697 | 0.37 | 1.05 |
| 95 | 0.706 | 0.43 | 1.09 | |
| 155 | 0.749 | 0.41 | 1.07 | |
| 185 | 0.760 | 0.57 | 1.11 | |
| 195 | 0.767 | 0.62 | 1.18 | |
| 205 | 0.772 | 0.51 | 1.13 | |
| Concrete | 85 | 1.154 | 0.42 | 0.98 |
| 95 | 1.162 | 0.49 | 1.01 | |
| 155 | 1.215 | 0.58 | 1.28 | |
| 185 | 1.238 | 0.62 | 1.24 | |
| 195 | 1.247 | 0.71 | 1.12 | |
| 205 | 1.256 | 0.83 | 1.08 | |
| Speed (km/h) | Wheel Load (kN) | ||
|---|---|---|---|
| Concrete and Ballasted FEM () | Ballasted Track Field Measurement | Concrete Track Field Measurement | |
| 85 | 139.32 | 94.21 | 89.34 |
| 95 | 141.36 | 101.9 | 87.41 |
| 155 | 148.75 | 97.89 | 88.24 |
| 185 | 152.75 | 125.3 | 95.82 |
| 195 | 154.11 | 124.3 | 98.1 |
| 205 | 155.47 | 123.2 | 101.3 |
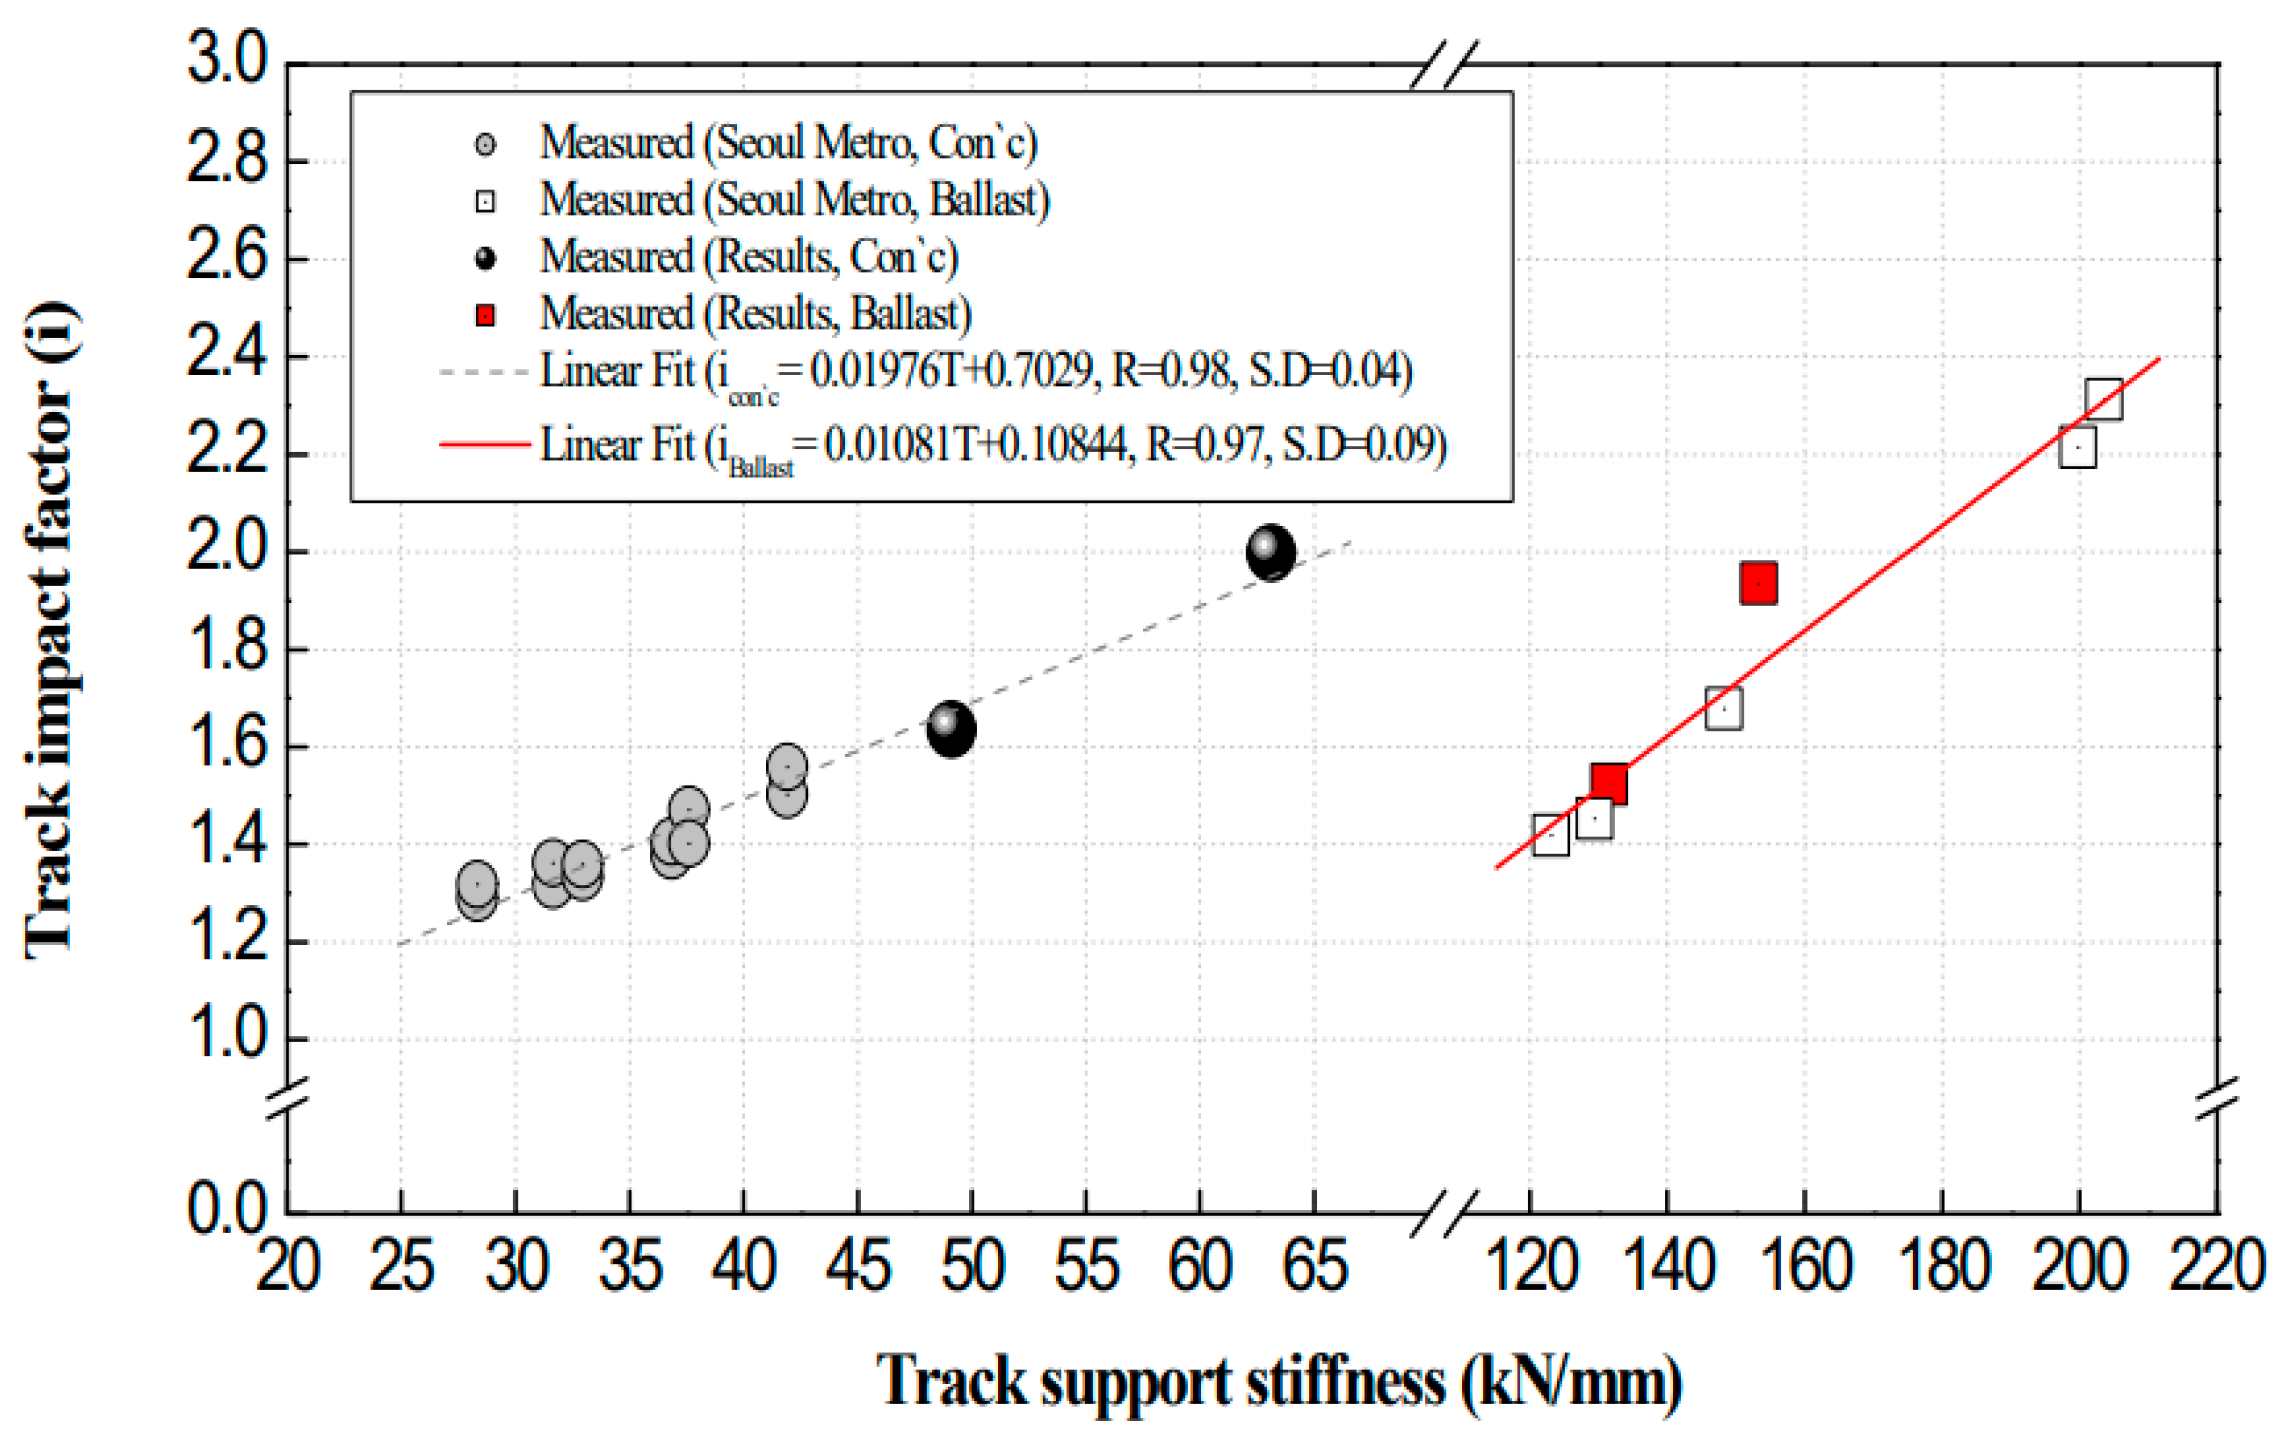
| Train Speed (km/h) | Wheel Load (kN) | Vertical Rail Displacement (mm) | Total Spring Constant of Track (kN/mm) |
|---|---|---|---|
| 85 | 139.32 | 0.697 | 199.88 |
| 95 | 141.36 | 0.706 | 200.23 |
| 155 | 148.75 | 0.749 | 198.59 |
| 185 | 152.75 | 0.760 | 200.98 |
| 195 | 154.11 | 0.767 | 200.93 |
| 205 | 155.47 | 0.772 | 204.38 |
| Train Speed (km/h) | Wheel Load (kN) | Vertical Rail Displacement (mm) | Total Spring Constant of Track (kN/mm) |
|---|---|---|---|
| 85 | 139.32 | 1.154 | 120.72 |
| 95 | 141.36 | 1.162 | 121.65 |
| 155 | 148.75 | 1.215 | 122.42 |
| 185 | 152.75 | 1.238 | 123.38 |
| 195 | 154.11 | 1.247 | 123.58 |
| 205 | 155.47 | 1.256 | 123.78 |
| Train Speed (km/h) | Wheel Load (kN) | Vertical Rail Displacement (mm) | Total Spring Constant of Track (kN/mm) |
|---|---|---|---|
| 85 | 94.21 | 1.05 | 89.72 |
| 95 | 101.9 | 1.09 | 93.48 |
| 155 | 97.89 | 1.07 | 91.48 |
| 185 | 125.3 | 1.11 | 112.88 |
| 195 | 124.3 | 1.18 | 105.33 |
| 205 | 123.2 | 1.13 | 109.02 |
| Train Speed (km/h) | Wheel Load (kN) | Vertical Rail Displacement (mm) | Total Spring Constant of Track (kN/mm) |
|---|---|---|---|
| 85 | 89.34 | 0.98 | 91.16 |
| 95 | 87.41 | 1.01 | 86.54 |
| 155 | 88.24 | 1.28 | 68.93 |
| 185 | 95.82 | 1.24 | 77.27 |
| 195 | 98.1 | 1.12 | 87.58 |
| 205 | 101.3 | 1.08 | 93.79 |
| Track Structure | Train Speed (km/h) | Static Wheel Load (kN) | Average Wheel Load Fluctuation | Standard Deviation of Wheel Load Fluctuation |
|---|---|---|---|---|
| Ballasted track | 85 | 85 | 1.15 | 0.131 |
| 100 | 1.17 | 0.139 | ||
| 155 | 1.33 | 0.147 | ||
| 185 | 1.47 | 0.186 | ||
| 195 | 1.53 | 0.179 | ||
| 205 | 1.52 | 0.195 | ||
| Concrete track | 85 | 1.13 | 0.127 | |
| 100 | 1.24 | 0.117 | ||
| 155 | 1.26 | 0.144 | ||
| 185 | 1.24 | 0.186 | ||
| 195 | 1.33 | 0.176 | ||
| 205 | 1.38 | 0.153 |
| Track Structure | Speed (km/h) | Dynamic Factor | ||
|---|---|---|---|---|
| DAFArea | DAFEisenmann | DAFField | ||
| Ballasted | 85 | 1.436 | 1.639 | 1.229 |
| 100 | 1.513 | 1.663 | 1.270 | |
| 155 | 1.795 | 1.750 | 1.419 | |
| 185 | 1.949 | 1.797 | 1.499 | |
| 195 | 2.000 | 1.813 | 1.527 | |
| 205 | 2.052 | 1.829 | 1.554 | |
| Concrete track | 85 | 1.436 | 1.639 | 1.263 |
| 100 | 1.513 | 1.663 | 1.347 | |
| 155 | 1.795 | 1.750 | 1.368 | |
| 185 | 1.949 | 1.797 | 1.389 | |
| 195 | 2.000 | 1.813 | 1.410 | |
| 205 | 2.052 | 1.829 | 1.473 | |
Publisher’s Note: MDPI stays neutral with regard to jurisdictional claims in published maps and institutional affiliations. |
© 2020 by the authors. Licensee MDPI, Basel, Switzerland. This article is an open access article distributed under the terms and conditions of the Creative Commons Attribution (CC BY) license (http://creativecommons.org/licenses/by/4.0/).
Share and Cite
Lee, J.; Oh, K.; Park, Y.; Choi, J. Study on the Applicability of Dynamic Factor Standards by Comparison of Spring Constant Based Dynamic Factor of Ballasted and Concrete Track Structures. Appl. Sci. 2020, 10, 8361. https://doi.org/10.3390/app10238361
Lee J, Oh K, Park Y, Choi J. Study on the Applicability of Dynamic Factor Standards by Comparison of Spring Constant Based Dynamic Factor of Ballasted and Concrete Track Structures. Applied Sciences. 2020; 10(23):8361. https://doi.org/10.3390/app10238361
Chicago/Turabian StyleLee, Jaeik, Kyuhwan Oh, Yonggul Park, and Junhyeok Choi. 2020. "Study on the Applicability of Dynamic Factor Standards by Comparison of Spring Constant Based Dynamic Factor of Ballasted and Concrete Track Structures" Applied Sciences 10, no. 23: 8361. https://doi.org/10.3390/app10238361
APA StyleLee, J., Oh, K., Park, Y., & Choi, J. (2020). Study on the Applicability of Dynamic Factor Standards by Comparison of Spring Constant Based Dynamic Factor of Ballasted and Concrete Track Structures. Applied Sciences, 10(23), 8361. https://doi.org/10.3390/app10238361