Abstract
Adequate railway track condition is a prerequisite for safe and reliable railway operation. Many track quality indices (TQIs) have been developed with the aim of assessing the track condition holistically. These indices combine measurement signals of some or all relevant geometry parameters with different mathematical models. In this paper, a selection of important TQIs is evaluated. Using measurement data of a five kilometer track section, the indices are calculated and their properties are discussed. This study reveals that all indices exhibit drawbacks to varying degrees. As a consequence, a new index has been developed—the track quality index of Graz University of Technology (TUG_TQI). Its favorable characteristics are presented by means of the above-mentioned test section. The TUG_TQI combines all relevant track geometry parameters, which are normalized beforehand to eliminate over or underrepresentation of different parameters. Thus, the index reliably describes the overall geometrical track quality.
1. Introduction
High quality of railway tracks is a prerequisite for reliable railway operation [1,2,3,4,5]. The infrastructure quality can be defined by functioning components [6,7,8,9] and smooth track geometry [10,11,12], which is of particular interest as it determines operational safety to a large degree. The high loads of trains, frequently combined with high velocities, inevitably cause a deterioration of the track geometry [13,14]. The defining track geometry parameters—longitudinal level, alignment, gauge, cross level, and twist—thus need to be regularly monitored and compared with threshold levels to detect critical spots in the network. Deeper analyses of the individual parameters enable early detections of critical states and planning of preventive maintenance [15,16,17]. In contrast, if the objective is to describe the general track condition, a collective consideration of the above-mentioned parameters is reasonable. For this purpose, many track quality indices (TQIs) have been developed [18,19]. These TQIs combine the recorded measurement signals in different ways, intended to assess the overall track condition by a single value. Such a holistic view of the track quality is particularly useful to chronologically evaluate the parts of or the entire network. Net-wide time series analyses of TQIs demonstrate whether the general quality improves, remains in a steady state, or declines. Establishing a reliable quality index is therefore a predestined step for achieving a network condition overview and for supporting the strategic allocation of resources [20]. A TQI combining multiple signals cannot be used for detailed maintenance planning, however, as the information on why the index indicates poor track quality is lost during the process of aggregating the different input parameters.
The first part of this paper is devoted to a literature research of existing track quality indices, describing the geometrical track condition. Total of 14 indices that are applied by railway infrastructure managers in different countries are presented, including brief descriptions and the respective mathematical formulas. Subsequently, all the indices are calculated for a real five-kilometer test section. The results are plotted together with the input signals of this section, which visualizes the properties of the different indices.
In the second part of this paper a new index for track geometry—the track quality index of Graz University of Technology (TUG_TQI)—is presented. This newly developed TQI has the aim of eliminating the inherent weaknesses of existing indices, which the literature study reveals. The TUG_TQI is an evolution of the track quality index of the Federal Railroad Administration (FRA TQI) and incorporates aspects of other indices to form an optimized, universally applicable track quality index. To validate and visualize its positive characteristics, the index is calculated and plotted for the previously introduced test section.
2. Literature Study
Railway track condition can be evaluated in different ways, such as visual inspections or manual measurements with portable tools, which is still the main method for turnout monitoring [16]. Open tracks, however, are typically inspected today with monitoring cars, which facilitate periodic net-wide condition evaluations [21,22]. These monitoring cars measure multiple parameters concerning track geometry, the most relevant of which are presented in Table 1 [23].

Table 1.
Overview of the main track geometry parameters [23].
Measurements of the above-mentioned parameters constitute the input for all analyzed track quality indices, where either the raw signal or derivates of these signals are processed. Such derivates of the individual signals are further referred to as individual track quality indices (individual TQIs). An aggregation of several individual TQIs delivers the final TQI, which in this paper is designated holistic track quality index.
Using the combined standard deviation CoSD [10] (Section 2.2.2) as an example, the two terms individual TQI and holistic TQI can be clarified. First, the individual TQIs, i.e., the standard deviations (SD, σ) of longitudinal level, alignment, track gauge, and cross level, are calculated according to (1).
Combining these individual track quality indices (standard deviations) yields the combined standard deviation, i.e., the holistic TQI (2).
2.1. Calculation Parameters
When calculating a track quality index (individual TQI and/or holistic TQI), two calculation parameters strongly affect the outcome: the type of computation and the selected influence length [24]. The following two sub-sections describe these influencing factors.
2.1.1. Computation Type
In the computation context, two methods can be distinguished: discrete and moving [10]. A discrete calculation divides the analyzed section into segments of equal length (influence length; Section 2.1.2) and the TQI is calculated separately for each segment. A moving calculation calculates one TQI-value for every cross section. Around the first cross section i, a segment is spanned, extending half the influence length in both directions. All data points within the segment are used to calculate the TQI, which is assigned to point i. Then the segment is shifted one point and the process is repeated for cross section i + 1.
The differences between the two computation types are illustrated in Figure 1. The plot shows the longitudinal level (left rail) of the test section as well as its standard deviation, calculated in a moving and a discrete manner with an influence length of 100 m. The moving standard deviation depicts the signal characteristics better while the discrete calculation shows directly which 100 m segments require maintenance earlier than others.
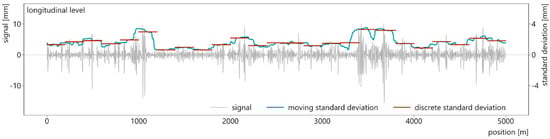
Figure 1.
Comparison of discrete and moving calculation of track quality indices at the example of the standard deviation.
2.1.2. Influence Length
The second important calculation parameter is the length of the considered segments [24]. The influence length determines how many measurement points are included in the calculation of the TQI of one segment. Typical values for standard gauge railway lines are 100 m or 200 m [10]. High speed lines may be evaluated with longer segments while narrow gauge lines possibly benefit from shorter influence lengths because of frequently changing track parameters (radii, superstructure type, etc.,) [12].
Greater influence lengths blur short-track irregularities and show a broader picture of track quality. Shorter influence lengths highlight isolated defects and follow the original signal more closely [24]. Figure 2 visualizes the moving standard deviation of the same signal as before (longitudinal level of the test section, left rail), calculated once with a 50-m and once with a 200-m influence length.
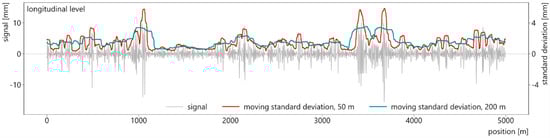
Figure 2.
Moving calculation of track quality indices with different influence lengths at the example of standard deviations.
Constant calculation parameters are the premise for calculating the track quality indices in a time sequence–time series of individual TQIs for maintenance predictions, time series of a holistic TQI for network evaluations. Only if the computation type and the influence length are always identical and the positioning of the input data is exact [24], can correct conclusions be drawn.
2.2. Existing Track Quality Indices
The urge to achieve a holistic assessment of railway infrastructure has given impetus to the creation of many track quality indices [18,25]. Below, relevant TQIs that are frequently cited in the literature are introduced, which include a verbal description of the index and the mathematical expression. Subsequently, all the presented TQIs are calculated for the 5 km test section and plotted together with the underlying measurement data (note: longitudinal level and alignment feature two colors—the lighter color represents the right rail, the darker color the left rail). This graphical illustration presents the characteristics of the TQIs and also highlights their differences. Potentially necessary threshold values or weighting factors are provided in the index description (2.2.1–2.2.14). If available, these values are adopted from the respective literature source; otherwise, intervention limits of the European norm EN 13848-5 are applied. Table 2 presents these intervention limits for the wavelength range D1 (3–25 m) at line speeds of up to 80 [kph] and 120 [kph] respectively, which are relevant for the test section [26].
Table 2.
Intervention limits according to EN 13848-5 [26].
2.2.1. Isolated Defects
The European norm EN 13848-6 suggests using the number of isolated defects as a possibility for rating track quality, particularly with regard to safety. Counting the number of defects along a specified track length can be representative for the general quality of the track. [10]
2.2.2. Combined Standard Deviation
Another TQI proposed in the European norm EN 13848-6 is a weighted combination of the parameters longitudinal level (LL), alignment (AL), track gauge (G), and cross level (CL), which are expressed by their respective standard deviations. Their relative impacts on the CoSD are regulated by weighting factors, specified by the infrastructure manager (test section: wi = 0.25) (2) [10].
2.2.3. MDZ-A Number
The MDZ-a number is used with the intention of describing the effects of track geometry irregularities on passing trains. Thus, the formula combines deviations of the longitudinal level (Δv′), alignment (Δh), and cross level (Δü) and also considers the maximum line speed. The influence of the velocity is reduced via the exponential number 0.65; this factor intents to represent the effects of vehicle suspension. The factor c (test section: c = 1) is a scaling coefficient, and the variable L represents the length of the considered track segment (3) [27,28,29].
2.2.4. The Chinese Track Quality Index
The Chinese track quality index equals the sum of the standard deviations of all track geometry parameters and is calculated over 200 m for conventional railway lines and 500 m for high speed lines (4) [19].
2.2.5. The CN Track Quality Index
The track quality index of Canadian National Railway Company (CN) uses longitudinal level and alignment (both rails separately), gauge and cross level as input. Individual track quality indices for these parameters are calculated according to (5), where C represents the line type (test section: C = 700). The overall TQI is obtained by averaging the individual results (6) [19].
2.2.6. J Coefficient
The J coefficient averages the standard deviations of longitudinal level (SDz), alignment (SDy), twist (SDw), and track gauge (SDe). The influence of the track gauge is reduced by half, which has the aim of mitigating the over-representation of the track gauge in transition elements (see Section 2.3) (7) [30].
2.2.7. Q-Value
The Q-value (Sweden Q [18]) relies on the standard deviations and threshold levels [Table 3], which depend on the track class and ought to guarantee riding comfort. The index considers the longitudinal level (σH) and a combination of alignment and cross level, called interaction (σS). The Q-value is calculated per kilometer track (8). [31]
Table 3.
Limit values applied for the Q-value (Sweden Q) and K-value [32].
2.2.8. K-Value
The K-value requires the same input parameters as the above Q-value plus the alignment and cross level. Over a track section that should extend over at least one kilometer, the total length Σl where all standard deviations undercut the defined thresholds (Table 3) is determined. This length divided by the observed section L yields the K-value, which is expressed in percent (9) [31].
2.2.9. Netherlands Q Index
For a geometry parameter i, the standard deviation of 200 m segments as well as the 80% quantile of the standard deviation over a 5–10 km section are calculated. The 200 m segments are put in dependence of the evaluated section according to (10) (N denotes the Q index for an individual geometry parameter). As a result, the worst 20% of the section, which requires maintenance, can be determined [19].
2.2.10. Track Geometry Index
The track geometry index TGI consists of individual indices for longitudinal level (unevenness index UI), alignment (AI), twist (TI), and track gauge (GI) (11). Besides the standard deviations of the geometry parameters referred to (SDmes), the index also considers target values for track renewals (SDn) and maintenance measures (SDmaint). These target values, which in case of maintenance depend on the line speed, are presented in Table 4. The final TGI averages the individual indices, although longitudinal level (UI) and alignment (AI) get emphasized to reflect their influence on riding quality (12) [12].
where SDmes = standard deviation of measurement data; SDn = target value of the standard deviation for track renewal; and SDmaint = target value of the standard deviation for track maintenance [12].
Table 4.
Threshold levels for the track geometry index (SD in [mm]). [12].
2.2.11. Overall Track Geometry Index
The overall track geometry index OTGI considers standard deviations and mean values of the track gauge signal, which is split into a positive and negative fraction because of differing tolerances, the alignment, the longitudinal level (profile), and the twist (14)–(18). These individual indices are aggregated using line-class-depending importance coefficients a, a′, b, c, d (13) (test section: a = 0.25, a′ = 1.0, b = 0.25, c = 0.13, d = 0.28). [18]
With:
2.2.12. Five-Parameter Track Defectiveness
The W5-index sets the number of isolated defects k in proportion to the total number of recorded measurement values c of the analyzed track section (19). This ratio is calculated separately for the longitudinal level (Wz; average of left and right rail), alignment (Wy; average of left and right rail), track gauge (We), cross level (Wg), and twist (Ww). Subsequently, the results are combined to the overall index according to (20). [33]
2.2.13. Track Roughness Index
The track roughness index, developed by US railroad company Amtrak, divides the squares of measurement deviations di by the number of measurement points n of the respective segment (21). Considered parameters are longitudinal level, alignment, cross level, and gauge [18,34].
2.2.14. FRA Track Quality Index
The Federal Railroad Administration (FRA) defines a track quality index via space curve lengths. The length of the measurement signal Li is calculated for the longitudinal level, alignment, cross level, and gauge over a defined track section (22). This length is put in dependence of the base length L0 which constitutes the theoretical signal length without any track defects (23) [19,35].
2.3. Analysis of the Evaluated Track Quality Indices
Many of the above introduced track quality indices share characteristics: (i) the basic concept, (ii) whether or not all track geometry parameters (Table 1) are considered, and (iii) the necessity of adjustment factors such as calibration or weighting coefficients (not considering constant factors which solely scale the results). Three major groups can be distinguished in the basic concept of the TQIs context: indices based on standard deviations (in Table 5: “sd”), indices converting the number of threshold exceedances (“threshold”), and indices which use other approaches (“miscellaneous”). According to this classification, the analyzed indices are listed in Table 5.
Table 5.
Classification of the analyzed track quality indices (TQIs) according to their basic principles.
Three of the analyzed track quality indices—Isolated defects, K-value, w5—convert the number of threshold exceedances into a TQI. Since indices of this kind merely count the number of defects while disregarding the severity of them, the informative value of these quality figures is limited, regardless of whether raw signals (Isolated defects, w5) or standard deviations (K-value) are evaluated.
With eight examples, the majority of analyzed track quality indices are based on standard deviations: CoSD, Chinese TQI, CN’s TQI, J coefficient, Q-value, Netherlands Q, TGI, and OTGI share this approach. As the standard deviation of a signal depends on the number of defects within the considered segment as well as the amplitudes of the errors, these indices are better suited to rate the overall track quality than indices counting threshold exceedances. A downside of the standard deviation is that it may deliver disproportionately high values for gauge and twist in curves (Section 4, Figure 8). Tight bends frequently exhibit an increased nominal track gauge for improved track guidance [36], while transition elements between straight sections and curves typically feature a rising outer rail to mitigate lateral accelerations, which by default creates a twist [37]. Consequently, the standard deviation of gauge and twist inevitably yields higher (worse) values in these areas, even if track quality is perfect. However, gauge widening and transition elements are technical necessities and a TQI that is intended to rate the overall track condition should not equalize them with track defects.
The remaining indices—MDZ-a, R², FRA TQI—neither rely on threshold exceedances nor on standard deviations. Instead, they make use of different concepts.
Regarding the utilization of different track geometry parameters, two of the analyzed indices aggregate all signals (Chinese TQI, w5) while others only include a selection of them or do not define it. From a mathematical perspective, merging signals of various parameters (or derivates such as standard deviations) is problematic, since they typically scatter in different amplitude ranges. Thus, signals which permissibly exhibit comparably high absolute values (e.g., longitudinal level) are overrepresented in the final TQI.
Some track quality indices depend on calibration or weighting factors, which are either fix values (e.g., J coefficient), depend on the line speed (e.g., K-value), the track type (e.g., OTGI), or can be set by the infrastructure manager (e.g., CoSD). While for many TQIs reference values for their calibration factors are provided, the exact meaning and determination of these coefficients is often unknown. This hampers the application of the index in other networks.
To evaluate how the analyzed track quality indices perform on real data, each of them is calculated for the 5-km test section and plotted (Figure 3). This ballast track section comprises a sequence of curves and straight segments, which are indicated in the plot by the super elevation. If an index does not specify the required geometry parameters, all signals are included. If an index only defines individual TQIs (e.g., the track roughness index R²), the holistic TQI is assumed to be the average of the individual indices. All calculations are performed with a moving window over 100 m, independent of possible guidelines of the TQIs (different computation settings would distort the results). Most indices indicate good track quality by low values and vice versa. Indices behaving in a contrary manner are multiplied by −1 so that all curves are lower in areas of better and higher in areas of worse track quality. The results are then z-transformed (the mean value is set to 0, the standard deviation is set to 1) and shifted along the y-axis until the lowest value (best quality) equals zero. This process ensures all indices feature similar value ranges while keeping their characteristics, thus enabling qualitative comparisons.
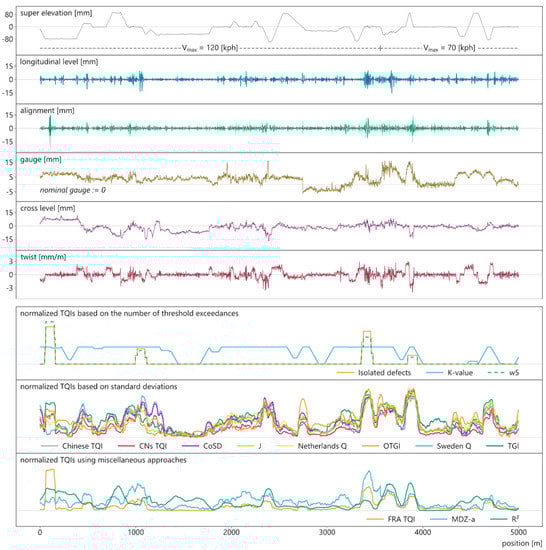
Figure 3.
Measurement data and normalized track quality indices of the 5-km test section.
3. Methodology
The analysis of relevant track quality indices and their application on a test section (Section 2.3) demonstrates that existing indices exhibit disadvantages to varying degrees. Consequently, a new TQI is proposed, aiming to improve this situation. Thus, the following criteria are defined with which the new TQI must comply:
- The index must describe the overall geometrical quality of the track, which includes both peak values and scattering of the individual signals.
- The index must rely on physical and objective principles while avoiding subjective weighting factors.
- The index must enable the combination of all main track geometry parameters (Table 1).
- The index must be universally applicable for different types of track, varying line speeds, and different nominal track gauges.
- The index must not be negatively affected by gauge widening in curves and intended twist in transition elements.
- The index must be easy to understand and should be simple to implement.
Among the analyzed track quality indices, the index of Federal Railroad Administration (FRA TQI) already fulfils the above criteria to a substantial extent. This index thus forms the basis of the track quality index of Graz University of Technology (TUG_TQI; TUG = Technische Universität Graz).
The principle of the FRA TQI, and therefore of the TUG_TQI, is calculating the space curve length Li of a measurement signal. This length is put in relation to the base length L0, which represents the theoretical situation of a perfect track without any irregularities. The more irregularities occur on a segment and the higher their amplitudes are, the longer the space curve length Li is. Consequently, the resulting index will also be higher (Figure 4). [33,35]
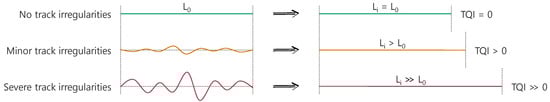
Figure 4.
Principle of the TUG_TQI (adapted from [33]).
The TUG_TQI is calculated in seven subsequent steps, which are depicted in Figure 5. Measurement signals of all main track geometry parameters are used as input data.
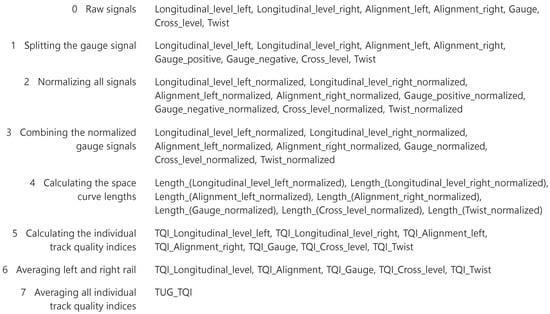
Figure 5.
Workflow depicting the compilation of the TUG_TQI.
In a first step, the gauge signal is dissected into a positive and a negative part along the zero line. This is a necessary preparatory work for the subsequent normalization process, because of the different threshold levels for positive and negative measurements (gauge narrowing and gauge widening). Next, all measurement signals are normalized with respect to a predefined threshold level, e.g., the intervention limits of EN 13848-5 [26] as in this paper. Only then can signals featuring different units and value ranges be combined to a holistic index without weighting factors. For example, the longitudinal level [mm] has less strict tolerances in absolute terms than the twist [mm/m] and therefore typically exhibits higher amplitudes. The affect a longitudinal level signal has on a combined index would thus be stronger, while a certain twist value, even if lower in its absolute value, might be significantly more critical for the overall track quality. In order to normalize the signals, the measurement values are divided by their absolute threshold values. Different threshold levels (e.g., alert level versus intermediate action level [26]) increase or decrease the TQI while its characteristics remain largely constant. Because of the normalization process, the TUG_TQI is calculated with utilization levels rather than signal amplitudes, and it implicitly considers the maximum line speed, which (co-) defines the threshold values. Figure 6 illustrates the normalization process by means of the split gauge signal.
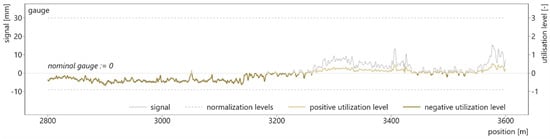
Figure 6.
Splitting and normalizing the gauge signal.
After combining the positive and negative normalized gauge signals, fictive space curve lengths Li for all the geometry parameters are calculated, using the normalized measurement values (24). Subsequently, the individual TQIs for all signals are calculated according to (25). In principle, this formula determines the elongation of the signal as a result of track irregularities. The factor 108 only scales the results into an easily interpretable value range. In the second-last step, which only applies to longitudinal level and alignment, the individual TQIs of the left and right rail are averaged. Thus, these two geometry parameters have the same impact on the combined TQI as all other. Finally, the five individual indices—TQI_Longitudinal_level, TQI_Alignment, TQI_Gauge, TQI_Cross_level, TQI_Twist—are combined, which constitute the track quality index of Graz University of Technology (TUG_TQI) (26).
where i = track geometry parameter; j = measurement point index; m = number of considered measurement points (depending on influence length and sample rate); n = number of included geometry parameters; x = track position of measurement point j in mm; yij = normalized measurement value of parameter i at position j; L0 = theoretical base length (influence length) in mm; Li = space curve length of parameter i; TQIi = individual track quality index of parameter i; and TUG_TQI = track quality index of Graz University of Technology.
4. Results and Discussion
In this section, the track quality of Graz University of Technology (TUG_TQI) is applied on the introduced 5-km test section (Figure 7), thus providing a visual representation of the methodology. By means of this graph, the qualities of the new index are then discussed. The plot includes measurement signals of the track section, the individual indices of the geometry parameters, and the holistic TUG_TQI.
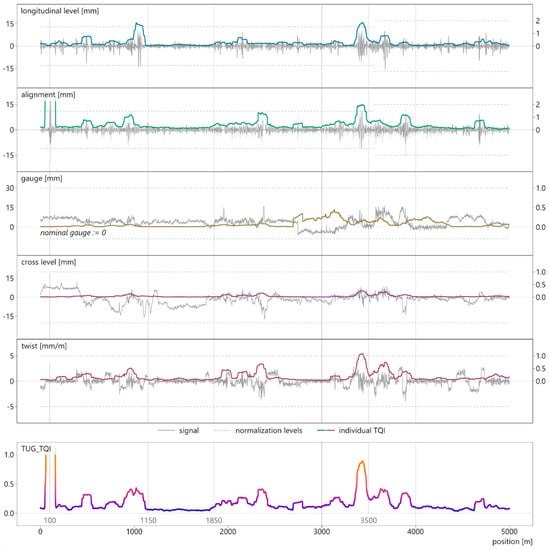
Figure 7.
Measurement signals (primary y-axis) with their respective indices (secondary y-axis) and TUG_TQI, calculated for the 5-km test section.
The TUG_TQI is well-suited to describe the overall geometrical track quality, as it incorporates all characteristics of the individual indices. The differences between better and worse track quality can be observed in the example of the longitudinal level. The index delivers low values from km 1.150 to km 1.850, where the raw signal shows good track quality. By contrast, at around km 3.500, the input signal scatters in a high amplitude range. Consequently, the TQI_Longitudinal_level features higher values in this area, which represents worse quality. Similar characteristics can be observed in the alignment index, which additionally reveals another aspect of the quality index. Not only does it accurately depict alignment issues over longer track sections, but it also reacts to isolated defects, as the spike at km 0.100 proves. The severity of this defect is suspicious and potentially a result of a data measurement error: the input signal exceeds even the intermediate action level (28 mm) by far and inexplicably no other signal shows any abnormality at this position [38]. This example confirms that the methodology also correctly represents isolated defects. The track gauge index underlines the necessity to consider positive and negative gauge values separately, as described in [18]. Although the absolute amplitudes of the input signal reach considerably higher values in the positive range (e.g., between km 3.500 and km 4.000), the corresponding index delivers relatively low values. In contrast, the index takes on significantly higher values in case of track narrowing (e.g., around km 3.000) because of very different threshold levels. The cross level index is continuously low since the input signal scatters in an uncritical value range. In contrast, the twist index locally delivers much higher values. This is also reasonable considering the strict threshold values for this parameter and the partially strong irregularities of the signal. The overall TUG_TQI combines all effects–the isolated defect of the alignment signal at km 0.100, the good quality of all signals between km 1.150 and km 1.850 as well as the geometry issues around km 3.500. For visualization reasons, the TQI is cut off at 1.0; otherwise, the isolated defect at km 0.100 would distort the plot and make the remaining curve uninterpretable.
Arguably the most widely used indices to describe the geometrical track condition are standard deviations (SD). The standard deviation is thus consulted as the benchmark for TUG_TQI. Using track data from another European railway network, SD and TUG_TQI are calculated and directly compared. Figure 8 visualizes the results of the longitudinal level, for which SD and TUG_TQI deliver similar results, and the twist, where the two methodologies partly differ. The resulting curves are z-transformed and shifted along the y-axis until their lowest values equal zero (see Section 2.3).
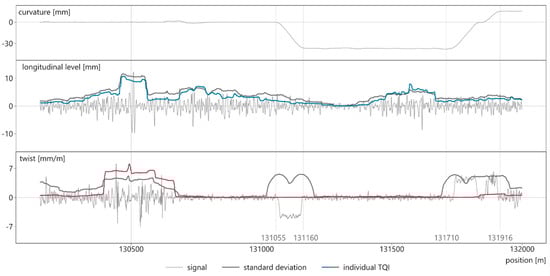
Figure 8.
Comparison of normalized standard deviations and individual TUG_TQIs of the longitudinal level and twist signal.
The uppermost signal in Figure 8 represents the curvature in mm, which depicts the line routing. The section consists of a straight track from the beginning to km 131.055, a curve between km 131.160–131.710 as well as transition curves in between. As for the longitudinal level, standard deviation and individual TUG_TQI are almost equal (neglecting the absolute level). This can be interpreted as validation of the TUG_TQI, as the standard deviation is a well-established parameter. However, disparities between the two methods are evident when applied on the twist signal. The standard deviation of the twist overvalues transition curves (km 131.055–131.160, km 131.170–131.916), even though the characteristics of the measurement signal are inconspicuous; it only scatters around a different but uncritical level. In these areas, the TQI_twist represents the measurement data more reasonably. Overall, the TUG_TQI is similar to the standard deviation if the measurement signals are not affected by transition ramps and gauge widening in curves. However, the TUG_TQI is better suited for discriminating between effects originating from either influences of this kind or poor track quality.
5. Summary
The geometry of railway tracks is a key criterion for the comfort of passengers and the safety of railway operation. Numerous track quality indices (TQIs) have been developed to assess the overall track quality, using measurement signals of track geometry parameters. In this paper a selection of relevant TQIs is discussed and applied on a five kilometer track section. Some indices count the isolated defects, while neglecting the amplitude of these failures. As a result, the overall condition cannot be completely depicted. Most indices rely on standard deviations of the measurement signals, which are combined using different mathematical models. Standard deviations are better suited to assess the general track condition, but can be affected by track elements such as gauge widening and transition ramps. Additionally, combining standard deviations of geometry parameters, which occur in different amplitude ranges (e.g., longitudinal level versus twist, where the respective threshold levels can differ by more than 200% [EN 13848]) over-and underestimates the individual parameters. Some of the analyzed track quality indices rely on adjustment factors which weigh different geometrical parameters or adjust the results for changing line classes. These factors are frequently poorly documented in the literature if they are taken into account at all, which hampers an application in other networks.
In an attempt to eliminate the above described issues, a new index has been developed, the track quality index of Graz University of Technology (TUG_TQI). It calculates the elongation of a signal triggered by track irregularities—more frequent and more severe track defects yield longer measurement signals and consequently a higher TQI. All incorporated signals are normalized to their respective threshold levels before being processed. This normalization allows combining different geometry parameters without subjective weighting factors. The TUG_TQI offers the following advantages over existing track quality indices:
- The mathematical model is applicable for every measurement signal and nominal track gauge and thus for any railway network.
- The TUG_TQI can incorporate any measurement signal for which a reliable threshold level is defined.
- The underlying methodology reacts to scattering and peak values of the signals.
- Intended gauge widening in curves and twists in transition elements do not distort the respective indices.
- The gauge signal is split into a positive and a negative part because of differing threshold levels.
- By normalizing the signals, the line speed is implicitly considered.
The individual indices of the geometry signals enable conclusions to be made regarding the specific maintenance demand. The highest aggregation level—the TUG_TQI—constitutes an optimized assessment of the overall track quality, based on all relevant geometry parameters.
Author Contributions
S.O.: Conceptualization, Formal analysis, Investigation, Methodology, Software, Validation, Visualization, Writing—original draft; J.N.: Conceptualization, Data curation, Formal analysis, Methodology, Validation, Writing—review & editing; P.V.: Resources, Supervision, Writing—review & editing; M.L.: Conceptualization, Formal analysis, Methodology, Project Administration, Resources, Supervision, Validation, Writing—review & editing. All authors have read and agreed to the published version of the manuscript.
Funding
This research received no external funding.
Acknowledgments
Open Access Funding by the Graz University of Technology.
Conflicts of Interest
The authors declare no conflict of interest.
References
- Fourie, C.J.; Zhuwaki, N.T. A modelling framework for railway infrastructure reliability analysis. S. Afr. J. Ind. Eng. 2017, 28, 150–160. [Google Scholar] [CrossRef][Green Version]
- Yuan, F.Q. Overall reliability index development for railway infrastructure and rolling stock with case study. In Proceedings of the 2016 IEEE International Conference on Industrial Engineering and Engineering Management (IEEM), Bali, Indonesia, 4–7 December 2016; pp. 1264–1268. [Google Scholar]
- Hidirov, S.; Guler, H. Reliability, availability and maintainability analyses for railway infrastructure management. Struct. Infrastruct. Eng. 2019, 15, 1221–1233. [Google Scholar] [CrossRef]
- Lidén, T. Railway Infrastructure Maintenance - A Survey of Planning Problems and Conducted Research. Transp. Res. Procedia 2015, 10, 574–583. [Google Scholar] [CrossRef]
- Wang, X.; Yang, J.; Wang, J.; Wang, Y.; Xu, G. An Incentive Factor-Based Dynamic Comprehensive Evaluation on a High-Speed Railway Track. Appl. Sci. 2020, 10, 5546. [Google Scholar] [CrossRef]
- Cannon, D.F.; Edel, K.; Grassie, S.L.; Sawley, K. Rail defects: An overview. Fatigue Fract. Eng. Mater. Struct. 2003, 26, 865–886. [Google Scholar] [CrossRef]
- Abadi, T.; Le Pen, L.; Zervos, A.; Powrie, W. Effect of Sleeper Interventions on Railway Track Performance. J. Geotech. Geoenviron. Eng. 2019, 145, 04019009. [Google Scholar] [CrossRef]
- Sadeghi, J.; Zakeri, J.A.; Najar, M.E.M. Developing Track Ballast Characteristic Guideline in Order to Evaluate Its Performance. Int. J. Railw. 2016, 9, 27–35. [Google Scholar] [CrossRef]
- Liu, X.; Zhao, P.; Dai, F. Advances in design theories of high-speed railway ballastless tracks. J. Mod. Transp. 2011, 19, 154–162. [Google Scholar] [CrossRef]
- Austrian Standards Institute. EN 13848-6: Railway Applications–Track–Track Geometry Quality–Part6: Characterisation of Track Geometry Quality; Austrian Standards Institute: Vienna, Austria, 2014; Available online: https://standards.iteh.ai/catalog/standards/cen/741d0eac-5fda-472d-842c-0f78e01a1d47/en-13848-6-2014 (accessed on 26 March 2014).
- Ižvolta, L.; Šmalo, M. Assessment of the Track Geometry Quality from the Aspect of Safe and Reliable Operation of the Railway Track. Procedia Eng. 2015, 111, 344–350. [Google Scholar] [CrossRef]
- Berawi, A.R.B.; Delgado, R.; Calçada, R.; Vale, C. Evaluating track geometrical quality through different methodologies. Int. J. Technol. 2010, 1, 38–47. [Google Scholar]
- Soleimanmeigouni, I.; Ahmadi, A.; Nissen, A.; Xiao, X. Prediction of railway track geometry defects: A case study. Struct. Infrastruct. Eng. 2019, 16, 987–1001. [Google Scholar] [CrossRef]
- Soleimanmeigouni, I.; Ahmadi, A.; Kumar, U. Track geometry degradation and maintenance modelling: A review. Proc. Inst. Mech. Eng. Part. F J. Rail Rapid Transit. 2016, 232, 73–102. [Google Scholar] [CrossRef]
- Khajehei, H.; Ahmadi, A.; Soleimanmeigouni, I. Forecasting Railway Track Geometry Condition Using Neural Network Approach. 2017. Available online: https://www.researchgate.net/publication/320170135_Forecasting_Railway_Track_Geometry_Condition_Using_Neural_Network_Approach (accessed on 13 September 2018).
- Fellinger, M.; Neuhold, J.; Marschnig, S. Ballast Condition Monitoring for Turnouts Using Power Spectral Density. J. Transp. Eng. Part. A Syst. 2020, 146, 04020099. [Google Scholar] [CrossRef]
- Landgraf, M.; Hansmann, F. Fractal analysis as an innovative approach for evaluating the condition of railway tracks. Proc. Inst. Mech. Eng. Part F J. Rail Rapid Transit. 2018, 233, 596–605. [Google Scholar] [CrossRef]
- Sadeghi, J. Development of Railway Track Geometry Indexes Based on Statistical Distribution of Geometry Data. J. Transp. Eng. 2010, 136, 693–700. [Google Scholar] [CrossRef]
- Liu, R.-K.; Xu, P.; Sun, Z.-Z.; Zou, C.; Sun, Q.-X. Establishment of Track Quality Index Standard Recommendations for Beijing Metro. Discret. Dyn. Nat. Soc. 2015, 2015, 1–9. [Google Scholar] [CrossRef]
- Andrews, J.; Prescott, D.; De Rozières, F. A stochastic model for railway track asset management. Reliab. Eng. Syst. Saf. 2014, 130, 76–84. [Google Scholar] [CrossRef]
- Vidovic, I.; Marschnig, S. Optical Fibres for Condition Monitoring of Railway Infrastructure—Encouraging Data Source or Errant Effort? Appl. Sci. 2020, 10, 6016. [Google Scholar] [CrossRef]
- Soleimanmeigouni, I.; Ahmadi, A.; Khajehei, H.; Nissen, A. Investigation of the effect of the inspection intervals on the track geometry condition. Struct. Infrastruct. Eng. 2019, 16, 1138–1146. [Google Scholar] [CrossRef]
- Austrian Standards Institute. EN 13848-1: Railway Applications-Track-Track Geometry Quality-Part 1: Characterization of Track Geometry; Austrian Standards Institute: Vienna, Austria, 2019. [Google Scholar]
- Neuhold, J.; Vidovic, I.; Marschnig, S. Preparing Track Geometry Data for Automated Maintenance Planning. J. Transp. Eng. Part. A Syst. 2020, 146, 04020032. [Google Scholar] [CrossRef]
- El-Sibaie, M.; Zhang, Y.-J. Objective Track Quality Indices. Transp. Res. Rec. J. Transp. Res. Board 2004, 1863, 81–87. [Google Scholar] [CrossRef]
- Austrian Standards Institute. EN 13848-5: Railway Applications-Track-Track Geometry Quality-Part 5: Geometrical Quality Levels-Plain Line, Switches and Crossings; Austrian Standards Institute: Vienna, Austria, 2017. [Google Scholar]
- Luber, B. Methode zur Bewertung von Gleislageabweichungen auf Basis von Fahrzeugreaktionen; Graz University of Technology: Graz, Austria, 2011. [Google Scholar]
- Hummitzsch, R. Zur Prognostizierbarkeit des Qualitätsverhaltens von Gleisen: Statistische Analyse des Gleisverhaltens zur Erstellung eines Prognosemodells; TU Graz: Graz, Austria, 2009. [Google Scholar]
- Mlinarić, T.J. Dugoročna Procjena Kvalitete Kolosiječne Geometrije s Ciljem Identificiranja Zahtjeva Održavanja; University of Zagreb: Zagreb, Croatia, 2002. [Google Scholar]
- Madejski, J.; Grabczyk, J. Continuous Geometry Measurement for Diagnostics of Tracks and Switches. In Proceedings of the International Conference on Swithches, Delft, The Netherlands, 19–22 March 2002. [Google Scholar]
- Andersson, M. Strategic Planning of Track Maintenance, Borlänge. 2002. Available online: http://www4.banverket.se/raildokuffe/pdf/MC0228.pdf (accessed on 23 October 2020).
- Jernbanekompetanse.no, Textbooks in Railway Technology. 2019. Available online: https://www.jernbanekompetanse.no/wiki/Tilstandskontroll (accessed on 28 October 2020).
- Berawi, A.R.B. Improving Railway Track Maintenance Using Power Spectral Density (PSD); University of Porto: Porto, Portugal, 2013. [Google Scholar]
- Ebersöhn, W.; Selig, E.T. Use of Track Geometry Measurements for Maintenance Planning. Transp. Res. Rec. J. Transp. Res. Board. 1994, 1470, 84–92. [Google Scholar]
- Yu-Jiang, P.; Zhang, P.; El-Sibaie, M.; Sung, L. FRA Track Quality Indices and Distribution Characteristics. In Proceedings of the AREMA Annual Conference, Nashville, TN, USA, 19–22 September 2004. [Google Scholar]
- Lichtberger, B. Track Compendium; Eurailpress Tetzlaff-Hestra GmbH & Co.: Hamburg, Germany, 2005. [Google Scholar]
- Austrian Standards Institute. EN 13803: Railway Applications-Track-Track Alignment Design Parameters-Track Gauges 1435 mm and Wider; Austrian Standards Institute: Vienna, Austria, 2017. [Google Scholar]
- Hansmann, F. Innovative Messdatenanalyse–ein Beitrag für ein Nachhaltiges Anlagenmanagement Gleis; Graz University of Technology: Graz, Austria, 2015; Available online: https://online.tugraz.at/tug_online/wbAbs.showThesis?pThesisNr=58734&pOrgNr=1228# (accessed on 3 November 2020).


Publisher’s Note: MDPI stays neutral with regard to jurisdictional claims in published maps and institutional affiliations. |
© 2020 by the authors. Licensee MDPI, Basel, Switzerland. This article is an open access article distributed under the terms and conditions of the Creative Commons Attribution (CC BY) license (http://creativecommons.org/licenses/by/4.0/).