Article

Factors Influencing Cloud Computing Adoption in Higher Education Institutions of Least Developed Countries: Evidence from Republic of Yemen

by
Abdullah Hussein Alghushami
1,*,
Nur Haryani Zakaria
2 and
Zahurin Mat Aji
2
1
Department of Information Technology, Community College of Qatar, Doha 7344, Qatar
2
School of Computing, College of Arts & Sciences, Universiti Utara Malaysia, Kedah 06010, Malaysia
*
Author to whom correspondence should be addressed.
Appl. Sci. 2020, 10(22), 8098; https://doi.org/10.3390/app10228098
Submission received: 2 October 2020 / Revised: 23 October 2020 / Accepted: 3 November 2020 / Published: 16 November 2020
(This article belongs to the Special Issue Innovations in the Field of Cloud Computing and Education)

Abstract

:
Cloud-based technology, which is now well established, helps in reducing costs and providing accessibility, reliability and flexibility. However, the Yemen higher educational institutions (HEIs) have not yet embraced the technology due to security and privacy concerns, lack of trust, negative cultural attitudes (i.e., tribalism), and most importantly, lack of digital devices experience in educational settings as well as lack of knowledge and technical know-how. Thus, this study proposes a conceptual model of cloud computing adoption in Yemen HEIs by investigating the influence of technology, organization and environment (TOE) factors. In addition, this study investigates the moderating effect of tribalism culture in the relationships between the identified factors and cloud computing adoption. The study employed the quantitative approach to determine the factors that influence cloud computing adoption in Yemen HEIs through a questionnaire survey. Data were collected from 328 respondents in 38 HEIs and analyzed using partial least square (PLS) structural equation modelling (SEM). The results indicate that relative advantage, reliability, compatibility, security, technology readiness, top management support, regulatory policy and competitive pressure have positive significant impacts on the cloud computing adoption, except tribalism culture with negative significant impact. The study also found that tribalism culture moderates the relationship between compatibility, reliability, security, relative advantage, regulatory policy and cloud computing adoption. This study contributes to the TOE adoption model by including the cultural factor as a moderator towards cloud computing adoption in Yemen HEIs. The study also provides a model and insights for HEIs, technology consultants, vendors and policy makers in better understanding of the factors that influence cloud computing adoption in least developed countries (LDCs), specifically, Yemen.

1. Introduction

Cloud computing has been named by proponents of innovation as the fifth necessary utility, after water, electricity, oil or gas, and telephone [1,2]. With its increasing popularity, technology experts are predicting that by 2025, most institutions and companies will shift to cloud computing technology, eliminating their dependence on desktop resources [3,4]. Accordingly, this has attracted a large number of researchers to extensively investigate on cloud computing adoption [5,6,7,8,9]. However, most of these studies were carried out in developed and developing countries [10,11,12] as compared to only a few involving the least developed countries, especially in the context of Hinger Education Institutions (HEIs) [13]. In contrast to developed countries, the HEIs in the least developed countries usually confronted a number of socio-economic and political barriers that hindered the investments in costly projects such as those involving information systems (IS) [2].
In the cloud computing literature, little attention has been given to understand the adoption and essential benefit of the cloud computing paradigm. Besides that, there is also lack of contextualization of the key components that is crucial for the cloud computing implementation which become the gap of this study, Furthermore, there is an absence of in-depth exploratory studies in tracing cloud computing adoption, which is contradicted to the rapidity of cloud computing changes towards providing easy access to resources and convenient data management. In light of this, [2] pointed out that there is a limited number of research that looked into the cloud computing adoption in educational establishments, particularly on the influence of the related contextual factors. However, for those who did examine the determinants of cloud computing, the emphasis was only on the high-tech countries [14].
In 2015, the United Nation Development Program has categorized Yemen as a lower-income economic country, known as least developed county (LDC), based on its low infrastructure and economic status [15]. Moreover, the LDCs represent countries with poor social and political conditions as well as weak economic growth [16]. Currently, there are 49 countries recognized as LDCs [15]. Another characteristic that signified LDCs is those countries with the lowest technology indicators in the world. Even though, it is evidenced that financial problems have forced HEIs to adopt cloud computing to reduce costs; there is no empirical study thus far that Yemeni HEIs has examined their level of cloud computing adoption. Cloud computing adoption could be useful for LDCs since they have insufficient funds to equip themselves with their own IT infrastructure and services [17]. Some peculiarities are found among these LDCs, including Yemen that requires its citizen to subscribe to ICT. Challenges to the wide acceptance of technology adoption not only impede the knowledge, infrastructure, government cooperation and support, but also the readiness to accept new technological revolution as well as to break numerous cultural inhibitions [18,19].
While investigating, researchers should take into account the various contexts of cloud computing adoption, including in education [14]. Accordingly, [2] added that the cultural dimension plays an essential role in cloud computing adoption across various types of sectors since the success or failure of any technology adoption depends mainly on the cultural conditions of the adopters [20]. In many cases, culture has been viewed as the main obstacle to cloud computing adoption [21] especially when there are cultural discrepancies between nations that can influence on the uptake of innovations [22].
One of the potential barriers to the use of IT and cloud computing adoption in Yemen is its strong tribal society, with different attitudes even from other nations in the Arab sphere. To a large extent, Yemenis are aligned according to their respective social standing by system of tribal sentiments and families. In addition to these challenges, Yemen has an additional unique cultural feature, which is the tribal system that dominates all aspects of economic and political lives [23]. Thus, Yemen is very much affected by cultural, political, economic, and social inclinations of the government, which shows lack of prudence and transparency, division through tribal ranks, unstable governance, and absence of democracy. Moreover, tribalism is uniquely the major and true origin of Yemen’s social disarray that hinders the development and the adoption of new technology [24]. Every member of the population is accustomed to the tribal divide to steer good will, affecting socio-political and economic development [25,26,27,28].
In this regard, some of the Yemeni tribes have social connections to specific confederation for safeguarding purposes in forming alliance to protect each other [29]. This linkage and total loyalty among tribes have negatively contributed to the non-development of the people of Yemen, with economic hardship, political rivalry, social, and organizational problems [25,26,27]. This indicates that there is an important effect of the tribalism culture on cloud computing [30]. Therefore, further empirical investigations are needed that will contribute a new knowledge to the field. This is seen as relevant since as debate about the differences in the use of technology across different countries, sectors, and industries is still on-going. The culture context of collectivism states that people primarily act as members of a lifelong and coherent group [20]. This is true in the case of Yemen, whereby its society comprised of large families-groups that require undying loyalty. Tribalism for Yemenis offers wide protection and assurance for its specific membership groups whereby, tribesmen protect all ramifications of society and their membership is aligned with every situation they came across [25,27]. Furthermore, culture is found to be strongly associated with technology adoption in general, and cloud computing in particular [30]. Thus, this study considers the effect of culture on cloud computing adoption. In this regard, several research suggested that the influence of technological, organizational, and environmental (TOE) variables is context sensitive, and differs accordingly to culture and top management support [31,32,33].
This paper is organized as follows; Section 2 discusses some of the related works, followed by the elaboration of the research model in Section 3. Section 4 reports on the empirical results and analysis, while Section 5 presents the discussion. Finally, the paper concludes with several future work in Section 6.

2. Related Work

The effects of the chosen factors for cloud computing adoption have not yet been analyzed in the unique tribal context of HEIs in Yemen. Most importantly, very little is known about factors that influence cloud computing adoption by HEIs in the LDCs. In understanding the significant contrasts in accessing information and communication technology (ICT) between developed and developing nations, it is important to understand the determinant factors of cloud computing adoption, particularly on Yemen HEIs.
In the tribal areas of Yemen, the Tribal Customary Law is the most dominant as compared to the others. For instance, those Yemenis who are living in the urban areas usually favor the tribal customary law instead of the formal court system because of its greater accessibility, effectiveness, and suitability. The formal court system would be the last resort due to the prevalence of nepotism, lack of integrity, length of judicial processes, government’s failure to reinforce law and court orders, and government inefficiency [25]. Upon the surrender by the government on the tribal system, it is left for the tribes to find solutions pertaining to conflicts, particularly those involving the government and tribes, or tribes and businesses, which are located in strict tribal areas. For example, in May 2010 when the Yemeni deputy governor of Marib was killed in a drone attack, the Yemeni former president, Ali Abdullah Saleh, asked for the assistance of a mediation committee comprising of well-known Sheikhs from the Marib governorate to resolve the clash between government forces and tribes [24]. In the Yemen’s formal court system, the first step in integrating any tribal reconciliation, settlement, and conflict management process into the country’s legal system is to carry out the passing of the 1992 Arbitration Law. At the official level, the Arbitration Law consistently acknowledges the tribal mediation as an alternative in dispute resolution.
The TOE has been examined in different contexts by several studies, resulting in a consistent appearance of several factors that influence the adoption of cloud computing [34,35,36,37]. These factors can be categorized as organizational, technological, and environmental. Related variables derived from the literature review have been used to construct a proposed conceptual model for this study. A validation was also performed to confirm on the relevant factors. A review on the related theories indicates that most studies that applied the TOE have ignored culture as the potential factor relating to cloud computing adoption. Thus, the proposed model not only include all the original factors of the TOE but also an additional tribalism construct, which represents the cultural perspectives with the aim to provide a comprehensive model of cloud computing adoption.
The outcome of this study offers a useful contribution and in-depth perspectives to the growing body of knowledge on the drivers impacting cloud computing adoption in academic institutions. The findings are also valuable to the technology makers, cloud service providers, top management, and IT experts of the HEIs in the whole world. In addition, the study contributes on the sharing of deeper perspectives relating to the adoption of technology by producing new model that is essential for the LDCs planning. The study also provides new insights for researchers by investigating the moderating effect of culture on the relationship between organizational, environmental, and technological factors on cloud computing adoption as well as identifying the obstacles. The findings from this study are significant because they add to the existing knowledge in the discipline of educational theory and technology adoption, highlighting the distinctive cultural context of Yemen, and foregrounding the serious challenges the country faces while attempting to change educational practices. Furthermore, this study contributes to the existing literature in the field of cloud computing and technology adoption by (a) extending the TOE framework to the study of CCA as a feature of educational organizations, (b) developing a validated conceptual model for inspecting the critical factors related to adopting cloud computing in Yemen HEIs.

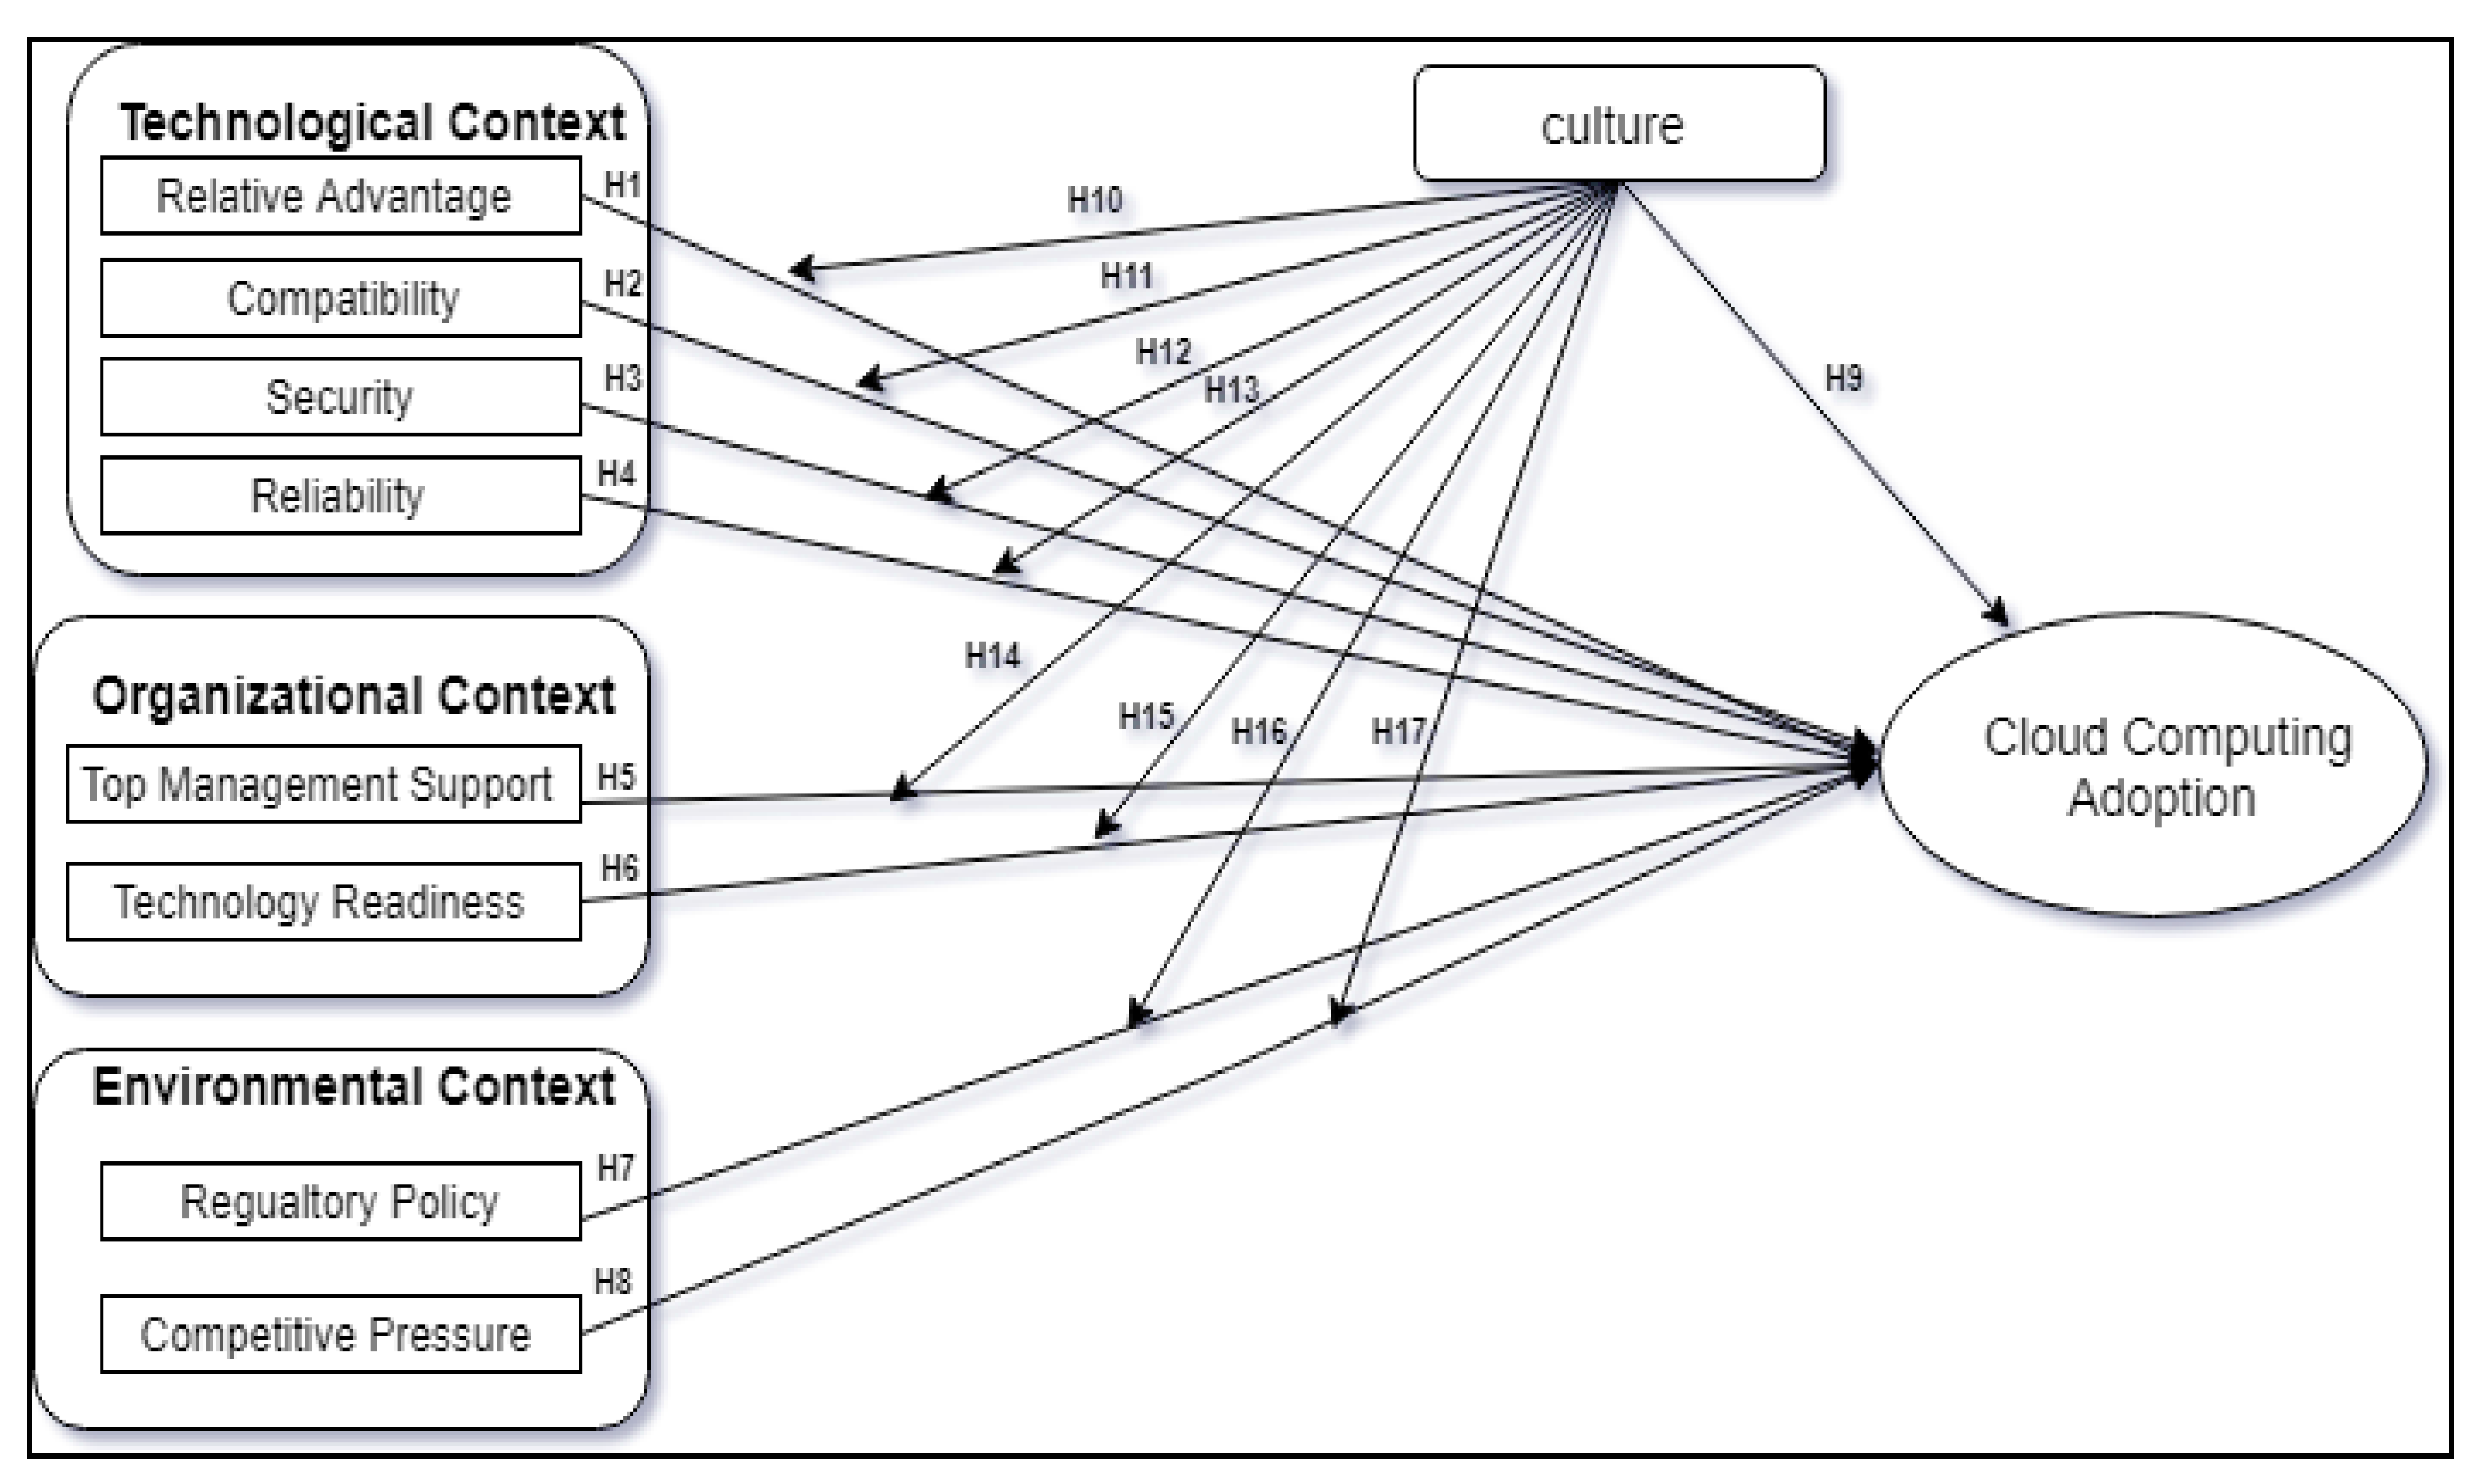
3. The Research Model

Technology-organization-environment (TOE) model, was introduced and developed by [38]. Focusing on organizational-level, this model examines the exact stages and variable classes for predicting ICT adoption [39]. As for this study, this model is adopted and extended by incorporating new determinants that are suitable for an investigation in HEIs particularly in least developed countries. The research model has three contexts; organizational, technological and environmental, which are regarded as most significant in ICT adoption. Firstly, the organizational context contains organizational variables which encourage and increase the process of technology adoption. Representing the resources and features of an organization, the organizational factors include size, technology readiness, human resources, and management support [40,41]. Secondly, the environmental context consists of factors related to the area in which the organization conducts its business. These include industry, competitive and trading pressure, regulatory policy, and culture, which can either encourage or delay the acceptance and adoption of technology [41]. Since it is not included in other theories except TOE, the environment is found to be the most suitable context in meeting the objectives of this study. Thirdly, the technological context takes into consideration the three innovative indicators of cloud computing adoption: relative advantage, compatibility, and complexity [41,42,43].
Given the inability to operationally defined culture, there is difficulty in building a consensus on the role of culture within the context of technology adoption [44]. Over the past two decades there has been increasing interest in the IS research literature in the impact of cultural differences on the adoption of information technologies. When viewing ICT adoption as a product placement issue, it is acceptable to inquire about the cultural nature of the target user of the product. Culture has been considered something that affects the reason for and rate of ICT, including cloud computing adoption. It is suggested that culture can impede the implementation efforts because of the differences in the way ICTs are interpreted and given meaning [45,46]. In a country like Yemen, with a strong tribal culture, it is highly probable that people will adopt the views of their surrounding groups, and the same applies to institutions whose employees are no more autonomous [23]. Similarly, [47] argued that a critical variable for the success or failure of technology adoption is culture. This has a lot to do with utilizing the new technology within the cultural environment. Thus, innovation and cultural tribalism depend on one another. Normally, culture can be seen differently from one country to another. In the existing literature, culture has been considered as one of the factors that has a direct relationship on technology adoption [47]. However, at this stage, the study posits that culture should be considered as moderating factor since Yemen’s strong tribalism culture relates to membership of a tribe of the same group or family and this has strong associations which impact the technology adoption particularly cloud computing adoption. Therefore, further investigation needs to be conducted to confirm the role of culture as a factor towards the cloud computing adoption of HEIs in Yemen.
The research model in Figure 1 investigates the relationships between technology, organization, and environment factors and the moderating effect of culture on these factors. Relative advantage, compatibility, security, and reliability variables that represent the technological context were hypothesized to have significant impacts on the dependent variable, cloud computing adoption. Top management support and technology readiness that represent the organizational context were hypothesized to have significant impacts on the dependent variable. Culture, competitive pressure, and regulatory policy that represent the environmental context and were hypothesized to have significant impacts on cloud computing adoption. Culture moderates the impact on these factors and cloud computing adoption. The following set of hypotheses is derived from the research model.
Hypothesis 1. 
Relative Advantage has a positive effect on cloud computing adoption (CCA).
Hypothesis 2. 
Compatibility has exerted a positive influence on CCA.
Hypothesis 3. 
Security has a positive influence on CCA.
Hypothesis 4. 
Reliability has a positive influence on CCA.
Hypothesis 5. 
Top Management Support has a positive influence on CCA.
Hypothesis 6. 
Technology Readiness has a significant effect on CCA.
Hypothesis 7. 
Regulatory Policy has a positive influence on CCA.
Hypothesis 8. 
Competitive Pressure has a positive influence on CCA.
Hypothesis 9. 
Culture has a negative influence on CCA.
Hypothesis 10. 
Culture moderates the relationship between Relative Advantage and CCA.
Hypothesis 11. 
Culture moderates the relationship between Compatibility and CCA.
Hypothesis 12. 
Culture moderates the relationship between Security and CCA.
Hypothesis 13. 
Culture moderates the relationship between Reliability and CCA.
Hypothesis 14. 
Culture moderates the relationship between Top Management Support and CCA.
Hypothesis 15. 
Culture moderates the relationship between Technology Readiness and CCA.
Hypothesis 16. 
Culture moderates the relationship between Competitive Pressure and CCA.
Hypothesis 17. 
Culture moderates the impact of Regulatory Policy on CCA.

4. Methodology

In order to test the research hypotheses, the research variables must be measured. The quantitative research phase includes activities such as designing the survey instrument and its validation by academic experts. In this study, the instrument was used to collect the data that were later analyzed using partial least square-structural equation modelling (PLS-SEM).

4.1. Instrument Design

The instrument of this study consists of two sections: (a) demographic characteristics and (b) items that will measure the independent, moderating and dependent variables. The items were adapted from previous studies [12,30,48,49,50,51,52,53]. The items were measured using a five-point Likert scale, ranging from “strongly disagree” (1) to “strongly agree” (5) with the statement offered. The instrument can be referred to in Appendix A.

4.1.1. Content Validity

Before using the instrument for the actual data collection, it is recommended to assess its suitability [47]. Content validity was tested to make sure that the items used to measure the variables are considered appropriate, adequate and correspond to the concept they intend to measure. This type of validity can be carried out using a panel of experts who read and review the instrument and check whether the items adequately represent the intended constructs and whether their wording is clear, understandable and free of ambiguity [47,54].
Good design increases the response rate and motivates the respondents to give complete and accurate data. Following the advice of [54], the questionnaire was translated from English into Arabic and back from Arabic into English by two different people as explained above. The final copy was compared with the original to ensure consistency and accuracy. Senior lecturers and professors from different universities in Yemen were approached to assess the questionnaire and give feedback on its wording, comprehensibility, and overall design. The survey instrument was reviewed and validated by a panel of experts, as shown in Table 1. The experts are from local and international universities, which include Associate Professors, Masters, and PhD degree students. This step concluded the content validity phase.

4.1.2. Pre-Testing the Questionnaire

Pre-testing the questionnaire for content validity was to ensure that the questionnaire delivered the right data of the right quality. Pre-testing identifies if the survey has any logic problems, if it is too hard to understand, if the wording of questions is ambiguous, or if it has any response bias [51]. Pre-testing was conducted in two phases by the ten experts listed in Table 1, five in each phase. The first phase resulted in amendments to the wording, and the addition of further explanation. The second phase confirmed that the questions were now clear and appropriate.

4.1.3. Face Validity

Weiner (2003) highlighted that the measurement instrument for data collection needs to be validated to ensure high quality data. Ref. [55] proposed several types of validity test for determining the integrity of measures: face and content validity. Ref. [52] referred to face validity as a method of testing whether the instrument appears to measure what it is designed for. The survey was reviewed and validated by seven experts, as shown in Table 2.
The seven experts represent specialists in IT (cloud computing) as well as statistics, as recommended by [43]. The draft questionnaire was delivered by hand and by email at different times, and many useful and important modifications were made on the specialists’ recommendation. The length of the survey was reduced as a result of the feedback, and various questions were reworded for improved clarity.

4.2. Data Collection Procedure

The target respondents from the country’s 38 universities were those who are knowledgeable about their individual institutions’ IT organization, environmental context, cloud computing adoption policy and decision making. These respondents comprised of Chief Information Officers (CIOs), Chief Technical Officers (CTOs), IT Managers/Director, a President, Vice Presidents of IT, Dean of the Computing/IT School, General Supervisors, members of IT strategy teams. and others. From the 433 questionnaires distributed, 351 were returned, giving a response rate of 81%. Of these, 23 were incomplete; a remaining of 328 usable surveys were utilized for further analysis, equals to 75.7% valid response rate. This percentage is considered sufficient as it exceeds the minimum response rate of 60%, which required for a valid data analysis [54].

5. Empirical Analysis and Results

The PLS-SEM analysis was conducted using SmartPLS 3.0 to test the research hypotheses. PLS-SEM is deemed the most appropriate method for testing the conceptual model and hypotheses in this study. By using PLS-SEM, the conceptual research model was evaluated in two steps, the evaluation of the structural model (the inner model) and the measurement model (the outer model) [56].

5.1. The Measurement Model

Assessment of the measurement model or what is alternatively called the outer model determines individual item reliability, internal consistency reliability, content validity, convergent validity, and discriminant validity [57]. The measurement model was assessed by examining the outer loadings of each construct item. According to the latter, the rule of thumb retains items with loadings below 0.40; out of 52 items, 19 were deleted because their loadings were below this threshold of 0.40. The remaining 34 items had loadings between 0.71 and 0.99. Internal consistency (reliability) refers to the extent to which all components are measured by a similar concept [58]. On the other hand, composite reliability coefficient and Cronbach’s Alpha coefficient are the most frequently used to estimate the internal consistency reliability of items in marketing research [55]. The composite reliability coefficient was chosen to ascertain the internal consistency of measures adopted in this study. Composite reliability takes into account that indicators have different loadings; it can be explained in the same way as Cronbach’s Alpha, that is, no matter which particular reliability coefficient is used, an internal consistency reliability value above 0.70 is regarded as satisfactory, whereas a value below 0.60 indicates a lack of reliability. However, in this study the explanation of the internal consistence reliability using the composite reliability coefficient was based on the rule of thumb provided by [59]. Table 1 illustrates the composite reliability, the coefficients of the latent constructs. The measurement model was assessed by examining the outer loadings of each construct item [57]. According to the latter, the rule of thumb retains items with loadings below 0.40; and 0.70, out of 52 items, 19 were deleted because their loading was below this threshold of 0.40. The remaining 34 items had loadings between 0.705 and 0.989 (see Table 1).
Internal consistency reliability refers to the extent to which all components are measured by a particular (similar concept [60]. Composite reliability coefficient and Cronbach’s alpha coefficient are the most frequently used to estimate the internal consistency reliability of items in marketing research [52]. The composite reliability coefficient was chosen to ascertain the internal consistency reliability of measures adopted in the present study.
The composite reliability coefficient was used as it provides a better estimate of reliability bias. Cronbach’s alpha coefficient assumes that all items contribute equally to its construct without considering the actual contribution of individual loadings [43] that may over—or underestimate the reliability scale. Nevertheless, the Cronbach’s Alpha as a whole for all items was above the 0.7, which is considered as good reliability as it is above [58] recommended value.
Composite reliability takes into account that indicators have different loadings; it can be explained in the same way as Cronbach’s alpha, that is, no matter which particular reliability coefficient is used, an internal consistency reliability value above 0.70 is regarded as satisfactory, whereas a value below 0.60 indicates a lack of reliability. However, in this study the explanation of the internal consistence reliability using the composite reliability coefficient was based on the rule of thumb provided by [61]. Furthermore, as recently suggested by [62] composite reliability coefficient should be at least 0.70 or more. Table 3 illustrates the composite reliability and coefficients of the latent constructs.
The convergent validity was also examined in the measurement model [60], which refers to the extent to which items truly represent the intended latent construct and correlate with other measures of the same latent construct [62]. The indicators were evaluated using the Average Variance Extracted (AVE) as suggested by [61]. Furthermore, [63] recommended that the AVE of each latent construct should be 0.50 or more, as demonstrated by this study (see Table 3). Meanwhile, discriminant validity refers to the extent to which a particular latent variable is different from the other latent variables [64]. It was ascertained using AVE as suggested by [65], accomplished by comparing the squared correlation of the paired constructs with the AVE of each construct. Discriminant validity for reflective constructs occurs when the loadings of the items of a construct is an order of magnitude above the loadings for other constructs (loadings higher by 0.1) and the square root of the AVE for each construct is much higher than the correlations among pairs of constructs, above 0.5 [65]. Following [63] criterion, discriminant validity was determined by comparing the indicator loadings with other reflective indicators in the cross-loading table. To achieve adequate discriminant validity, the square root of the AVE should be greater than the correlations among latent constructs. As shown in Table 1, the AVE values are acceptable, ranging between 0.52 and 0.99. The correlations among the first-order variables were compared with the square root of the AVE (values in bold face). Table 4 also shows that the square root of the AVE were all greater than the correlations among latent variables, suggesting adequate discriminant validity [65].
The measurement model was also examined for convergent validity [64] which refers to the extent to which items truly represent the intended latent construct and indeed correlate with other measures of the same latent construct [54]. The indicators were evaluated using Average Variance Extracted (AVE) as suggested by [54]. Ref. [63] recommended that the AVE of each latent construct should be 0.50 or more, and in this study they AVE showed high loadings (>0.50) (see Table 4).
Discriminant validity can be ascertained by comparing the indicator loadings with cross-loadings [61]. For this study, all the indicator loadings should be higher than the cross-loadings, and Table 5 compares them with other reflective indicators. The results indicates that all the indicators were greater than the cross-loadings, suggesting that discriminant validity is adequate for further analysis.

5.2. Assessment of Measurement Model

By using the PLS-SEM, the conceptual research model was evaluated in two steps, the evaluation of the structural (the inner model) and measurement models (the outer model) [55]. The assessment of the measurement model, also called the outer model, determines individual item reliability, internal consistency reliability, content validity, convergent validity, and discriminant validity [53,57,58] as shown in Figure 2. The assessment of the structural model is described in Section 5.3

5.2.1. Individual Item Reliability

The measurement model was assessed by examining the outer loadings of each construct item [57,64]. According to the latter, the rule of thumb retains items with loadings below 0.40; and 0.70, out of 52 items, 19 were deleted because their loading was below this threshold of 0.40. The remaining 34 items had loadings between 0.705 and 0.989 (see Table 3).

5.2.2. Internal Consistency Reliability

Internal consistency reliability refers to the extent to which all components are measured by a particular (similar concept [58]. Composite reliability coefficient and Cronbach’s alpha coefficient are the most frequently used to estimate the internal consistency reliability of items in marketing research [55]. The composite reliability coefficient was chosen to ascertain the internal consistency reliability of measures adopted in the present study.
The justification for using composite reliability coefficient, is because composite reliability coefficient provides a better estimate of reliability bias; Cronbach’s alpha coefficient assumes that all items contribute equally to its construct without considering the actual contribution of individual loadings [56] and may over- or underestimate the reliability scale. Nevertheless, Cronbach’s Alpha as a whole for all items is above the 0.7, which is considered as good reliability as it is above [56] recommended value.
Composite reliability takes into account that indicators have different loadings; it can be explained in the same way as Cronbach’s alpha, that is, no matter which particular reliability coefficient is used, an internal consistency reliability value above 0.70 is regarded as satisfactory, whereas a value below 0.60 indicates a lack of reliability. However, in this study the explanation of internal consistence reliability using the composite reliability coefficient was based on the rule of thumb provided by [66]. Furthermore, as recently suggested by [55] composite reliability coefficient should be at least 0.70 or more. See Table 3 illustrates the composite reliability, the coefficients of the latent constructs.

5.2.3. Convergent Validity

The measurement model was also examined for convergent validity [60], which refers to the extent to which items truly represent the intended latent construct and indeed correlate with other measures of the same latent construct (Hair et al., 2010). The indicators were evaluated using Average Variance Extracted (AVE) as suggested by [57]. Ref. [61] recommended that the AVE of each la tent construct should be 0.50 or more, and in this study they AVE showed high loadings (>0.50) (see Table 3).

5.2.4. Discriminant Validity

Discriminant validity refers to the extent to which a particular latent variable is different from the other latent variables [64]. It was ascertained using AVE as suggested by [65], accomplished by comparing the squared correlation of the paired constructs with the AVE of each construct.
Discriminant validity for reflective constructs occurs when the loadings of the items of a construct is an order of magnitude above the loadings for other constructs (loadings higher by 0.1) and the square root of the AVE for each construct is much higher than the correlations among pairs of constructs, above 0.5 [65]. Following [63] criterion, discriminant validity was determined by comparing the indicator loadings with other reflective indicators in the cross-loading table. To achieve adequate discriminant validity, the square root of the AVE should be greater than the correlations among latent constructs. As shown in Table 3, the AVE values are acceptable, ranging between 0.515 and 0.989. The correlations among the first-order variables were compared with the square root of the AVE (values in bold face).

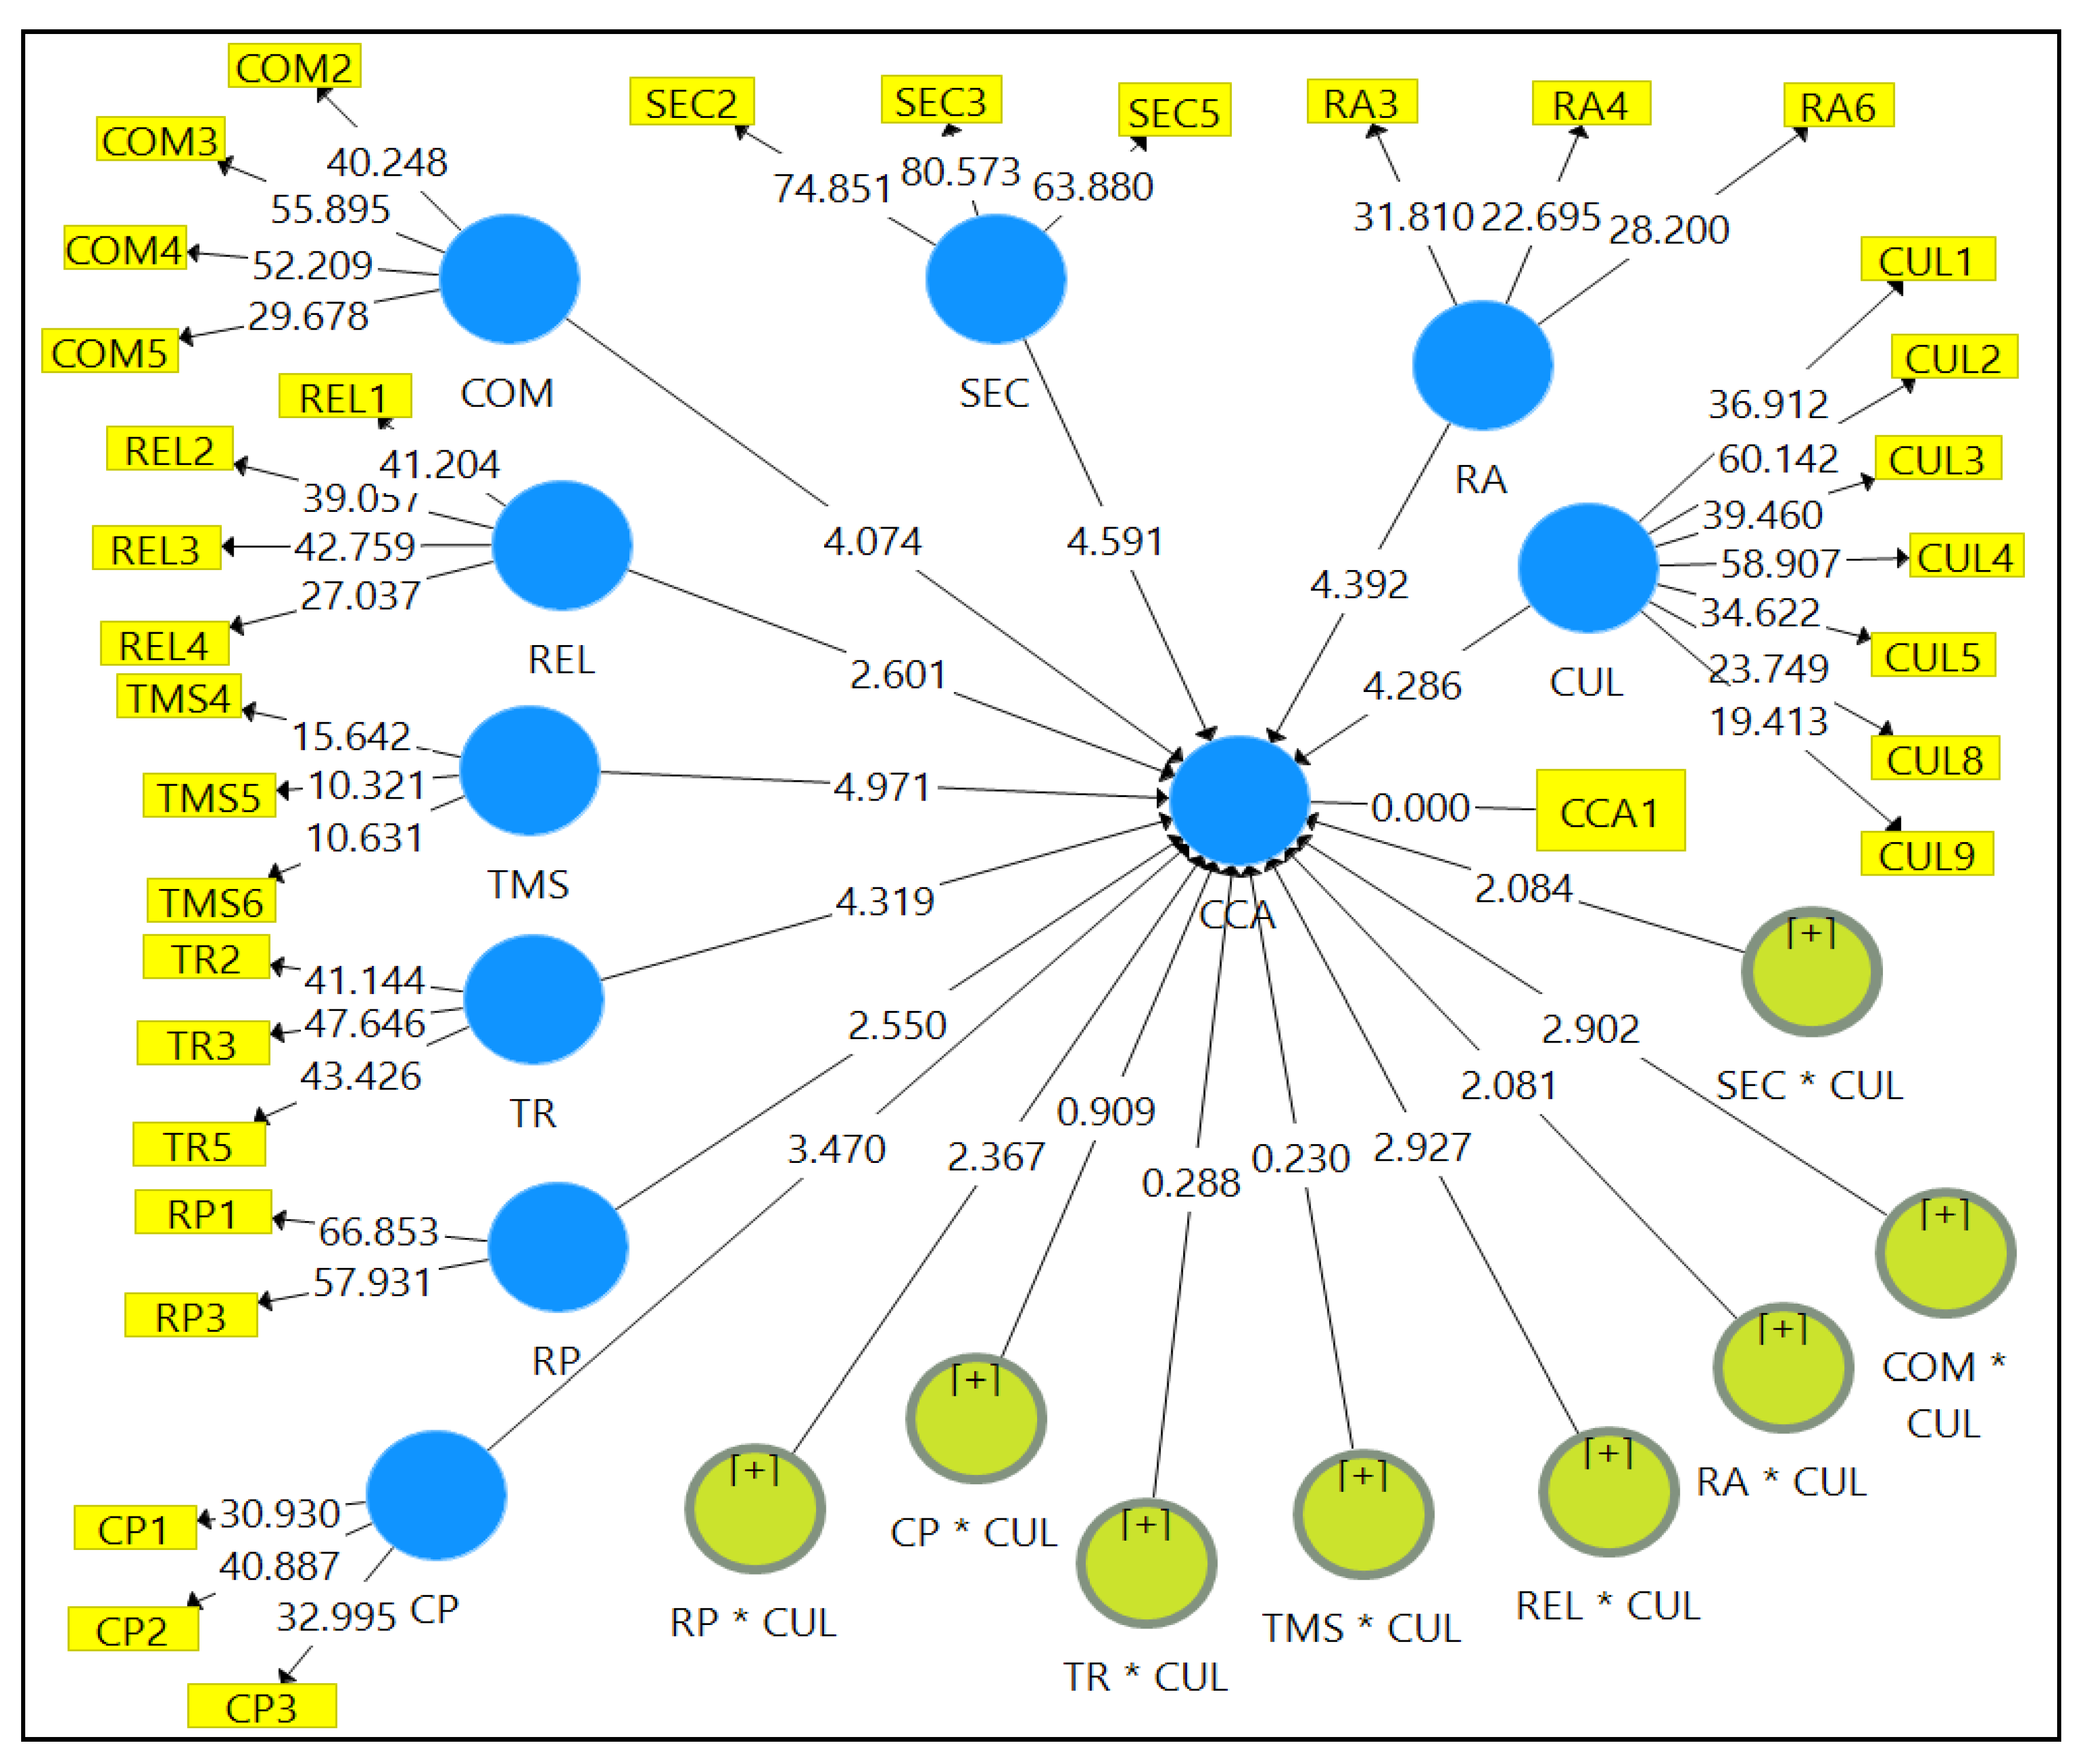
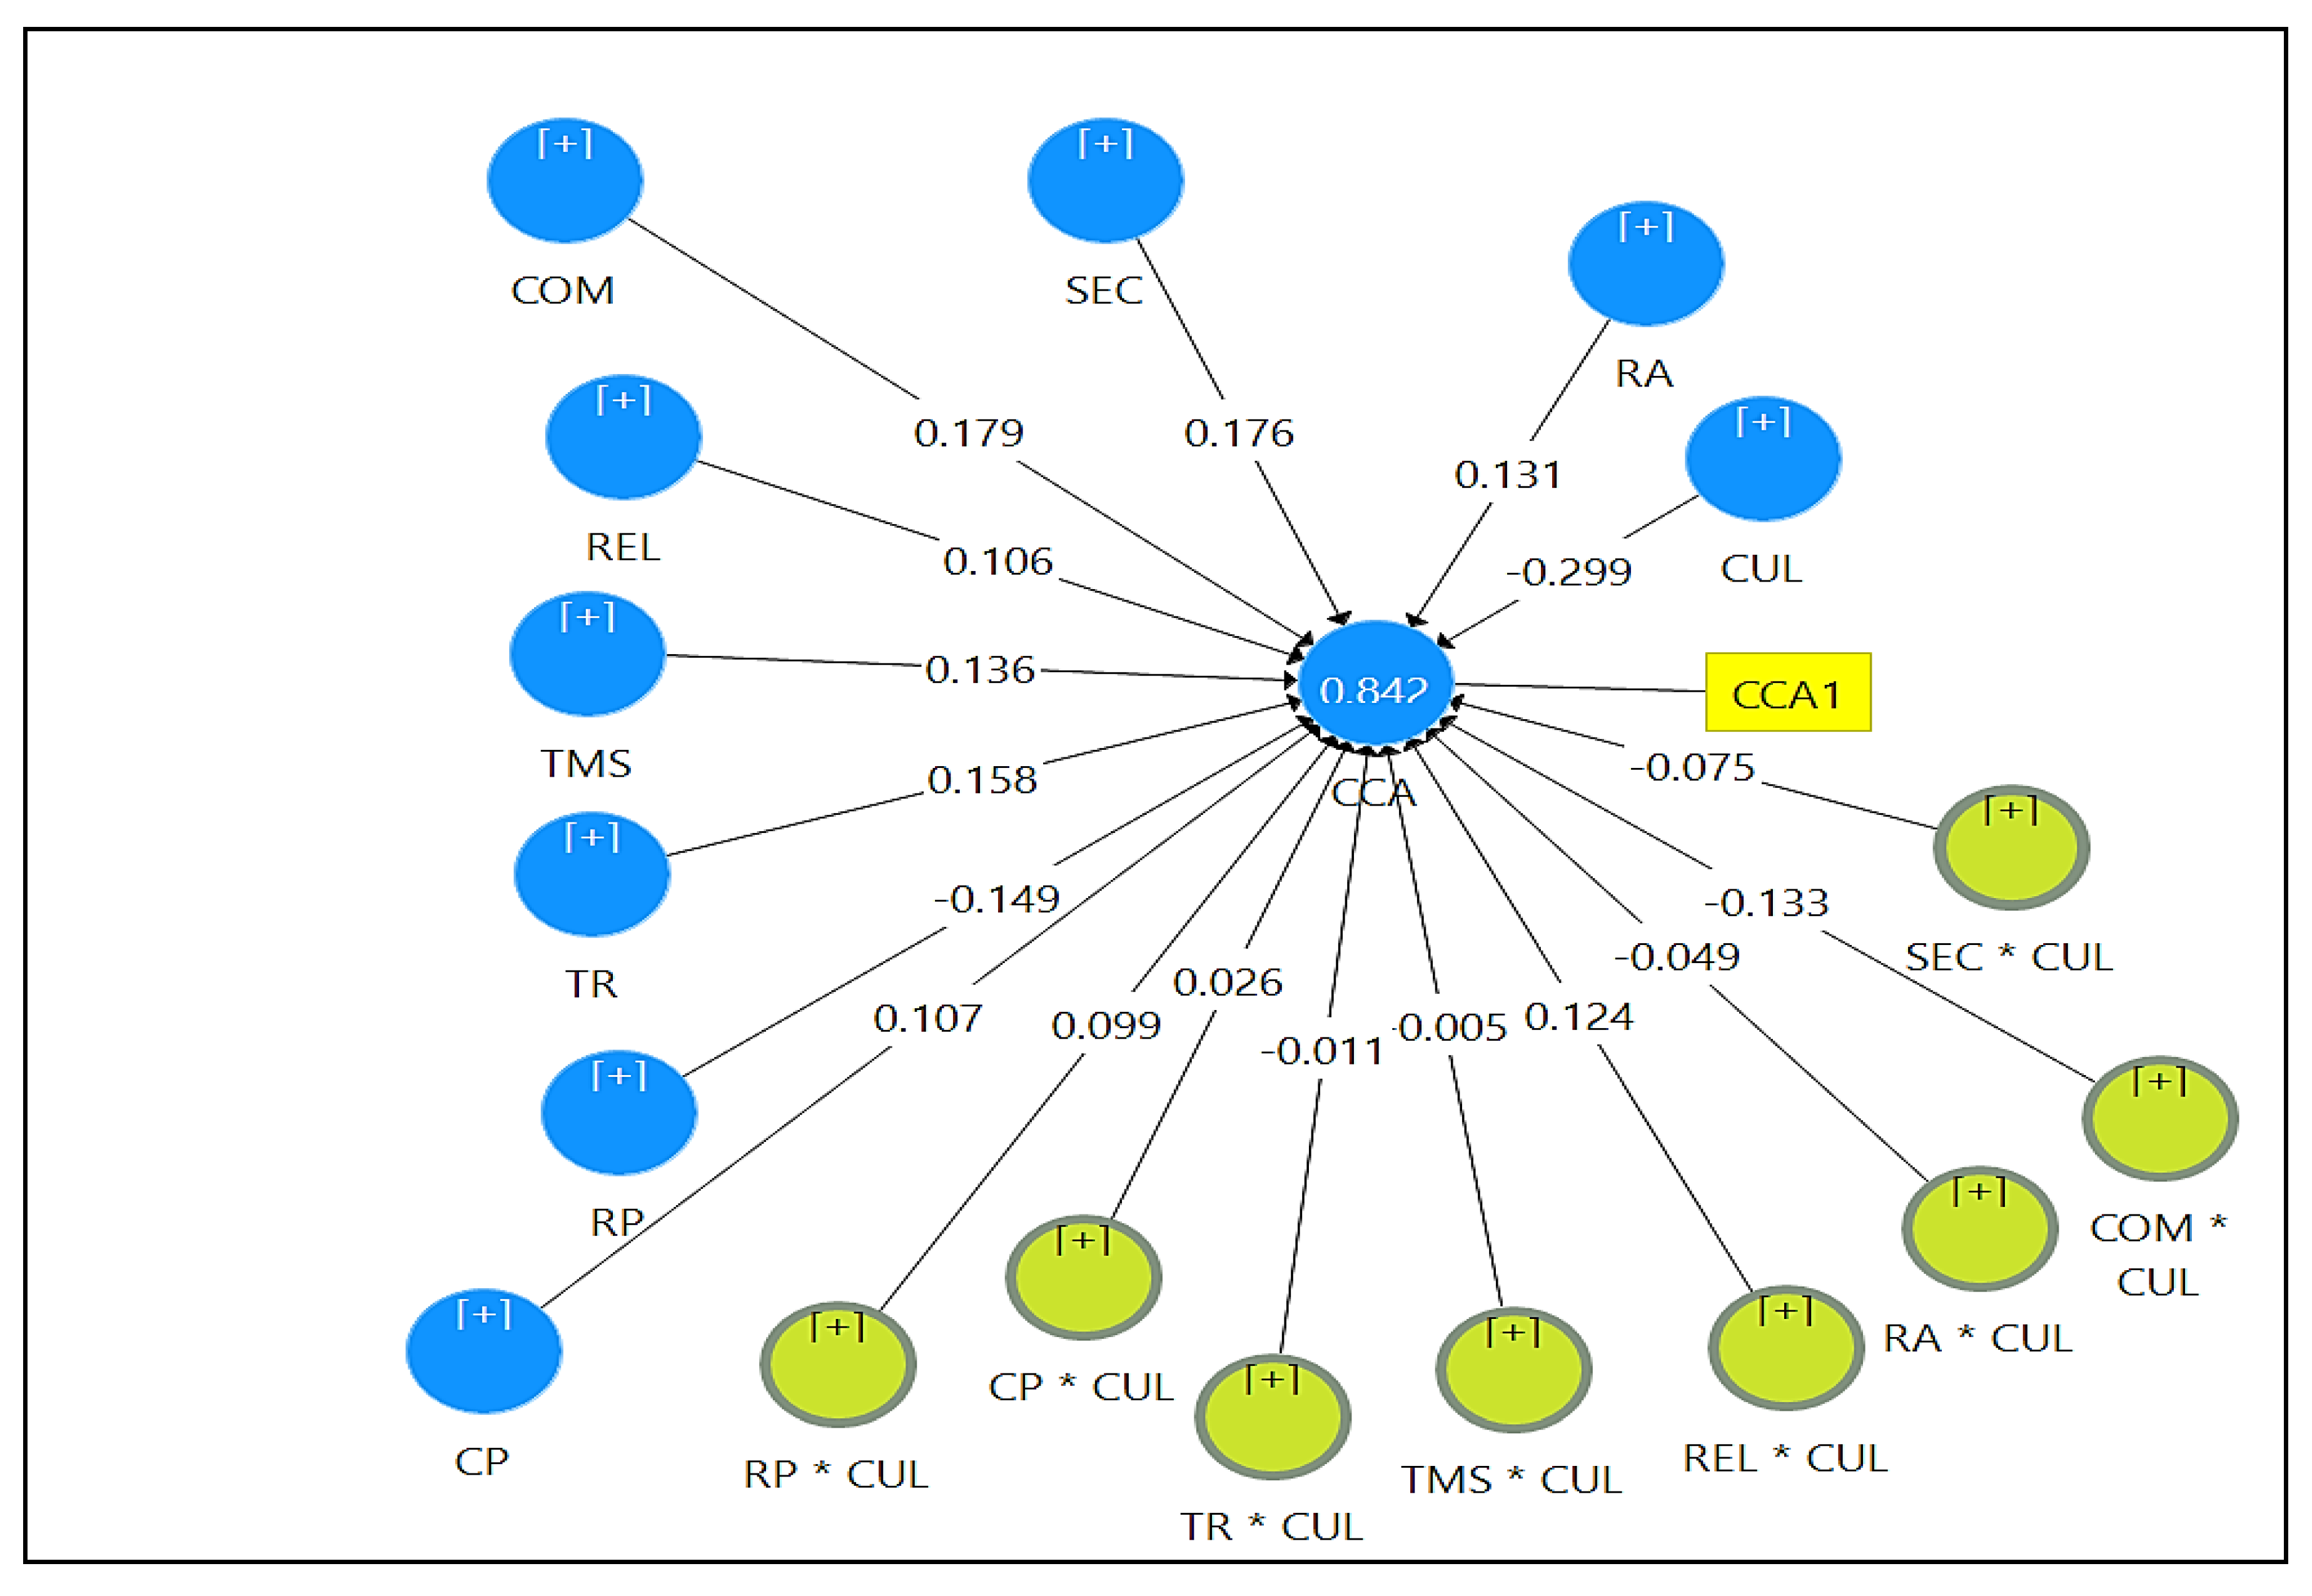
5.3. The Structural Model

This study applied the standard bootstrapping procedure with 5000 bootstrap samples and 328 cases to assess the significance of the path coefficients [65,66,67]. Bootstrapping is a non-parametric procedure that can be applied to test whether coefficients such as outer loadings, outer weights and path coefficients are significant, by estimating the standard errors. Figure 3 shows the estimates for the full structural model.
First, after examining the influence of relative advantage (Hypothesis 1) on cloud computing adoption (CCA), the result revealed a significant positive relationship (β = 0.131, t = 4.392, p < 0.000). Hence, hypothesis H1 is supported. Next, hypothesis H2, which predicted that compatibility has a significant effect on CCA, revealed a significant positive bond between compatibility and CCA (β = 0.179, t = 3.562, p < 0.000), supporting this hypothesis. Similarly, Hypothesis H3, that proposed a relationship between security and CCA is fully supported as it is statistically significant (β = 0.176, t = 4.591, p > 0.000). For Hypothesis H4, the influence of reliability on CCA, there is a positively significant relationship (β = 0.106, t = 2.601, p > 0.009), supporting the hypothesis. In examining the influence of top management support on CCA, Hypothesis H5 is found to have a significant positive relationship (β = 0.136, t = 4.971, p > 0.000) and is thus supported. With respect to Hypothesis H6, which predicted that technology readiness is positively related to CCA, is found to have a significant relationship with CCA (β = 0.158, t = 4.319, p < 0.000), supporting Hypothesis H6. Next, regulatory policy was predicted in Hypothesis H7 to be positively related to CCA, and the result shows a significant negative relationship (β = 0.149, t = 2.550, p < 0.011), so Hypothesis H7 is supported. With respect to the results for Hypothesis H8, on the influence of competitive pressure on CCA indicate a positively significant relationship (β = 0.107, t = 3.470, p > 0.001), supporting this hypothesis.
Hypothesis H9 predicted that culture has a statistically significant negative relationship with CCA. The result (β = −0.299, t = 4.286, p < 0.000) clearly supports this hypothesis, showing that when culture increases CCA decreases. On the hand, Hypothesis H10 stated that culture moderates the relationship between relative advantage and CCA. The results show that this is statistically significant (β = −0.049, t = 2.081, p > 0.038). With respect to the Hypothesis H11, which stated that culture moderates the relationship between compatibility and CCA. As expected, the results indicate that the interaction terms representing compatibility x culture (β = −0.133, t = 2.902, p < 0.004) are statistically significant. Hence, Hypothesis H11 is fully supported. Furthermore, Hypothesis H12 stated that culture moderates the relationship between security and CCA; this was found to be statistically significant (β = −0.075, t = 2.084, p > 0.037), clearly supporting this hypothesis. Hypothesis H13 predicted that culture moderates the relationship between reliability and CCA, and this is found to be statistically significant (β = −0.124, t = 2.927, p > 0.009), supporting the hypothesis. With respect to Hypothesis H14, which predicted that culture moderates the relationship between top management support and CCA, the results show that this was not statistically significant (β = −0.005, t = 0.230, p > 0.818), so this hypothesis is not supported. Meanwhile, Hypothesis H15 stated that culture moderates the relationship between technology readiness and CCA, but this was not found to be statistically significant (β = −0.011, t = 0.288, p < 0.773) and this hypothesis is also not supported. For Hypothesis H16, which stated that culture moderates the relationship between competitive pressure and CCA, the results indicated that the interaction terms representing competitive pressure and culture (β = 0.026, t = 0.909, p < 0.364) were statistically not significant. Therefore, Hypothesis H16 is not supported. Finally, Hypothesis 17 stated that culture moderates the relationship between regulatory policy and CCA. The result showed the interaction terms representing regulatory policy and CCA was statistically significant (β = −0.099, t = 2.367, p > 0.018), and this hypothesis is supported. Table 6 summarizes the hypotheses testing of this study.
To assess the structural model in PLS-SEM, there is an R2 value, known as the coefficient of determination [65,66,67]. The R2 values represent the proportion of variation in the dependent variable that can be explained by the independent variables and are interpreted in the same way as those obtained from multiple regression analysis. While the R2 value indicates the amount of variance in the construct that is explained by the variables, an acceptable level depends on the research context [66]. Ref. [68] suggested an R2 value of 0.10 as a minimum acceptable level. In addition, [63] considered values of 0.67, 0.33, and 0.19 in PLS-SEM as substantial, moderate and weak, respectively. The R2 values of the dependent variable in this study, showing that all the independent variables collectively explain 84% of the variance in CCA. The effect size (f2) indicates that the relative effect of a particular independent variable on dependent variable(s) by means of changes in the R2 value [61]. It is calculated as the increased in R2 of the latent variable, to which the path is connected, relative to the latent variable’s proportion of unexplained variance; an effect size of 0.02 is small, 0.15 is medium, and greater than 0.35 is large [69]. The results provided by PLS-SEM analysis for the effect size of the independent latent variable on the dependent latent variable in this study’s structural model are illustrated in Table 7.
As illustrated in Table 7, the effect sizes for the nine independent variables; (a) relative advantage, (b) compatibility, (c) security, (d) reliability, (e) technology readiness, (f) top management support, (g) regulatory policy, (h) competitive pressure, and (h) culture were mentioned respectively. Therefore, following the [69] guideline, the effect sizes of these independent variables on cloud computing adoption can be considered variously as small, medium, and large. Moreover, predictive relevance Q2 is further explored through the employment of a blindfolding procedure using the cross-validated redundancy approach. Q2 values of above zero for a specific endogenous latent variable is an indication of the predictive relevance of that latent variable in explaining the endogenous latent variable [57]. As for this research model, the obtained Q2 value for CCA is 0.75, indicating the large predictive relevance [70].

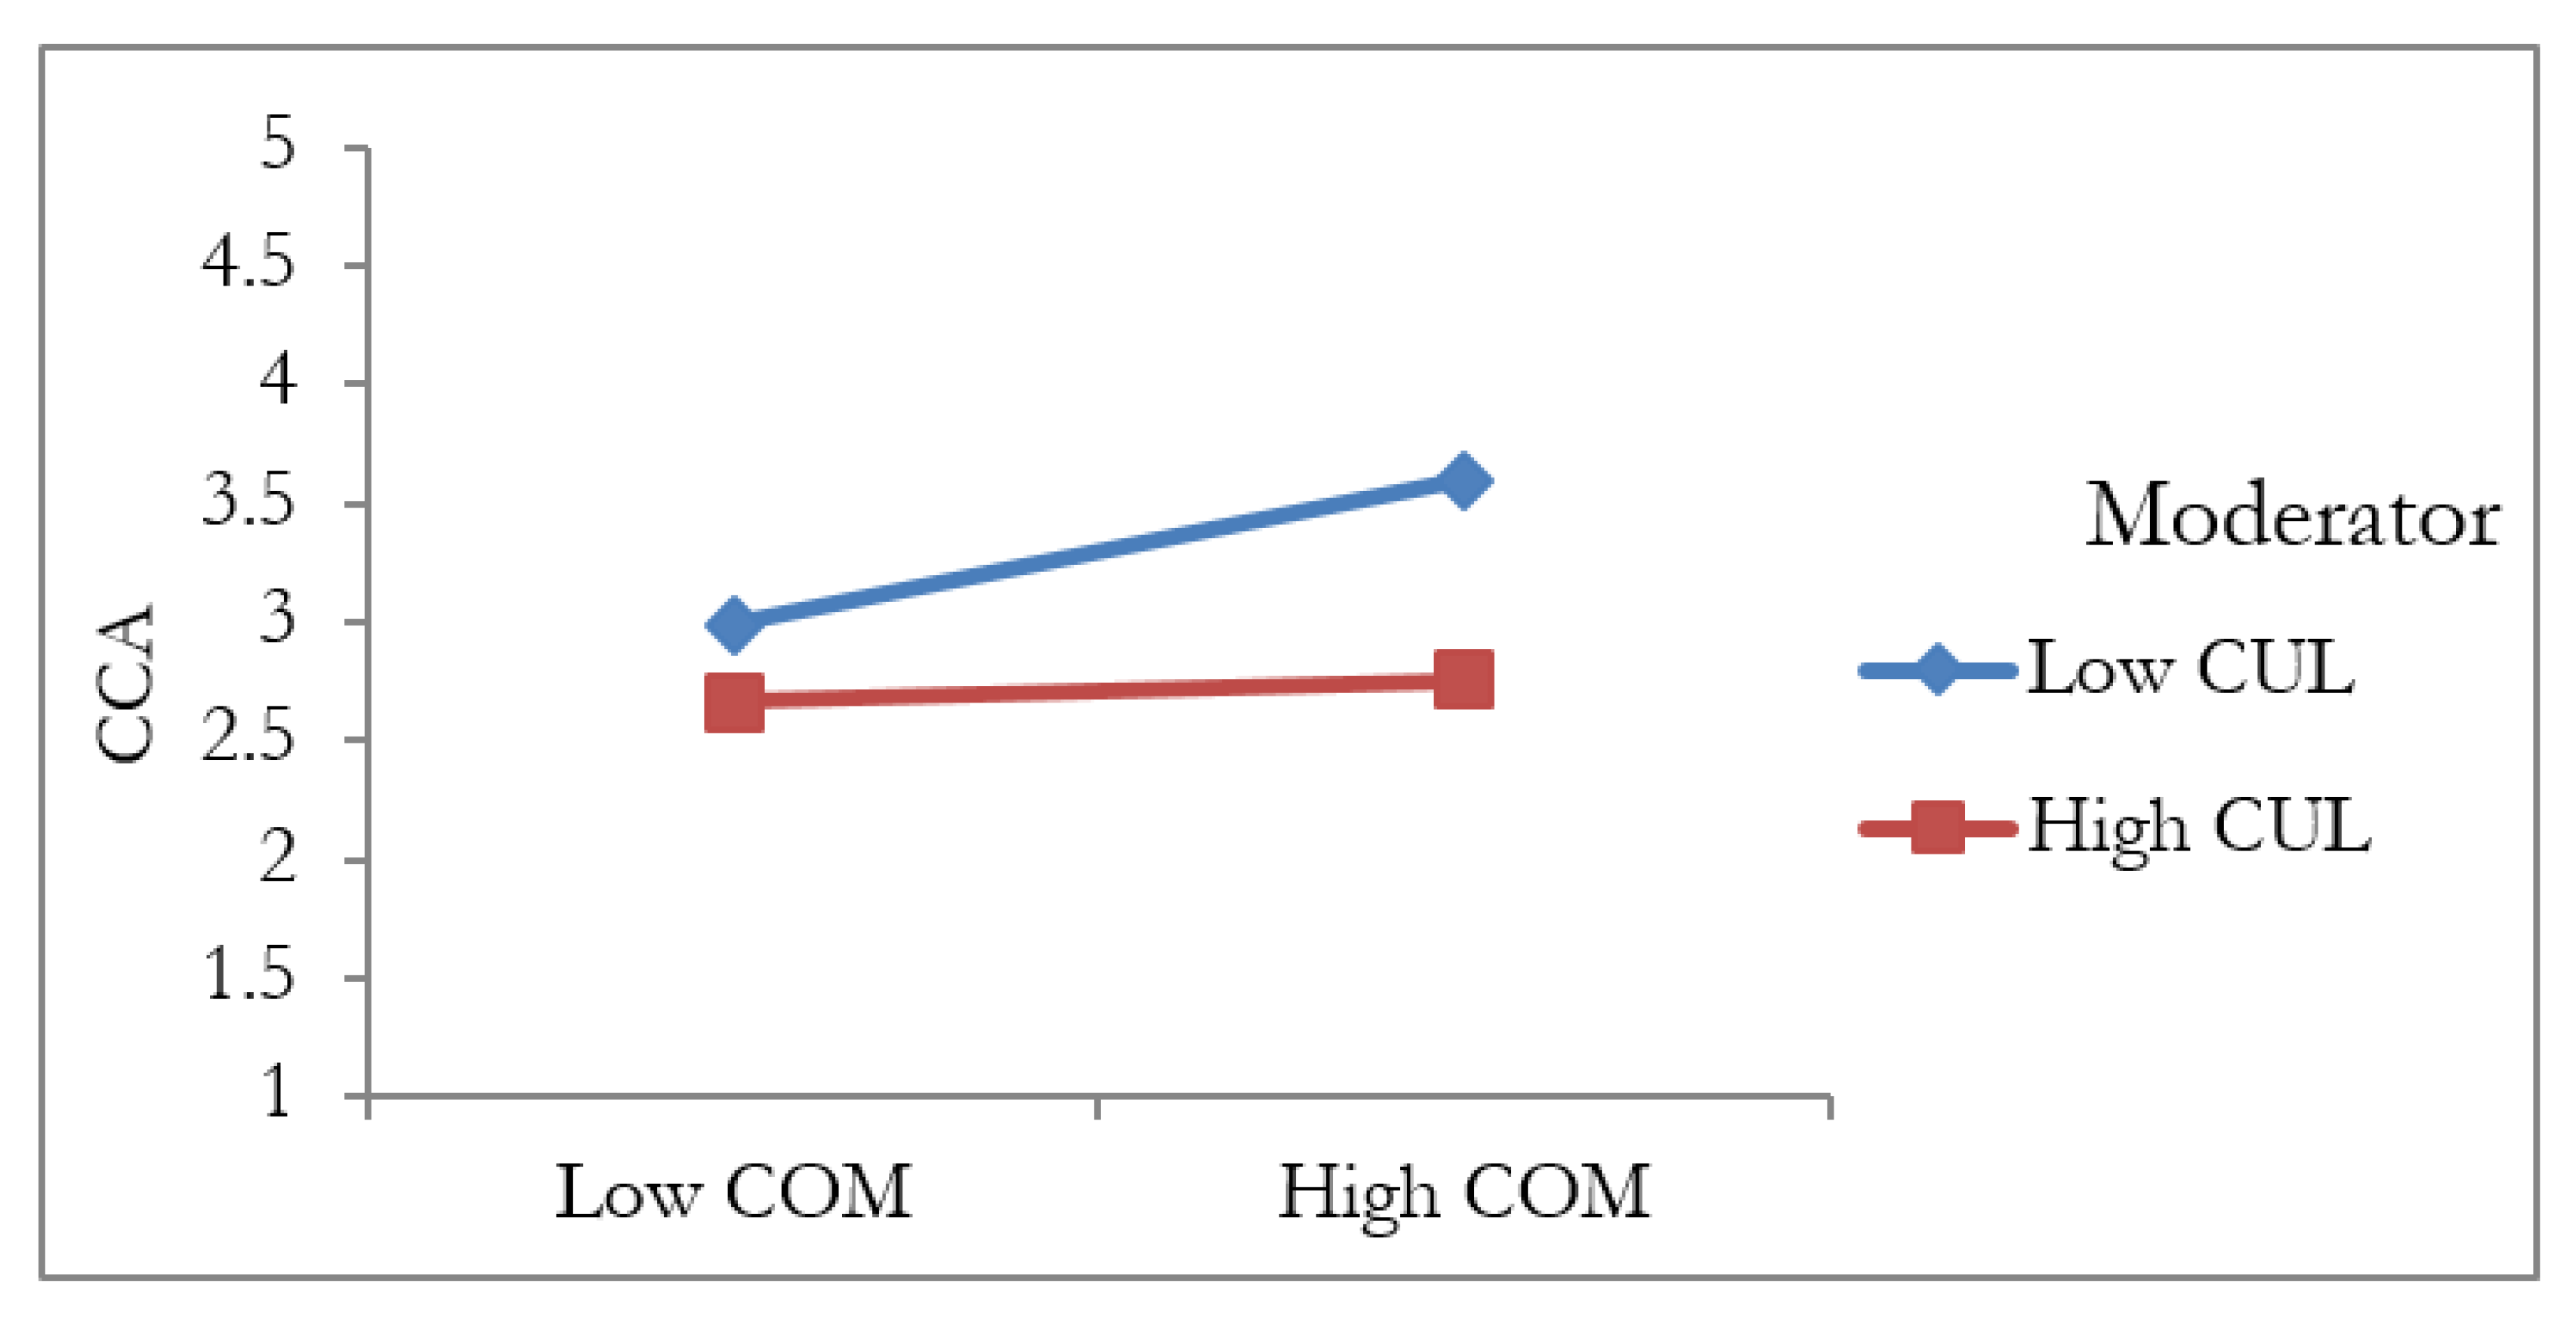
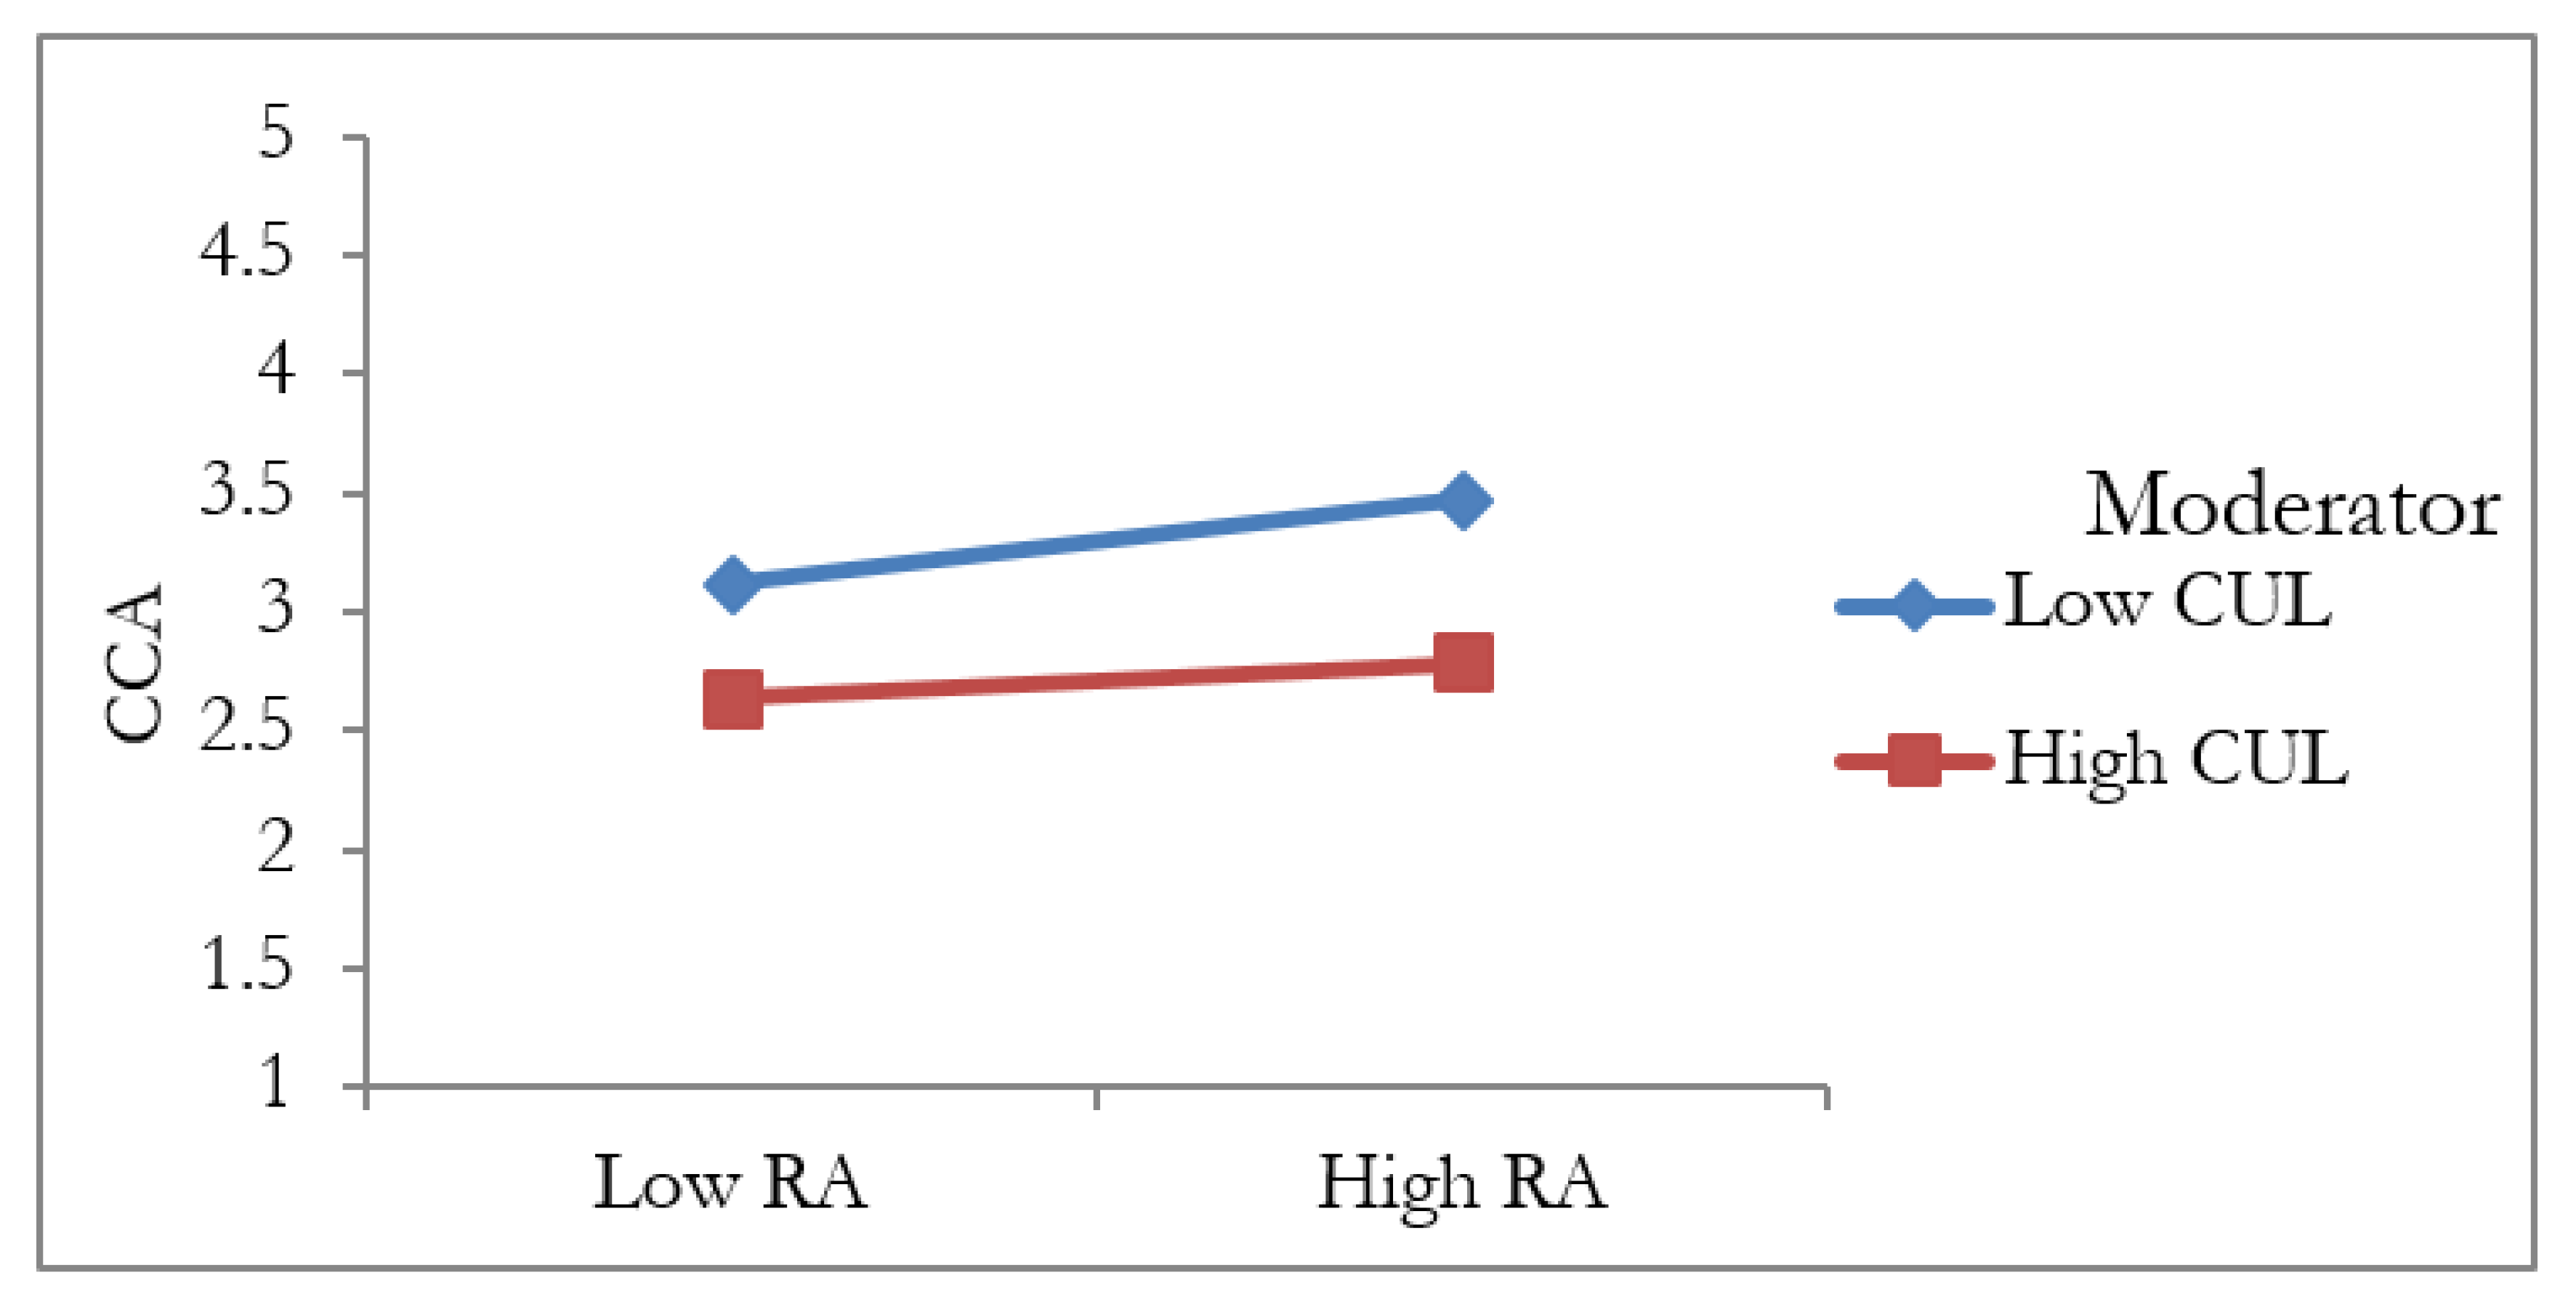
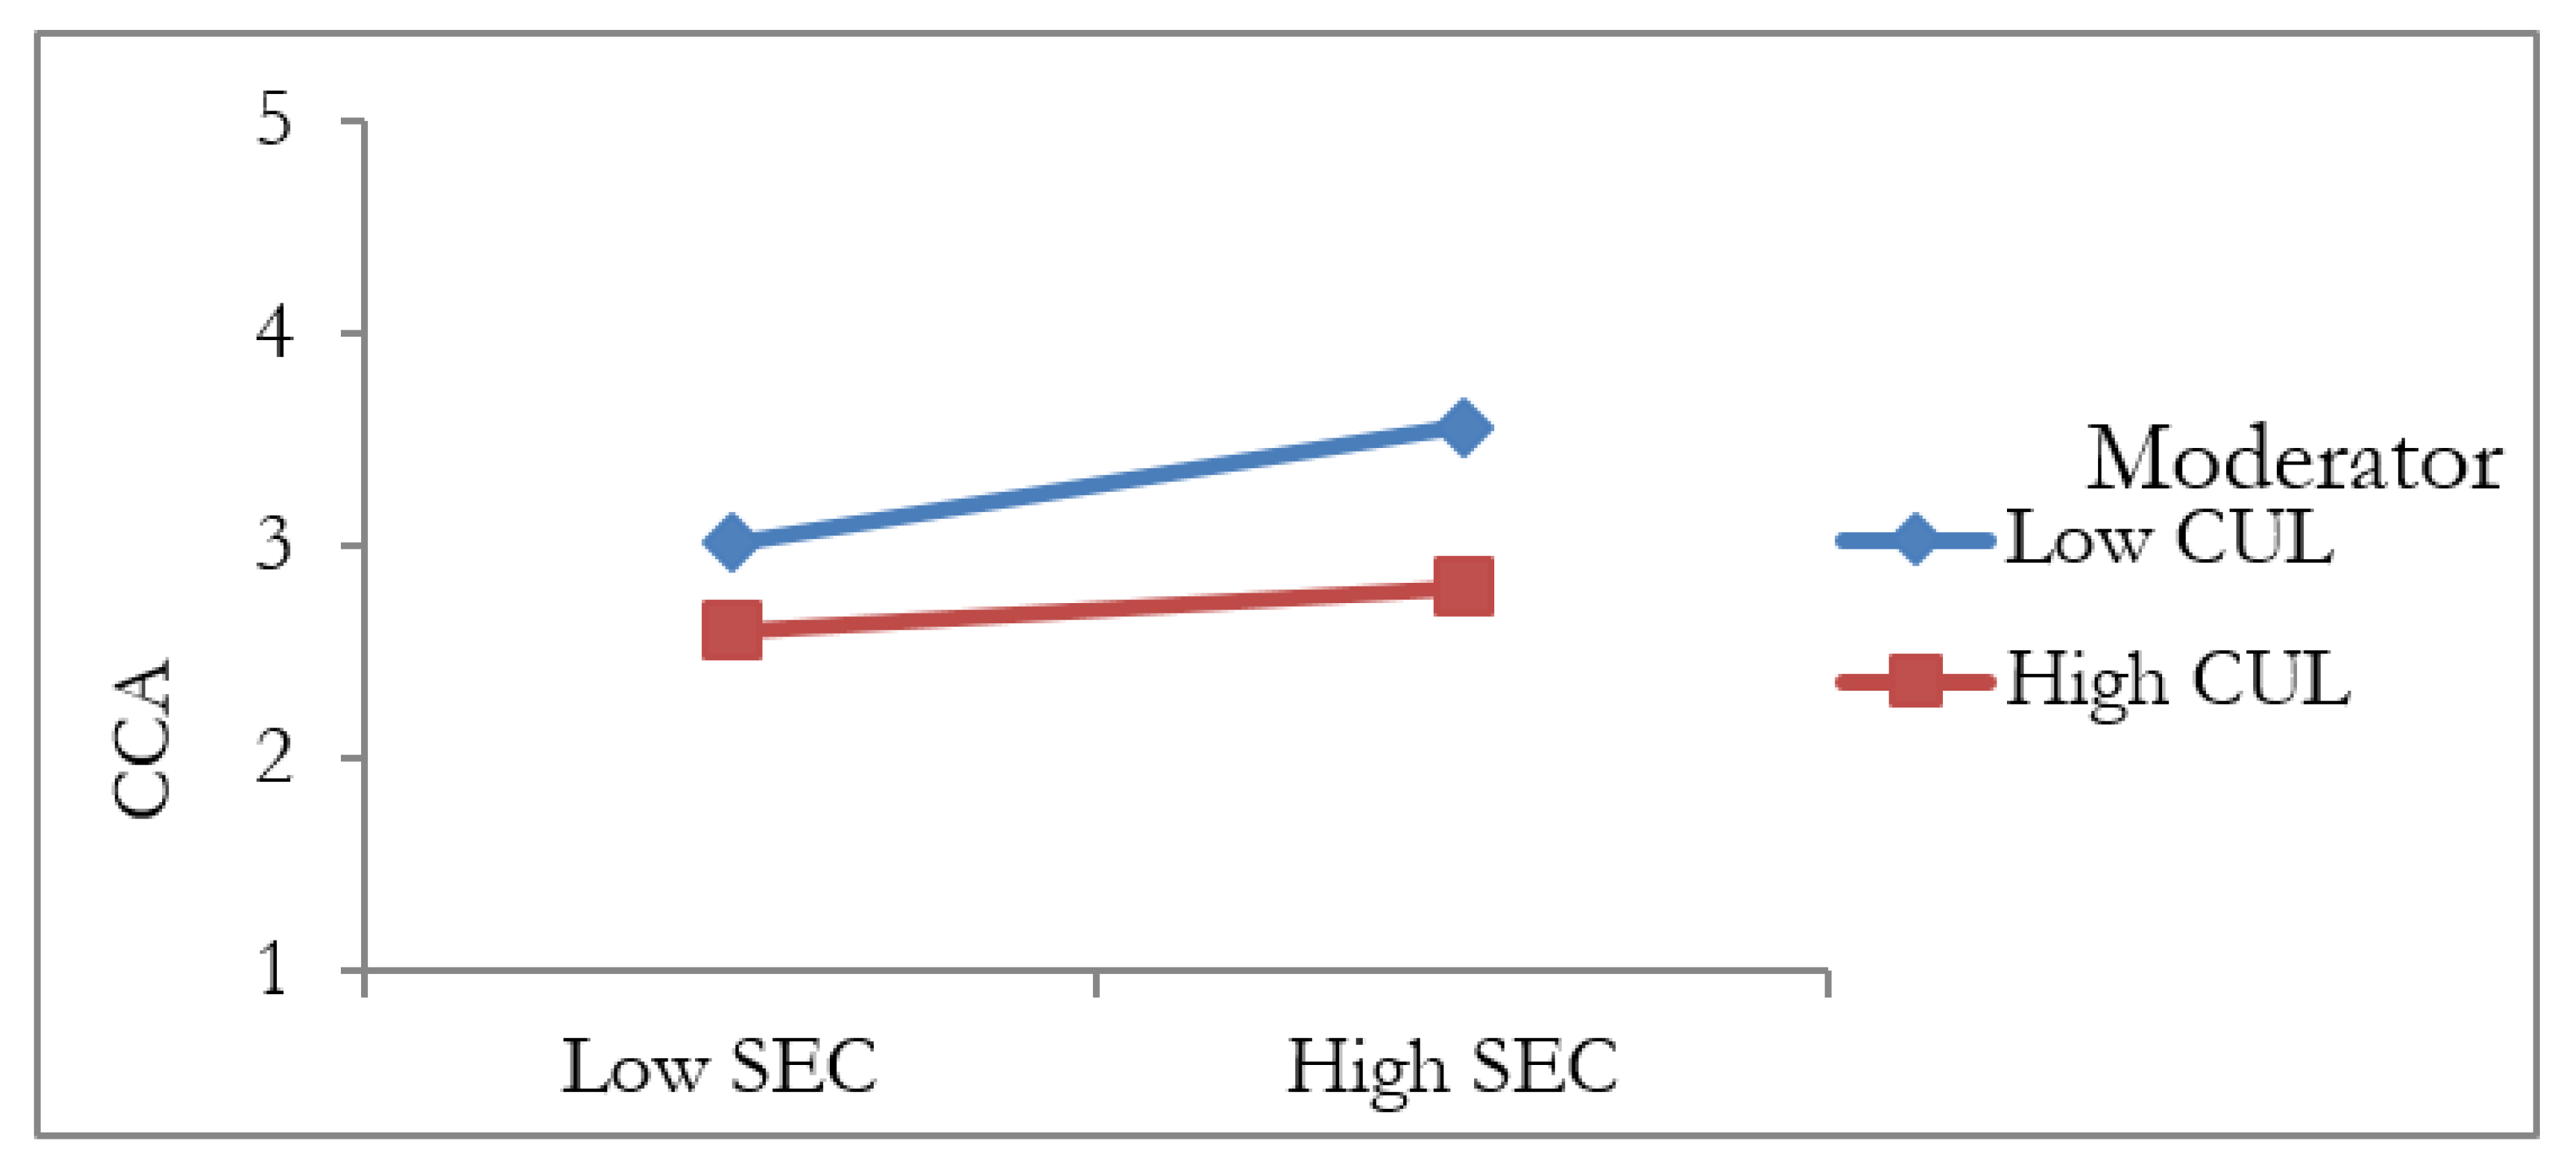
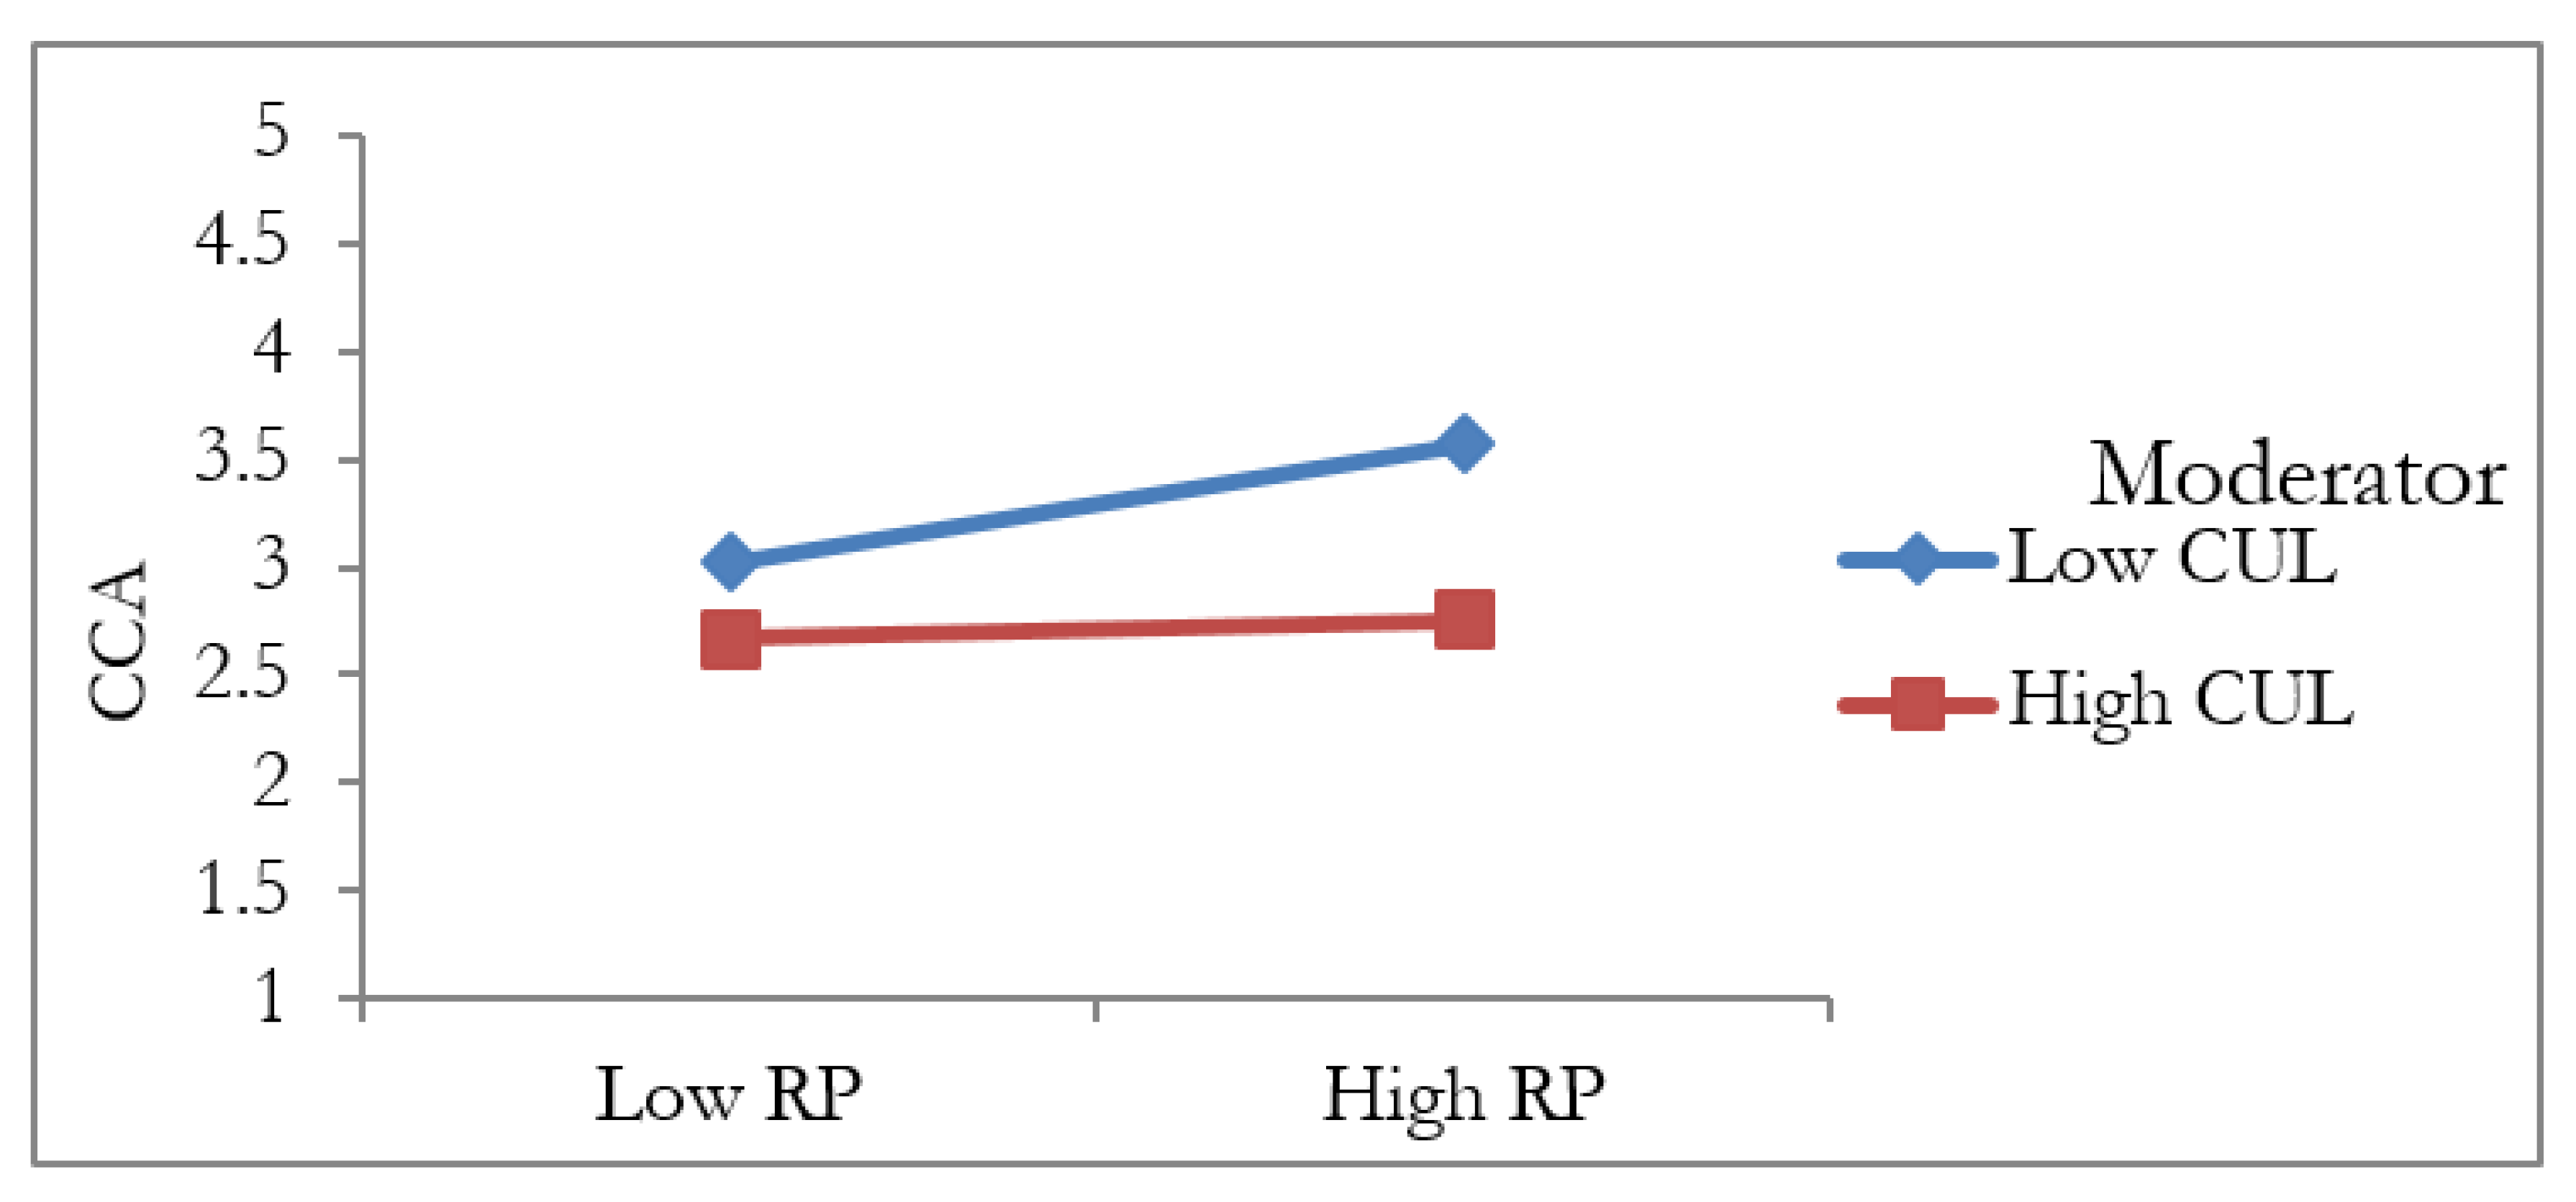
5.4. The Moderation Analysis

In this study, out of the eight moderating hypotheses, five have been proved to be significant. The indicator method was applied using the PLS SEM to estimate the strength of the moderating effect of culture on each of the selected factors as independent factors and cloud computing adoption as dependent variable; this study applied Cohen’s (1988) [69] guidelines for determining the effect size. The indicator approach to test this moderating effect requires the product terms between the indicators of the latent independent variable and those of the latent moderator variable to be created, for use as indicators of the interaction term in the structural model. The procedure was carried out for each of the moderating hypotheses which had been supported (compatibility, relative advantage, reliability, security, and regulatory policy). With respect, the Hypothesis H11, it is found that the relationship is stronger (i.e., more negative) for individuals with high culture than it is for individuals with low culture, as shown in Figure 4.
Similarly, Hypothesis H10 testing indicated a stronger (i.e., more negative) for individuals with high culture than it is for individuals with low culture. As illustrated by Figure 5, the moderating effect shows a stronger negative relationship between relative advantage and CCA for individuals with high culture than it is for individuals with low culture.
With respect to Hypothesis H13, which predicted that culture moderates the relationship between reliability and cloud computing adoption, the moderation relationship is significant. Figure 6 depicts that culture moderated the relationship between reliability and cloud computing adoption, such that this relationship is weaker (i.e., more negative) for individuals with high culture than it is for individuals with low culture.
Furthermore, analysis of Hypothesis H12 proved that culture moderates the relationship between security advantage and CCA. The moderating influence of culture the among between security and cloud computing adoption is depicted in Figure 7, which shows a stronger negative relationship between security and cloud commuting adoption for individuals with high culture than it is for individuals with low culture.
Regarding Hypothesis H17, the culture is found to moderate the relationship between regulatory policy and cloud computing adoption, as expected. The Figure 8 shows that the relationship between regulatory policy and CCA is stronger (i.e., more negative) for individuals with high culture than it is for individuals with low culture.

6. Discussion

The study aims to identify the determinants of cloud computing adoption for HEIs in least developed countries, particularly in Yemen. Three possible determinants were examined namely technological, organizational, and environmental factors, based on the Technology, Organization and Environment (TOE) model. In addition, the study contributes to the body of knowledge in IS adoption by investigating the moderating effect of culture on the relationship between the identified factors and cloud computing adoption. A model was proposed, based on the extended TOE model by including culture as the moderating factor; which was then examined and validated using the PLS-SEM analysis. In particular, this study examined the influence of the independent factors in the technological (i.e., relative advantage, compatibility, security, reliability), organizational (i.e., top management support, technology readiness), and environmental (i.e., regulatory policy, competitive pressure, culture) contexts on the dependent variable (CCA). Out of the nine factors identified, eight were found to support CCA positively (i.e., relationship between security, relative advantages, compatibility, reliability, competitive pressure, top management support, technology readiness, regulatory policy, and CCA). The study also found that culture moderates the relationship between CCA and the following factors: compatibility, reliability, security, relative advantage, and regulatory policy. Other moderators (competitive pressure, top management support, technology readiness, and culture) were found to be insignificant in relation to CCA.
Majority of the existing cloud computing research has focused on the cloud adoption in developed and developing countries [10,11,12]. However, very little is known about factors that influence cloud computing adoption by HEIs in the LDCs. This study has made an important knowledge contribution that can facilitate researchers in understanding the historical, societal, organizational, and cultural factors that can influence the cloud computing adoption by HEIs in the LDCs such as Yemen. As noted, Yemen is one of the first of the LDCs to show an interest in cloud computing adoption. Accordingly, the present study focuses on the cultural factor that might influence CCA in Yemeni HEIs. The area of technology uptake at the institutional level using the TOE framework remains under-researched, particularly in the university contexts. Other studies have explored the uptake of ICT by organizations in developed and developing countries, primarily on e-government, e-readiness and adoption of technology as proposed in the TOE framework [71,72,73,74].
Thus, this study is significant for many reasons. From a theoretical point of view, it investigates CCA at the institutional level and in the context of least developed countries, as well as in a Yemeni cultural and educational environment. It offers Yemeni HEIs the knowledge that can guide their managers or decision makers as they go forward with plans to use digital technologies extensively in the updating of their educational facilities and program. The findings from this study are also significant because they add to the existing knowledge in the discipline of educational theory and technology adoption, highlighting the distinctive cultural context of Yemen, and stressing the serious challenges the country faces in attempting to change educational practices. Consequently, this research adds to the growing body of literature on the adoption of organizational innovation by investigating the influence of three key elements: technological, organizational and environmental. These three elements further include nine distinct dimensions of CCA: (1) four technology characteristics (relative advantage, security, reliability and compatibility); (2) two organizational factors (top management support, technology readiness), and (3) three environmental determinants (regulatory policy, competitive pressure and culture as a moderator). The lack of a theoretical model that could be used to identify the factors that influence the adoption of cloud computing prompted the present study. Consequently, a new model based on the TOE framework was developed, tested and proven to be robust.

7. Conclusions and Future Work

In summary, the cultural background and norms might influence the adoption of new technologies in work environments. This finding is aligned with previous studies which found that membership of a certain group or society has its impact on the individuals’ values and beliefs and consequently on their behavior. For example, Srite stated that cultural discrepancies between countries have an effect on the adoption of new technologies, according to the characteristics of a given society.
Given the above, this study presents some useful information for HEIs, technology consultants, services providers and policy makers in regard to the adoption of cloud computing. Therefore, it can be viewed as relevant to the current era of rapid development of cloud computing technologies.
This study, like all others, suffers from various limitations. It was conducted only among public and private universities; community colleges were not included due to the complicated arrangement of communities located all over Yemen. This limitation therefore restricts the generalization of the findings, opening directions for future research. Although attempts have been made to ensure that the methodology adopted was as rigorous and objective as possible, the following limitations remain; because the study focuses on HEIs in a specific country, Yemen, the findings cannot be generalized to other service sectors or to different geographical areas. The sampled population consisted of employees who were involved in decision making for the HEIs, whose attitudes may differ from those working in other areas. Therefore, the results of the statistical analysis cannot be applied directly to other organizations in Yemen.
The study explores and discusses the determinants affecting CCA without considering other single mediating factors which might influence the relationship between the independent and dependent variables. It enumerates the potential of all the mediating roles of technological, organizational, and environmental factors in the institutions. There is an especial scarcity of studies on CCA for the least developed countries, indicating the need to improve the number of studies in this domain.
Future research can address the limitations outlined above by repeating in other countries to compare the significant factors. Future studies could also assess the implementation process and the impact of cloud computing on university performance in order to gain a holistic understanding of CCA.

Author Contributions

Conceptualization, A.H.A.; Data curation, A.H.A.; Formal analysis, A.H.A.; N.H.Z. and Z.M.A.; Funding acquisition, A.H.A.; Investigation, A.H.A.; Methodology, A.H.A. and Z.M.A. Resources, A.H.A.; Software, N.H.Z.; Supervision, N.H.Z. and Z.M.A.; Writing—original draft, A.H.A. and Z.M.A. All authors have read and agreed to the published version of the manuscript.

Funding

This research received no external funding.

Conflicts of Interest

The authors declare no conflict of interest.

Appendix A

Table A1. Constructs and their Measurement Items.
Constructs Measurement Items
Compatibility51. Cloud computing is suitable for our institution’s IT infrastructure. (COM1)
2. Using cloud computing is compatible with our institution’s culture. (COM2)
3. CCA is compatible with our preferred work practice. (COM3)
4. The use of cloud computing technologies fits well with the way we operate. (COM4)
5. Cloud computing is compatible with our institution’s current hardware and software infrastructure. (COM5)
[30]
Relative Advantage 61. Cloud computing can curtail the time for Information Systems. (RA1)
2. Using cloud computing permits us to perform specific tasks more quickly. (RA2)
3. Cloud computing can lessen IT expenses. (RA3)
4. The use of cloud computing enables people to seize new educational and research opportunities. (RA4)
5. Cloud computing allows us to manage business operations in an efficient way. (RA5)
6. The use of cloud computing services improves the quality of operations. (RA6)
[30,74]
Security51. Our institution is concerned about data security in cloud computing. (SEC1)
2. Our institution is concerned about privacy in cloud computing. (SEC2)
3. Our institution is concerned that data cannot be manipulated by online criminals or hackers. (SEC3)
4. Our institution is concerned with no official data is used for commercial benefit by cloud providers. (SEC4)
5. Our institution is concerned that cloud computing data is not kept private. (SEC5)
[14]
Reliability 51. Cloud computing is an excellent ‘backup’ for my institution’s data against hard-disk crash. (REL1)
2. Cloud computing is acts as excellent disaster recovery (in case of an unforeseen event) with uninterrupted access. (REL2)
3. Cloud computing offers a reliable storage solution for my institution’s data instead of a thumb drive (USB) or portable hard disk. (REL3).
4. Cloud computing offers high uptime and availability of the cloud services round the clock. (REL4).
5. The cloud computing service provider can recover our institution’s data safely even if it gets corrupted by spam or a malware attack. (REL5).
[12]
Top Management Support61. The institution’s top management advocates the implementation of cloud computing. (TMS1)
2. The institution’s top management demonstrates strong leadership and gets involved in the process with respect to cloud computing. (TMS2)
3. The institution’s management is willing to take risks (financial and organizational) involved in CCA. (TMS3)
4. The institution’s top management is aware of the benefits of cloud computing. (TMS4)
5. The institution’s top management is likely to consider the adoption of cloud computing as strategically important. (TMS5)
6. The institution’s top management provides resources for adopting cloud computing. (TMS6)
[30,75]
Technology Readiness51. Our institution knows how cloud computing can be used to support our operations. (TR1)
2. Our institution has the necessary technical, managerial and other skills to implement cloud computing. (TR2)
3. Our institutional values and norms support the adoption of cloud computing in our operations. (TR3)
4. Our institution has sufficient technological resources to implement cloud computing, including high bandwidth connectivity to the Internet. (TR4)
5. Our institution hires highly specialized or knowledgeable personnel for cloud computing. (TR5)”
[30]
Regulatory Policy61. Our country’s laws and regulations facilitate the use of cloud computing. (RP1)
2. Our country’s laws and regulations today are sufficient to protect the use of cloud computing. (RP2)
3. Our government is providing us with incentives to adopt cloud computing technologies. (RP3)
4. Our government is active in setting up the facilities to enable cloud computing. (RP4)
5. Our institution is under pressure from some government agencies to adopt cloud computing technology. (RP5)
6. Current laws and regulations do not allow us to utilize cloud computing resources and services hosted outside our country. (RP6)
[12,74,75,76,77,78]
Competitive Pressure 31. Our institution thinks that cloud computing has an influence on competition. (CP1)
2. Our institution is under pressure from competitors to adopt cloud computing. (CP2)
3. Some of our competitors have already started using cloud computing. (CP3)
[12]
Culture101. The identity of my tribe is an obstacle to an atmosphere of trust toward cloud adoption in my institution (CUL1)
2. The identity of my tribe could be an obstacle to thoughts and ideas in my institution. (CUL2)
3. My tribe identity prevents me from making suggestions or decisions in my institution. (CUL3)
4. The identity of my tribe could be an obstacle to sharing data and to personal privacy in my institution. (CUL4)
5. The tribe culture influences the leaders’ decision in my institution to adopting cloud computing. (CUL5)
6. Cloud computing adoption is an important need to group rather than individual needs. (CUL6)
7. Developing and adopting new technologies requires more freedom and fewer tribal restrictions. (CUL7)
8. Because of tribal identity, it is not easy to adopt cloud computing in HEI. (CUL8)
9. Tribalism supports teamwork and will encourage working within a cloud computing environment. (CUL9)
10. Influential people in the tribe should establish campaigns in the society to spread awareness of CCA and encourage it use. (CUL10)”
Abdullah Hussein Alghushami (paper authoer)
Cloud computing adoption 1CCA1:—What stage of cloud computing adoption is your institution currently involved in?
  • Takes no account of cloud computing
  • Has evaluated but not planned CCA
  • Evaluating cloud
  • Has evaluated and is planning adoption
  • Already adopted cloud computing.
[12,30]

References

  1. Monroy, C.R.; Arias, C.A.; Guerrero, Y.N. The New Cloud Computing Paradigm: The Way to IT Seen as a Utility. Lat. Am. Caribb. J. Eng. Educ. 2013, 6, 24–31. [Google Scholar]
  2. Sabi, H.M.; Uzoka, F.-M.E.; Langmia, K.; Njeh, F.N. Conceptualizing a model for adoption of cloud computing in education. Int. J. Inf. Manag. 2016, 36, 183–191. [Google Scholar] [CrossRef]
  3. Anderson, J.; Rainie, L. The Future of Cloud Computing. 2010. Available online: http://pewinternet.org/Reports/2010/The-future-of-Cloud-computing.aspx (accessed on 11 August 2018).
  4. Cearley, D.W. The Top 10 Strategic Technology Trends for 2014. 2014. Available online: http://www.gartner.com/doc/2667526 (accessed on 29 January 2017).
  5. Ercan, T. Effective use of cloud computing in educational institutions. Procedia Soc. Behav. Sci. 2010, 2, 938–942. [Google Scholar] [CrossRef] [Green Version]
  6. Alabbadi, M.M. Cloud computing for education and learning: Education and learning as a service (ELaaS). In Proceedings of the 2011 14th International Conference on Interactive, Collaborative Learning, Piest’any, Slovakia, 21–23 September 2011; pp. 589–594. [Google Scholar]
  7. Zissis, D.; Lekkas, D. Addressing cloud computing security issues. Futur. Gener. Comput. Syst. 2012, 28, 583–592. [Google Scholar] [CrossRef]
  8. Chun, S.-H.; Choi, B.-S. Service models and pricing schemes for cloud computing. Clust. Comput. 2014, 17, 529–535. [Google Scholar] [CrossRef]
  9. Sakr, S. Cloud-hosted databases: Technologies, challenges and opportunities. Clust. Comput. 2013, 17, 487–502. [Google Scholar] [CrossRef]
  10. Greengard, S. Cloud computing and developing nations. Commun. ACM 2010, 53, 18–20. [Google Scholar] [CrossRef]
  11. Hailu, A. Factors Influencing Cloud-Computing Technology Adoption in Developing Countries. Ph.D. Thesis, Capella University, Minneapolis, MN, USA, 2012. [Google Scholar]
  12. Tashkandi, A.; Al-Jabri, I. Cloud Computing Adoption by Higher Education Institutions in Saudi Arabia: Analysis Based on TOE. In Proceedings of the 2015 International Conference on Cloud Computing (ICCC), Riyadh, Saudi Arabia, 26–29 April 2015; pp. 1–8. [Google Scholar]
  13. Abdulrab, S. The Impact of Culture on Information Technology Adoption in Universities; Robert Morris University: Pittsburgh, PA, USA, 2011. [Google Scholar]
  14. Law, M. Cloud Computing Basics; Hillcrest Media Group, Inc.: Minneapolis, MN, USA, 2011. [Google Scholar]
  15. United Nations. World Economic Situation and Prospects 2015. 2015. Available online: http://www.un.org/en/development/desa/policy/wesp/wesp_current/2015wesp_country_classification.pdf (accessed on 20 March 2016).
  16. UNCTAD. The Least Developed Countries Report, Transforming Rural Economies; IEEE: Piscataway, NJ, USA, 2015. [Google Scholar]
  17. Benlian, A.; Hess, T. Opportunities and risks of software-as-a-service: Findings from a survey of IT executives. Decis. Support Syst. 2011, 52, 232–246. [Google Scholar] [CrossRef]
  18. Lin, A.; Chen, N.-C. Cloud computing as an innovation: Percepetion, attitude, and adoption. Int. J. Inf. Manag. 2012, 32, 533–540. [Google Scholar] [CrossRef]
  19. Alshamaila, Y.; Papagiannidis, S.; Li, F. Cloud Computing Adoption by SMEs in the North East of England: A Multi-perspective Framework. J. Enterp. Inf. Manag. 2013, 26, 250–275. [Google Scholar] [CrossRef] [Green Version]
  20. Herbig, P.; Dunphy, S. Culture and Innovation. Cross Cult. Manag. 1998, 5, 13–25. [Google Scholar] [CrossRef]
  21. Brender, N.; Markov, I. Risk perception and risk management in cloud computing: Results from a case study of Swiss companies. Int. J. Inf. Manag. 2013, 33, 726–733. [Google Scholar] [CrossRef] [Green Version]
  22. Srite, M.; Karahanna, E. The Role of Espoused National Cultural Values in Technology Ccceptance. MIS Q. 2006, 30, 679–704. [Google Scholar] [CrossRef] [Green Version]
  23. Motaher, M. National Information Center of the Republic of Yemen. Int. J. Soc. Econ. 2015, 31, 94–110. [Google Scholar]
  24. Baabbad, M. The Influence of Tribalism on Perceived Auditor Independence: The Yemeni Evidence. Int. Bus. Manag. 2015, 12, 17–25. [Google Scholar]
  25. Manea, E.M. Yemen, the Tribe and the State. In International Colloquium on Islam and Social Change; Springer: Berlin/Heidelberg, Germany, 2006. [Google Scholar]
  26. Peterson, J.E. Tribes and Politics in Yemen. In Arabian Peninsula Background Note; IEEE: Piscataway, NJ, USA, 2008. [Google Scholar]
  27. Corstange, D. Tribes and the Rule of Law in Yemen. In Annual Conference of the Middle East Studies Association; IEEE: Piscataway, NJ, USA, 2008. [Google Scholar]
  28. Mdabesh, A. The Equation of the Tribe in Yemen. Middle East Newsp. 2010, 34, 11671. [Google Scholar]
  29. Phillips, S. Yemen: On the Brink, What Comes Next in Yemen? Al-Qaeda, the Tribes, and State-Building; Pearson Press: Washington, DC, USA, 2010. [Google Scholar]
  30. Oliveira, T.; Thomas, M.; Espadanal, M. Assessing the determinants of cloud computing adoption: An analysis of the manufacturing and services sectors. Inf. Manag. 2014, 51, 497–510. [Google Scholar] [CrossRef]
  31. Kendall, J.D.; Tung, L.L.; Chua, K.H.; Ng, C.H.D.; Tan, S.M. Receptivity of Singapore’s SMEs to electronic commerce adoption. J. Strat. Inf. Syst. 2001, 10, 223–242. [Google Scholar] [CrossRef]
  32. Kuan, K.K.Y.; Chau, P.Y.K. A perception-based model for EDI adoption in small businesses using a technology–organization–environment framework. Inf. Manag. 2001, 38, 507–521. [Google Scholar] [CrossRef]
  33. OECD. The E-Government Imperative: Main Findings; OECD: London, UK, 2003. [Google Scholar]
  34. Abdalla, S. An E-Government Adoption Framework for Developing Countries: A Case Study from Sudan. Ph.D. Thesis, Cranfield University, Cranfield, UK, 2012. [Google Scholar]
  35. Alsanea, M. Factors Affecting the Adoption of Cloud Computing in Saudi Arabia’s Government Sector. Master’s Thesis, University of London, London, UK, 2015. [Google Scholar]
  36. Borgman, H.P.; Bahli, B.; Heier, H.; Schewski, F. Cloudrise: Exploring Cloud Computing Adoption and Governance with the TOE Framework. In Proceedings of the 2013 46th Hawaii International Conference on System Sciences, Malaysia, IEEE, Wailea, HI, USA, 7–10 January 2013; pp. 4425–4435. [Google Scholar]
  37. Chang, V.; Walters, R.J.; Wills, G. The development that leads to the Cloud Computing Business Framework. Int. J. Inf. Manag. 2013, 33, 524–538. [Google Scholar] [CrossRef] [Green Version]
  38. DePietro, R.; Wiarda, E.; Fleischer, M. The Context for Change: Organization, Technology and Environment. In The Process of Technological Innovation; Tornatzky, L.G., Fleischer, M., Eds.; Lexington Books: Lexington, KY, USA, 1990; pp. 151–175. [Google Scholar]
  39. Sabherwal, R.; Jeyaraj, A.; Chowa, C. Information System Success: Individual and Organizational Determinants. Manag. Sci. 2006, 52, 1849–1864. [Google Scholar] [CrossRef] [Green Version]
  40. Yoon, T. An Empirical Investigation of Factors Affecting Organizational Adoption of Virtual Worlds. Ph.D. Thesis, Florida State University, Tallahassee, FL, USA, 2009. [Google Scholar]
  41. Low, C.; Chen, Y.; Wu, M. Understanding the determinants of cloud computing adoption. Ind. Manag. Data Syst. 2011, 111, 1006–1023. [Google Scholar] [CrossRef] [Green Version]
  42. Klug, W. The Determinants of Cloud Computing Adoption by Colleges and Universities; ProQuest: Ann Arbor, MI, USA; Dissertations Publishing: London UK, 2014. [Google Scholar]
  43. Hsu, P.-F.; Ray, S.; Li-Hsieh, Y.-Y. Examining cloud computing adoption intention, pricing mechanism, and deployment model. Int. J. Inf. Manag. 2014, 34, 474–488. [Google Scholar] [CrossRef]
  44. Davison, R.M.; Martinsons, M.G. Guest editorial cultural issues and it management: Past and present. IEEE Trans. Eng. Manag. 2003, 50, 3–7. [Google Scholar] [CrossRef] [Green Version]
  45. Zhao, F.; Scheruhn, H.-J.; Von Rosing, M. The Impact of Culture Differences on Cloud Computing Adoption. Lect. Notes Comput. Sci. 2014, 22, 776–785. [Google Scholar] [CrossRef]
  46. Venkatesh, V.; Thong, J.Y.L.; Xu, X. Consumer Acceptance and Use of Information Technology: Extending the Unified Theory of Acceptance and Use of Technology. MIS Q. 2012, 36, 157–178. [Google Scholar] [CrossRef] [Green Version]
  47. Straub, D.; Loch, K.; Hill, C. Transfer of Information Technology to the Arab World: A Test of Cultural Influence Modeling. Adv. Top. Glob. Inf. Manag. 2003, 2, 141–172. [Google Scholar]
  48. Premkumar, G.; Ramamurthy, K. The Role of Interorganizational and Organizational Factors on the Decision Mode for Adoption of Interorganizational Systems. Decis. Sci. 1995, 26, 303–336. [Google Scholar] [CrossRef]
  49. Premkumar, G.; Roberts, M. Adoption of new information technologies in rural small businesses. Omega 1999, 27, 467–484. [Google Scholar] [CrossRef]
  50. Zhu, K.; Kraemer, K.L.; Xu, S.X. The Process of Innovation Assimilation by Firms in Different Countries: A Technology Diffusion Perspective on E-Business. Manag. Sci. 2006, 52, 1557–1576. [Google Scholar] [CrossRef] [Green Version]
  51. Luo, X.; Gurung, A.; Shim, J.P. Understanding the Determinants of User Acceptance of Enterprise Instant Messaging: An Empirical Study. J. Organ. Comput. Electron. Commer. 2010, 20, 155–181. [Google Scholar] [CrossRef] [Green Version]
  52. Alam, S.S.; Ali, Y.; Jani, M.F.M. An Empirical Study of Factors Affecting Electronic Commerce Adoption Among SMEs in Malaysia. J. Bus. Econ. Manag. 2011, 12, 375–399. [Google Scholar] [CrossRef] [Green Version]
  53. Ifinedo, P. An Empirical Analysis of Factors Influencing Internet/E-Business Technologies Adoption by SMEs in Canada. Int. J. Inf. Technol. Decis. Mak. 2011, 10, 731–766. [Google Scholar] [CrossRef]
  54. Sekaran, U. Research Methods for Business: A Skill Building Approach, 4th ed.; Wiley: New York, NY, USA, 2003. [Google Scholar]
  55. Peterson, R.A.; Kim, Y. On the relationship between coefficient alpha and composite reliability. J. Appl. Psychol. 2013, 98, 194–198. [Google Scholar] [CrossRef] [PubMed]
  56. Hair, J.F.; Ringle, C.M.; Sarstedt, M. PLS-SEM: Indeed a Silver Bullet. J. Mark. Theory Pract. 2011, 19, 139–152. [Google Scholar] [CrossRef]
  57. Hair, J.F.; Hult, G.T.M.; Ringle, C.M.; Sarstedt, M. A Primer on Partial Least Squares Structural Equation Modelling (PLS-SEM); SAGE Publications, Inc.: Washington, DC, USA, 2014. [Google Scholar]
  58. Lee, Y.-C.; Lee, S.-K. Capabilities, processes, and performance of knowledge management: A structural approach. Hum. Factors Ergon. Manuf. 2006, 17, 21–41. [Google Scholar] [CrossRef]
  59. Bagozzi, R.P.; Yi, Y. On the evaluation of structural equation models. J. Acad. Mark. Sci. 1988, 16, 74–94. [Google Scholar] [CrossRef]
  60. Coltman, T.; DeVinney, T.M.; Midgley, D.F.; Venaik, S. Formative versus reflective measurement models: Two applications of formative measurement. J. Bus. Res. 2008, 61, 1250–1262. [Google Scholar] [CrossRef] [Green Version]
  61. Chin, W.W. The Partial Least Squares Approach to Structural Equation Modeling. Mod. Methods Bus. Res. 1998, 295, 295–336. [Google Scholar] [CrossRef] [Green Version]
  62. Hair, J.F.; Black, W.C.; Babin, B.J.; Anderson, R.E. Multivariate Data Analysis, 7th ed.; Pearson Education: London, UK; Pearson Prentice Hall: Upper Saddle River, NJ, USA, 2010. [Google Scholar]
  63. Chin, W.W. The Partial Least Squares Approach for Structural Equation Modeling; Marcoulides, G.A., Ed.; Lawrence Erlbaum Associates: London, UK, 1998; pp. 295–336. [Google Scholar]
  64. Duarte, P.; Raposo, M.L. A PLS Model to Study Brand Preference: An Application to the Mobile England, Pearson Phone Market; Springer: Berlin/Heidelberg, Germany, 2010. [Google Scholar]
  65. Fornell, C.; Larcker, D.F. Evaluating Structural Equation Models with Unobservable Variables and Measurement Error. J. Mark. Res. 1981, 18, 39. [Google Scholar] [CrossRef]
  66. Henseler, J.; Sarstedt, M. Goodness-of-fit indices for partial least squares path modeling. Comput. Stat. 2013, 28, 565–580. [Google Scholar] [CrossRef] [Green Version]
  67. Hair, J.F.; Sarstedt, M.; Hopkins, L.; Kuppelwieser, V.G. Partial least squares structural equation modeling (PLS-SEM). Eur. Bus. Rev. 2014, 26, 106–121. [Google Scholar] [CrossRef]
  68. Falk, R.; Miller, N. AXL Press, Primer for Soft Modeling; Brunel University: London, UK, 1992. [Google Scholar]
  69. Cohen, J. Statistical Power Analysis for the Behavioral Sciences, 2nd ed.; Lawrence Erlbaum Associates Publishers: New York, NY, USA, 1988. [Google Scholar]
  70. Hair, J.F.; Hult, G.T.M.; Ringle, C.M.; Sarstedt, M. A Primer on Partial Least Squares Structural Equation Modeling (PLS-SEM), 2nd ed.; SAGE Publications, Inc.: Washington, DC, USA, 2017. [Google Scholar]
  71. Altameem, T.A. The Critical Factors of E-Government Adoption: An Empirical Study in the Saudi Arabia Public Sectors; Brunel University: London, UK, 2007. [Google Scholar]
  72. Alhujran, O. Determinants of E-Government Services Adoption in Developing Countries: A Field Survey and a Case Study. Ph.D. Thesis, University of Wollongong, Dubai, UAE, 2009. [Google Scholar]
  73. Seng, W.M.; Jackson, S.; Philip, G. Cultural issues in developing E-Government in Malaysia. Behav. Inf. Technol. 2010, 29, 423–432. [Google Scholar] [CrossRef]
  74. Alghushami, A.; Zakaria, N.H.; Aji, Z.M. The determinants impacting the adoption of cloud computing in Yemen institutions. AIP Conf. Proc. 2018, 2016, 020022. [Google Scholar]
  75. Alkawsi, G.A.; Ali, N.; Mustafa, A.S.; Baashar, Y.; Alhussian, H.; Alkahtani, A.; Tiong, S.K.; Ekanayake, J. A hybrid SEM-neural network method for identifying acceptance factors of the smart meters in Malaysia: Challenges perspective. Alexandria Eng. J. 2020. [Google Scholar] [CrossRef]
  76. Alkawsi, G.A.; Mahmood, A.K.; Baashar, Y.M. Factors influencing the adoption of cloud computing in SME: A systematic review. In Proceedings of the 2015 International Symposium on Mathematical Sciences and Computing Research, iSMSC 2015—Proceedings, Ipon, Malaysia, 19–20 May 2015. [Google Scholar]
  77. Alkawsi, G.; Baashar, Y. An empirical study of the acceptance of IoT-based smart meter in Malaysia: The effect of electricity-saving knowledge and environmental awareness. IEEE Access 2020. [Google Scholar] [CrossRef]
  78. Alkawsi, G.A.; Ali, N.B.; Alghushami, A. Toward understanding individuals’ acceptance of internet of things—Based services: Developing an instrument to measure the acceptance of smart meters. J. Theor. Appl. Inf. Technol. 2018, 96. [Google Scholar]
Figure 1. The Research Model.
Applsci 10 08098 g001
Figure 2. The Measurement Model, “*” means moderating between IV and DV
Applsci 10 08098 g002
Figure 3. The Structural Model. “*” means moderating between IV and DV.
Applsci 10 08098 g003
Figure 4. Interaction Effect of compatibility (COM) and culture (CUL) on cloud computing adoption (CCA).
Applsci 10 08098 g004
Figure 5. Interaction Effect of relative advantage (RA) and culture (CUL) on cloud computing adoption (CCA).
Applsci 10 08098 g005
Figure 6. Interaction Effect reliability (REL) and culture (CUL) on cloud computing adoption (CCA).
Applsci 10 08098 g006
Figure 7. Interaction Effect of security (SEC) and culture (CUL) on cloud computing adoption (CCA).
Applsci 10 08098 g007
Figure 8. Interaction Effect of regulatory policy (RP) and culture (CUL) on cloud computing adoption (CCA).
Applsci 10 08098 g008
Table 1. Questionnaire Pre-test Modification.
NameField of SpecializationResults/Outcomes
First PresentationA1PhD in IT
-
Modified the main covering letter to be more precise and explain the purpose of the questionnaire.
-
Changed and updated some questions in the demographics section.
-
Modified all the items for the different variables in all the cloud computing areas (in the English language) to facilitate understanding of the Likert scale of measurement.
-
Recommended collecting the questionnaires face to face to answer any queries and to increase the response rate.
B1PhD in IT
-
Modified some items in the field of culture factors.
-
Suggested modification to the compatibility questions (Section 3), to make them more understandable.
C1MSc in IS
-
Modified the wording (in Arabic) of some items in different fields
D1PhD in Project Management
-
Suggested modification of the formulation of the Independent Variable (Regulatory policy) in part3 to facilitate understanding and response.
E1MSc in Project Management
-
Modified an item in the field of security factor (in English), which needed more explanation
Second PresentationA2PhD in English literature
-
Everything was clear and understandable; minor translating corrections the Arabic version.
B2MSc in Information Management
-
Everything was clear and understandable
C2PhD in IT
-
Everything was clear and understandable
D2BSc in Computer Networking.
-
Everything was clear and understandable
E2PhD in Business IT
-
Everything was clear and understandable and no correction was required.
Table 2. Results of the Face Validity.
NameCountryField of SpecializationResults/Outcomes
Expert ASaudi Arabia (Aldammam)PhD in IT
  • Added some remarks in part 1 of the questionnaire on respondents’ demographic data: their work performance and years of experience.
Expert BYemen
(Amran)
Professor in IT (Cloud computing)
  • Modification of wording in different parts to make it more understandable to the respondents.
Expert CMalaysia
(Kuala Lumpur)
PhD in Computer Science
  • Length of survey was decreased and various questions were reworded for improved clarity.
Expert DQatar
(Doha)
Professor in IT
  • Audited the English language of the first draft of the questionnaire and modified some words.
  • Proposed the words of the rating scale (the five- point Likert scale) for each field.
Expert EMalaysia
(Pahang)
PhD Student in Information System
  • Audited the covering letter and the general structure of the questionnaire.
Expert FSana’a
(Yemen)
MSc in English Literature
  • Audited the Arabic language in the translation of the questionnaire.
Expert G(Istanbul)
Turkey
PhD student in
Urban Planning
  • Reviewed English language and checked Arabic translation of the questionnaire.
Table 3. Item Loadings, Average Variance Extracted and Composite Reliability.
ConstructsItemsLoadingsComposite Reliability (CR)Average Variance Extracted (AVE)
CultureCUL1
CUL2
CUL3
CUL4
CUL5
CUL8
CUL9
0.831
0.865
0.834
0.876
0.818
0.727
0.730
0.9320.662
Competitive PressureCP1
CP2
CP3
0.819
0.859
0.815
0.8700.691
Top Management SystemTMS4
TMS5
TMS6
0.720
0.705
0.727
0.7610.515
Technology ReadinessTR2
TR3
TR5
0.848
0.852
0.846
0.8850.720
CompatibilityCOM2
COM3
COM4
COM5
0.838
0.879
0.870
0.815
0.9130.724
Relative AdvantageRA3
RA4
RA6
0.808
0.789
0.793
0.8390.635
ReliabilityREL1
REL2
REL3
REL4
0.855
0.841
0.852
0.803
0.9040.703
SecuritySEC2
SEC3
SEC5
0.903
0.918
0.881
0.9280.811
Regulatory PolicyRP1
RP3
0.903
0.889
0.8900.802
Cloud Computing AdoptionCCA10.9890.9890.989
Table 4. Latent Variable Correlations and Square Roots of Average Variance Extracted.
Latent
Variables
CCACOMCPCULRARELRPSECTMSTR
CCA1.000
COM0.7850.851
CP0.6390.5760.831
CUL−0.805−0.684−0.5380.813
RA0.5640.5200.402−0.4580.797
REL0.7630.8200.536−0.6610.4500.838
RP0.7340.6290.510−0.9290.4320.6120.896
SEC0.7540.6270.522−0.7870.3810.6100.7470.901
TMS0.6210.4780.414−0.6100.2390.4740.5700.5560.717
TR0.7710.6800.491−0.7220.4670.7220.6630.6850.5100.849
Note. CCA = Cloud Computing Adoption, COM = Compatibility, CP = Competitive Pressure, CUL = Culture, RA = Relative Advantage, REL = Reliability, RP = Regulatory Policy, SEC = Security, TMS = Top Management System, TR = Technology Readiness.
Table 5. Cross Loading.
ConstructsCULCPTMSTRCOMRARELSECRPCCA
CUL10.831−0.479−0.518−0.595−0.605−0.444−0.576−0.703−0.903−0.678
CUL20.865−0.523−0.554−0.671−0.661−0.431−0.624−0.742−0.798−0.745
CUL30.834−0.434−0.503−0.593−0.520−0.326−0.518−0.633−0.889−0.637
CUL40.876−0.455−0.520−0.630−0.620−0.399−0.601−0.690−0.780−0.710
CUL50.818−0.364−0.431−0.559−0.568−0.350−0.540−0.609−0.694−0.645
CUL80.727−0.392−0.422−0.510−0.475−0.332−0.451−0.525−0.602−0.559
CUL90.730−0.402−0.513−0.532−0.413−0.309−0.424−0.550−0.596−0.589
CP1−0.4310.8190.3250.3600.4640.3270.4190.4310.4180.515
CP2−0.4540.8590.3430.4750.4650.3190.5120.4530.4390.534
CP3−0.4560.8150.3630.3860.5040.3550.4050.4180.4150.543
TMS4−0.6610.4270.7200.5260.4450.2920.4590.5900.6040.573
TMS5−0.2280.1950.7050.2270.2420.0550.2170.2140.2190.336
TMS6−0.2670.1780.7270.2330.2710.0840.2600.2600.2690.340
TR2−0.5570.3760.4010.8480.5450.3400.5930.5340.5060.605
TR3−0.6250.4420.4420.8520.6140.4530.6520.5710.5800.692
TR5−0.6500.4260.4520.8460.5700.3870.5900.6360.5970.662
COM2−0.5630.4790.3990.5600.8380.4910.6250.5120.5180.666
COM3−0.6190.5320.4220.5770.8790.4480.6790.5510.5740.676
COM4−0.5910.4720.3870.5910.8700.4290.7190.5480.5290.673
COM5−0.5910.4750.1300.5870.8150.4020.7690.5200.5200.657
RA3−0.3920.3490.2130.3740.4440.8080.3970.2910.3630.466
RA4−0.3280.2760.1120.3370.3750.7890.3090.2650.3170.401
RA6−0.3690.3300.2350.3990.4200.7930.3620.3490.3480.474
REL1−0.5720.4780.4340.6210.7670.4180.8550.5380.5140.662
REL2−0.5250.3970.3350.6130.6690.3490.8410.4530.4830.619
REL3−0.5450.4450.3940.6030.6640.3600.8520.5120.5230.643
REL4−0.5730.4750.4220.5820.6470.3780.8030.5410.5300.633
SEC2−0.7200.4670.4760.6050.5960.3900.5580.9030.6800.684
SEC3−0.7060.4420.4940.6310.5250.3170.5440.9180.6760.671
SEC5−0.7010.5020.5320.6140.5700.3220.5470.8810.6610.680
RP1−0.8310.4790.5180.5950.6050.4440.5760.7030.9030.678
RP3−0.8340.4340.5030.5930.5200.3260.5180.6330.8890.637
CCA1−0.8050.6390.6210.7710.7850.5640.7630.7540.7341.000
Note. CCA = Cloud Computing Adoption, COM = Compatibility, CP = Competitive Pressure, CUL = Culture, RA = Relative Advantage, REL = Reliability, RP = Regulatory Policy, SEC = Security, TMS = Top Management System, TR = Technology Readiness.
Table 6. Structural Model Assessment with All Values.
HRelationOriginal Sample Standard Deviation T Valuep ValueFinding
H1RA -> CCA0.1310.0304.3920.000Supported
H2COM -> CCA0.1790.0443.5620.000Supported
H3SEC -> CCA0.1760.0384.5910.000Supported
H4REL -> CCA0.1060.0412.6010.009Supported
H5TMS -> CCA0.1360.0274.9710.000Supported
H6TR -> CCA0.1580.0374.3190.000Supported
H7RP -> CCA0.1490.0592.5500.011Supported
H8CP -> CCA0.1070.0313.4700.001Supported
H9CUL -> CCA−0.2990.0704.2860.000Supported
H10RA * CUL -> CCA−0.0490.0242.0810.038Supported
H11COM * CUL -> CCA−0.1330.0462.9020.004Supported
H12SEC * CUL -> CCA−0.0750.0362.0840.037Supported
H13REL * CUL -> CCA−0.1240.0432.9270.003Supported
H14TMS * CUL -> CCA−0.0050.0240.2300.818Not Supported
H15TR * CUL -> CCA−0.0110.0360.2880.773Not Supported
H16CP * CUL -> CCA−0.0260.0290.9090.364Not Supported
H17RP * CUL -> CCA−0.0990.0422.3670.018Supported
Note. H = Hypothesis, COM = Compatibility, CCA = CCA, CUL = Culture, CP = Competitive Pressure, RA = Relative Advantage, REL = Reliability, RP = Regulatory Policy, SEC = Security, TM S= Top Management System, TR = Technology Readiness, CCA = Cloud Computing Adoption. “*” means moderating between IV and DV.
Table 7. Effect Size of Predictive Variables.
Predecessor Latent VariablesDependent Variable(R2) Incl(R2) ExclEffect size (f2)Remarks
CultureCCA0.840.790.23Medium
Competitive PressureCCA0.840.790.12Small
Top Management SystemCCA0.840.760.39Large
Technology ReadinessCCA0.840.800.15Small
CompatibilityCCA0.840.790.22Medium
Relative AdvantageCCA0.840.760.38Large
ReliabilityCCA0.840.820.06Small
SecurityCCA0.840.820.04Small
Regulatory PolicyCCA0.840.800.20Medium
Publisher’s Note: MDPI stays neutral with regard to jurisdictional claims in published maps and institutional affiliations.

