Abstract
The transport characteristics of waste glass powder incorporated self-compacting concrete (SCC) for a number of different durability indicators are reported in this paper. SCC mixes were cast at a water to binder ratio of 0.4 using glass powders with a mean particle size of 10, 20 and 40 µm and at cement replacement levels of 20, 30 and 40%. The oxygen permeability, electrical resistivity, porosity and chloride diffusivity were measured at different ages from 3 to 545 days of curing. The amount and particle size of the incorporated waste glass powder was found to influence the durability properties of SCC. The glass incorporated SCC mixes showed similar or better durability characteristics compared to general purpose (GP) and fly ash mixes at similar cement replacement level. A significant improvement in the transport properties of the glass SCC mixes was observed beyond 90 days.
1. Introduction
The durability of concrete can be defined as its ability to resist weathering action, chemical attack, abrasion and any other mechanism of deterioration while preserving its original form. The degree of deterioration is strongly related to the resistance of the cover layer to transport mechanisms, such as permeation, absorption, and diffusion of gas and liquid [1]. The use of supplementary cementitious materials (SCMs) in concrete helps in increasing resistance towards most of the durability related issues. The benefits of using silica fume, fly ash, slag and calcined clay has been widely demonstrated [2,3,4,5,6]. The use of waste glass powder as a potential SCM has also received significant interest in the last two decades [4,7,8,9]. The early age compressive strength for concrete containing glass powder is generally lower than the equivalent PC concrete. Similar strength values for glass powered concrete however have been reported at 90 days for replacement levels of up to 30% [10,11,12]. Further grinding of the glass powder can reduce the average particle size and help to offset the lower early age compressive strength [10,13]. Increasing the fineness and proportion of glass powder however has been shown to negatively affect the workability of the mix [14,15]. The irregular angular shape of the glass particles is responsible for the increased water demand compared to PC mixes. Numerous studies have reported the implications of using glass powder on the fresh and mechanical properties of concrete; however, limited information is available on the durability performance of such concrete.
The rapid development in the infrastructure sector around the world is expected to increase the demand for cement from current the levels of ~4 billion tonnes to ~6 billion tonnes by 2050 [16]. The large carbon footprint associated with the cement industry makes it imperative to develop sustainable solutions that promote the judicious use of materials and increased service life of concrete structures with minimal maintenance. The global supply of waste glass represents approximately ~3% (130 million tonnes) of the total cement consumption [17]. While this a relatively small proportion it does provide a possible option for diverting a waste stream from land fill and may be of particular benefit in areas that have limited supplies of more traditional SCMs such as fly ash, slag or silica fume. Establishing the durability characteristics of glass powder therefore is imperative to ensure its usage in the concrete industry together with the potential economic and environmental benefits.
Concrete containing glass powder is often investigated for susceptibility of alkali silica reaction (ASR) due to the presence of high alkali contents associated with glass. Research has shown that the ASR could be mitigated by using finely ground glass powder in concrete typically smaller than 75 μm [8,11,15,18]. Moreover, using glass powder as a replacement for cement could help in reducing the deleterious expansion associated with ASR.
Shayan and Xu (2006) [15] measured the permeation characteristics of glass powder concrete mixes using rapid chloride penetration test (RCPT). A lower chloride penetrability was reported for glass mixes as compared to the control mix. Nassar and Soroushian (2012) [19] also reported lower total charge passing through glass concrete. This property was attributed to the refined pore structure resulting from the densification of microstructure due to the pozzolanic reaction of glass. Lee et al. (2018) [20] however, reported higher RCPT value and higher chloride diffusion coefficient measured using NT 492 for concrete containing 20% glass powder at 28 days as compared to PC. The chloride diffusivity of the glass powder mixes was found to decrease as the hydration progressed. Sales et al. (2017) [21] showed a reduction in permeability and increase in electrical resistivity of mortars with an increase in the cement replacement level for fine glass powder particles. Schwarz et al. (2008) [8] compared the moisture transport properties of concrete containing fly ash and glass powder at 10% cement replacement level. The glass powder modified concrete performed better than fly ash and control mix at both early and later ages.
Although a number of researchers have studied the durability of glass powder concrete for a wide spectrum of issues including ASR, abrasion and sulfate attack, limited information is available on the effect of different fineness and replacement levels of glass powder on the transport properties in concrete. In this study, the major durability indicators: porosity, permeability, resistivity, shrinkage and chloride migration for glass powder incorporated concrete are investigated from 3 to 545 days of curing. The durability indicators provide a practical way to identify the likely performance of glass powder containing SCC [22,23].
2. Methodology and Experiments
2.1. Materials
Crushed waste glass bottles were supplied by the Glass Packing Forum. The coarse crushed glass (G) was thoroughly cleaned and subsequently ground in a ball mill to a mean particle size of 10 µm (10G), 20 µm (20G) and 40 µm (40G). General purpose (GP) Portland cement conforming to ASTM Type II and two different fly ashes one belonging each to Class C (FAC) and Class F (FAF) were used in the study. The chemical composition of raw materials measured using X-ray fluorescence (XRF) is given in Table 1. Rounded alluvial Greywacke sandstone was used as the fine and coarse aggregate (sand fineness modulus (FM) = 2.7, coarse aggregate maximum aggregate size of 13 mm). The particle size grading of the aggregates is summarized in Table 2.

Table 1.
Chemical composition of raw materials (%/100 g).

Table 2.
Particle size grading of fine and coarse aggregates.
2.2. Sample Preparation
A total of 8 different self-compacting concrete (SCC) mixes were investigated in this study at a water to binder ratio of 0.4. A polycarboxylic ether-based superplasticizer was used to achieve the target flow of 700 +/− 50 mm for the SCC mixes. The raw materials were dry mixed in a 90 L orbital pan mixer for two minutes. Approximately 80% of the required water was added over a period of one minute while mixing. The remaining 20% of water, which was premixed with super plasticizer, was then added to the mixer. After the addition of all the water and superplasticizer, the material was mixed for an additional 3 to 5 min. The high binder content helped to prevent segregation of the control mix, while the use of glass powder and fly ash further aided in the stability of the mix such that viscosity modifiers or stabilizing admixtures were not required for any of the mixes. The superplasticizer dosage was varied to ensure a consistent spread for each mix. Cylindrical specimens of 100 mm diameter and 200 mm height were cast for durability testing and prisms of 75 × 75 × 280 mm were cast to measure the drying shrinkage of concrete. After casting, the samples were placed in a temperature control room maintained at 20 °C and 65% relative humidity for 24 h. Thereafter, the specimens were demolded and cured in lime saturated water until the age of testing. Table 3 shows the mix design details. The GP, FAF30% and FAC30% were the control mixes for comparison with the glass powder (G) SCC mixes.

Table 3.
Details of mix proportion and concrete mix design.
2.3. Experiments
2.3.1. Drying Shrinkage Test
Drying shrinkage of concrete was determined in accordance with ASTM C157 (2010) [24], which consists of measuring the drying shrinkage of prismatic specimens, having dimensions of 75 mm × 75 mm × 280 mm, subject to a controlled drying environment. The specimens were removed from the curing tank at the age of 7-days after casting. Immediately after removing the specimens and wiping their surfaces dry, they were placed in the comparator. Afterward the initial measurement all the specimens were placed in the drying room at a temperature of 23 °C and relative humidity of 50%. Drying shrinkage measurements of three replicate specimens were taken at 7, 14, 28, 56, 90 and 180 days of air-drying and an average value of drying shrinkage in micro-strain was reported for each drying age. The shrinkage data provides an indication of long-term cracking risk, which could directly influence the transport characteristics through concrete.
2.3.2. Oxygen Permeability Test
The ease of movement of fluids through a porous structure under an externally applied pressure can be determined from the permeability test. The oxygen permeability test in this study was carried out as described in [25]. This test method measures the pressure decay of oxygen passing through a core of concrete placed in a falling head permeameter. Two 25 mm thick cores were cut from the centre section of two SCC cylinders to obtain a total or 4 sample cores for testing. These slices were kept in an oven at 50 °C for drying until their weight became constant, as suggested in ASTM C642 (2008) [26]. The oven-dried specimens were subjected initially to oxygen at a pressure of 100 kPa and the pressure decay with time was monitored. The test was automated by using pressure transducers attached to the data logger and was continued for either 8 h or until pressure dropped to 50 kPa, whichever approached first. The coefficient of permeability was calculated by conducting a linear regression analysis on the best-fit line achieved by plotting values of ln(Po/Pt) against t, where Po is initial pressure reading at the start of the test, and Pt are subsequent pressure readings at times ‘t’ measured from the time of reading of initial pressure. Four specimens were used to measure coefficients of oxygen permeability at the curing ages of 3, 7, 28, 90, 180, 365 and 545 days and an average value for each curing age was reported.
2.3.3. Porosity
In this study, same specimens used for the oxygen permeability test were also used for porosity measurement. After the end of the permeability test, the specimens were vacuum saturated in tap water and the volume of permeable voids was found according to the procedure described in ASTM C642 (2008) [26].
2.3.4. Electrical Resistivity Test
Resistivity test provides a rapid indication of the likely resistance of concrete to the penetration of chloride ions and the likely subsequent rate of corrosion. This test method consists of measuring the electrical current passed through 25 mm thick slices extracted from concrete cylinders. The same specimens used for oxygen permeability and porosity tests were used to perform the resistivity measurements. The disc specimens were placed between two parallel stainless steel plates. Sponges saturated with 5M NaCl was used to make electrical contact between concrete disks and steel plates. An alternating current was applied across the specimen and the voltage was measured.
2.3.5. Bulk Diffusion Test
The apparent chloride diffusion coefficient was determined by bulk diffusion conforming to ASTM C1556. Two samples with a thickness of 75 mm were sliced from all cast cylinders at ages of 28, 90, 180, 365 and 545 days. The sides and bottom of the test specimens were sealed with an epoxy coating leaving one concrete end face exposed. The sealed specimens were vacuum-saturated in a calcium hydroxide solution, rinsed with tap water, and placed in a sodium chloride solution (165 g/l of NaCl) for at least 35-days. When the exposure time was over, the test specimens were removed from the sodium chloride solution and ten thin layers from 0 mm to 20 mm (2 mm each) were ground off parallel to the exposed face of the specimens. Then, the acid-soluble chloride content of 4 gm sample obtained from each layer was determined. The apparent chloride diffusion coefficients was calculated using Fick’s law as described in ASTM C1556.
3. Results
3.1. Compressive Strength
The compressive strength results for different mixes from 28 to 545 days, along with the T500 times, are summarized in Table 4. The early age compressive strength for all the fly ash and glass powder mixes were lower than the GP control. The 20G30% and 20G40% replacement levels together with the 40G30% replacement had the three lowest 28 day strengths with values between 43 and 47 MPa. As hydration continued the gap between the GP control and FA and glass powder mixes narrowed. The glass powder mixes shows the slowest strength development taking more than one year time to attain similar strength values. In particular, the glass powder mixes with the largest particle size were the slowest to gain strength. Figure 1 shows the compressive strength of mixes normalized with respect to GP mix at the respective age. The continued strength development is attributed to the formation of C-S-H arising from the pozzolanic activity of glass powder. The observations show the importance of long-term investigation for such binder systems that have slower pozzolanic activity. Similar, compressive strength characteristics have been reported for glass powder concrete mixes in literature [11,27,28].

Table 4.
Compressive strength (MPa) at different ages and flow time (Sec).
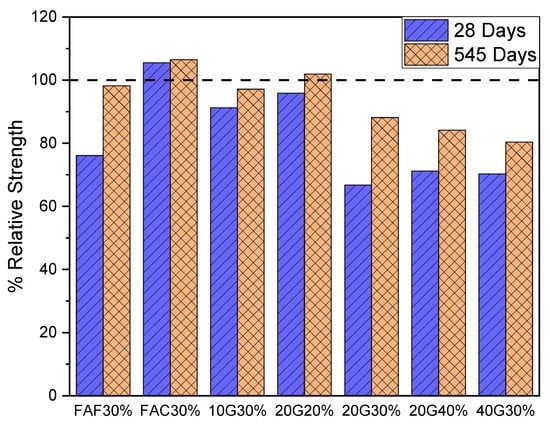
Figure 1.
Relative strength of mixes normalized with respect to general purpose (GP) mix at the respective age.
The fresh properties of concrete can have a significant impact up on the long-term durability of a structure. The presence of voids, as a result of compaction difficulties for instance, can be just as important as either the type of binder or w/c ratio. The primary goal of this investigation was to examine the effects of different glass powder replacement levels on the durability properties of the concrete. As such, the target flow for all the mixes was set at 700 mm and the amount of superplasticizer was allowed to vary to maintain the flow and minimize differences in the workability. It can be seen from the T500 times reported in Table 4, that there was relatively little variation with the times ranging from 3.1 s (FAF30%) to 5.5 s (GP) with most of the glass powder mixes between 4 and 5 s. The differences between either the yield shear stress as indicated by slump flow (700 mm) or plastic viscosity as indicated by T500 for the different mixes therefore were relatively small.
3.2. Drying Shrinkage
Drying shrinkage of concrete is characterized by the time-dependent volume decrease due to moisture migration and transfer when exposed to a relatively lower humidity environment. Figure 2 shows the drying shrinkage strain of the control mixes and glass powder mixes at 30% replacement level for different particle size. GP concrete mix showed higher shrinkage measurements compared to the fly ash and glass powder SCC mixes. The finer pore structure and consumption of larger quantity of water in the pozzolanic reaction could reduce the evaporation of water due to drying. Mehdipour et al. (2018) [29] reported a larger transformation of free water to bound water in cement binders containing SCMs and hence a subsequent reduction in drying shrinkage due to the lower availability of water for evaporation. The drying shrinkage of glass mixes decreased as the glass particle size became finer, which can be related to the denser microstructure of concrete due to the presence of finer glass, which suppressed drying shrinkage. The 40G30% mix showed higher drying shrinkage compared to fly ash or the finer particle size glass powder mixes. The higher dry shrinkage could be due to overall higher porosity (Section 3.3) of the concrete because of the slower pozzolanic reaction of the coarser glass particles leading to a greater evaporation of water.
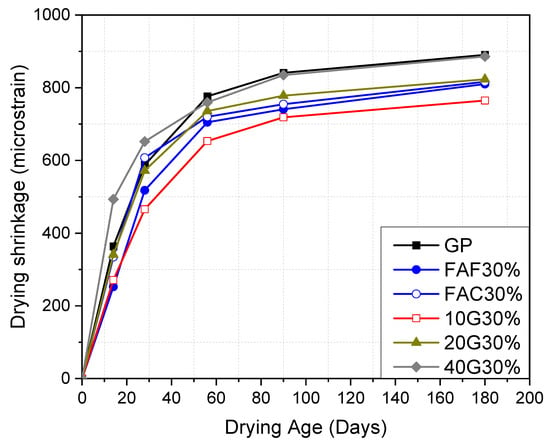
Figure 2.
Drying shrinkage of self-compacting concrete (SCC) mixes at 30% cement replacement (these figures show drying time not age and the initial point needs to start at zero days).
Figure 3 shows the drying shrinkage strain of the mixes at different glass powder replacement level. The shrinkage strain was found to increase with an increase in the replacement level. However, the drying shrinkage of 20G40% was similar to GP at 180 days. The higher permeable void volume and lower consumption of water in the hydration process at the higher replacement level could be the reason for higher shrinkage. Shayan and Xu [15] also reported an increase in drying shrinkage strain with increase in glass replacement level. Overall the results indicate the glass powder SCC mixes produced acceptable drying shrinkage values, below 0.075% after 56-days drying and met the requirements of the Australian Standard AS 3600 [30].
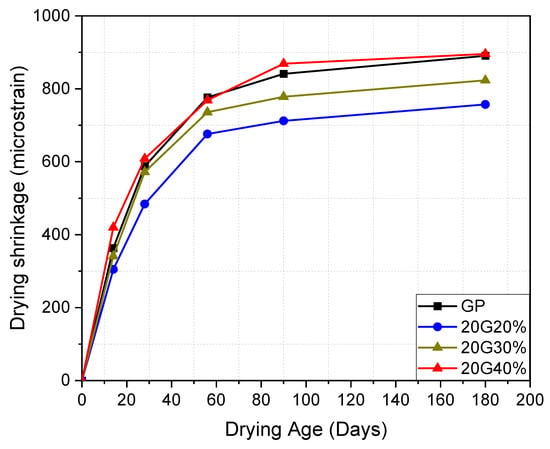
Figure 3.
Drying shrinkage of SCC mixes containing glass powder with 20 µm particle size at different replacement levels.
3.3. Oxygen Permeability
Figure 4 shows the oxygen permeability coefficient for the SCC mixes at different curing ages. The GP concrete showed the highest permeability coefficient at all the ages. The permeability coefficient of fly ash concrete mixes were similar to GP concrete at 3 and 7 days, however, thereafter the permeability coefficient continued to reduce for the fly ash mixes as hydration progressed whereas the change in GP concrete was minimal. The lower permeability for fly ash mixes is associated with refinement in pore structure due to the pozzolanic reaction, which in turn increases the tortuosity of the network and thus hinders the free movement of the fluid [31,32]. The coefficient of permeability for glass powder mixes at the same replacement level was seen to be affected by their particle size. A lower resistance to gaseous permeation was observed for the coarser glass powder mixes. Similar to fly ash mixes, the permeability coefficient continued to reduce with time. Moreover, due to the long-term nature of the pozzolanic reaction, the advantages associated with glass replacement were more obvious after a long period of curing. The 10G30% and 20G30% both showed lower permeability coefficients compared to FAF30%. The finer particle size of glass powder helps in substantial pore refinement and hence creating an impermeable and denser microstructure [33]. In addition, the impervious nature of glass particle could also help in reducing the permeability. The 40G30% had a higher permeability as compared to GP at early ages (3, 7 and 28 days), however, the permeability coefficient reduced with progress in hydration. This shows that for coarser particle size, glass powder takes longer for the pozzolanic reaction to progress, which is also evident from the compressive strength data. Sales et al. (2017) [21] also reported similar observations of a reduction in oxygen permeability for mortar samples comprising of glass powder. Chaid et al. (2014) 33 attributed the reason for lower permeability in glass powder concrete to the formation of a denser microstructure. In line with the above results, Figure 5 shows the effect of glass replacement level on the permeability coefficient. The lower the replacement level the greater was the permeation resistance. The 20G40% mix exhibited a higher permeability than FAF30% until 365 days, however it showed similar value at 545 days, implying glass powder mixes even at higher replacement level could achieve similar or better transport characteristics in the long run.
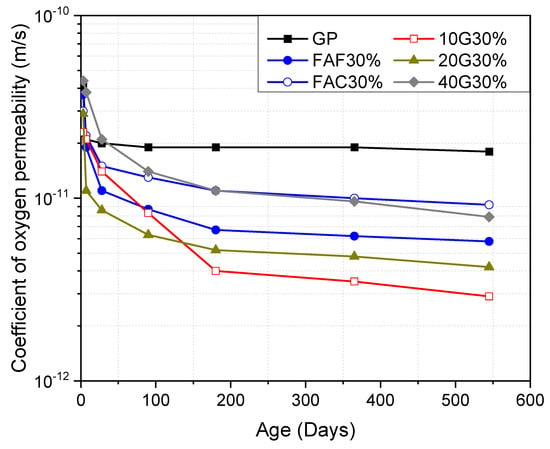
Figure 4.
Coefficient of permeability SCC mixes at 30% cement replacement.
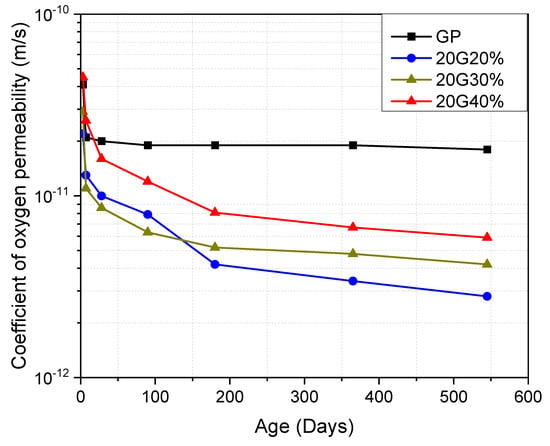
Figure 5.
Coefficient of permeability of SCC mixes containing glass powder with 20 µm particle size at different replacement levels.
The results of the oxygen permeability against compressive strength for the different mixes is provided in Figure 6. For same compressive strength concrete, lower permeability values were observed for glass mixes irrespective of their fineness and replacement level as compared to either the GP or FAC30% mixes. It is well known that the compressive strength is not a good predictor of durability performance particularly when comparing different binder types [34,35]. The compressive strength however can provide an indication of likely relatively performance when comparing concrete with the same general mix design. A correlation of 0.82 was obtained for power based relationship between compressive strength and permeability for glass mixes (K = 2.18 × 10⁻⁹).
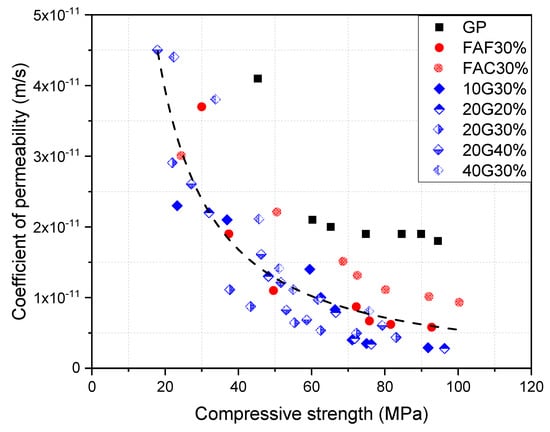
Figure 6.
Relationship between compressive strength and coefficient of permeability of all the SCC mixes.
3.4. Porosity
The void content of concrete measured using water absorption test is one of the most common indicators used for assessing the durability of concrete. Figure 7 and Figure 8 show the measured porosity for concrete mixes at different ages. The porosity reduced with continued hydration for in all the concrete mixes. The 10G30% SCC mix demonstrated a lower porosity as compared to other glass mixes at similar replacement level as well as the control mixes. Along with the pozzolanic reaction that assisted in the refinement of pore structure, the finer particle size of glass powder could help to improve particle packing in the system, which resulted in a denser and less porous concrete [19]. The findings signify the importance of particle size distribution as the presence of finer particles in the spaces between larger particles also acts to ‘refine’ the porosity. The porosity of 40G30% concrete mix was similar to GP despite having lower compressive strength. This implies that the pozzolanic reaction lead to precipitation of hydrates in the capillary pores which restricted the free movement of water. The volume of permeable voids increased with an increase in the glass content. The similar porosity values of 20G40% and 40G30% across ages show that the properties of concrete mixes with at higher replacement level of cement with glass powder could be maintained by varying the fineness of the glass powder. Shayan and Xu (2006) [15] reported similar results of an increase in volume of permeable voids with an increase in the glass powder content. Conversely, Du and Tan (2017) [36] showed a minimal change in porosity for up to 30% cement replacement level with glass powder, however beyond this replacement level an increase in porosity was reported as observed in 20G40% mix. A nonlinear inverse relationship was observed between coefficient of permeability and porosity as shown in Figure 9.
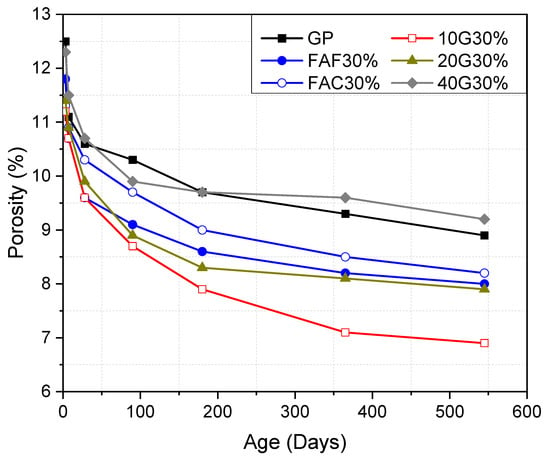
Figure 7.
Porosity of SCC mixes at 30% cement replacement at different ages.
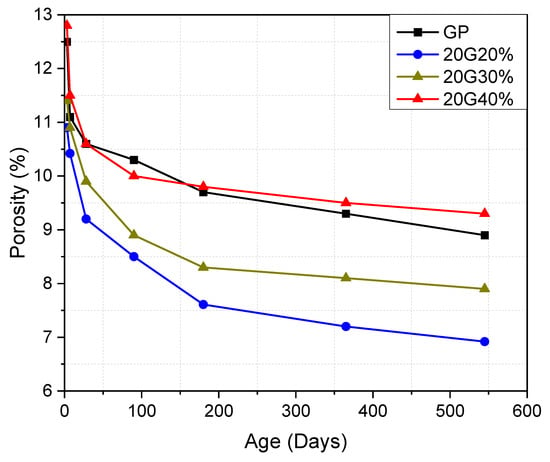
Figure 8.
Porosity of SCC mixes containing glass powder with 20 µm particle size at different replacement levels.
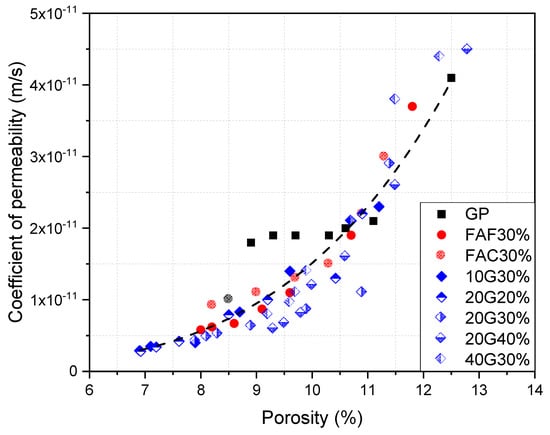
Figure 9.
Relationship between coefficient of permeability and porosity.
As the porosity of the concrete increased the permeability of the concrete also increased. As with the use of compressive strength as an indicator for durability, comparisons of overall porosity can sometimes be misleading. A single total porosity number does not provide the pore size distribution or tortuosity of the pore structure. As seen in Figure 9 a porosity of 9% would results in a coefficient of permeability of approximately 2 × 10⁻¹¹ for the GP binder system, while the glass mixes were closer to 1 × 10⁻¹¹.
3.5. Resistivity
The determination of concrete electrical resistivity has become an important technique in the evaluation of risk of corrosion associated with concrete structures [37,38]. The resistivity of concrete is affected by numerous factors such as pore solution composition, degree of hydration, pore structure, moisture content and temperature [39]. Figure 10 compares the resistivity of control mixes and glass powder mixes at 30% replacement. In agreement with the permeability and porosity results, the electrical resistivity of all the SCC mixes increased with curing age. The increase in resistivity is due to the continuous evolution of pore structure parameters due to hydration. The permeable void space reduced due to the precipitation of the hydration products in the capillary space, which hinder the mobility of ions, thereby resulting in an increase in resistivity of concrete. Carsana et al. (2014) [27] reported six times lower resistivity for glass powder mortar as compared to GP.
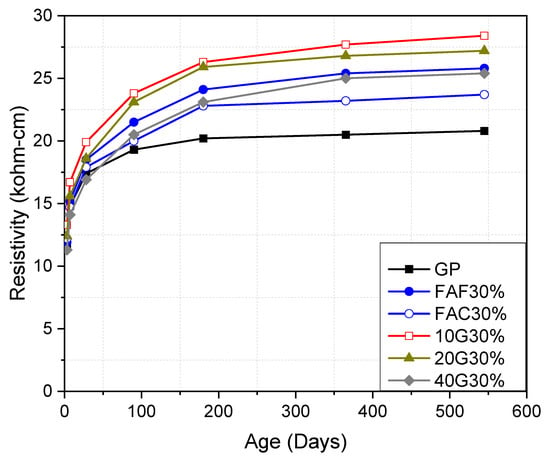
Figure 10.
Electrical resistivity of SCC mixes at 30% cement replacement at different ages.
The replacement of cement with fly ash and glass powder resulted in an increase in electrical resistivity. The electrical resistivity of SCC containing glass powder increased as the glass particle size became finer. A comparison of FAF30% and 20G30%, with both having a similar particle size, showed higher electrical resistivity in glass powder containing mixes. Figure 11 shows a reduction in electrical resistivity of with increase in glass replacement level. However, even at 40% replacement 20G40% showed better electrical resistance as compared to PC.
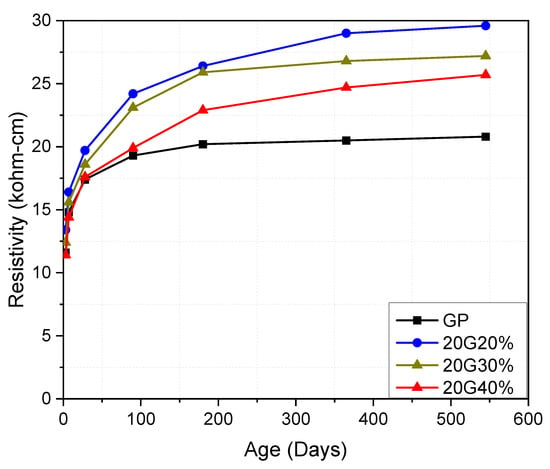
Figure 11.
Electrical resistivity of SCC mixes containing glass powder with 20 µm particle size at different replacement levels.
The higher resistance towards flow of ions in SCM incorporated concrete is generally attributed to a finer pore structure due to their pozzolanic reaction. A smaller threshold pore diameter has been reporter for glass powder mixes containing up to 45% cement replacement compared to GP cement using MIP measurement techniques [36]. The smaller the threshold pore diameter, the more tortuous is the microstructure, which directly hinders the movement of ions. It should be noted, however, that the resistivity of the concrete is also affected by the composition of the pore solution and the pore solution composition of the concrete varies with w/c ratio, the degree of hydration, and use of SCMs [38,39,40]. Nevertheless, changes in the pore structure of the concrete are generally considered to have a greater effect on the measured electrical resistivity than changes in the pore solution composition and concentration [40]. The permeability measurements, which are not dependent on the pore solution, showed a similar behavior, implying the higher resistance offered in glass powder SCC is primarily due to pore structure modification. Evaluation of the pore solution at the various replacement levels would need to be conducted to accurately separate the contribution of the refinement in the pore structure from any modification to the pore solution composition.
The electrical resistivity and porosity values of SCC mixes at different ages are compared in Figure 12. An inverse relationship was observed between the two indicators. As expected the higher the porosity the lower was the electrical resistivity offer by the concrete. It is interesting to note that for the electrical resistivity vs. porosity all the mixes seemed to show reasonably good agreement unlike the permeability vs. strength comparison or the permeability vs. porosity comparison where the GP samples clearly showed a difference in behavior.
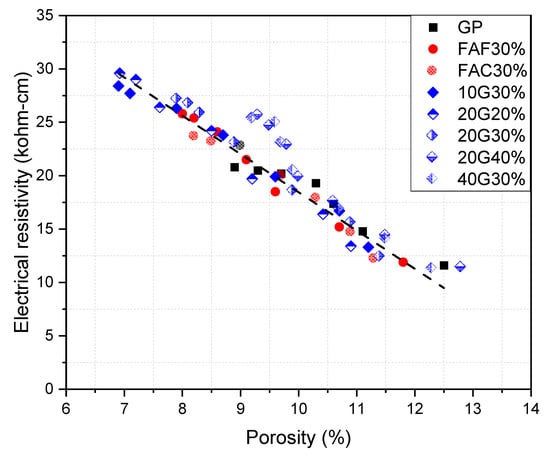
Figure 12.
Relation between electrical resistivity and porosity.
3.6. Chloride Diffusion Coefficient
The apparent chloride diffusion measured at the curing ages of 28, 90, 180, 365 and 545 days for control mixes and 30% glass powder SCC mixes are shown in Figure 13, while the results for the different levels of glass replacement are provide in Figure 14. The GP concrete showed the highest chloride diffusion coefficient among all mixes. The fly ash and glass powder mixes showed lower diffusion coefficient than GP at 28 days and continued to decrease with curing age. Du and Tan (2017) [36] reported a reduction of 90% in the chloride diffusion coefficient for 30% glass powder incorporated concrete as compared to GP control. The denser microstructure accompanied with refined pores and lower connectivity contribute to the reduce diffusivity. Kamali and Ghahremaninezhad (2015) [28] also reported a reduction in chloride penetrability with increase in glass powder content in concrete. The time-dependent changes in diffusion coefficient due to continued hydration is often represented by diffusion decay index (m) or ageing factor. Taking 28 days diffusion coefficient as reference, the diffusion decay coefficient was calculated at the ages 90, 180, 365 and 545 using the following equation:
where (m2/s) is the diffusion coefficient at time t (days), (m2/s) is the diffusion coefficient at 28 days.
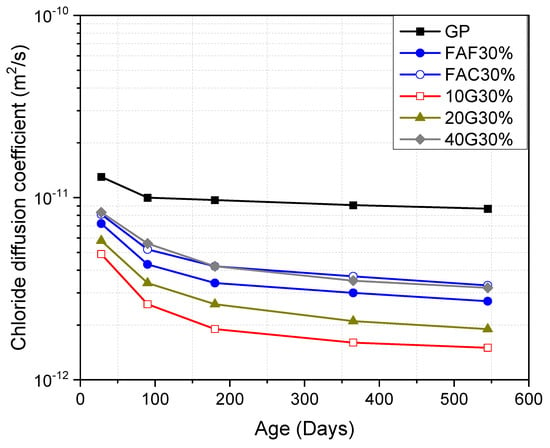
Figure 13.
Chloride diffusion coefficient of SCC mixes at 30% cement replacement at different ages.
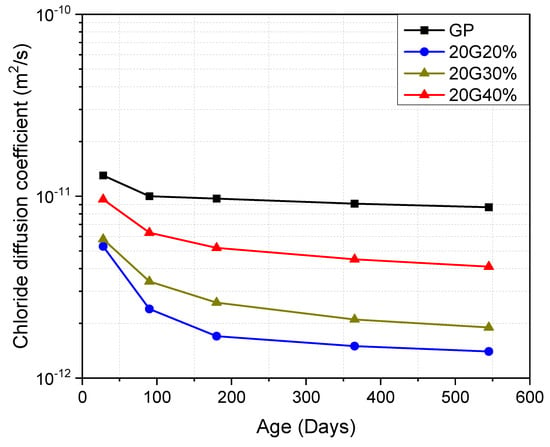
Figure 14.
Chloride diffusion coefficient of SCC mixes containing glass powder with 20µm particle size at different replacement levels.
The average diffusion decay index across all ages for different mixes are given in Table 5. The diffusion decay index values of glass powder mixes are larger than those for the fly ash mixes. The decay index of 40G30% and 20G40% are similar to FAF30% indicating glass powder could bring similar changes in the pore structure that restricts the movement of chloride ions even with coarser particle size and higher replacement level. The higher ageing factor values for glass SCC mixes could improve the service life of structure subjected to chloride-induced corrosion.

Table 5.
Diffusion decay index for different SCC mixes.
A good correlation was observed between chloride diffusion coefficient and electrical resistivity (Figure 15). From the results, it can be inferred that electrical resistivity provides a reasonable estimate of the diffusion coefficient value, which is easier to perform and much faster. As with the strength vs. permeability comparison, the chloride diffusion coefficient vs. resistivity relationship is most accurate when evaluating similar mix deign compositions. Where prequalification of mixes for use in marine construction applications is conducted based on bulk chloride diffusion testing, the resistivity testing may provide a good indication of individual batch performance for SCC containing glass powder.
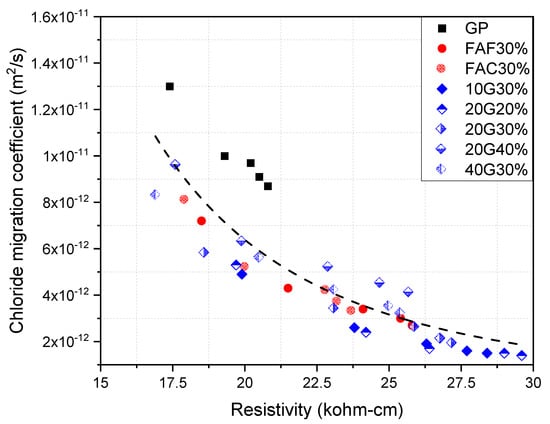
Figure 15.
Relation between electrical resistivity and chloride diffusion coefficient.
The results from chloride diffusion coefficient and the time dependent decay coefficient “m” were in good agreement with the previous durability index tests of porosity, permeability and resistivity, such that there was a decrease in measured performance with an increase in the glass particle size and replacement level. The replacement of 20% glass powder resulted in the lowest chloride diffusion coefficient even below that of the finer glass powder at 30% replacement levels. Some percentage of glass powder is clearly necessary to refine the pore structure of the concrete, but additions beyond 20% appear to be less effective. The beneficial effect of having a more finely ground glass powder was observed at the 30% replacement level, but no data was available in this study beyond this level for the most finely ground powder. It is likely that there is improved performance below a 30% replacement, with a more finely ground glass powder, however further work is needed to identify the optimal binder replacement level and powder size.
Comparison of Service-Life in Chloride Exposure Condition
In order to understand the effect of the higher diffusion decay index of glass powder concrete mixes, the service-life in terms of corrosion initiation time was predicted using Life 365® software [41]. A concrete cover depth of 50 mm, a threshold concentration of 0.05% (by mass of concrete) and a marine splash zone environment were used to estimate the time until de-passivation of the steel. The diffusion coefficient (D28) and diffusion decay coefficient (m) obtained from the reported experiments were also used in the model. Figure 16 shows the predicted time for the initiation of corrosion for the different concrete mixes. A distinct advantage in terms of increased time until corrosion initiation was observed for glass powder containing mixes. The predicted service-life for glass powder concrete mixes is greater than GP concrete irrespective of the particle size of the glass powder or the replacement levels. At a similar replacement level of 30%, an increase of approximately 2 to 3.5 times the service-life is observed for glass powder concrete mixes (10G30% and 20G30%) compared to FAF30%. A further comparison of the effect of different binder replacement levels and types on the time to initiation is provided in Table 6 for chloride thresholds levels of 0.1% and reinforcement covers of 75 mm.
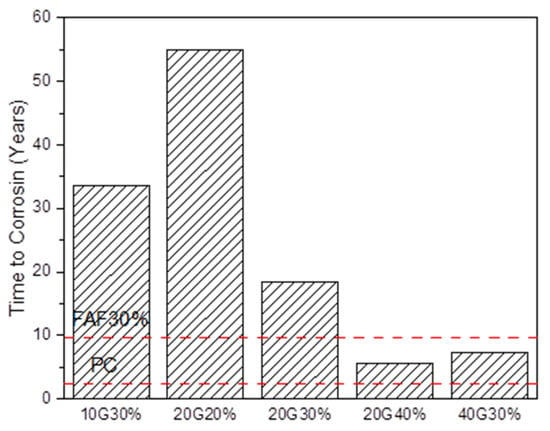
Figure 16.
Comparison of corrosion initiation time for different concrete mixes.

Table 6.
Comparison of time to corrosion initiation for different binder replacement levels, covers and threshold concentrations.
The service life of real structures is affected by numerous variables. As previously noted the workability of the concrete in the fresh state can influence the degree of compaction and thereby the permeability of the concrete. The binder type, w/c ratio and level of curing are additional parameters that can all dramatically affect the quality of the cover concrete and the overall service life. In addition to the material and construction components, the site specific exposure condition is another crucial component. While a chloride threshold concentration of 0.05% and 0.1% by mass of concrete were used in this example, the actual chloride threshold concentration (Ct) can vary significantly even in the same structure as the use of a single chloride threshold value may not be appropriate for estimate actual performance. The example was intended for illustrative purposed to show the potential impact of glass powder on the durability of reinforced concrete structures assuming all other variables remained constant.
The wide range of tests carried out to corroborate the usage of glass powder as cement replacement shows promising results. The durability indicators (porosity, resistivity and oxygen permeability) of glass SCC mixes all indicate excellent durability according to the classification developed by Alexander et al. [22,23]. The results show that by optimizing the glass powder properties and replacement level durable concrete with mechanical and durable performance better than GP and fly ash mixes can be obtained. The usage of waste glass powder could bring positive economic and environmental benefits for concrete construction applications.
4. Conclusions
This study presented an overview of the influence of glass powder particle size and replacement level on the durability indicators for self-compacting concrete. Oxygen permeability, porosity, electrical resistivity, chloride diffusivity and drying shrinkage of glass modified SCC were compared with GP and fly ash mixes. The main findings from the study can be summarized as follows:
- The amount and particle size of incorporated waste glass has a significant influence on the mechanical and durability properties of SCC. Glass powder replacement level of 20–30% showed better performance as compared to fly ash and GP mixes. Moreover, the filling effect of small-sized glass particles results in improved particle packing, forming a denser and less permeable microstructure.
- The lower shrinkage strains for glass powder concrete mixes will help reduce the risk of cracking associated with long-term drying. The drying shrinkage values of all waste glass incorporating mixes, irrespective of their fineness and content, were below 0.075% after 56-days drying and met the requirements of the Australian Standard AS 3600.
- The lower oxygen permeability and chloride diffusion coefficient along with high electrical resistivity of glass incorporated SCC mixes confirms a refinement of pore structure due to pozzolanic reaction leading to increase in tortuosity and thereby inhibiting free movement of ions.
- The higher ageing coefficients for the glass powder mixes as compared to GP and fly ash mixes indicate continuous evolution and refinement of the pore structure, which results in better long-term transport performance of the binder system and considerable extension in terms of service-life for concrete exposed to marine environment.
Author Contributions
S.T. performed the experimental testing, analysed the results and prepared the initial draft of the paper under the guidance of her supervisors A.N.S. and J.R.M.; A.N.S. and J.R.M. both provided advice and guidance on research direction and assisted with the interpretation of the data in addition to writing of the manuscript. V.S. helped with analysis of the data and in the preparation and revision of the manuscript. All authors have read and agreed to the published version of the manuscript.
Funding
This research was partially funded by the Building Research Association of New Zealand (BRANZ).
Acknowledgments
The authors would like to acknowledge the contributions of BRANZ, the Glass Packaging Forum and Golden Bay Cement for their support.
Conflicts of Interest
The authors declare no conflict of interest.
References
- Richardson, M.G. Fundamentals of Durable Reinforced Concrete, 1st ed.; Taylor & Francis: London, UK; New York, NY, USA, 2002. [Google Scholar]
- Bouikni, A.; Swamy, R.N.; Bali, A. Durability properties of concrete containing 50% and 65% slag. Constr. Build. Mater. 2009, 23, 2836–2845. [Google Scholar] [CrossRef]
- Ayub, T.; Shafiq, N.; Khan, S.U. Durability of concrete with different mineral admixtures: A review. Sci. World J. 2013, 7, 265–276. [Google Scholar]
- Ramakrishnan, K.; Pugazhmani, G.; Sripragadeesh, R.; Muthu, D.; Venkatasubramanian, C. Experimental study on the mechanical and durability properties of concrete with waste glass powder and ground granulated blast furnace slag as supplementary cementitious materials. Constr. Build. Mater. 2017, 156, 739–749. [Google Scholar] [CrossRef]
- Chindaprasirt, P.; Chotithanorm, C.; Cao, H.T.; Sirivivatnanon, V. Influence of fly ash fineness on the chloride penetration of concrete. Constr. Build. Mater. 2007, 21, 356–361. [Google Scholar] [CrossRef]
- Thomas, M. The effect of supplementary cementing materials on alkali-silica reaction: A review. Cem. Concr. Res. 2011, 41, 1224–1231. [Google Scholar] [CrossRef]
- Aliabdo, A.A.; Abd Elmoaty, A.E.M.; Aboshama, A.Y. Utilization of waste glass powder in the production of cement and concrete. Constr. Build. Mater. 2016, 124, 866–877. [Google Scholar] [CrossRef]
- Schwarz, N.; Neithalath, N. Influence of a fine glass powder on cement hydration: Comparison to fly ash and modeling the degree of hydration. Cem. Concr. Res. 2008, 38, 429–436. [Google Scholar] [CrossRef]
- Chen, Z.; Wang, Y.; Liao, S.; Huang, Y. Grinding kinetics of waste glass powder and its composite effect as pozzolanic admixture in cement concrete. Constr. Build. Mater. 2020, 239, 117876. [Google Scholar] [CrossRef]
- Shao, Y.; Lefort, T.; Moras, S.; Rodriguez, D. Studies on concrete containing ground waste glass. Cem. Concr. Res. 2000, 30, 91–100. [Google Scholar] [CrossRef]
- Matos, A.M.; Sousa-Coutinho, J. Durability of mortar using waste glass powder as cement replacement. Constr. Build. Mater. 2012, 36, 205–215. [Google Scholar] [CrossRef]
- Metwally, I.M. Investigations on the performance of concrete made with blended finely milled waste glass. Adv. Struct. Eng. 2007, 10, 47–53. [Google Scholar] [CrossRef]
- Shi, C.; Wu, Y.; Riefler, C.; Wang, H. Characteristics and pozzolanic reactivity of glass powders. Cem. Concr. Res. 2005, 35, 987–993. [Google Scholar] [CrossRef]
- Rahma, A.; El Naber, N.; Issa Ismail, S. Effect of glass powder on the compression strength and the workability of concrete. Cogent Eng. 2017, 4. [Google Scholar] [CrossRef]
- Shayan, A.; Xu, A. Performance of glass powder as a pozzolanic material in concrete: A field trial on concrete slabs. Cem. Concr. Res. 2006, 36, 457–468. [Google Scholar] [CrossRef]
- UN Environment; Scrivener, K.L.; John, V.M.; Gartner, E.M. Eco-efficient cements: Potential, economically viable solutions for a low-CO2 cement based industry. Cem. Concr. Res. 2018, 114, 64. [Google Scholar]
- Islam, G.M.S.; Rahman, M.H.; Kazi, N. Waste glass powder as partial replacement of cement for sustainable concrete practice. Int. J. Sustain. Built Environ. 2017, 6, 37–44. [Google Scholar] [CrossRef]
- Rajabipour, F.; Maraghechi, H.; Fischer, G. Investigating the Alkali-Silica reaction of recycled glass aggregates in concrete materials. J. Mater. Civ. Eng. 2010, 22, 1201–1208. [Google Scholar] [CrossRef]
- Nassar, R.U.D.; Soroushian, P. Strength and durability of recycled aggregate concrete containing milled glass as partial replacement for cement. Constr. Build. Mater. 2012, 29, 368–377. [Google Scholar] [CrossRef]
- Lee, H.; Hanif, A.; Usman, M.; Sim, J.; Oh, H. Performance evaluation of concrete incorporating glass powder and glass sludge wastes as supplementary cementing material. J. Clean. Prod. 2018, 170, 683–693. [Google Scholar] [CrossRef]
- Sales, B.R.C.; Sales, F.A.; Figueiredo, E.P.; José, W.; Della, N.; Mohallem, S.; Teresa, M.; Aguilar, P. Durability of mortar made with fine glass powdered particles. Adv. Mater. Sci. Eng. 2017, 2017. [Google Scholar] [CrossRef]
- Mackechnie, J.R.; Alexander, M.G. Durability predictions using early age durability index testing. In Proceedings of the 9th Durability and Building Materials Conference, Australian Corrosion Association, Brisbane, Australia, 17–21 March 2002; pp. 1–9. [Google Scholar]
- Beushausen, H.; Alexander, M.G. The South African durability index tests in an international comparison. J. S. Afr. Inst. Civ. Eng. 2008, 50, 25–31. [Google Scholar]
- ASTM C157. Standard test method for length change of hardened hydraulic-cement mortar and concrete. Am. Soc. Test. Mater. 2010, 215, 1–7. [Google Scholar] [CrossRef]
- Salvoldi, B.G.; Beushausen, H.; Alexander, M.G. Oxygen permeability of concrete and its relation to carbonation. Constr. Build. Mater. 2015, 85, 30–37. [Google Scholar] [CrossRef]
- ASTM C642-06. Standard test method for density, absorption, and voids in hardened concrete. Am. Soc. Test. Mater. 2008, 11–13. [CrossRef]
- Carsana, M.; Frassoni, M.; Bertolini, L. Comparison of ground waste glass with other supplementary cementitious materials. Cem. Concr. Compos. 2014, 45, 39–45. [Google Scholar] [CrossRef]
- Kamali, M.; Ghahremaninezhad, A. Effect of glass powders on the mechanical and durability properties of cementitious materials. Constr. Build. Mater. 2015, 98, 407–416. [Google Scholar] [CrossRef]
- Mehdipour, I.; Ph, D.; Khayat, K.H. Elucidating the role of supplementary cementitious materials on shrinkage and restrained-shrinkage cracking of flowable eco-concrete. J. Mater. Civ. Eng. 2018, 30, 1–12. [Google Scholar] [CrossRef]
- AS 3600. Concrete Structures; Standards Australia: Sydney, Australia, 2018. [Google Scholar]
- Shah, V.; Bishnoi, S. Analysis of transport properties of carbonated low clinker cements. Transp. Porous Media 2018, 124, 861–881. [Google Scholar] [CrossRef]
- Yu, Z.; Ye, G. The Pore Structure of cement paste blended with fly ash. Constr. Build. Mater. 2013, 45, 30–35. [Google Scholar] [CrossRef]
- Chaïd, R.; Kenaï, S.; Zeroub, H.; Jauberthie, R. Microstructure and permeability of concrete with glass powder addition conserved in the sulphatic environment. Eur. J. Environ. Civ. Eng. 2015, 8189, 1–19. [Google Scholar] [CrossRef]
- Alexander, M.; Beushausen, H. Durability, service life prediction, and modelling for reinforced concrete structures—Review and critique. Cem. Concr. Res. 2019, 122, 17–29. [Google Scholar] [CrossRef]
- Shah, V.; Bishnoi, S. Carbonation resistance of cements containing SCMs and its realtion to various parameters of concrete. Constr. Build. Mater. 2018, 178, 219–232. [Google Scholar] [CrossRef]
- Du, H.; Tan, K.H. Properties of high volume glass powder concrete. Cem. Concr. Compos. 2017, 75, 22–29. [Google Scholar] [CrossRef]
- Alonso, C.; Andrade, C.; González, J. Relation between resistivity and corrosion rate of reinforcements in carbonated mortar made with several cement types. Cem. Concr. Res. 1988, 18, 687–698. [Google Scholar] [CrossRef]
- Hornbostel, K.; Larsen, C.K.; Geiker, M.R. Relationship between concrete resistivity and corrosion rate—A literature review. Cem. Concr. Compos. 2013, 39, 60–72. [Google Scholar] [CrossRef]
- Malhotra, V.M.; Carino, N.J. Handbook on Nondestructive Testing of Concrete; CRC Press: West Conshohocken, PA, USA, 2004. [Google Scholar]
- Mccarter, W.J.; Starrs, G.; Chrisp, T.M. Electrical conductivity, diffusion and permeability of Portland cement-based mortars. Cem. Concr. Res. 2000, 30, 1395–1400. [Google Scholar] [CrossRef]
- Ehlen, B.M.; Thomas, M.D.A.; Bentz, E.C. Life-365 service life prediction modelTM. Concr. Int. 2009, 31, 41–46. [Google Scholar]
Publisher’s Note: MDPI stays neutral with regard to jurisdictional claims in published maps and institutional affiliations. |
© 2020 by the authors. Licensee MDPI, Basel, Switzerland. This article is an open access article distributed under the terms and conditions of the Creative Commons Attribution (CC BY) license (http://creativecommons.org/licenses/by/4.0/).