1. Introduction
Type 1 diabetes (T1D) is a chronic metabolic disorder characterized by elevated blood glucose levels over a prolonged period, leading to long-term damage to the heart, kidneys, eyes, nerves, and blood vessels. High blood glucose (hyperglycemia) in T1D is a consequence of the lack of insulin produced by the pancreas so that T1D patients require external insulin administration to regulate their blood glucose concentrations [
1], while too much insulin dangerously reduces blood glucose level (hypoglycemia).
Treatment of T1D mainly consists of either a basal-bolus insulin regimen, where patients take basal insulin dose to regulate fasting blood glucose levels and insulin boluses around mealtimes to quickly reduce the impact of carbohydrate intake, or through an insulin pump providing a continuous insulin infusion. The insulin pump infuses both regular basal insulin rate and meal boluses activated by the user during food intake to avoid hyperglycemia [
2]. In both therapies, the insulin is administered subcutaneously in the fatty tissue just below the skin. In addition to the external insulin administration, monitoring blood glucose levels is required and can be done via a continuous glucose monitor (CGM) embedded in the subcutaneous tissue, or several times per day via manual finger-prick measurements [
3]. Finally, T1D patients in collaboration with a physician will design a treatment based on individual patient needs. Insulin doses will be self-administered by the patients according to the treatment plan and self-measured blood sugar concentrations. External insulin therapy aims to keep the blood glucose concentrations within the normoglycemic range between 70 and 180 mg/dL [
4,
5].
Regular physical exercise has many proven health benefits and is therefore widely recommended as part of a healthy lifestyle. However, exercise significantly alters glucose homeostasis in patients with T1D. In addition, physical activities increase glucose uptake by muscles leading to a drop in blood glucose concentration, which can reach the hazardous hypoglycemic values. Increased insulin sensitivity, during and several hours or even days after the exercise [
6], creates long-lasting effects on daily activities of patients.
The common method for preventing hypoglycemia is to reduce insulin doses. However, the slow absorption of insulin from the subcutaneous tissue and the physical limit of insulin reduction make this method insufficient to prevent hypoglycemia. Additional to the insulin treatment, many T1D related conditions can be mitigated by a nutrition therapy, which arises as an important solution to prevent, manage and control diabetes, as well as relieve complications associated with T1D by adjusting the quantity, quality and methods of nutrient intake [
7]. Along with a healthy diet, physical activity plays a vital role in diabetes treatment, producing multiple general and diabetes-specific health benefits [
8]. Despite the evidenced benefits, many people are physically inactive [
9], since exercise is a major source of hypoglycemia in diabetic patients [
10], and risk of hypoglycemia is a significant limiting factor of blood glucose regulation in T1D patients [
11]. For most diabetic people, exercise has far less adverse health consequences than sedentary lifestyle [
12].
Healthcare approaches change from the traditional relationship between providers and patients to a paradigm that gives patients a crucial role in guiding their care [
13]. The change emphasizes the importance of self-management, which is considered a necessary part of chronic disease management and secondary prevention [
14], especially for diabetes patients. Evidence shows that supporting patients to manage their health will improve clinical outcomes, reduce the economic burden, and improve quality of life [
14]. Food recommendation systems emerge as a new self-management solution that can suggest the best diets according to patients’ health situation and preferences, solving the physical activity paradigm while following a nutrition therapy for diabetic patients [
15]. Among others, Phanich et al. [
16] used a food-clustering analysis to propose a food recommendation system for patients with diabetes, while Norouzi et al. [
17] developed a smartphone application for managing diabetic patient nutrition using artificial intelligence techniques. In [
18], Lee et al. develop a diabetic food recommendation agent that, according to a personal lifestyle and particular health needs, can create a meal plan. Mohammed and Hagras [
19] present a type-2 fuzzy logic-based diet recommendation system to help achieve a healthy lifestyle to control diabetes. A complete systematic review of nutrition recommendation systems with a focus on technical aspects can be found in [
20]. Previous work from the authors has shown promising results for using machine learning techniques in a food recommendation system, maintaining healthy blood glucose levels on a T1D simulator during exercise [
21].
The term machine learning is considered a large family of mathematical and statistical methods that have historically focused on prediction [
22]. With the development of new technology, a vast amount of health-related data is continuously generated. However, data availability is varied among various dimensions and quality. Machine learning and statistical techniques such as feedforward neural networks and the Bayesian inferencing mechanism become powerful tools to understand and quantify data quality into uncertainties, which is a crucial step to make use of the increasingly available data safely and effectively.
Due to the importance and clinical benefits of the diet in diabetes, different studies have been conducted to develop diet recommendation systems to diabetes patients. Unlike [
16,
23], our work focused on preventing the complications related to physical activity in type-1 diabetes patients, alleviating the risks associated with doing exercise while having diabetes. Xie and Wang [
24] proposed a food recommendation system with a similar purpose using a Nonlinear Auto Regressive Moving Average. However, the method did not provide a measurement of uncertainties in the data and how to compensate for these uncertainties. In this work, we introduced a new technique for food recommendation using Bayesian feedforward neural networks that can minimize the risk of hypoglycemia and hyperglycemia during and after physical activities while improving blood glucose regulation. We performed in-silico experiments, including the exercise model described in [
25] on the UVA/Padova simulator [
26,
27]. Our experiments demonstrate that the proposed food recommendation system is able to reduce the risks of hypoglycemia and hyperglycemia while maintaining the blood glucose levels in the healthy range during and after the exercise.
Structure of Paper
We describe the methods in
Section 2, where we introduce the experimental setup, defined the outcome and risk functions, and describe the models used to predict those functions.
Section 3 presents the results and discussion.
Section 4 provides the clinical significance and limitations of the method. In
Section 5, we present concluding remarks and directions of possible future work.
2. Methods
The risk-averse food recommendation system presented in this paper used three criteria: the blood glucose outcome, the risk of hypoglycemia, and the risk of hyperglycemia. Recommendations were derived such that the risk of taking an action must be lower than a specified level and within a measure of probabilistic confidence level, while maximizing the outcome. This section starts with a description of the in-silico simulations used in the paper, followed by a formulation of the outcome and risks. Finally, implementation of deterministic and Bayesian feedforward neural networks prediction models are described.
2.1. In-Silico Simulation
In the simulation scenario used in the paper, the food recommendation is given before the beginning of each exercise session for a virtual patient with no meal boluses associated with the recommended amount of carbohydrates. During the experiments, the basal insulin dose was constant and equal to the optimal value, which means the virtual patient stays at the healthy reference blood glucose concentration 108 mg/dL in steady-state. Training data was obtained by repeated simulations from the blood glucose simulator under scenarios where a patient with T1D performs physical exercises with the same intensity but consuming a different amount of food.
The Physical Activity Guidelines for Americans recommends adults do vigorous enough exercise to raise their heart rate to 50–85% of their maximum heart rate, defined as 220 beats per minute minus their age, during 75 to 150 min a week—values might vary for younger people [
28]. The virtual patient used in our simulations is 24 years old, with a maximum heart rate of 196 beats per minute and recommended heart rate during exercise between 98 and 167 beats per minute, based on the guidelines from the American Heart Association. The duration and intensity of physical activities are set to be constant at 50 min and 157 beats per minute (80% of its maximum heart rate), respectively. In absence of carbohydrate intake, a hypoglycemic excursion is induced as a consequence of the exercise session setup. The virtual patient always eats at 15 min before the exercise starts to avoid the hypoglycemic event. The outcome of each exercise is evaluated by measuring the average scores of the blood glucose over the course of four hours starting at 15 min before the exercise (mealtime). The blood glucose is sampled every 5 min during the simulations, which is similar to the sampling time of common CGM devices.
There exist mainly three physiological models in the T1D research field, namely the Bergman (minimal) model [
29], the Hovorka model [
30] and the UVA/Padova model [
26], see also [
31]. The minimal model is a simplified model consisting of two equations describing the internal dynamics of glucose and insulin and does not account for the significant delay involved in subcutaneous insulin infusion. The Hovorka and the UVA/Padova models both include this delay as well as the delay in the subcutaneous glucose measurement. In this work, we used the UVA/Padova model, since this is the only computer simulator of the dynamics of the human metabolic glucose-insulin system which is FDA approved as a substitute for the pre-clinical testing of certain control strategies in T1D [
27]. An extension of the UVA/Padova model has been used in this paper where the effect of physical activity is included [
25].
The UVA/Padova model consists of seven internal compartments describing the dynamics of glucose kinetics, insulin kinetics, glucagon kinetics and secretion, glucose rate of appearance, endogenous glucose production, glucose utilization and renal excretion, while three external compartments describe subcutaneous glucose, insulin and glucagon kinetics [
27]. In addition, a physical activity model was included in the glucose-utilization subsystem, modifying the insulin-dependent utilization component to simulate exercise sessions describing changes in glucose-insulin dynamics [
25]. The original UVA/Padova simulator includes ten children patients, ten adolescents patients, and ten adults patients, as well as one average child patient, one average adolescent patient, and one average adult patient. In this work, we used the adult patient number four during our experiments, since this patient presents acute hypoglycemia as a consequence of our physical activity experimental setup. Finally, we use a CGM for glucose measurements during our simulations, where the CGM sensor noise is generated based on the model and the parameters determined by [
32]. The non-Gaussian sensor noise is given by:
with the initial condition
. Note that in the original model from [
32], the error
introduced in the sensor noise is multiplied by a factor of 0.7, while in this work we increased the CGM noise multiplied the error
by a factor of 0.8, adding more uncertainty information to the Bayesian feedforward neural network. The CGM sensor noise
was added to the blood glucose values obtained from the UVA/Padova simulator with physical activity. The numerical values used in this paper for
,
,
and
are shown in
Table 1.
2.2. Outcome Function and Risk Definition
This subsection defines the outcome and risk functions for the designed food recommendation system before physical activities for T1D patients. The blood glucose outcome is represented by the average score assigned for the blood glucose levels during and after physical activities. The score was calculated based on the asymmetric reward function previously introduced in [
33], designed to reduce hypoglycemia while rewarding time spent in normoglycemia. The reward function is designed as a piecewise smooth function and gives a strong negative reward for severe hypoglycemia, followed by an exponentially decreasing negative reward for hypoglycemic events starting at severe hypoglycemia, and negative reward when hyperglycemia occurs. Positive rewards from a symmetric linear function are given for glucose values in normoglycemic range. To be specific, the function is given as:
where
is the current blood glucose value. The parameters of the reward function were selected based on the guidelines as described in [
33] and can be found in
Table 2. A graphical representation of the reward function is shown in
Figure 1.
In order to quantify the risks of hypo- and hyperglycemia, we used clinically defined low and high blood glucose indices (LBGI and HBGI, respectively) as described in Clarke and Kovatchev [
34], which measure the frequency and extent of low and high blood glucose readings based on a symmetrization of the blood glucose measurements:
where
is the measurement
i in mg/dL and
n is the number of measurements during and after the physical activity. The risk functions
and
are defined as follows:
where
and
is the current blood glucose value.
2.3. Modelling of the Outcome, Risk and Uncertainties
This subsection describes the methods to predict the blood glucose outcome, the hypoglycemia and the hyperglycemia risks of actions based on a predefined set of variables. Uncertainty estimation using Bayesian techniques will be described with these methods.
The blood glucose outcome, hyperglycemia and hypoglycemia risks were predicted in this paper by using a deterministic feedforward neural networks (FFNN) and two Bayesian feedforward neural nerworks (BFNN) with the same structure. FFNN and BFNN are types of artificial neural networks which are constructed by neurons organized into layers. The networks estimate the outcome and risks based on inputs such as the intensity of physical activity, historical blood glucose and dietary information (carbohydrate intake) before the physical activity. The structure of the deterministic FFNN and the two BFNN implemented in this paper are similar and can be found in
Figure 2. For demonstration, we include only the food amount (carbohydrate intake) as the input for the networks. It is assumed that other conditions are the same every time physical activity is conducted.
Information from the input also flows through hidden nodes, which are nonlinear functions of the carbohydrate intake amount
D:
where
is the output value of the
,
hidden node,
and
are the weights and biases. The function
is a rectified linear unit activation function (ReLu):
The model output
y, (either predicted risks or blood glucose outcome), is calculated from the outputs of the hidden layers by a linear function:
where
and
are the weight and bias for the output layer. The task of training the outcome model is to find the optimal values of of
w and
b such that the following mean squared error (MSE) cost function is minimized:
where
N is the number of training samples,
is the predicted value and
is the actual blood glucose score for each training sample i. Training of the outcome model was done using least square estimation and implemented through the Pytorch library [
35].
Two models were built to predict the hypoglycemia and hyperglycemia risks based on a Bayesian feedforward neural network in order to capture the uncertainties in the risk prediction. The networks have similar structure like the outcome prediction model with six hidden nodes. However, the weight and bias of the hidden and output layers are represented by Gaussian distributions instead of discrete numbers. The prior distribution of all the parameters were chosen to be normal distributions with mean of zero and standard deviation of one. The task of training the hyperglycemia and hypoglycemia models is to determine the posterior distribution for the weights and biases using Bayesian inference. The posterior distribution was estimated by using the stochastic variational inference method [
36] and implemented with Pyro [
37]. For each weight and bias
z, a family of distributions is generated with each distribution characterized by parameters
. Then, an approximation of the posterior distribution
is conducted by selecting from this family a distribution that is closest to the true posterior
, where
x and
y are the training data set. The selection is conducted by finding the optimal set of parameters
that minimize the Kullback–Leibler divergence, which is a measurement of how two probability distributions are different from each other [
36,
38]:
where
is defined as the evidence lower bound (ELBO) function [
36]:
Since the Kullback–Leibler divergence is negative, the task of determining the posterior distributions of all the weights and biases can be obtained by maximizing the ELBO by using the stochastic gradient descend method, through variational inferencing [
36].
2.4. Validation
In order to validate the performances of the neural networks, parts of the data (20% for the FFNN and 50% for the BFNN) were randomly selected for testing the model’s accuracy and performances. By propagating the carbohydrate information in each sample set through the neural networks, the prediction values are calculated and compared with the testing data. For the FFNN that is used to blood glucose outcome, the distributions of the estimated risks and the actual risks are compared by using the MSE (Equation (
12)), which is also used as the validation criteria. For the BFNNs that are used to estimate the hyperglycemia and hypoglycemia risks, the distributions of the estimated risks and the actual risks are compared by using the ELBO criteria (Equation (
14)). Since more data is need for the ELBO than for the MSE calculation, a higher validation portion is assigned for the BFNN than the FFNN.
3. Results and Discussion
By using data generated from the UVA/Padova simulator, the outcome and risk prediction models were built based on gradient descend and the stochastic variational inference.
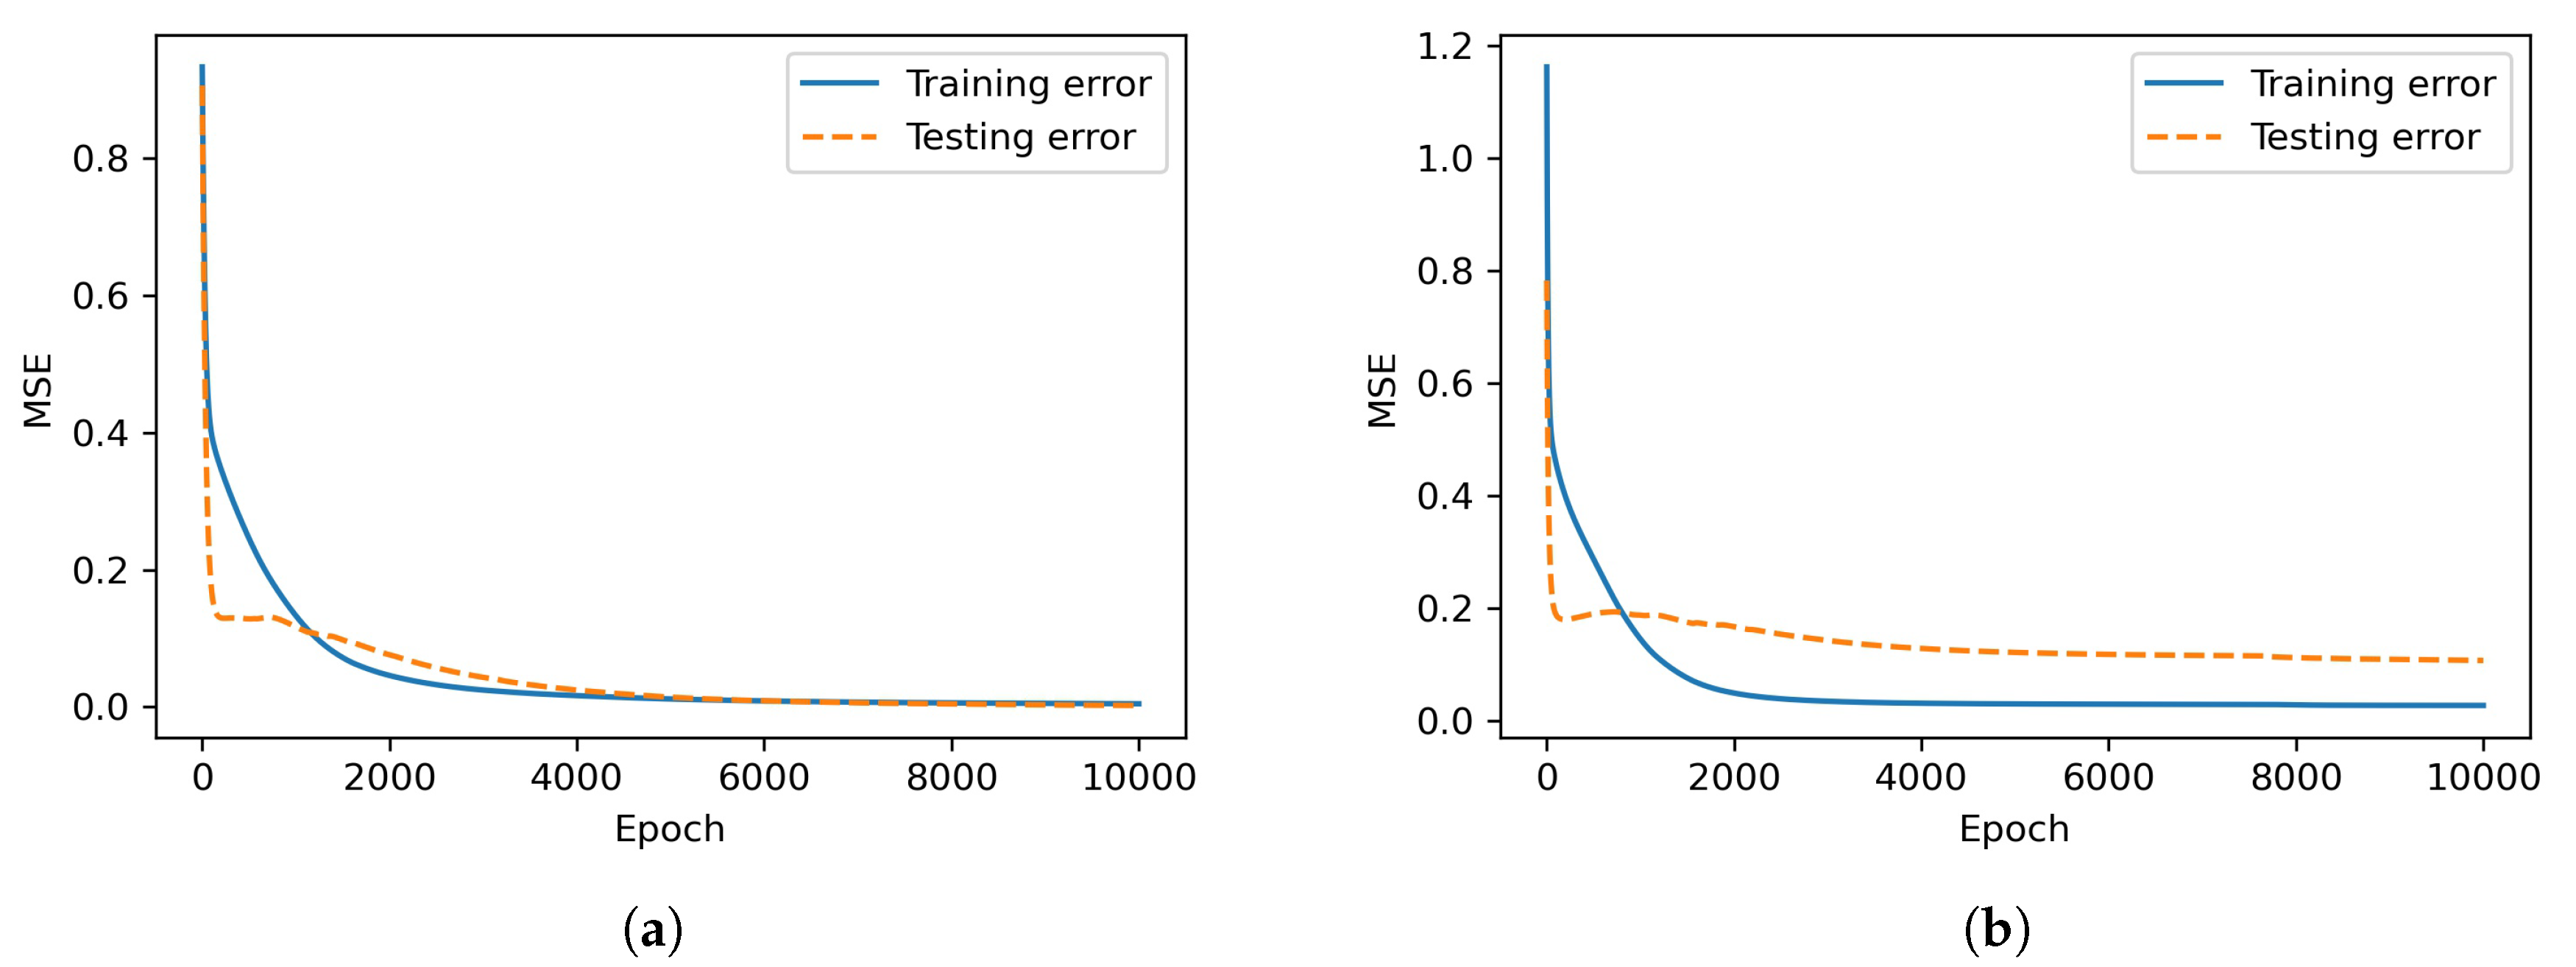
Figure 3 shows the MSE of the training and testing data during the training process of the feedforward neural networks.
Table 3 shows the final ELBO (defined by Equation (
14)) of the Bayesian neural networks under without and with noise in the CGM measurements.
Figure 4 shows the training data and predictions made by the models for different carbohydrate values without and with CGM noise, respectively. The deterministic reward prediction is represented by the solid red line. The predicted risks with 90%-confidence intervals are represented by a green and a blue-shaded uncertainty bands in the figure, correspondingly to the hypoglycemia and hyperglycemia risks, respectively.
It can be seen from
Figure 3 and
Table 3 that the prediction errors are higher when measurement noise is introduced. Consequently,
Figure 4 shows that the predicted risk uncertainty bands are wider when there is measurement noise, indicating that the predicted risk cannot be accurately predicted compared to nominal condition.
Based on the prediction models of the reward and risks, safe and optimal actions are derived as shown in
Table 4. Safe actions are defined as actions that have a 90% probability of the hypoglycemia risk under 5 and the hyperglycemia risk under 7. The risk thresholds reflect that higher emphasis was put on hypoglycemia due to the higher adverse effects of getting hypoglycemia. It can be seen that the lower and upper bound for safe actions are tighter under noise conditions, since the risk models capture the uncertainties and provide more conservative recommendations under more uncertain condition. The optimal recommendation is chosen among the safe actions that maximize the blood glucose outcome predicted by the deterministic feedforward neural network. Hence the value is the same for both conditions when there is CGM noise and when there is no CGM noise.
Figure 5 and
Figure 6 show different ranges of blood glucose when the patient follows the optimal recommendation, consumes food within the safe recommendation actions, or takes food with carbohydrate amounts between 0 and 200 g. The distribution of blood glucose measurement according to food intakes at certain time points can also be seen in the figures. The results show that the range of blood glucose responses to the optimal and safe actions are significantly better than the range of blood glucose when any action can be selected. The blood glucose range is slightly narrower in the case with CGM noise since the recommendation is more conservative in order to compensate for uncertainties in the responses.
4. Clinical Significance and Limitations
The methods presented in the paper demonstrate that a clinical decision support tool can be built using machine learning. Uncertainties in the data can be estimated and recommendations are provided with a statistically confident level. The tools have the potentials to be applicable in many safety-critical applications beyond type-1 diabetes and contribute towards the development of safe artificial intelligence. However, future efforts are needed to ensure the algorithms can be applied beyond in sillico simulations.
As a demonstration of how risk-averse machine learning methods can be developed and how the relationship between food intake and reward and risk can be visualized, only one variable (carbohydrate) was chosen as the input of the neural networks. Future studies should incorporate more variables that can affect blood glucose during and after physical activities such as previous food intakes, insulin doses, blood glucose levels before exercises and heart rate. The uncertainties can also be expanded to include other sources such as incorrect carbohydrate measurements, changes in intensity of physical activities and blood glucose kinetics. It is also noted that more complex neural networks require more data to obtain a satisfactory accuracy or performance, therefore, new methods that can effectively reduce the dependence on a large dataset is needed. Propagation of uncertainty analysis also contributes and make the methods more reliable. The current technique assumes that the outputs of the Bayesian neural networks are Gaussian-distributed. New methods that can accurately predict the output distribution will increase the accuracy of the prediction interval, and also the recommendations provided to the patients.

 and
and 


