Article

Selection of the Optimal Actions for Crashing Processes Duration to Increase the Robustness of Construction Schedules

Faculty of Civil Engineering and Architecture, Lublin University of Technology, Nadbystrzycka 40, 20-618 Lublin, Poland
*
Author to whom correspondence should be addressed.
Appl. Sci. 2020, 10(22), 8028; https://doi.org/10.3390/app10228028
Submission received: 13 October 2020 / Revised: 11 November 2020 / Accepted: 12 November 2020 / Published: 12 November 2020

Abstract

:
Both the construction clients and the contractors want their projects delivered on time. Construction schedules, usually tight from the beginning, tend to expire as the progress of works is disturbed by materializing risks. As consequence, the project’s original milestones are delayed. To protect the due date and, at the same time, avoid changes to the logic of work, the manager needs to the project progress and, if delays occur, speed up processes not yet completed. The authors investigate the problem of selecting the optimal set of actions of responding to schedule delays. They put forward a simulation-based method of selecting schedule compression measures (speeding up processes) and determining the best moment to take such actions. The idea is explained using a simple case. The results confirm that it is possible to find an easily implementable schedule crashing mode to answer schedule disturbances. The proposed method enables minimizing the cost of schedule crashing actions and the cost of delays as well as increasing the robustness of the schedule by reducing differences between the actual and the as-planned process starts. It is intended as a decision support tool to help construction managers prepare better reactive schedules. The lowest costs are achieved if the acceleration measures are implemented with some time lag to the occurrence of delays.

1. Introduction

1.1. Motivation

Risk and uncertainty are inherent in construction projects [1,2]. Construction is claimed to be more vulnerable to them than other types of economic activity [3]. The effects of a large number of project participants, long production cycles, and variable locations of work units add to the impacts of external environmental factors. The more technically complex a project is and the longer it takes, the greater the impact of risk, while the greater the probability of risk occurrence makes the scale of impact more difficult to assess [4].
In practice, the actual construction time is rarely in line with the initial schedules. This is due to the effects of random conditions. The recent literature presents two directions of non-deterministic construction scheduling: one based on stochastic methods, the other employing the fuzzy set theory. The latter treats the process duration not as a random variable, but as an imprecise (fuzzy) number [5]. However, both of them assume that an experienced planner can predict an approximate scenario of the occurrence of disturbing factors and their approximate effects.
Risk is understood as the possibility of an undesirable result (a loss). It is often determined on based on an estimated probability of the event occurring within a period of analysis [6]. Risk analysis is a process of assessing (estimating) the value of factors influencing the effects of a decision. Risk assessment is the process of determining the risk profile, allowing for the variability of the risk factors’ impact. The risk profile is explicitly described by a probability density or distribution function of time, cost, or other parameters describing the loss. Apart from risk analysis and assessment, the risk management process includes the design and implementation of risk response measures. These affect the impact or likelihood of adverse events and are aimed at reducing or maintaining the risk at an acceptable level.
Network methods are commonly used in the construction industry to schedule non-repeatable projects that include non-cyclical, non-rhythmic, and heterogeneous processes. The methods that treat process durations as random variables (like PERT (Programm Evaluation and Review Technique), CYCLONE, Petri network) most often focus on estimating the probability of meeting a particular deadline or calculating the project duration at a given confidence level, rather than on creating expedient risk-aware schedules.
The scheduling process should focus on the reliability of the project due date, as exceeding it puts all parties of the contract in an uncomfortable situation: the client loses opportunities for operating the facility, while the contractor pays contractual penalties and loses reputation.
The project due date is not the only essential element of the plan: delays with milestones and even particular processes can become costly and propagate disturbance into the project’s meticulously designed organization system of subcontractors and suppliers, all of them trying to synchronize multiple duties in many projects. Thus, moving a subcontractor’s task to a later date may even be out of the question (it may result in breaking the contract), or at least lead to downtime and extra costs. Reliable process deadlines are also vital for managing the contractor’s in-house resources, planning material supplies, and plant maintenance.
The scheduling methods themselves may hinder defining reliable dates—because of the way their models simplify reality. For instance, PERT and some other classic scheduling techniques assume that processes start immediately after the end of their predecessors, ignoring other process starting policies observed in practice. This way, it is not possible to model a constraint that a process cannot start earlier than on a predetermined date.
Imperfect scheduling techniques produce schedules that easily expire, and their target dates cannot be met. This naturally leads to the researchers’ and practitioners’ undertaking to develop proactive methods to create disturbance-proof schedules. However, there is a demand for reactive methods to support updating schedules to answer disruptions. They are expected to prompt the most economical measures to prevent the propagation of schedule delays.

1.2. Literature Review

The volatility of construction conditions results in the variability of construction process execution time and even in uncertainties of the scope of work. To allow for the non-deterministic character of projects and their environment, the schedulers frequently treat process durations as random variables. Beta [7], logarithmic-normal [8], Weibull [9], trapezoidal [10], or triangular [11] distributions are thus used. The triangular distribution is argued to be the most intuitive to interpret [12,13,14]. Nevertheless, randomizing the durations of processes opens up the possibility to use simulation techniques to analyze the possible development of projects.
The literature presents numerous simulation models of construction projects [15,16,17]. The model of Lu and AbouRitzk [18] combined the discrete event simulation with a simplified way of defining the critical path in the network. Shi [19] used activity based construction simulation modeling that uses only one graphic symbol to represent a process. Lee et al. [20] developed a stochastic simulation system (AS4), based on the CPM (Critical Path Method). Sadeghi et al. [21] presented an original method of planning projects in random conditions DESPEL (discrete event simulation with probabilistic event list); they accounted for resource availability constraints. Lee [22] developed the stochastic project scheduling simulation (SPSS) to estimate the probability of meeting the due dates and the criticality of processes. Aziz [23] constructed his repetitive-projects evaluation and review technique (RPERT) that combines PERT with the line of balance. Jaskowski and Biruk [24] used simulations to assess the process criticality according to the processs’ impact on the project timelines. The model by Leu and Hung [25] enables resource leveling under uncertain activity durations and combines the Monte Carlo simulation method with genetic algorithms. Biruk and Rzepecki [26] compared the performance of several priority rules applied to scheduling a pipeline project; the simulation was to help select a priority rule for resource allocation most suitable from the point of timely project completion in random conditions.
Two distinct approaches to random scheduling are observable in the literature: the “offline” and the “online” [27,28]. The former, also referred to as proactive or predictive [29], consists of constructing a schedule that anticipates all possible future disruptions, with their identification resting upon the incomplete and uncertain information available before the start of the project. The latter is considered a continuous activity, with decisions on the processes’ timing or scope, made and verified as the works progress and for a short planning horizon. The online scheduling uses the concepts of stochastic and reactive scheduling to create the schedule and update it.
The proactive approach consists of designing robust schedules to be immune to the future and uncertain disturbances. It uses robust optimization techniques that focus on keeping the schedule acceptable (i.e., meeting all constraints) for all realizations of the uncertain durations within an uncertainty set. These techniques can be applied even if the probability distribution of the parameters cannot be defined, provided that the ranges of their values are known [30]. However, this approach is considered conservative: it may produce solutions much worse than expected or even infeasible.
One of the ways to increase the schedule robustness is to allocate time buffers to processes using techniques based on contingency or redundancy. Some researchers put forward constructing a schedule in a traditional way (no risks considered), then adding time buffers at the end of all processes, and treating the buffers as an integral part of the expected process duration [31]. In this case, the time buffer does not prevent the propagation of disturbances throughout the schedule. For these reasons, other strategies of buffer allocation are recommended, for instance, placing buffers only before the particularly important processes [29,31,32].
The critical chain concept by Goldratt [33] is one of the first methods of designing disturbance-resilient schedules, where the completion date is protected by time buffers. Goldratt’s critical chain does not allow the planner to define precise completion dates of individual processes—as with PERT, processes are modeled to start immediately on completion of their predecessors.
Buffer sizing and location are still unsolved issues [34,35]. Herroelen and Leus [32] constructed an optimization model to determine the size of time buffers in a schedule with discrete disturbances of a single process. However, as the level of complexity of real-life problems is much greater (many possible disruptions of numerous processes), it seems pointless to look for exact optimal solutions [29]. The heuristics of the adapted float factor, the resource-flow dependent float factor, the virtual activity duration extension, and the starting time criticality [32,34,36] belong to the best-known algorithms for buffer sizing.
Herroelen and Leus [32], as well as Van de Vonder et al. [34,36], maintain that a robust schedule with a fixed due date must minimize the instability cost function. The function is defined as the weighted sum of the expected deviations between the processes’ as-scheduled start dates and the random variables of their durations.
The method of increasing the reliability of predictive schedules and minimizing the instability cost function was proposed by Jaśkowski [37]. An effective way to reduce the instability cost is to look for time-optimal baseline schedules to increase the total float to be distributed among the processes in the form of time buffers. For this purpose, a variety of schedule compressing methods can be applied.
With stochastic scheduling, no baseline schedule is needed. Consecutive activities are added to a previously built partial schedule according to a predefined scheduling policy (e.g., priority rule). At each decision point, the policy determines which activity is to be incorporated into the schedule concerning all precedence relations and constraints [38].
The framework of simulation-based scheduling is widely used to select the best scheduling policy [39,40]. Wang et al. [41] used this method to compare the efficiency of the 20 most common priority rules of resource allocation. They conducted a full factorial experiment on a sample of 1260 projects combined into 420 project portfolios. Their results provide guidelines for selecting the most suitable priority rule according to both the schedule quality and the measures of robustness.
As for the reactive scheduling approach, it rests upon updating schedules whenever they expire due to disturbance. The scope of such updates is defined based on all available information on the project itself and its environment collected so far [42]. The rescheduling action can be planned at fixed intervals or in reaction to a substantial disturbance [39].
If the actual duration of some activity deviates from the baseline schedule, the common objective of rescheduling is to keep the discrepancies between the baseline and the updated schedule to a minimum. This typically consists of minimizing the weighted sum of the expected absolute deviations between the as-planned and actual activity start dates while maintaining the original objectives and constraints of the schedule.
As in the case of proactive scheduling, the reactive methods also use scheduling policies. For instance, Van de Vonder [43] proposed two new schemes of robust reactive schedule generation based on priority rules.
Pasławski [44] put forward a method to improve the performance of the reactive approach by increasing the flexibility of the initial schedules. He recommended preparing a set of acceptable variants of construction methods and organizational solutions for the processes. This was to facilitate schedule updating as disruptions occur.
The same general idea of selecting from a number of activity modes was used by Deblaere et al. [45]. In the course of the rescheduling process, they allowed changes in the mode of some activities while adhering to resource availability constraints. However, they focused their analysis on two types of schedule disruptions: variations in activity durations and resource disruptions, both of a discrete character and occurring at random moments. They also neglected the randomness of processes not yet completed.
Yang [46] argues that most practitioners are reluctant towards computationally complex schedule optimization procedures; they prefer simple scheduling rules. Therefore, this paper puts forward a simple method of selecting actions, reducing the duration of processes not yet completed and determining the moment of their implementation to reduce delays in starting processes or project stages. The proposed method of responding to schedule disruptions does not use any advanced optimization algorithms but helps to reduce the cost of increasing the robustness of the schedule.

2. Materials and Methods

2.1. Simulation Technique for Construction Project Planning

Simulation models have been used to describe, plan, and study complex construction projects for several decades. Simulation is a technique of solving problems that consists of tracking changes in the dynamic model of a system over time [47,48]. Simulation methods are used to analyze models too complex to be approached with analytical methods. Their main advantages are the lack of limitations on the model’s structure and level of complexity, and the possibility to capture stochastic processes.
Simulation experiments on project network models with non-deterministic process durations help planners assess the impact of process duration variability on the project performance [49]. The probability distributions of process start times estimated in the course of simulation experiments may serve as the basis for contractual deadlines, such as subcontractors’ commencement with work or the project finish, at a predefined level of confidence.
The first stage of a simulation experiment is the preparation of the model to study the impact of the system input parameters on the outputs. In the course of modeling the construction project, its scope is broken down into elements, work packages, processes, or even detailed construction operations—depending on the desired level of detail. Then, these components are combined into a network by introducing technological and organizational relationships. The next stage, collection and analysis of input, consists of determining the quantity of the work, the related workloads, and estimating the distribution type and parameters of process durations.
The next step is programming. The model can be coded using a general-purpose programming language (e.g., C++ or Python) or one of the dedicated simulation languages. The latter contains in-built mechanisms of system time-lapse and simulation control, random number generators, and procedures for collecting and presenting results. Moreover, they facilitate rapid modifications of the model, the input, and the constraints. The popular languages for discrete simulation are GPSS and Simscripti Simula. A set of convenient tools to analyze network models is offered by visual interactive simulation (VIS) systems that facilitates the modeling process. VIS packages (e.g., AnyLogic or Witness) enable the user with no programming skills to build a model, conduct simulation tests and analyze the results.
As the model is being programmed, and on completion of this process, verification is needed to confirm its correctness. This consists of checking its operation. Then, the model should be validated, which consists of assessing how exactly the model describes the real system [47]. Due to the one-time nature of construction projects, model validation is a difficult task. Most often, it consists of comparing the results generated by the model with results of other models, either analytical or other, verified, simulation models. The stage of planning experiments is to determine the values of input parameters. During the experiments, the observed values of the examined quantities are collected to determine—at the stage of analyzing the results—the confidence intervals for their means and standard errors. When designing simulation experiments, the aim is to minimize the length of the confidence intervals, which guarantees good quality of the results.

2.2. Modeling Process Duration with Risk

The credibility of the project model depends on the correctness of the input, in this case, the types and parameters of probability distributions of the process durations. The labor productivity benchmarks developed for the whole industry are estimated with the assumption of “average conditions”. They do not account for unique conditions of a particular organization, project, location, actual composition and qualification of work gangs, and inevitable fluctuations of their performance, or weather. Most “standard labor productivity rates” are published as single values, with no hint on the scale of variability observed during data collection. Therefore, their use in the simulations is limited.
In practice, the types and parameters of process durations are assumed based on historical data or expert opinions. Due to the unique nature of construction projects, historical data are of limited use. Collecting productivity data in the course of a project and recording them together with data on particular conditions is time-consuming and expensive. The results become unreliable when the technical and organizational conditions change, and the use of statistical forecasting methods is risky, especially when the values of the forecasted parameters exceed the range of available data.
The quality of experts’ estimates depends on their individual experience and subject to bias. Experts from the client’s side tend to be over-optimistic, while the contractor prefers to be “on the safe side” and schedule processes to take longer. To balance opinions, group decision-making methods are applied [50].
The experience prompts that the probability density function of construction processes duration is right-skewed. According to Johnson [11], the triangular distribution—described using simple analytical dependencies understandable to practitioners—provides an adequate approximation of the beta distribution used in the PERT, and the results of the risk assessment do not differ significantly. Many authors (e.g., Johnson [11], Kotz and van Dorp [13]) recommend defining the parameters of triangular distribution based on the mode and quantiles ta,p and tb,r of order p and r (typically p = 0.10, q = 0.90 or p = 0.05, q = 0.95 ). The method by Jaśkowski [24] may be used to determine the parameters of the triangular distribution of construction processes duration under various conditions.

2.3. Proposed Method to Improve Construction Schedule Robustness

The proposed method is intended to be applied in the course of the project to prompt reactions to schedule disturbances. It assumes that there exists a baseline schedule that defines the project completion date and the dates of key subcontracted processes. It assumes that a failure to meet these dates results in penalties. Their amounts are defined in the contract between the client and the general contractor and the contracts between the general contractor and the subcontractors. To mitigate delays and minimize penalties once delays occur, it is necessary to speed up processes not yet completed. The method helps select the most economical ways to do it.
The method encompasses the following steps:
  • Constructing the project’s network model (breaking down the scope into processes, allocating resources (crews/subcontractors), defining relationships between processes, defining process durations).
  • Creating the baseline schedule and specifying processes whose start dates must be protected against delays, then determining the unit costs of delaying their start.
  • Designing variants of actions to reduce process durations and determining their costs.
  • Simulation studies of the project implementation model for various time reduction policies.
  • Finding the optimal time reduction modes.
The project network is represented by a directed acyclic unigraph G = V , E of a single start and a single end node. V = { 0 , 1 , , n } is the set of construction processes (schedule tasks). E V × V is a two-argument relation describing the sequence of processes. A function T :   V R + assigns durations t i to processes i V ; the durations are random values of predefined distribution types and parameters. The estimated costs of processes are expressed as ci. The project’s predefined due date sets the time for completion to Tmax.
The baseline schedule is built using the expected values of process durations to meet the predefined due date. Alternatively, the baseline schedule may be based on process durations corresponding to a particular quantile of the duration distribution.
To improve the schedule’s robustness against disruption, it is advisable to distribute the free float as time buffers located before the processes whose start dates need to be protected (such as subcontracted processes with start dates contractually fixed or processes that involve an expensive hired plant). The set of processes that need to be protected is Vd.
It is assumed that the processes from the set of Vd can start no earlier than on the date set for them in the baseline schedule; the literature refers to this scheduling policy as the railway policy. The unit cost of delaying the process that belongs to Vd is c i d and represents contractual penalties or other costs attributable to such delay.
The baseline schedule’s start dates of any process of the project is marked as s i . In the course of the project, the processes are going to start as their predecessors are actually completed. In the case of processes i V d , they are not allowed to start earlier than on the date set for them in the baseline schedule. Due to the stochastic nature of process duration, their starts can be delayed. Thus, the actual start of a process s i r may come later than the as-scheduled start ( s i r > s i ).
As the delays are detected, the manager needs to decide on actions that prevent the propagation of disruptions on the processes to follow. These actions aim at reducing the execution time of delayed processes that are not yet started and consist in adding resources (reinforcing crews, using a more efficient plant), change of construction methods, working overtime, incentivizing the crews to work harder, etc. Inevitably, they result in an extra cost. The viable options of ways to compress the time of any process i V (also their combinations) form a set Wi. The options differ in the resulting process time and cost. Let us assume that the option-related process duration t i j is a random variable of known distribution type and parameters, and the option-related process cost cij is deterministic. Therefore, the expected value of the duration of process i, if decided to be delivered using option j W i , is Δ i j = t i t i j , where tij is the expected value of the random variable t i j . Let us put the options in the ascending order according to the values of Δ i j and number them accordingly ( j = 1 , 2 , ).
Selecting actions of reacting to the process start delays consists of determining the best option and the best time of its deployment. The latter is defined by a lag, marked as λ , between the baseline start of the process and the moment when acceleration measures begin.
It is assumed that the first option of the time compressing actions (i.e., the option that offers the highest acceleration) is selected if s i r s i λ . If s i r s i Δ i , j + 1 + λ , then the next option is to be selected.
To facilitate operative management, the lag λ is constant and equal for all processes. Its value is subject to optimization: λ is defined in a way that minimizes the sum of the cost of process start delays, Cd, and the cost of the duration compression measures, Cw:
min C ( λ ) :   C ( λ ) = C d + C w = i V d c i d E ( s i s i ) + i V j W i ( c i j c i ) E ( x i j ( λ ) ) ,
where s i is the random variable representing the start of process i V d , and x i j ( λ ) is an auxiliary random variable; it equals 1 if option j is decided for the delivery of process i, and 0 otherwise; the value depends on the value of λ . The expected values of s i and x i j ( λ ) are estimated based on simulation experiments for different λ .

3. Results

The application of the method is presented in an example. It is based on the schedule of a project to build a single block of flats (rainforced concrete frame filled with masonry, monolithic floor slabs—a structure typical for Polish housing). The network model (Figure 1) presents relationships between processes entrusted to specialized crews/subcontractors. The project scope is broken down into 14 processes plus two dummy nodes: project start and project finish.
The process durations are defined as random values of triangular distribution, and their costs are deterministic. The values of costs were derived from a real-life cost plan, and the parameters of random variables of process durations were the construction superintendent’s estimates gathered during an interview. Table 1 lists the values of process parameters.
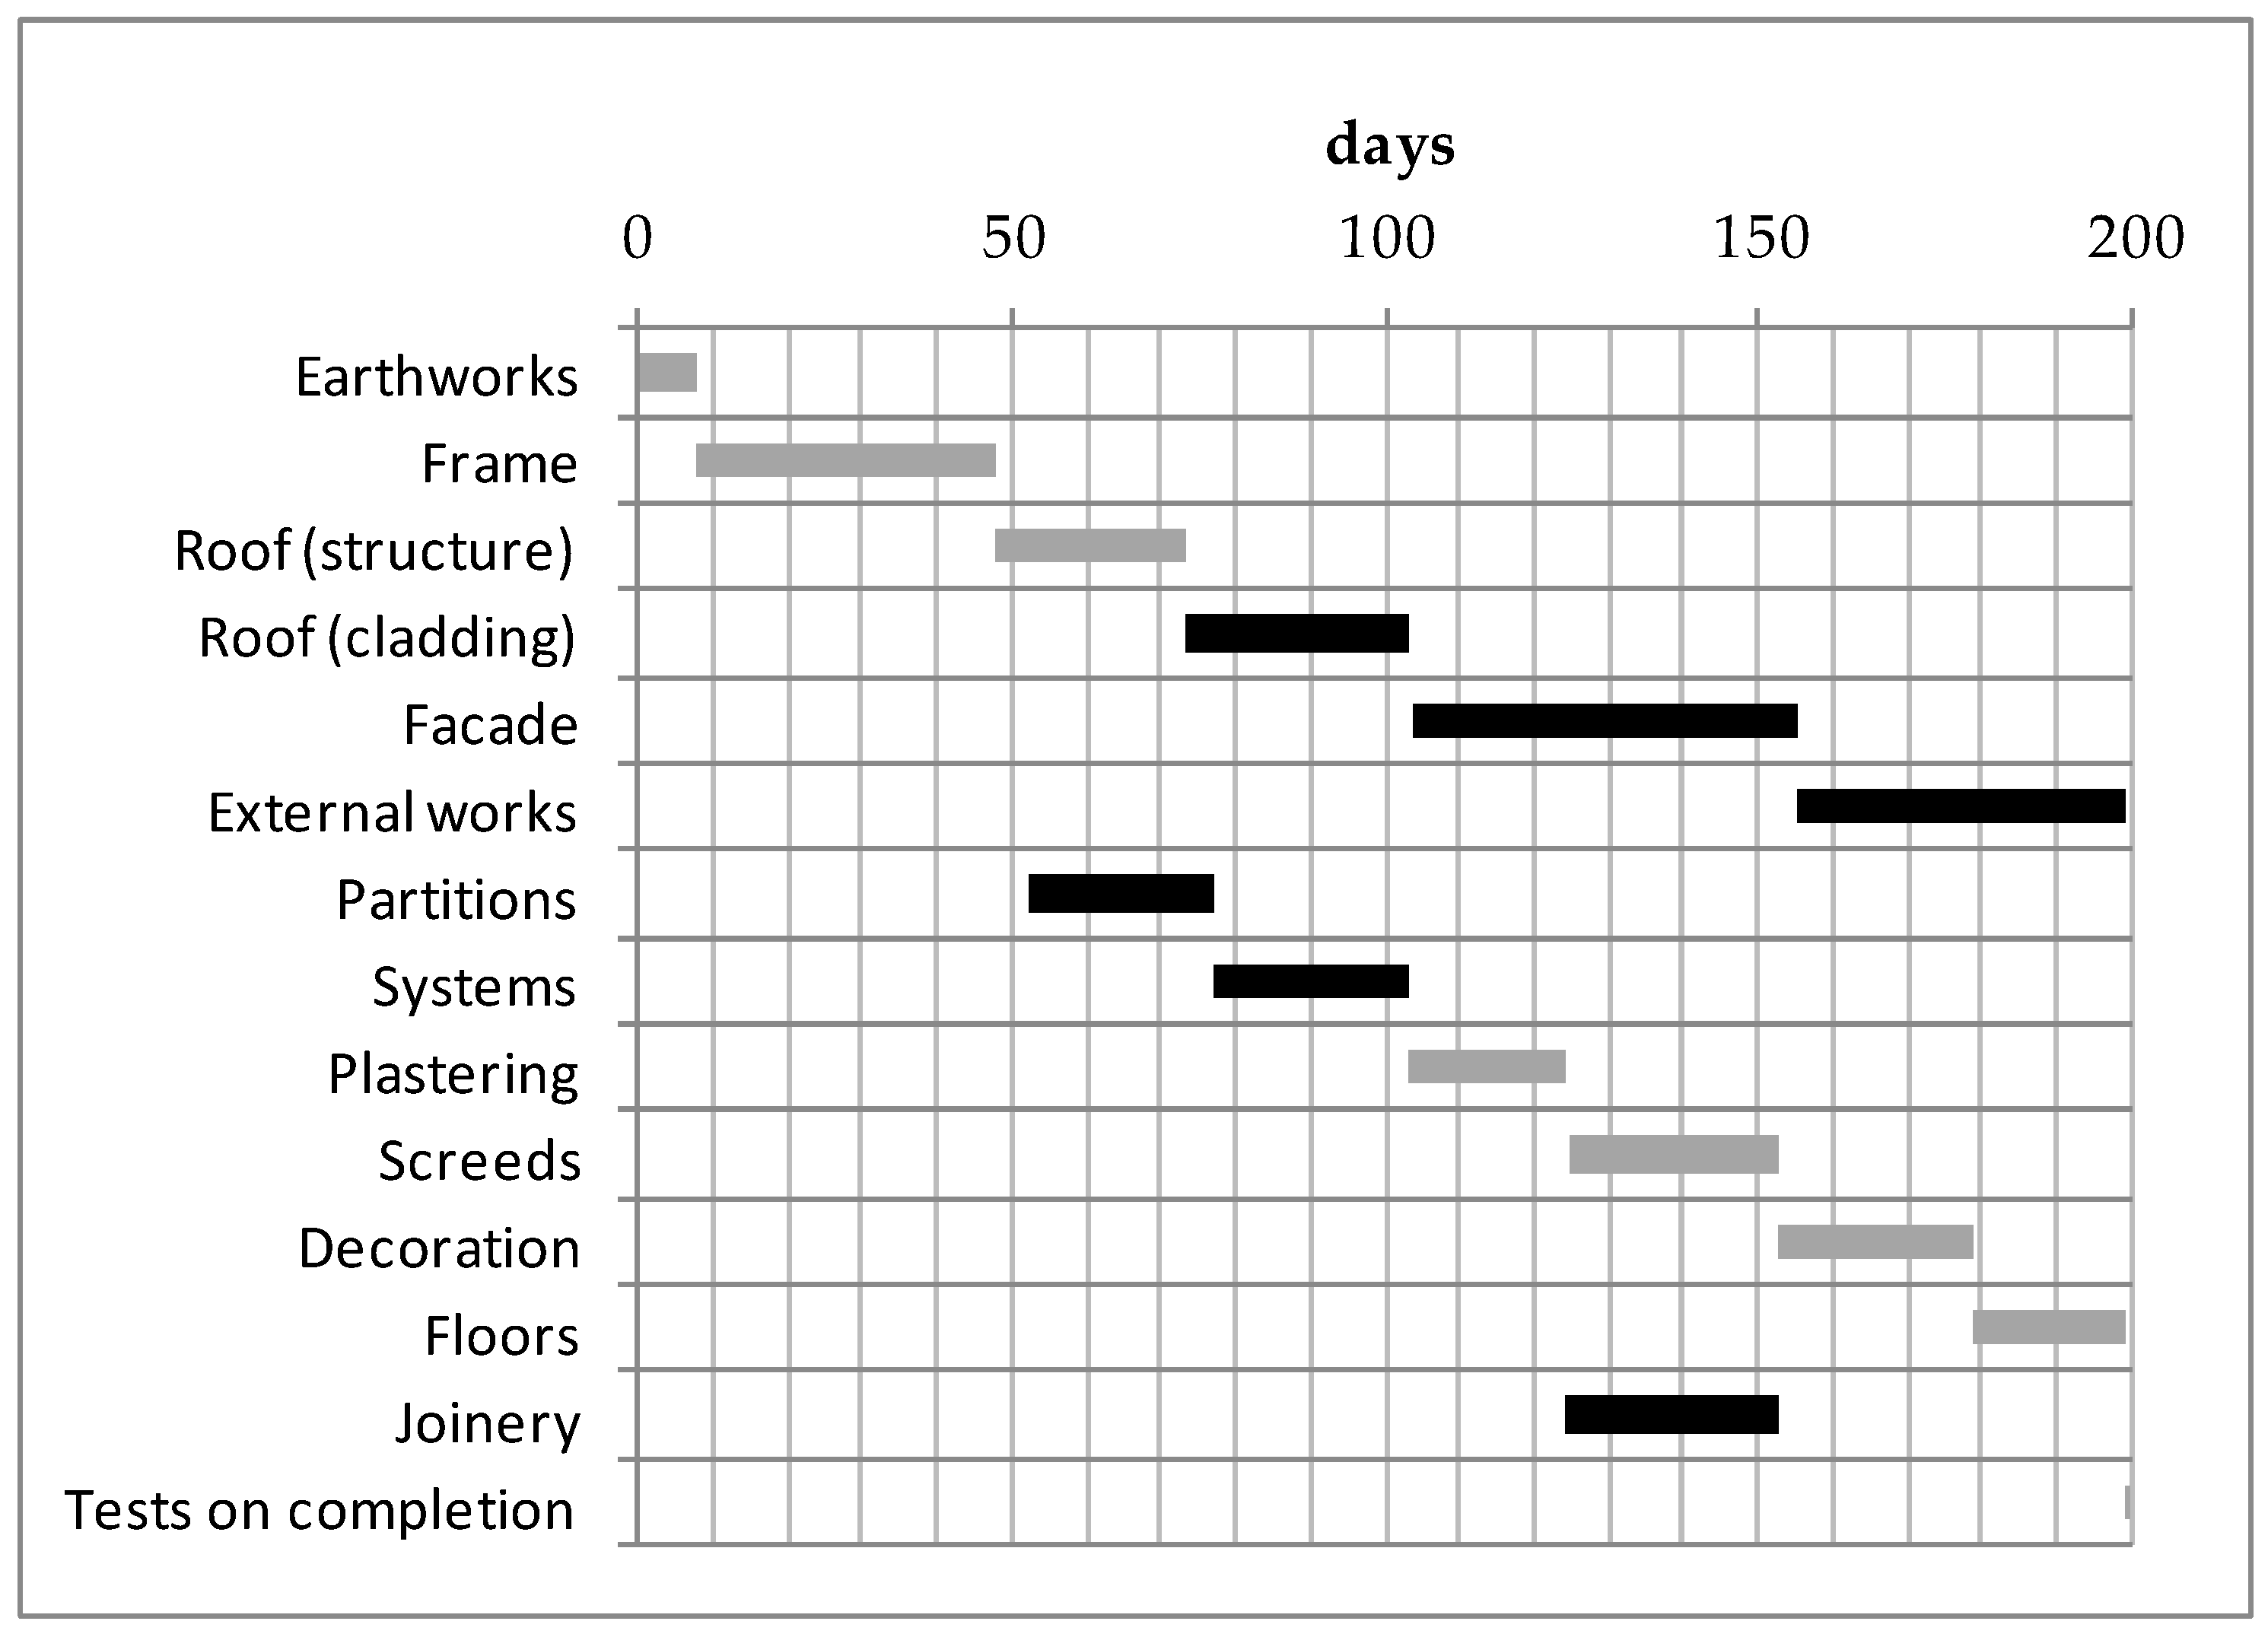
The predefined time for completion is Tmax = 200 days. Figure 2 presents the baseline schedule. Processes marked black are the processes whose start days must be protected against disruption (so the processes that belong to the set Vd). The unit costs of their delays are set to 1% of their total value—for each day of delay (they can be understood as penalties agreed with the subcontractors hired to deliver them). These processes are to be started according to the railway policy. The unit cost of delaying the whole project is also 1% of the total project cost (the sum of costs shown in Table 1), so 270,045 EUR/day (delay penalty of the main contract).
It was assumed that the project starts at moment zero (no delay). The “Earthworks” are to be carried out using the baseline methods (no time reduction measures—no options available). The same holds for the “Tests on completion”.
As for the remaining processes, each is assigned two options of time-reducing measures; their parameters are presented in separate tables (Table 2 and Table 3) for clarity. The options with longer expected values of process durations are grouped in Table 2. Following the convention of numbering options in ascending order according to the scale of duration reduction (described in the previous chapter), this table presents the set of options with index j = 1. Table 3 groups options that compress durations more strongly, thus j = 2. Please note that stronger compression was assumed to be more costly (last column in Table 2 and Table 3).
The simulation model was coded using GPSS language, and the simulations were conducted in GPSS Word Minuteman Software. The experiment was repeated with different lags (λ) for introducing the time compression measures. Each experiment involved 10,000 simulation runs.
Table 4 lists the expected values of delayed start dates of processes, juxtaposing three cases. Case I allows no time-reduction measures—all processes are delivered using methods assumed for the baseline. Case II offers a choice between the baseline methods and options coming only from the first group (Table 2). Case III makes it possible to choose from the baseline option and both options of time-reducing measures.
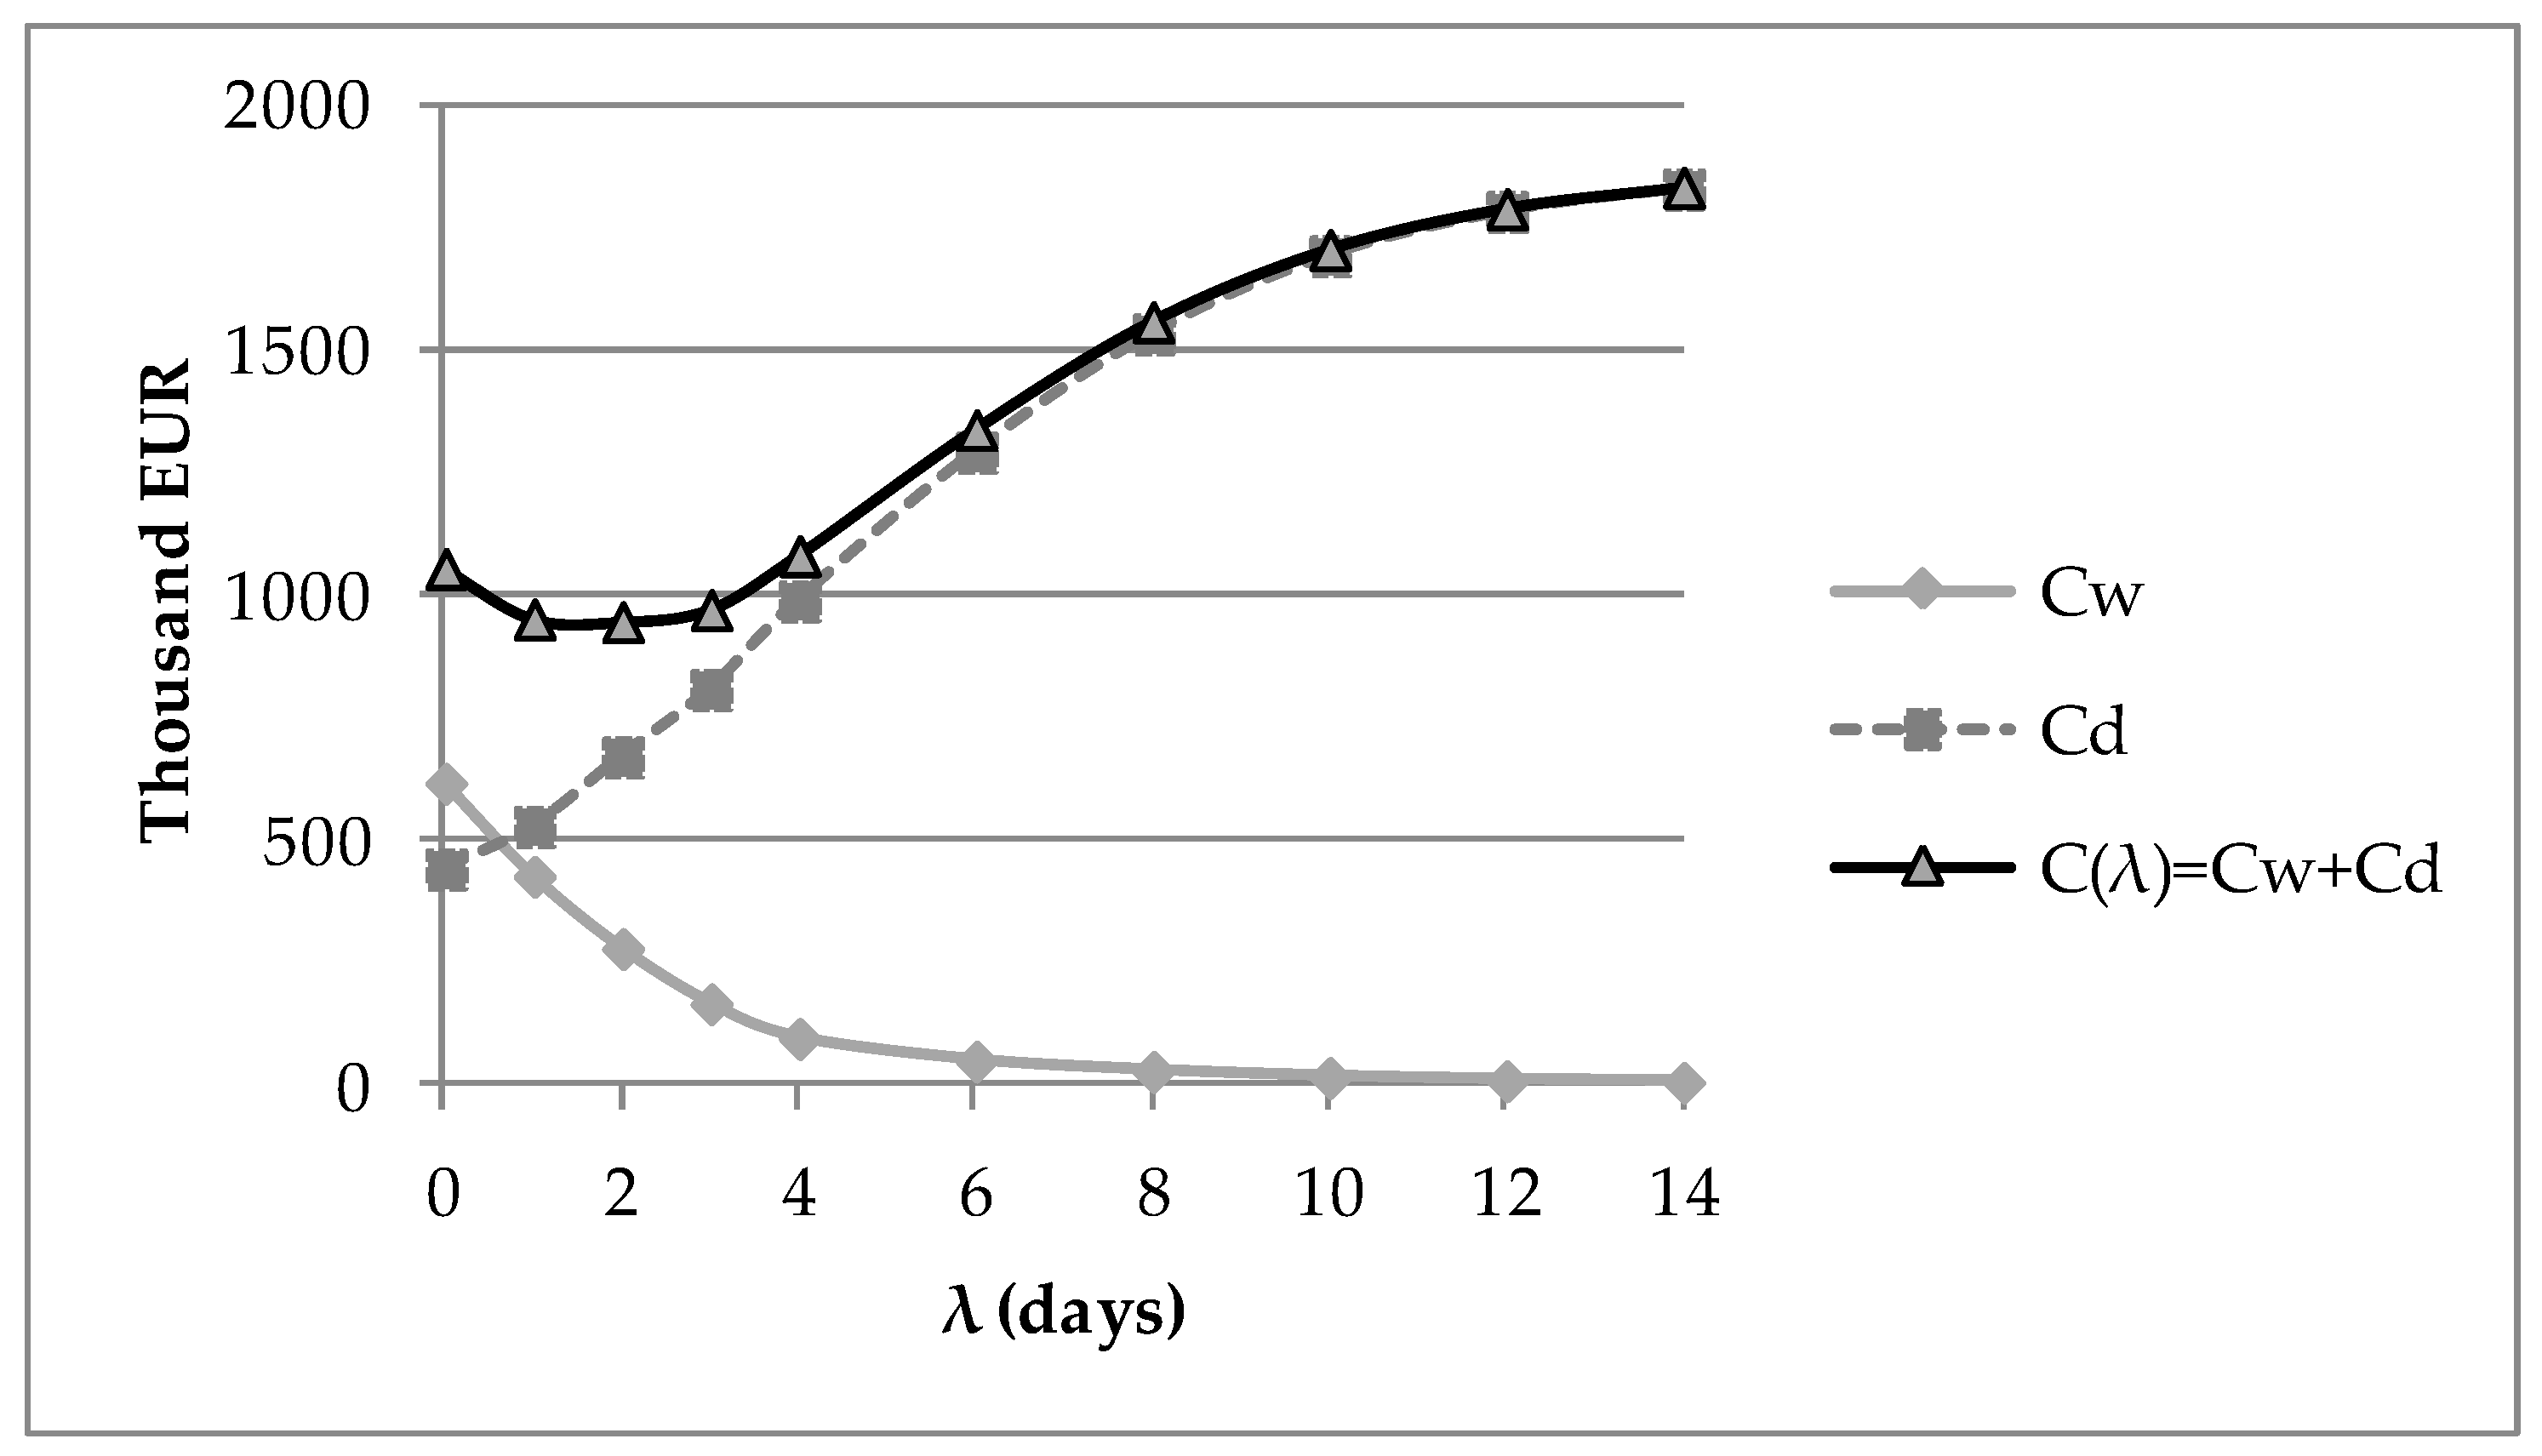
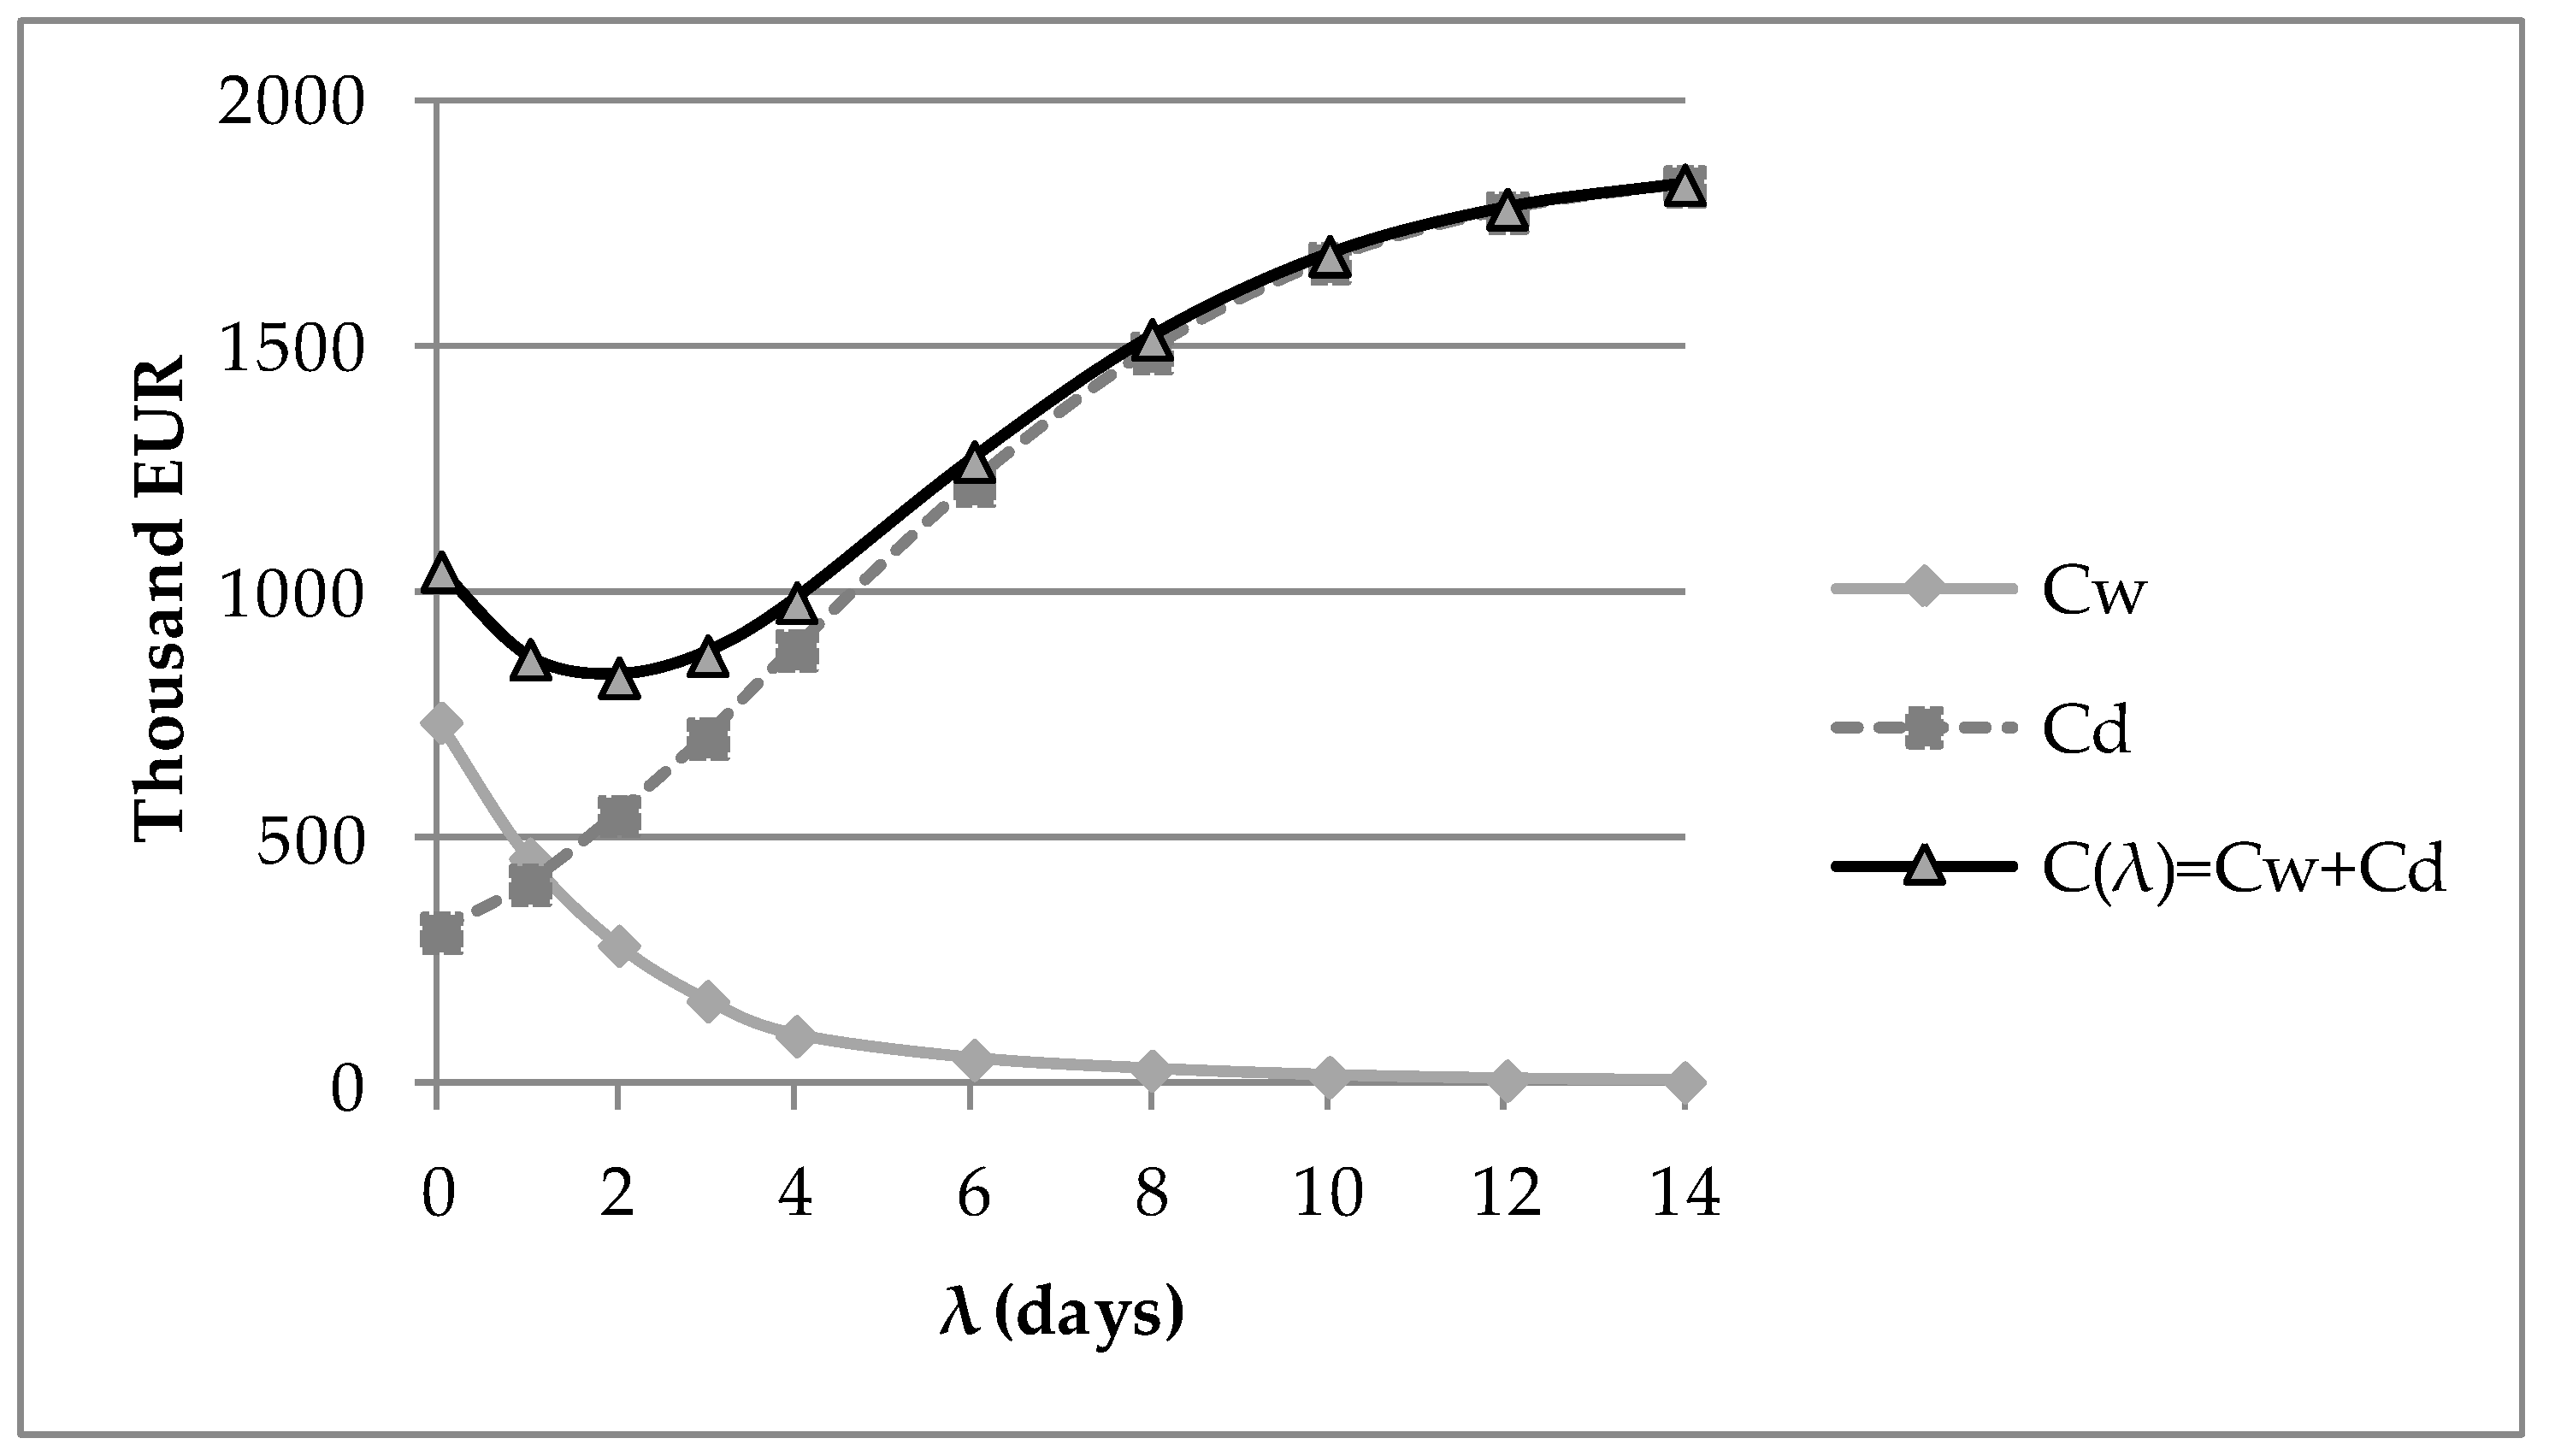
Figure 3 and Figure 4 show the relationships between the value of the lag (λ) for introducing duration compression measures and the expected value of the total cost of delays (Cd) and time reduction measures (Cw) for cases II and III, respectively.
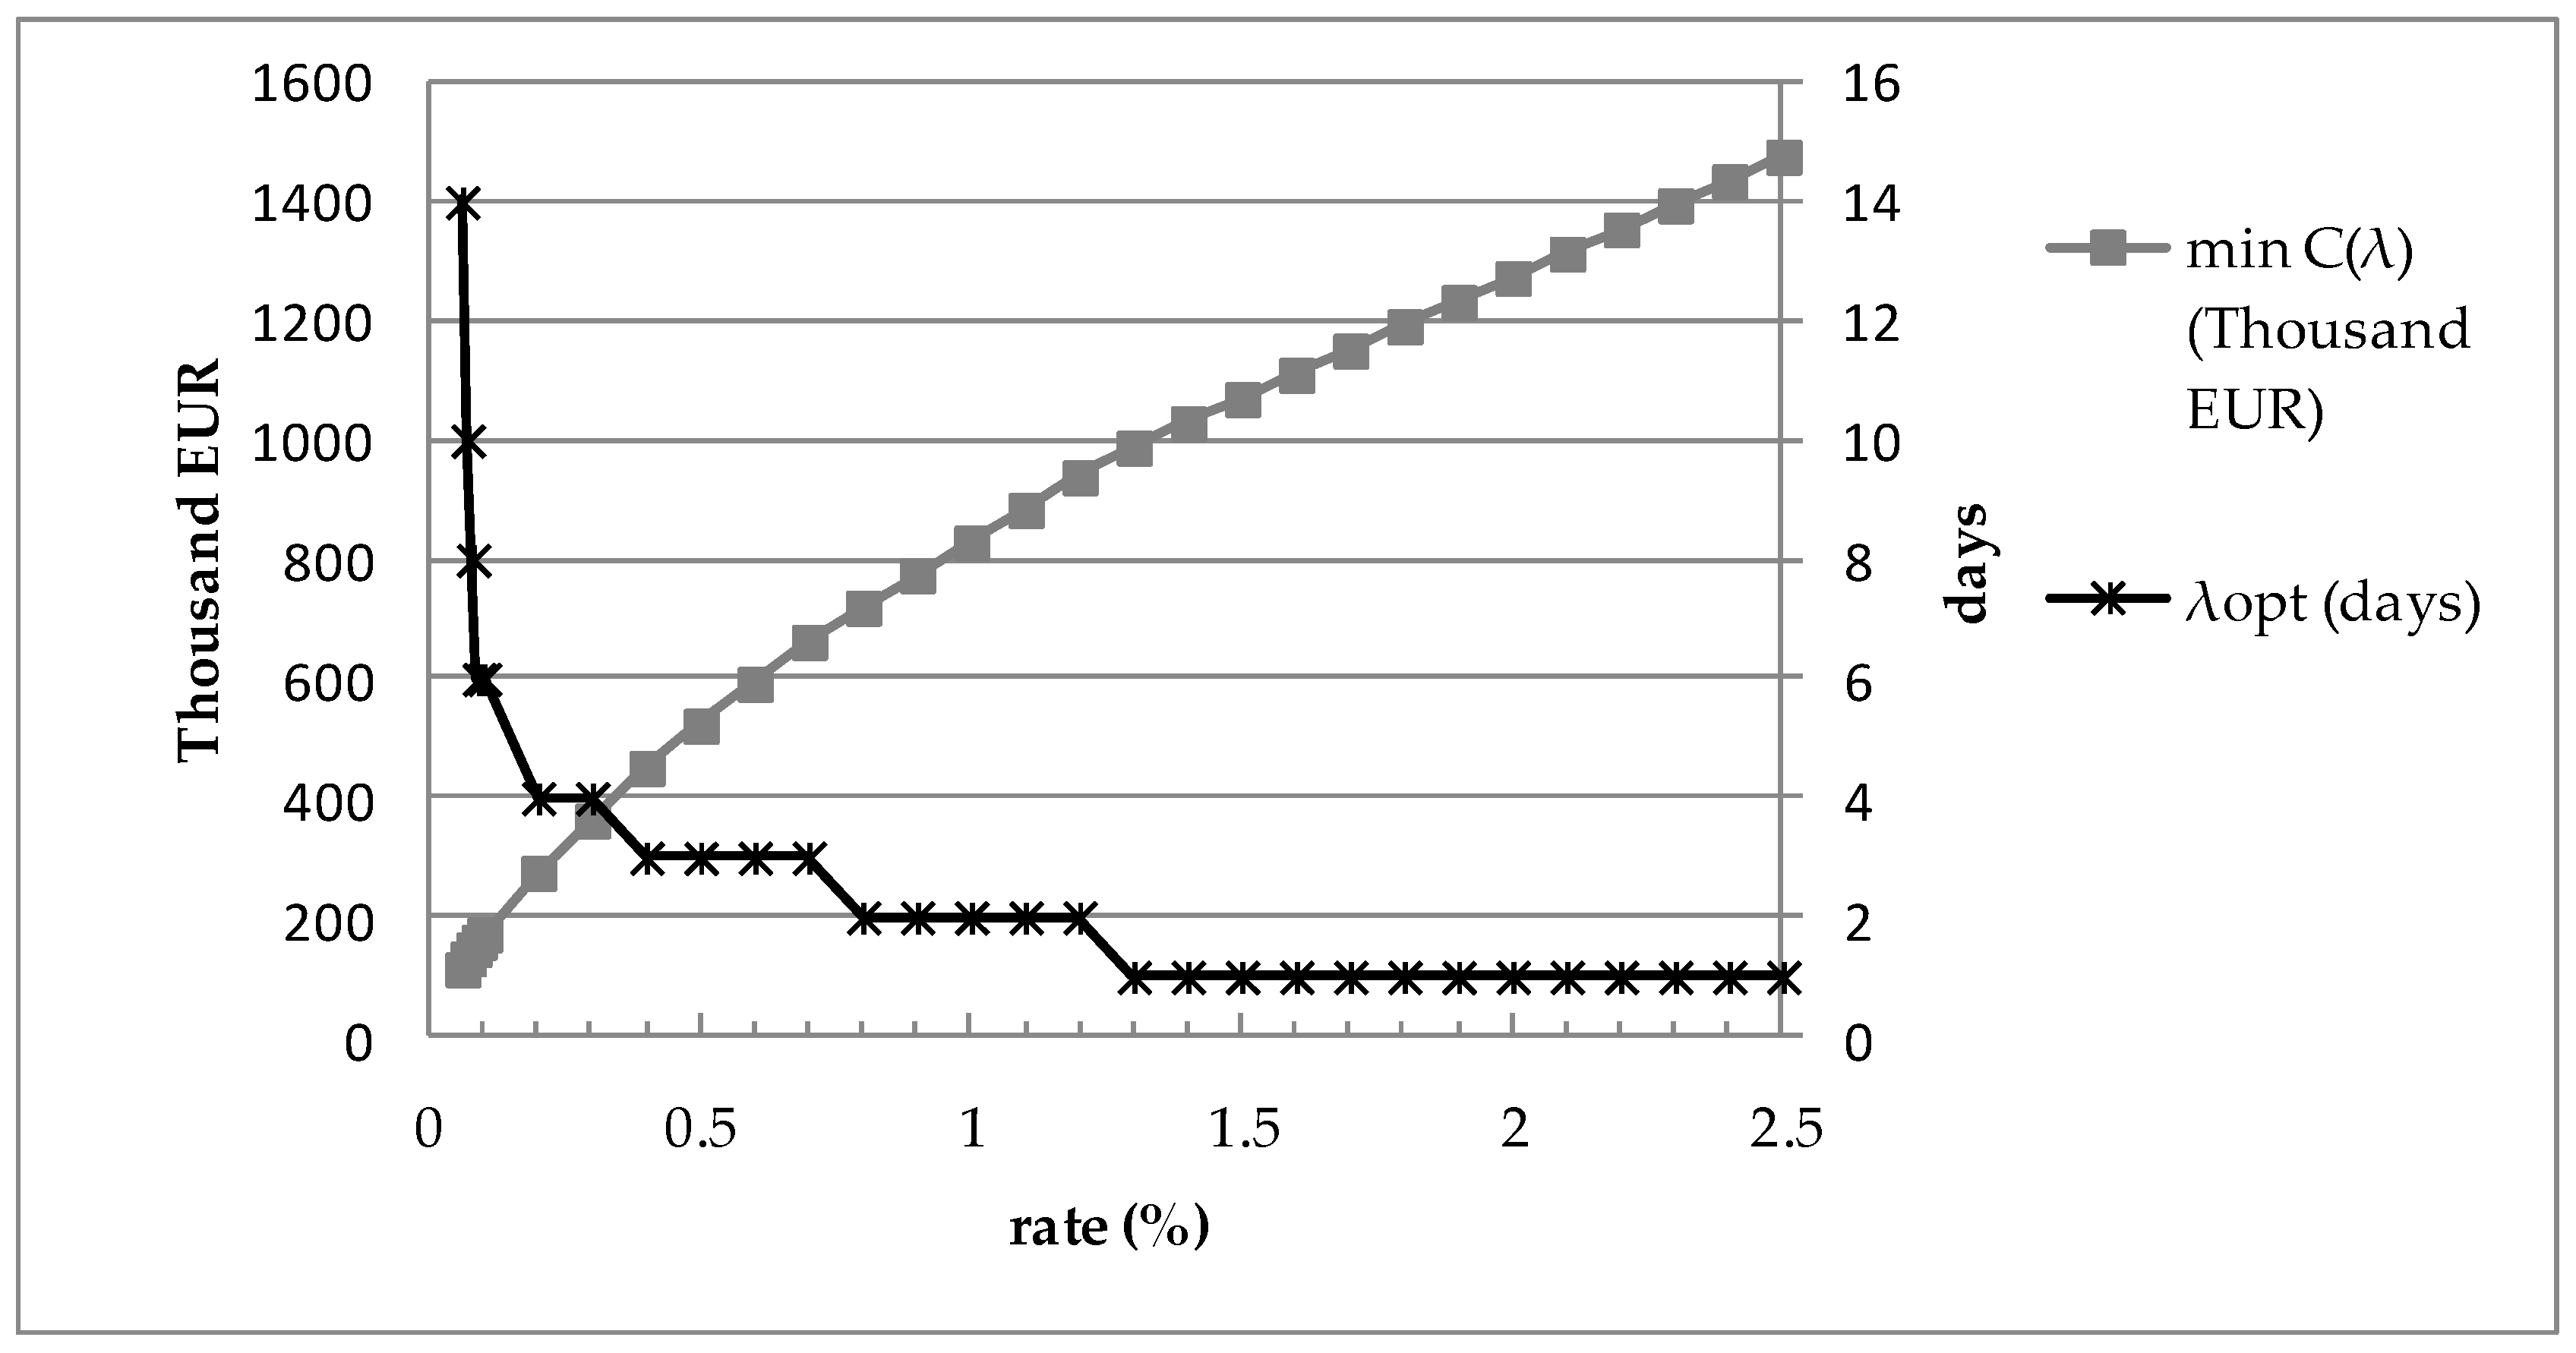
Figure 5 shows how the optimal lag (λ) and the total cost C(λ) (penalties plus cost of schedule compression measures) depend on the penalty rate. Please note that the penalty per unit of time is calculated as a percentage (i.e., penalty rate defined in the contract) of the value assigned to a process.

4. Discussion

The results of the simulation experiment made it possible to determine the optimal value of lag λ between the occurrence of a delay and the moment of implementing the duration compression measures.
For both cases analyzed in the example, this lag was the same (two days). Let us consider process four (roof cladding): its baseline start was scheduled for day 73 (s4 = 73). The expected value of its duration is t4 = 30 (baseline), and, if accelerated by switching to the first option, t41 = 28. Therefore, Δ 41 = 2 . If all predecessors of process four are completed by day 70 (earlier than scheduled in the baseline), so s 4 r = 70 , the process must start on day 73 anyway—because of the railway policy that rules this process. As Δ 41 + λ = 4 , if the actual start of process four happened between day 75 and 77: 75 s 4 r 77 , this process should be conducted according to the first option of duration compressing measures. If process four was observed to start later than on day 77 ( s 4 r > 77 ), switching to the second option of duration compressing measures was advised.
Oddly enough, a lower total cost C(λ) was obtainable by introducing more expensive duration reduction measures from the second group of options: C(λ) = 828,882.84 EUR in case III, whereas C(λ) = 946,833.96 EUR in case II. However, this fact is attributable to the possibilities of stronger compression offered in case III—stronger compression means a reduction in delay penalties (Cp). The expected values of duration compression measures (Cw) proved similar: (case II—276,897 EUR, case III—282,029 EUR).
The results of the sensitivity analysis of the optimal lag to changes in penalty rate (Figure 5) indicate that the lower the penalty rates, the less stable the optimal solutions. Thus, even a small change in the contract regarding the penalty rate, may call for repeating the optimization procedure. A smaller penalty rate gives the construction manager more time to implement the schedule compression measures.
The results can be compared with the effects of actions taken intuitively by construction managers. In practice, to avoid contractual penalties, these actions are undertaken each time a delay occurs, and implemented immediately. Such actions are consistent with the proposed approach with λ = 0. The total cost corresponding to such a rule is 1,056,214.98 EUR for case II and 1,045,415.87 EUR for case III. Therefore, the application of the proposed method enables a reduction in the cost and financial penalties on average by 109,381.02 EUR (case II) and 216,533.03 EUR (case III).

5. Conclusions

The performance of construction projects depends largely on the efficiency of the operative management and decisions taken in the course of the project. The proposed method was intended to support decisions at the stage of designing the implementation of construction projects. It helps assess the chances of meeting the project due date and considers the effects of corrective measures (working overtime, hiring additional resources, etc.) in terms of both cost and time.
The proposed approach is innovative: the existing methods of reactive scheduling respond to schedule disturbances by relocating resources and rescheduling the processes that have not started yet—in a way that minimizes the weighted sum of the differences between the updated and the baseline process starts [43]. The authors found only one study [45] that, in addition to the above, considers the problem of selecting the process acceleration measures.
The authors assume that, due to risk, the process durations can be modeled as random values. In contrast to other approaches, the aim is not to build an optimized schedule after each disturbance. Instead, an optimal decision rule to pick the schedule acceleration measures is desirable. It is therefore not necessary to carry out an optimization procedure every time a disruption occurs. The quality of the decision rule is evaluated in the course of the simulations: its outcomes are assessed based on the distribution of results obtained in many simulation runs. Therefore, as the assumptions are different, the results obtained using the proposed method are not directly comparable with the results generated employing the methods proposed in the literature.
The proposed method is intuitive. It does not involve complex optimization calculus which the site engineers might be not familiar with. The simulation model needs to be developed only once, and the simulation tests are repeated only when the parameters of the model are changed—the lag time. They can be performed using practically any simulation package available on the market. The data for the model are obtained based on expert opinions, as in PERT, which is widely established in the construction industry.
Construction activity is considered particularly exposed to risk and uncertainty. Nevertheless, assumptions of full knowledge of work organization parameters and on the influence of disturbing factors are frequently made by construction schedulers. The reason may be the availability of software that supports only deterministic planning, or a natural human preference for exact numbers that define project dates. However, deterministic schedules tend to expire. The approach of subsequent updates in reaction to changes (incremental design strategy) is usually less efficient than the strategy of searching for an optimal solution in given conditions (proactive approach), yet it is commonly used in practice. Therefore, the direction of further research is to develop pro-active scheduling methods that account for the possibility to switch from one mode of operation to some other, selected out of a set of options differing in duration, cost, and even resources.

Author Contributions

Conceptualization, methodology, P.J. and S.B.; description of the problem, P.J.; simulation model programming, S.B.; validation, P.J. and S.B.; simulation experiments, S.B.; formal analysis, P.J. and S.B.; data collection, S.B.; writing—original draft preparation, writing—review and editing, P.J. and S.B. Both authors have read and agreed to the published version of the manuscript.

Funding

This research was financially supported by the Ministry of Science and Higher Education in Poland within the statutory research number FN/63.

Conflicts of Interest

The authors declare no conflict of interest.

References

  1. Majid, M.Z.A.; McCaffer, R. Factors on non-excusable delays that influence contractors’ performance. J. Manag. Eng. 1998, 14, 42–49. [Google Scholar] [CrossRef]
  2. Skorupka, D. Identification and Initial Risk Assessment of Construction Projects in Poland. J. Manag. Eng. 2008, 24, 120–127. [Google Scholar] [CrossRef]
  3. Flanagan, R.; Norman, G. Risk Management and Construction; Blackwell Publishing: Oxford, UK, 1993. [Google Scholar]
  4. Zou, P.X.; Zhang, G.; Wang, J. Understanding the key risks in construction projects in China. Int. J. Proj. Manag. 2007, 25, 601–614. [Google Scholar] [CrossRef]
  5. Ibadov, N.; Kulejewski, J. Construction projects planning using network model with the fuzzy decision node. Int. J. Environ. Sci. Technol. 2019, 16, 4347–4354. [Google Scholar] [CrossRef] [Green Version]
  6. Edwards, P.J.; Bowen, P.A. Risk and risk management in construction projects: Concepts, terms and risk categories re-defined. J. Constr. Procure. 2000, 5, 42–57. [Google Scholar]
  7. Golenko-Ginzburg, D. Stochastic Network Models in Innovative Projecting; Science Book Publishing House: Voronezh, Russia, 2011. [Google Scholar]
  8. Mohan, S.; Gopalakrishnan, M.; Balasubramanian, H.; Chandrashekar, A. A lognormal approximation of activity duration in PERT using two time estimates. J. Oper. Res. Soc. 2007, 58, 827–831. [Google Scholar] [CrossRef]
  9. McCombs, E.L.; Elam, M.E.; Pratt, D.B. Estimating Task Duration in PERT using the Weibull Probability Distribution. J. Mod. Appl. Stat. Methods 2009, 8, 282–288. [Google Scholar] [CrossRef] [Green Version]
  10. Dawood, N. Estimating project and activity duration: A risk management approach using network analysis. Constr. Manag. Econ. 1998, 16, 41–48. [Google Scholar] [CrossRef]
  11. Johnson, D. The triangular distribution as a proxy for the beta distribution in risk analysis. J. R. Stat. Soc. Ser. D Stat. 1997, 46, 387–398. [Google Scholar] [CrossRef]
  12. Williams, T.M. Practical use of distributions in network analysis. J. Oper. Res. Soc. 1992, 43, 265–270. [Google Scholar] [CrossRef]
  13. Kotz, S.; Van Dorp, J.R. Beyond Beta—Other Continuous Families of Distributions with Bounded Support and Applications; World Scientific Pub Co Pte Ltd.: Singapore, 2004. [Google Scholar]
  14. Vose, D. Risk Analysis: A Quantitative Guide; John Wiley and Sons Inc.: Hoboken, NJ, USA, 2008. [Google Scholar]
  15. Abourizk, S.; Wales, R. Combined Discrete-Event/Continuous Simulation for Project Planning. J. Constr. Eng. Manag. 1997, 123, 11–20. [Google Scholar] [CrossRef]
  16. Lee, H.-S.; Shin, J.-W.; Park, M.; Ryu, H.-G. Probabilistic Duration Estimation Model for High-Rise Structural Work. J. Constr. Eng. Manag. 2009, 135, 1289–1298. [Google Scholar] [CrossRef] [Green Version]
  17. Shahin, A.; Abourizk, S.; Mohamed, Y.; Fernando, S. Simulation modeling of weather-sensitive tunnelling construction activities subject to cold weather. Can. J. Civ. Eng. 2014, 41, 48–55. [Google Scholar] [CrossRef]
  18. Lu, M.; Abourizk, S. Simplified CPM/PERT Simulation Model. J. Constr. Eng. Manag. 2000, 126, 219–226. [Google Scholar] [CrossRef]
  19. Shi, J.J. Activity-Based Construction (ABC) Modeling and Simulation Method. J. Constr. Eng. Manag. 1999, 125, 354–360. [Google Scholar] [CrossRef]
  20. Lee, D.-E.; Bae, T.-H.; Arditi, D. Advanced Stochastic Schedule Simulation System. Civ. Eng. Environ. Syst. 2011, 29, 1–18. [Google Scholar] [CrossRef]
  21. Sadeghi, N.; Fayek, A.R.; Ingolfsson, A. Simulation-Based Approach for Estimating Project Completion Time of Stochastic Resource–Constrained Project Networks. J. Comput. Civ. Eng. 2012, 26, 558–560. [Google Scholar] [CrossRef]
  22. Lee, D.-E. Probability of Project Completion Using Stochastic Project Scheduling Simulation. J. Constr. Eng. Manag. 2005, 131, 310–318. [Google Scholar] [CrossRef]
  23. Aziz, R.F. RPERT: Repetitive-Projects Evaluation and Review Technique. Alex. Eng. J. 2014, 53, 81–93. [Google Scholar] [CrossRef] [Green Version]
  24. Jaskowski, P.; Biruk, S. The method for improving stability of construction project schedules through buffer allocation/statybos vykdymo grafiko stabilumo užtikrinimas paskirstant laiko rezervus. Technol. Econ. Dev. Econ. 2011, 17, 429–444. [Google Scholar] [CrossRef]
  25. Leu, S.-S.; Hung, T.-H. An optimal construction resource leveling scheduling simulation model. Can. J. Civ. Eng. 2002, 29, 267–275. [Google Scholar] [CrossRef]
  26. Biruk, S.; Rzepecki, Ł. Simulation model for resource-constrained construction project. Open Eng. 2019, 9, 211–217. [Google Scholar] [CrossRef]
  27. Gupta, D.; Maravelias, C.T. On the design of online production scheduling algorithms. Comput. Chem. Eng. 2019, 129, 106517. [Google Scholar] [CrossRef]
  28. Gupta, D.; Maravelias, C.T. Framework for studying online production scheduling under endogenous uncertainty. Comput. Chem. Eng. 2020, 135, 106670. [Google Scholar] [CrossRef]
  29. Van De Vonder, S.; Demeulemeester, E.; Herroelen, W. Proactive heuristic procedures for robust project scheduling: An experimental analysis. Eur. J. Oper. Res. 2008, 189, 723–733. [Google Scholar] [CrossRef]
  30. Balouka, N.; Cohen, I. A robust optimization approach for the multi-mode resource-constrained project scheduling problem. Eur. J. Oper. Res. 2019. [CrossRef]
  31. Moonseo, P.; Feniosky, P.-M. Reliability buffering for construction projects. J. Constr. Eng. Manag. 2004, 130, 626–637. [Google Scholar]
  32. Herroelen, W.; Leus, R. The construction of stable project baseline schedules. Eur. J. Oper. Res. 2004, 156, 550–565. [Google Scholar] [CrossRef]
  33. Goldratt, E.M. Critical Chain; The North River Press: Great Barrington, MA, USA, 1997. [Google Scholar]
  34. Van De Vonder, S.; Demeulemeester, E.; Herroelen, W.; Leus, R. The use of buffers in project management: The trade-off between stability and makespan. Int. J. Prod. Econ. 2005, 97, 227–240. [Google Scholar] [CrossRef] [Green Version]
  35. Połoński, M.; Pruszyński, K. Impact of Baseline Terms on the Course of Critical Paths and Time Buffers in the Modified Goldratt’s Method. Arch. Civ. Eng. 2013, 59, 313–320. [Google Scholar] [CrossRef] [Green Version]
  36. Van De Vonder, S.; Demeulemeester, E.; Leus, R. The trade-off between stability and makespan in resource-constrained project scheduling. Int. J. Prod. Res. 2006, 44, 215–236. [Google Scholar] [CrossRef] [Green Version]
  37. Jaskowski, P. Methodology for enhancing reliability of predictive project schedules in construction. Ekspolatacja i Niezawodn. Maint. Reliab. 2015, 17, 470–479. [Google Scholar] [CrossRef]
  38. Rostami, S.; Creemers, S.; Leus, R. New strategies for stochastic resource-constrained project scheduling. J. Sched. 2018, 21, 349–365. [Google Scholar] [CrossRef]
  39. Suwa, H. A new when-to-schedule policy in online scheduling based on cumulative task delays. Int. J. Prod. Econ. 2007, 110, 175–186. [Google Scholar] [CrossRef]
  40. Chakrabortty, R.K.; Rahman, H.F.; Ryan, M.J. Efficient priority rules for project scheduling under dynamic environments: A heuristic approach. Comput. Ind. Eng. 2020, 140, 106287. [Google Scholar] [CrossRef]
  41. Wang, Y.; He, Z.; Kerkhove, L.-P.; Vanhoucke, M. On the performance of priority rules for the stochastic resource constrained multi-project scheduling problem. Comput. Ind. Eng. 2017, 114, 223–234. [Google Scholar] [CrossRef]
  42. Janczura, M.; Kuchta, D. Proactive and reactive scheduling in practice. Res. Pap. Wrocław Univ. Econ. 2011, 238, 34–51. [Google Scholar]
  43. Van De Vonder, S.; Ballestín, F.; Demeulemeester, E.; Herroelen, W. Heuristic procedures for reactive project scheduling. Comput. Ind. Eng. 2007, 52, 11–28. [Google Scholar] [CrossRef]
  44. Paslawski, J. Flexibility Approach in Construction Process Engineering/Lankstumas Statybos Proceso Inžinerijoje. Technol. Econ. Dev. Econ. 2008, 14, 518–530. [Google Scholar] [CrossRef] [Green Version]
  45. Deblaere, F.; Demeulemeester, E.; Herroelen, W. Reactive scheduling in the multi-mode RCPSP. Comput. Oper. Res. 2011, 38, 63–74. [Google Scholar] [CrossRef]
  46. Yang, K.-K. A comparison of dispatching rules for executing a resource-constrained project with estimated activity durations. Omega 1998, 26, 729–738. [Google Scholar] [CrossRef]
  47. Law, A.; Kelton, W.D. Simulation Modeling and Analysis, 3rd ed.; McGraw-Hill Education: Boston, MA, USA, 2000. [Google Scholar]
  48. Miłosz, M.; Pastuszak, Z.; Miłosz, E. Decision-making simulation games as a tool for verifying enterprise logistic strategies. In Proceedings of the INTED2015: 9th International Technology, Education and Development Conference, Madrid, Spain, 2–4 March 2015; pp. 3558–3567. [Google Scholar]
  49. Elmaghraby, S.E. On criticality and sensitivity in activity networks. Eur. J. Oper. Res. 2000, 127, 220–238. [Google Scholar] [CrossRef]
  50. Demeulemeester, E.L.; Herroelen, W.S. Project Scheduling, A Research Handbook; Kluwer Academic Publishers: Boston, MA, USA, 2002. [Google Scholar]
Figure 1. Project network (example).
Applsci 10 08028 g001
Figure 2. Baseline schedule (example).
Applsci 10 08028 g002
Figure 3. Relationship between the value of the lag (λ) for introducing duration compression measures and the expected value of the total cost of delays (Cd) and time reduction measures (Cw) for case II.
Applsci 10 08028 g003
Figure 4. Relationship between the value of the lag (λ) for introducing duration compression measures and the expected value of the total cost of delays (Cd) and time reduction measures (Cw) for case III.
Applsci 10 08028 g004
Figure 5. Effect of penalty rate on the optimal lag (λ) and the total cost of delays and duration compression measures for case III.
Applsci 10 08028 g005
Table 1. List of processes and their parameters.
iProcess NameMinimal Duration (Days)Maximal Duration (Days)Mode (Days)Expected Value (Days)Cost (EUR)
taitbitmitici
1Earthworks51368200,000
2Frame3348394024,000,000
3Roof (structure)19322425140,000
4Roof (cladding)20373330175,000
5Facade42624951165,000
6External works39494444125,000
7Partitions19322425340,000
8Systems20263226600,000
9Plastering14272221170,000
10Screeds21352828320,000
11Decoration21312626230,000
12Floors1626182080,000
13Joinery26332829500,000
14Tests on completion11110
Table 2. Parameters of the first group of options of process duration compression measures.
iProcess NameMinimal Duration (Days)Maximal Duration (Days)Mode (Days)Expected Value (Days)Cost (EUR)
tai1tbi1tmi1ti1ci1
2Frame3244353725,000,000
3Roof (structure)17272222150,000
4Roof (cladding)21362728185,000
5Facade39574848195,000
6External works36433839160,000
7Partitions16292122355,000
8Systems20242824720,000
9Plastering12252019180,000
10Screeds21332426340,000
11Decoration19292424250,000
12Floors1424161895,000
13Joinery24312627620,000
Table 3. Parameters of the second group of options of process duration compression measures.
iProcess NameMinimal Duration (Days)Maximal Duration (Days)Mode (Days)Expected Value (Days)Cost (EUR)
tai2tbi2tmi2ti2ci2
2Frame3039333426,500,000
3Roof (structure)16212019165,000
4Roof (cladding)16302022200,000
5Facade36513942220,000
6External works31403736180,000
7Partitions15252020380,000
8Systems15222621900,000
9Plastering10231516200,000
10Screeds17282122355,000
11Decoration17252121285,000
12Floors12201616100,000
13Joinery20292324705,000
Table 4. Expected values of delayed start dates of processes.
Caseλ E ( s 4 73 ) E ( s 5 104 ) E ( s 6 155 ) E ( s 7 50 ) E ( s 8 77 ) E ( s 13 124 ) E ( s 15 200 )
I02.01702.47673.59120.80640.87054.18046.8009
II00.57441.19261.78920.30750.5671.64921.5647
10.80671.30931.96070.42250.62241.8991.9133
21.08121.47992.18090.55150.69382.24332.3916
31.35511.68132.43900.67280.75932.63592.9381
41.59621.88852.70900.76560.81863.03733.5479
61.86472.19443.11130.80640.8663.62834.6561
81.97582.36923.35770.80640.87053.92995.5422
102.01262.45073.49870.80640.87054.07876.1302
122.01702.46953.55820.80640.87054.14326.4640
142.01702.47523.58130.80640.87054.16786.6369
III00.39961.08071.52310.25310.56110.78771.0931
10.63931.16811.76510.40230.61831.16841.4434
20.94191.31282.03230.55150.69341.65521.9456
31.25211.50422.30740.67280.75932.1812.5129
41.52391.72652.57480.76560.81852.68713.1614
61.84802.08093.00180.80640.8663.42794.3833
81.97472.32553.30290.80640.87053.82765.3736
102.01262.42963.47050.80640.87054.03356.0459
122.01702.46473.55010.80640.87054.12666.4243
142.01702.47523.57890.80640.87054.16356.6190
Publisher’s Note: MDPI stays neutral with regard to jurisdictional claims in published maps and institutional affiliations.