Article

Hybridization of the Stockwell Transform and Wigner Distribution Function to Design a Transmission Line Protection Scheme

1
Department of Electrical Engineering, Suresh Gyan Vihar University, Jaipur-302017, India
2
Power System Planning Division, Rajasthan Rajya Vidyut Prasaran Nigam Ltd., Jaipur-302005, India
3
Department of Electrical and Computer Engineering, Hawassa University, Hawassa 05, Ethiopia
4
Department of Electrical Power Engineering, Tishreen University, Lattakia 2230, Syria
5
Department of Management & Innovation Systems, University of Salerno, 84084 Fisciano, Italy
*
Authors to whom correspondence should be addressed.
Appl. Sci. 2020, 10(22), 7985; https://doi.org/10.3390/app10227985
Submission received: 16 October 2020 / Revised: 6 November 2020 / Accepted: 9 November 2020 / Published: 11 November 2020

Abstract

:
The complexity of power system networks is increasing continuously due to the addition of high capacity transmission lines. Faults on these lines may deteriorate the power flow pattern in the network. This can be avoided by the use of effective protection schemes. This paper presents an algorithm for detecting and classifying faults on the transmission network. Fault detection is achieved by utilizing the fault index, which depends on a combination of characteristics extracted from the current signal by the application of the Stockwell transform and Wigner distribution function (WDF). Various faults are categorized using the quantity of phases with a faulty nature. The fault events like phase to-ground (L-G), two phases (LL), two phases to-ground (LL-G), and three phases to-ground (LLL-G) are investigated in this study. The performance of the algorithm designed for the protection scheme is tested for the variations in the impedance during the fault event, variations in the angle of the fault incidence, different fault locations, the condition of the power flow in the reverse direction, the availability of noise, and the fault on the hybrid line consisting of two sections of underground cable and the overhead line. The algorithm is also analyzed for discriminating switching incidents from fault cases. A comparative study is used to establish the superiority of the proposed technique as compared to the Wavelet transform (WT) based protection scheme. The performance of the protection technique is established in MATLAB/Simulink software using a test network of the transmission line with two terminals.

1. Introduction

An important and critical element of the power network is the transmission line. It transfers power in a bulk quantity from generation plants to grid substations (GSS), which are located near the load centers. These power lines cross the geographical areas of different climatic conditions [1]. Hence, there is the maximum probability of fault occurrence on transmission lines in comparison to the rest of the elements of the power system network. Fault incident on the transmission line causes long-term power outages. This may also cause harmful effects on the connected consumer equipment [2]. Hence, protective relays must detect fault events immediately, isolate the fault section of the line, and perform classification to identify the nature of the fault. Articles have been reported on many algorithms, which focused on detecting fault conditions incident on power transmission lines and the identification of the fault phase, as well as the nature of the fault. However, many of these algorithms are complex in nature and involve the measurement of data on both terminals of the line, resulting in the additional requirement of the Global Positioning System (GPS) and medium for communication [3,4,5,6]. In [7], the authors presented a method for the identification and classification of faults incident on transmission lines using the convolutional sparse auto-encoder (CSAE). This method automatically identifies the features from the dataset, which are obtained with the help of the signals of the voltage and current and utilized for fault recognition. The mapping of features is achieved with the help of local translation invariance for the channel signal segments over the period of half a cycle. An algorithm using voltage and current based features, extracted using the Stockwell transform (S-transform) for identification and classifying faults on the power system, is available from [8]. A scheme using wavelet packet transform (WPT) for the estimation of the fault section and phase on a multi-terminal transmission line was discussed in [9]. An algorithm depending on hybrid features evaluated using the Wigner distribution function (WDF) and the alienation coefficient was applied for the protection of the power transmission line (PTL) [10] of a utility network with solar energy penetration [11] and a hybrid grid with wind and solar energy penetration [12]. This method has the merits of the fast recognition of faults for a time period of less than a quarter cycle. A method to estimate fault direction using the positive sequence voltage and current was presented in [13]. In [14], the authors presented a digital relaying scheme depending on the entropy principle, as well as the fast discrete orthogonal S-transform (FDOST) for the identification, classification, and localization of faults on the PTL. This algorithm seems to be independent of the fault conditions, the incidence angle of the fault, and the resistance during the fault event and quickly and accurately detects the type of fault. An algorithm using current based feature extraction by the discrete WT and rule dependent decision tree for identifying and classifying faults on the transmission line was presented in [15,16]. However, it is affected by the existence of noise. Approaches based on the features of the voltage and current signals computed using the Stockwell transform (ST) and Hilbert transform (HT) for the estimation of fault conditions for a distribution feeder were reported in [17,18,19].
Therefore, based on the review of the literature discussed in the above paragraph, it was established that the development of techniques that are less complex eliminates the use of communication channels, and the GPS system is necessary to provide the protection to the transmission lines. Hence, the main contributions of the manuscript are as follows:
  • An algorithm, which is supported by the S-transform and Wigner distribution function to provide protection to the transmission line and which is effective at eliminating the requirement of GPS and the communication system, is introduced in this paper.
  • The developed algorithm is less complex and effective at identifying and classifying faults on the transmission line within the duration of a quarter cycle.
  • This algorithm accurately recognizes the faults using the measurement of the current signal at a single end of the transmission line.
This paper is divided into nine sections. Section 2 presents the modified test system of the double end transmission line. Section 3 details the proposed fault identification and classifying technique. Implementation steps of the technique to detect faults are illustrated in Section 4. The implementation steps of the algorithm for the classification of faults are illustrated in Section 5. Different event studies are presented in Section 6. Section 7 describes the results pertaining to switching events, which help to discriminate these events from faults. A study for the comparison of the performance of the proposed protection algorithm with the work already reported in literature is presented in Section 8, followed by the conclusion in Section 9.

2. Modified Case Study System

The double end transmission link model as described in Figure 1 is utilized to implement the developed technique. The transmission link is connected between Buses 1 and 2. Sources 1 and 2 represent the large area utility grids. Buses 1 and 2 are considered as the sending and receiving end buses, respectively. Table 1 presents the various system parameters utilized in this study [3]. The proposed technique can be incorporated into the relay, which is located on the side of Bus 1 of the transmission link to trip the link at the moment of fault incidence. The developed technique can be implemented at the sending terminal of the transmission line. However, for the ring main feeders, it can be utilized at both terminals. The recoded current signals are processed by utilizing the developed technique to generate the trip command signal to the circuit breaker for the outage of the transmission line during the fault event.

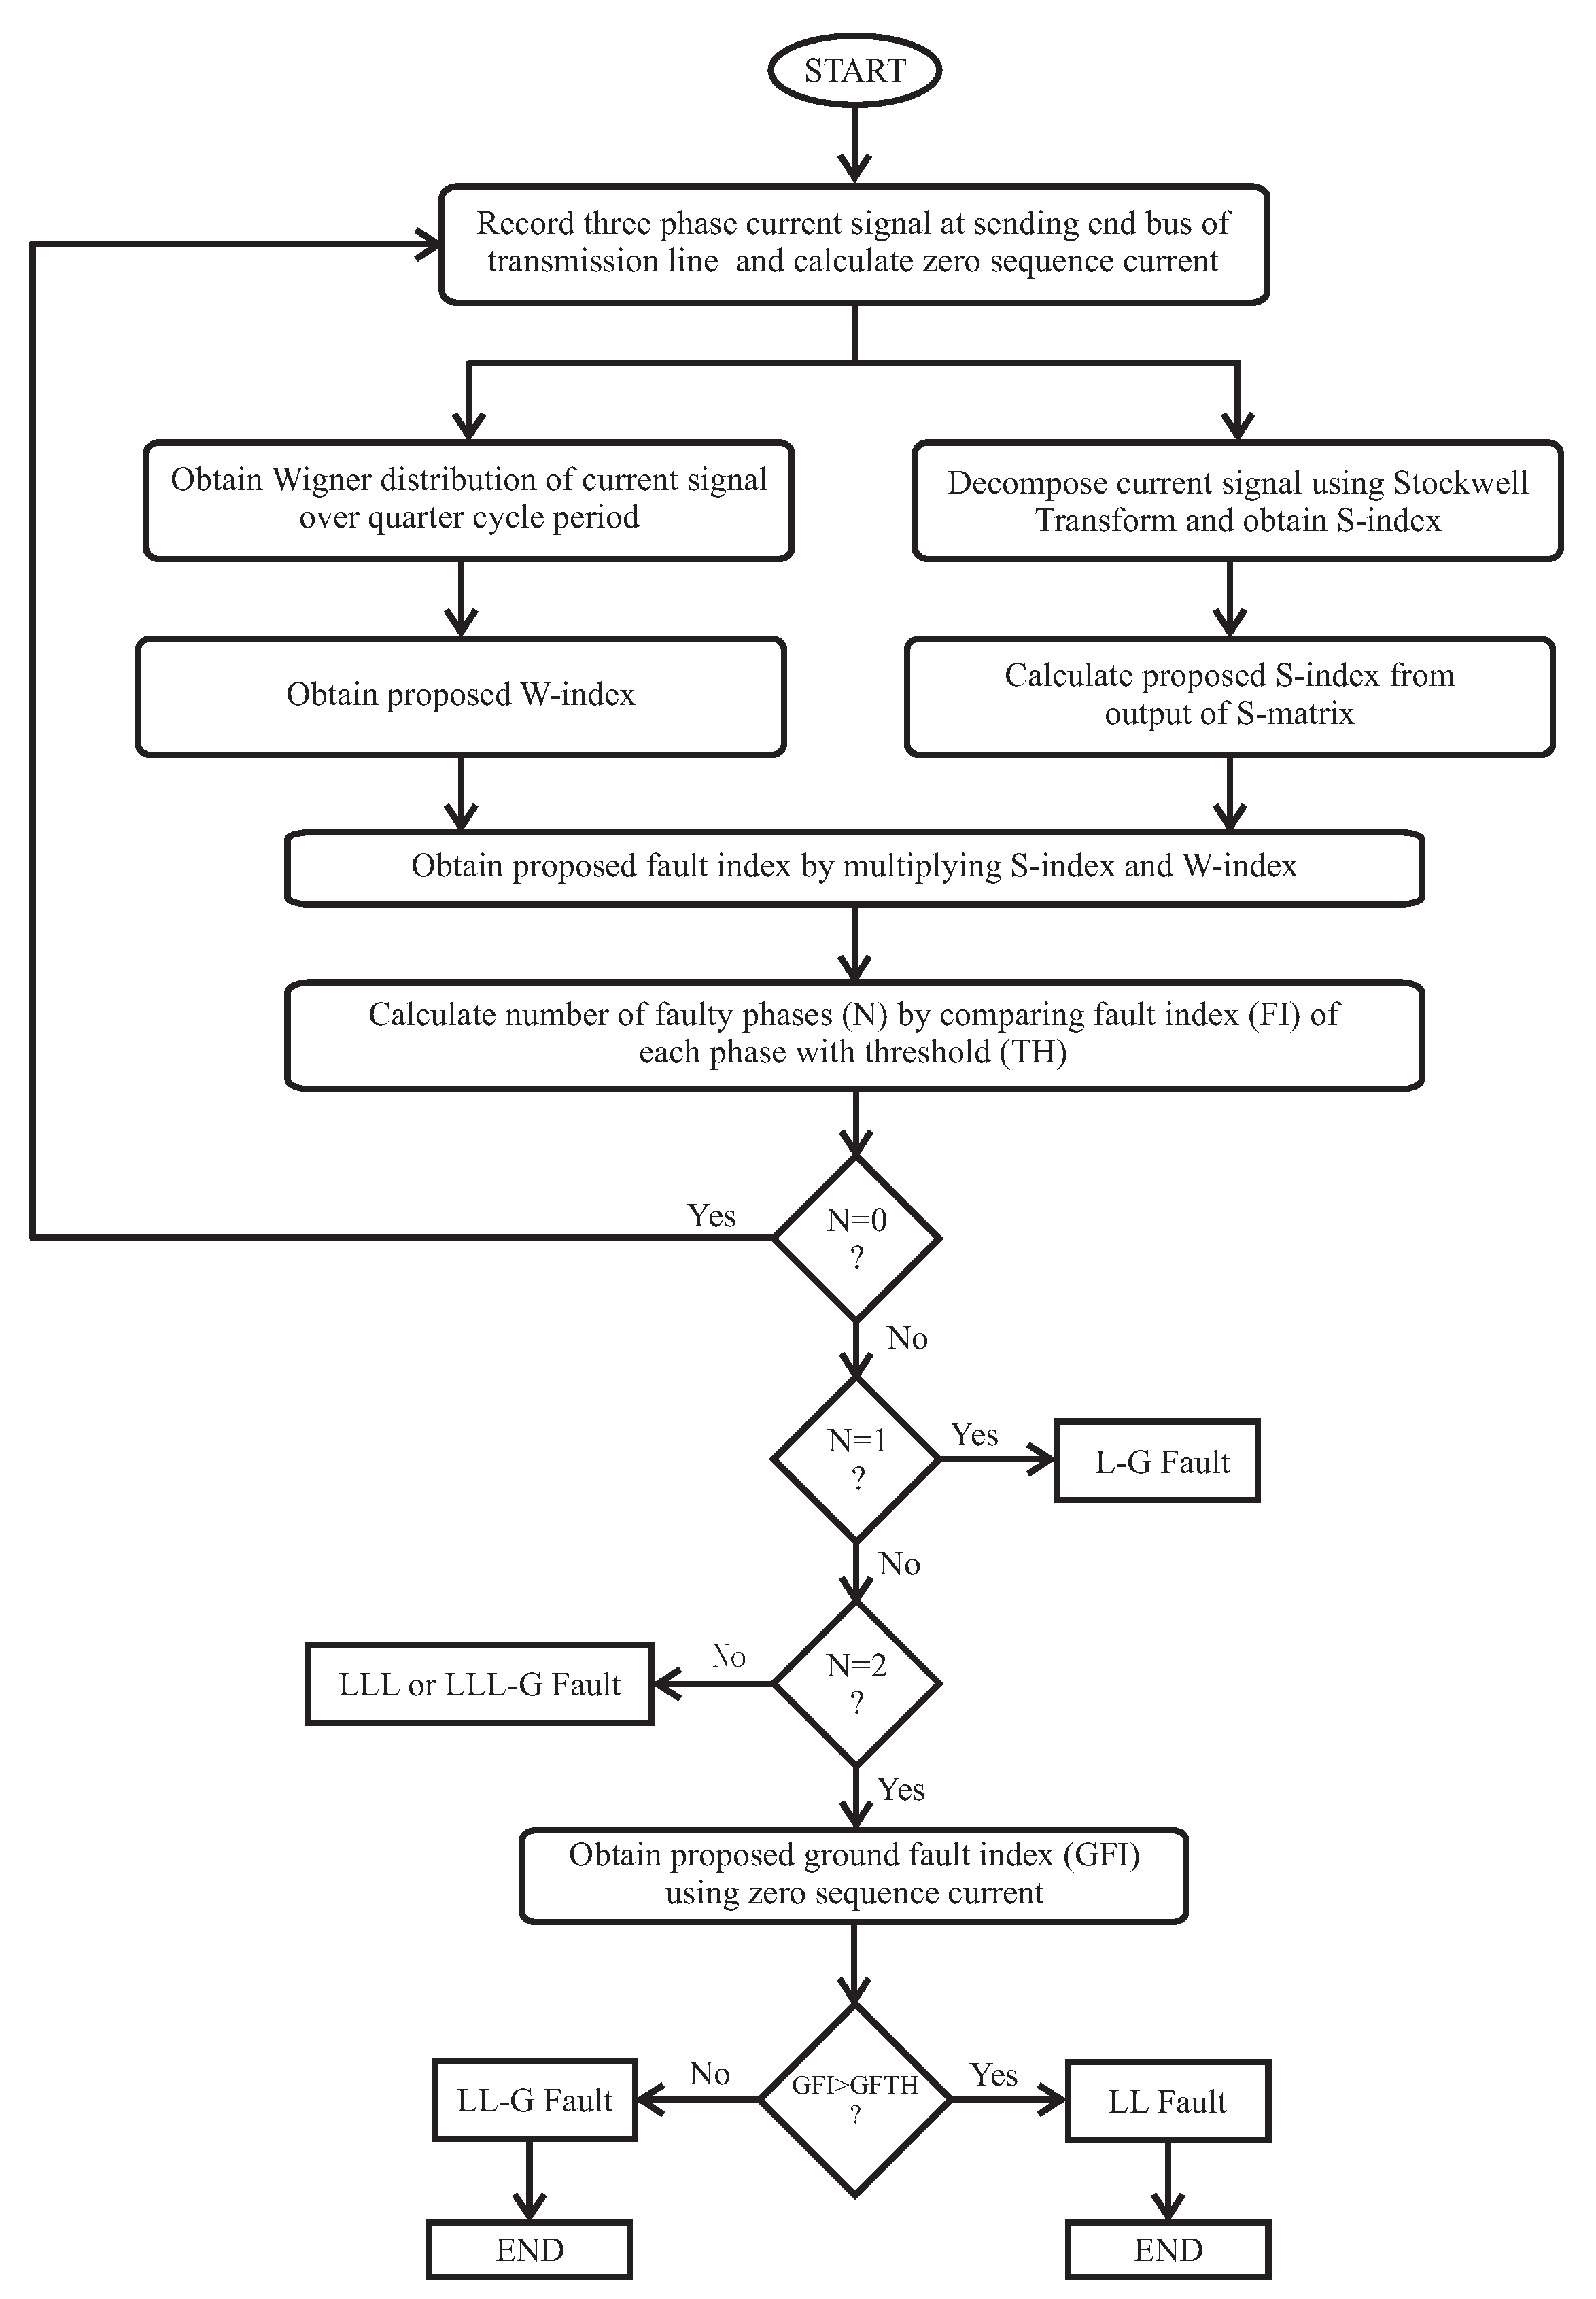
3. Proposed Fault Detection and Classification Algorithm

Three steps are utilized to implement the proposed technique for identifying and classifying fault events incident on the power transmission line. The first step involves the calculation of the S-index, whereas the W-index is obtained in the second step. The third step is related to the calculation of the fault index (FI) introduced in this study. These steps are illustrated in the subsections below.

3.1. S-Index

In the first step of the algorithm, the signal of the current is decomposed by the use of the S-transform to evaluate an output matrix. The sum absolute values (SAVs) are calculated from this matrix for a duration of a quarter cycle with the help of window moving at a step of one sample. The maximum values of the SAVs over a quarter cycle with the window over one sample are designated as the S-index. The discrete version of the S-transform for a discrete function h [ k T ] is given in the detailed relation below (let f n / N T and τ j T ) [20].
S j T , 0 = 1 N m = o N 1 H m N T
A complex N × M matrix, which is called the S-matrix, is evaluated as the output of the S-transform. Every row and column in this S-matrix indicates a definite frequency and time, respectively [21].

3.2. W-Index

The current signal is measured at the sending terminal of the transmission link during a fault event. The Wigner distribution of the samples over a quarter cycle is calculated with a moving window over one sample with a frequency of sampling of 3.84 kHz. The SAVs of the quarter cycle are calculated, and the maximum of these values over the quarter cycle window are recorded. The Wigner index (W-index) is represented by the maximum values of the Wigner distribution over the quarter cycle, moving with one sample. The decomposition of the current signals by utilizing the WDF provides the W-index. To estimate the fault, the WDF depends on the energy density of the current signals, which is available in the time frequency frame. Due to the utilization of the time domain current signal f ( t ) twice, it is also presented as a bilinear analysis. The advantage of this analysis is that a high time-frequency resolution and energy concentration can be obtained [22]. The following relation presents the W-index for the current signals f ( t ) [23].
W I = f ( t + τ 2 ) f * ( t + τ 2 ) e j ω τ d τ
where t represents the time variable (sliding), ω represents the signal frequency (angular), and τ represents the signal in the time domain.

3.3. Fault Index

The result computed by multiplying the W-index with the S-index is designated as the proposed fault index (FI).
F I = ( S i n d e x ) . ( W i n d e x )
A threshold (TH) value of 5 × 10 9 is selected for the FI to identify the fault phase or type of a fault. The values of the FI are compared with the TH; if the value of the FI for a phase is high compared to the TH, then the phase is a fault, else the phase is healthy in nature. In identifying the number of fault phases, the types of faults are identified. Further, the threshold is selected by testing the algorithm on 20 datasets of each fault obtained by changing the parameters such as the location of the fault on the transmission line, the fault incidence angle, the fault impedance, the reverse power flow, the presence of noise, the hybrid combination of the underground (UG) cable and overhead line, etc. Hence, the threshold (TH) value of 5 × 10 9 is effective to identify the types of faults and the fault phase during all operating scenarios of the power system.

3.4. Ground Fault Index

A ground fault index (GFI) is introduced to discriminate the LL fault with respect to the LL-G fault. This is evaluated in a similar way as the W-index and depends on the signal of the zero sequence current. The WDF of the signal with the current (zero sequence) is evaluated for a duration of a quarter cycle with a moving window over one sample with a frequency of sampling of 3.84 kHz. The SAVs of the quarter cycle are calculated, and the maximum values of these quantities over a quarter cycle window are recorded. The maximum values of the WDF over the quarter cycle moving with one sample are designated as the ground fault index (GFI). The threshold value (GFTH) of 4 × 10 10 is selected for the GFI to identify the involvement of the ground during the LL faults. A higher value of the GFI compared to the GFTH indicates that the ground is not involved in the LL fault, whereas a lower value of the GFI compared to the GFTH indicates that the ground is involved. Further, the GFTH is selected by testing the algorithm on the 20 datasets of the LL and LL-G faults obtained by changing the parameters such as the location of the fault on the transmission line, the fault incidence angle, the fault impedance, the reverse power flow, the presence of noise, the hybrid combination of the underground (UG) cable and overhead line, etc. Hence, the value of 4 × 10 10 for the GFTH is effective at identifying the involvement of the ground during the two phase faults.

3.5. Flowchart of the Proposed Technique

The developed approach for detecting and classifying the faults is illustrated with the aid of the flowchart given in Figure 2. The events of faults are detected by the maximum values of the FI compared with the threshold value. Various fault conditions are classified depending on the quantity of phases having a faulty nature. The LL and LL-G faults are differentiated by utilizing the GFI. The LL fault is detected if the amount of the GFI is higher than the ground fault threshold (GFTH), while the LL-G is sensed when the GFI is lower than the threshold.

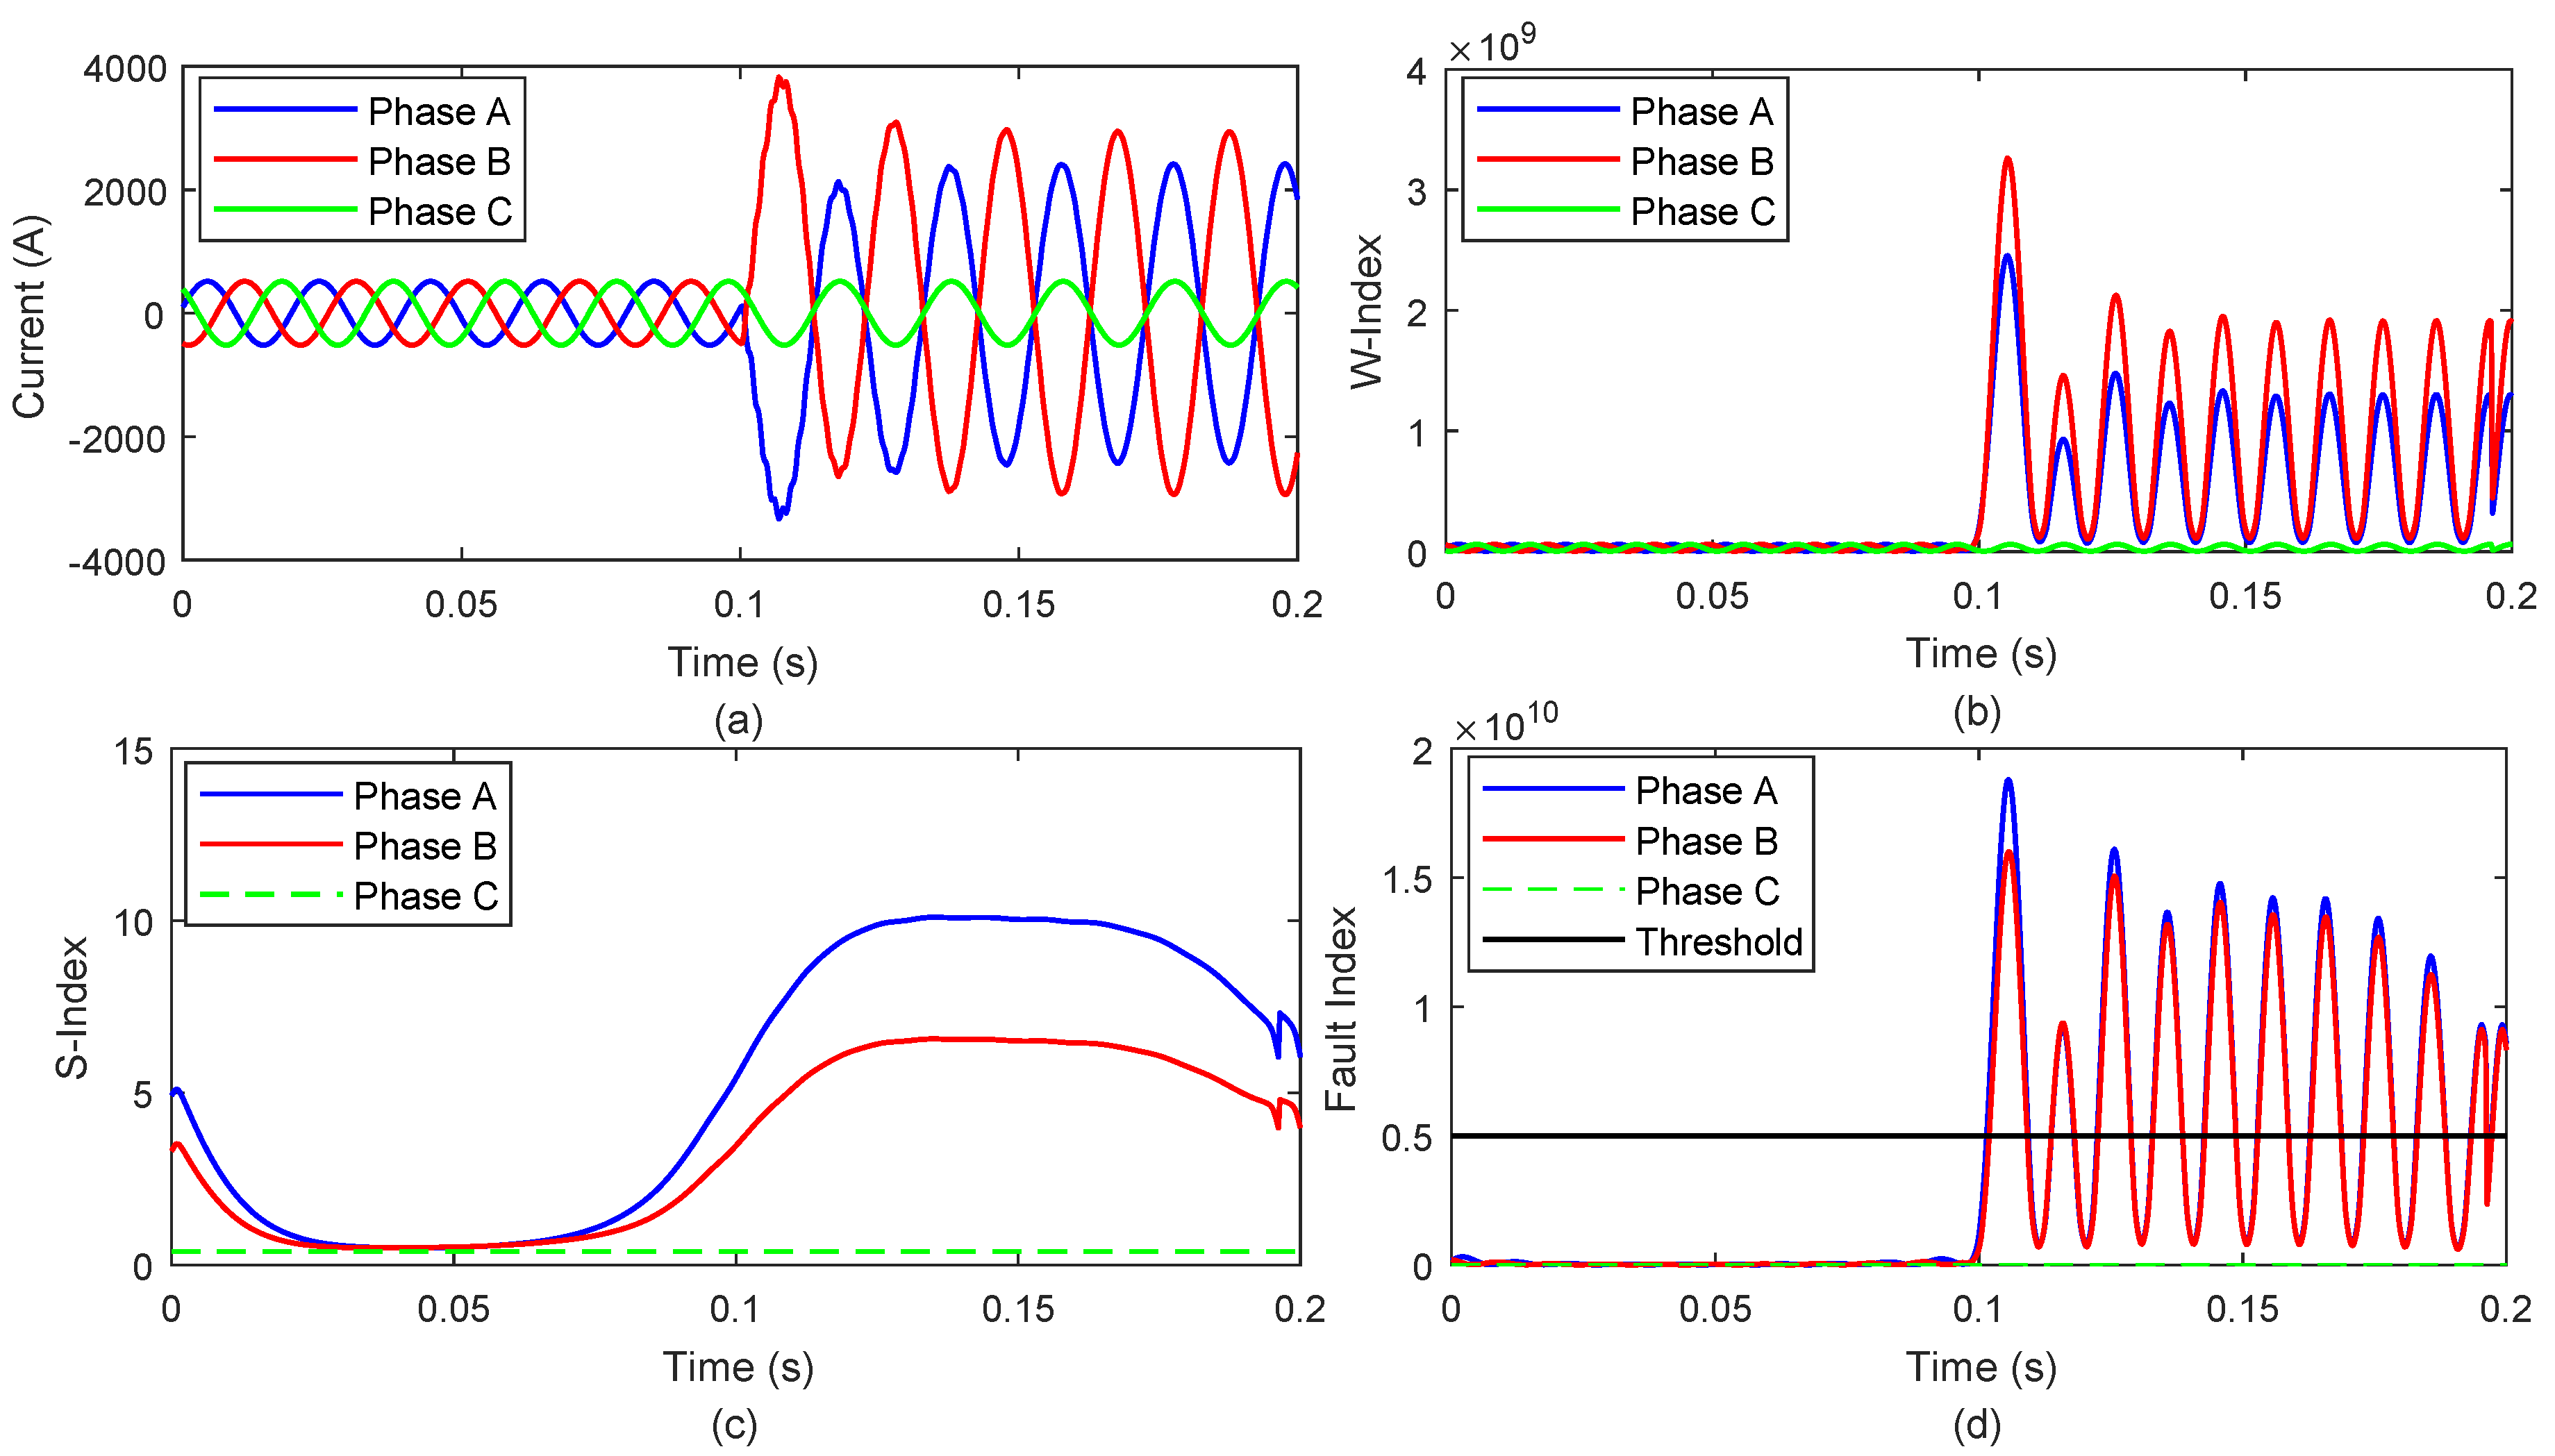
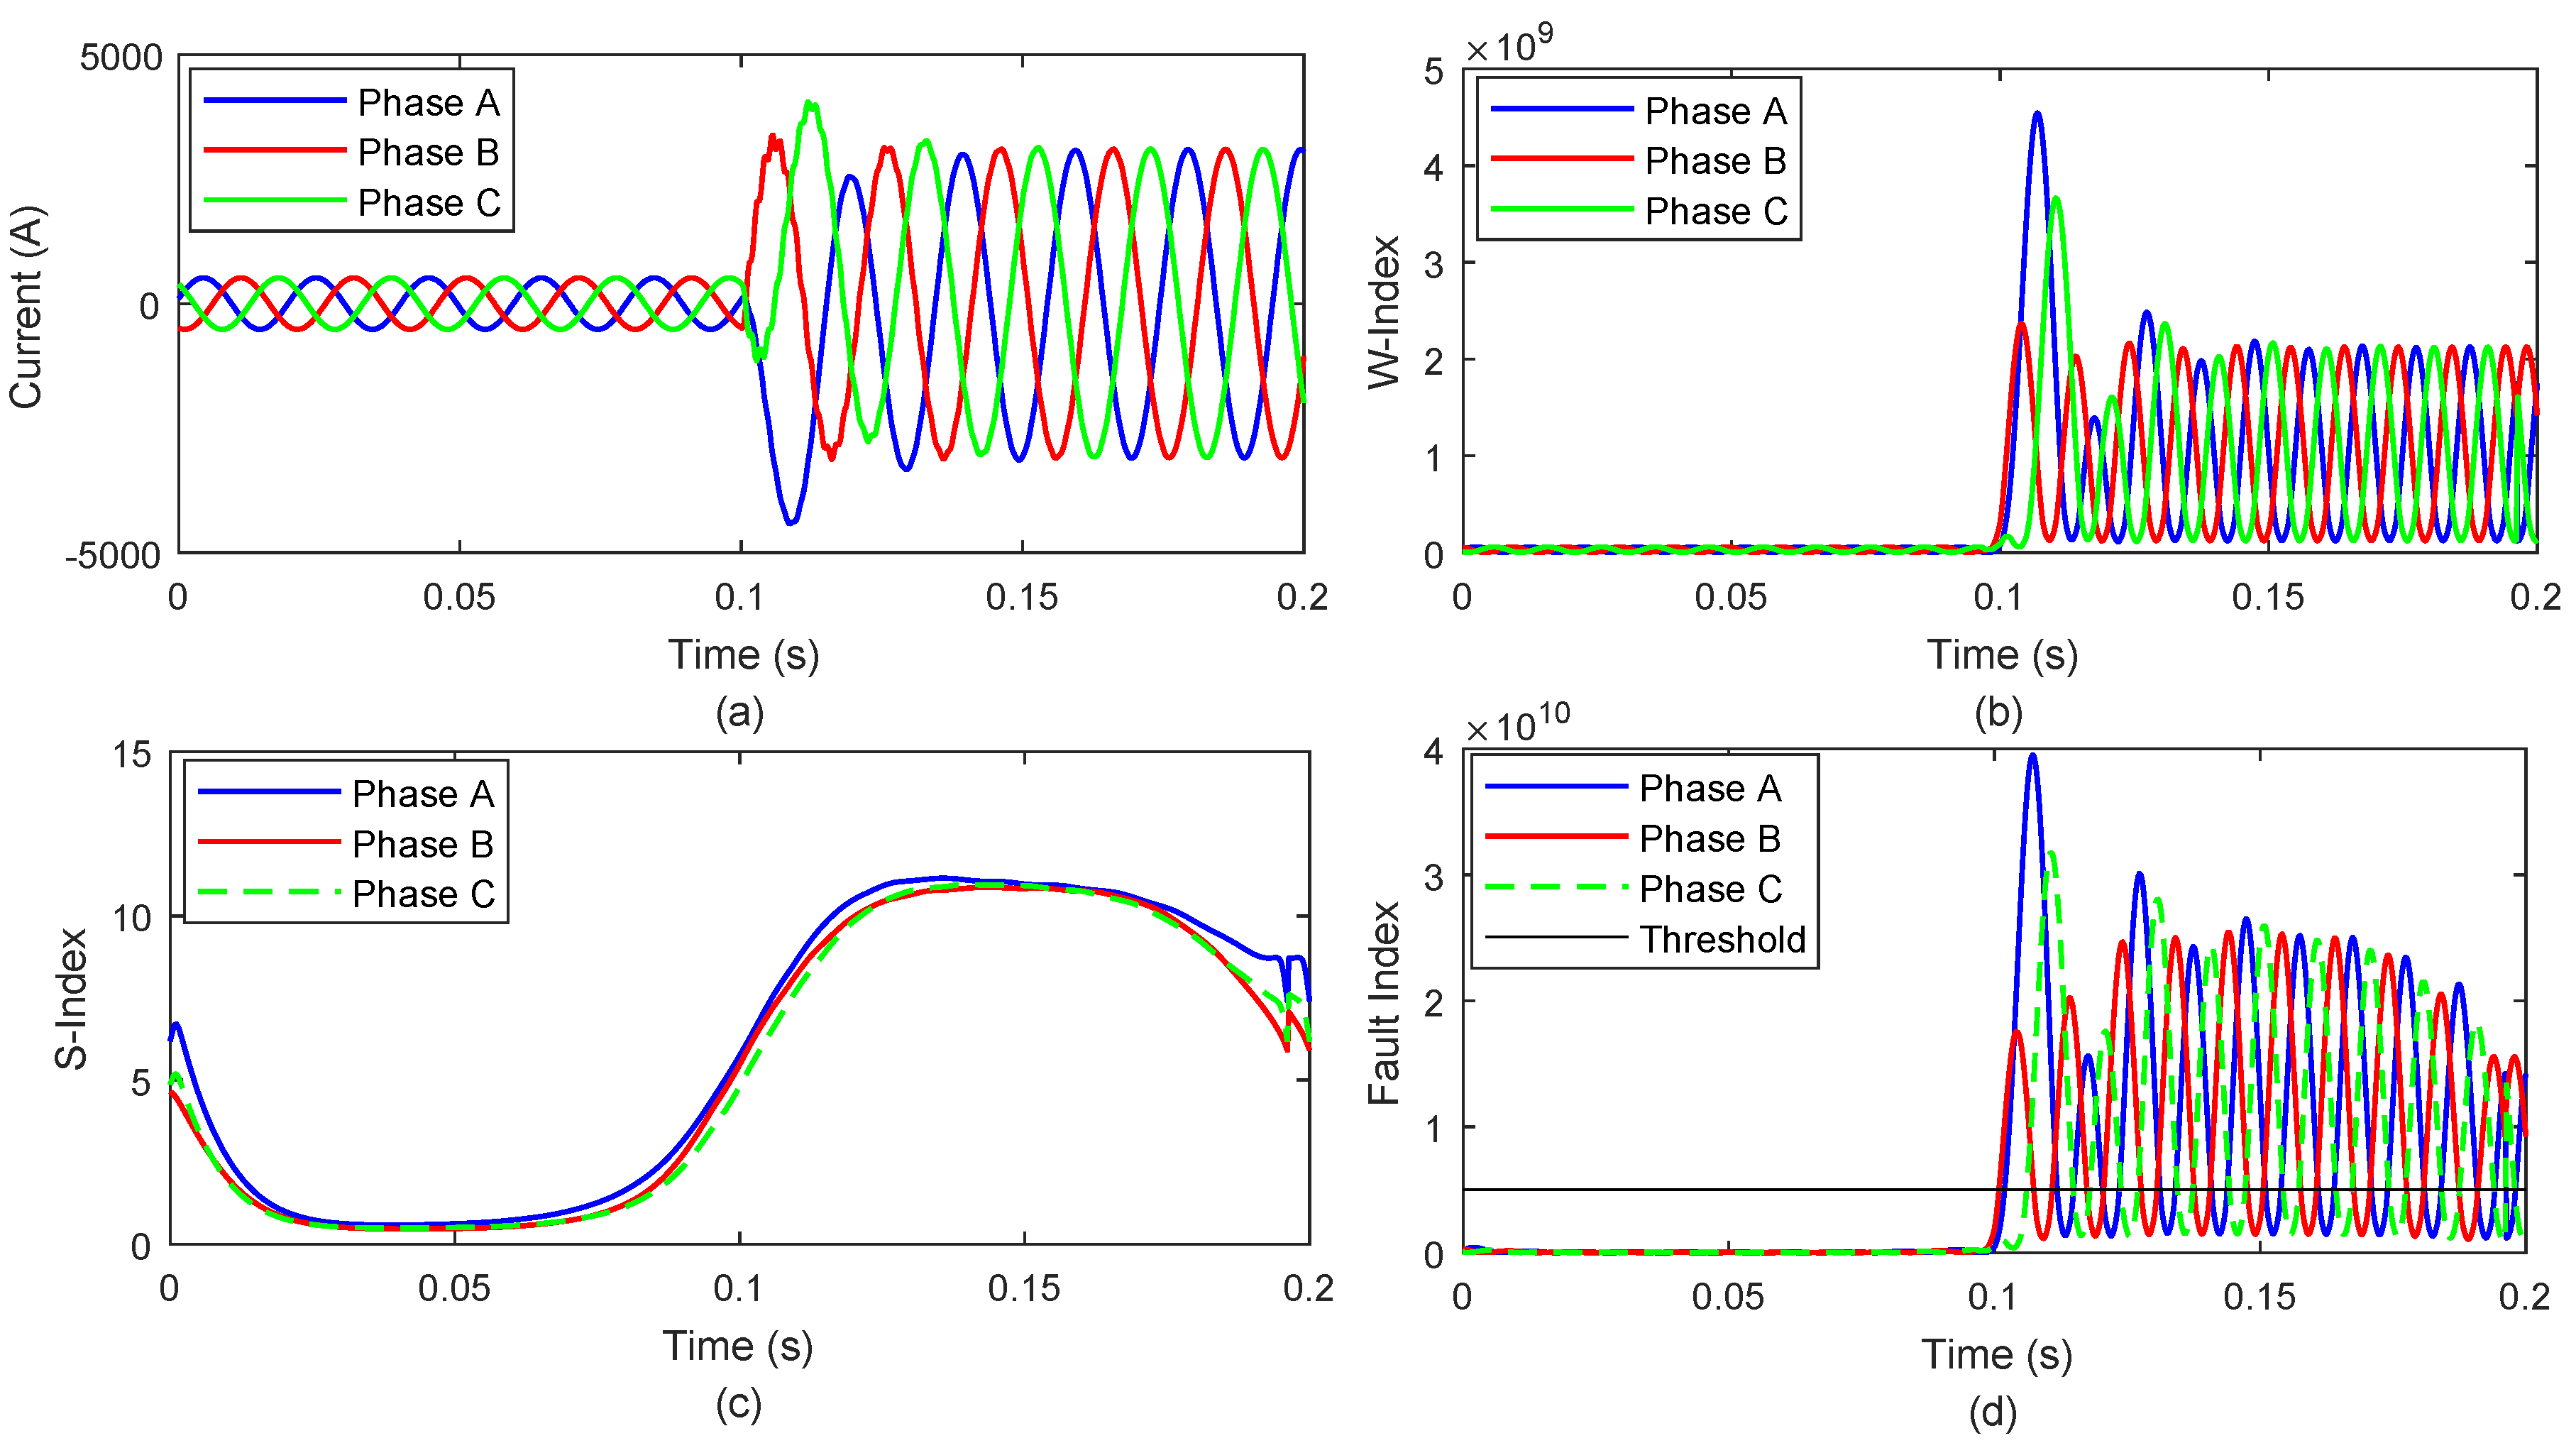
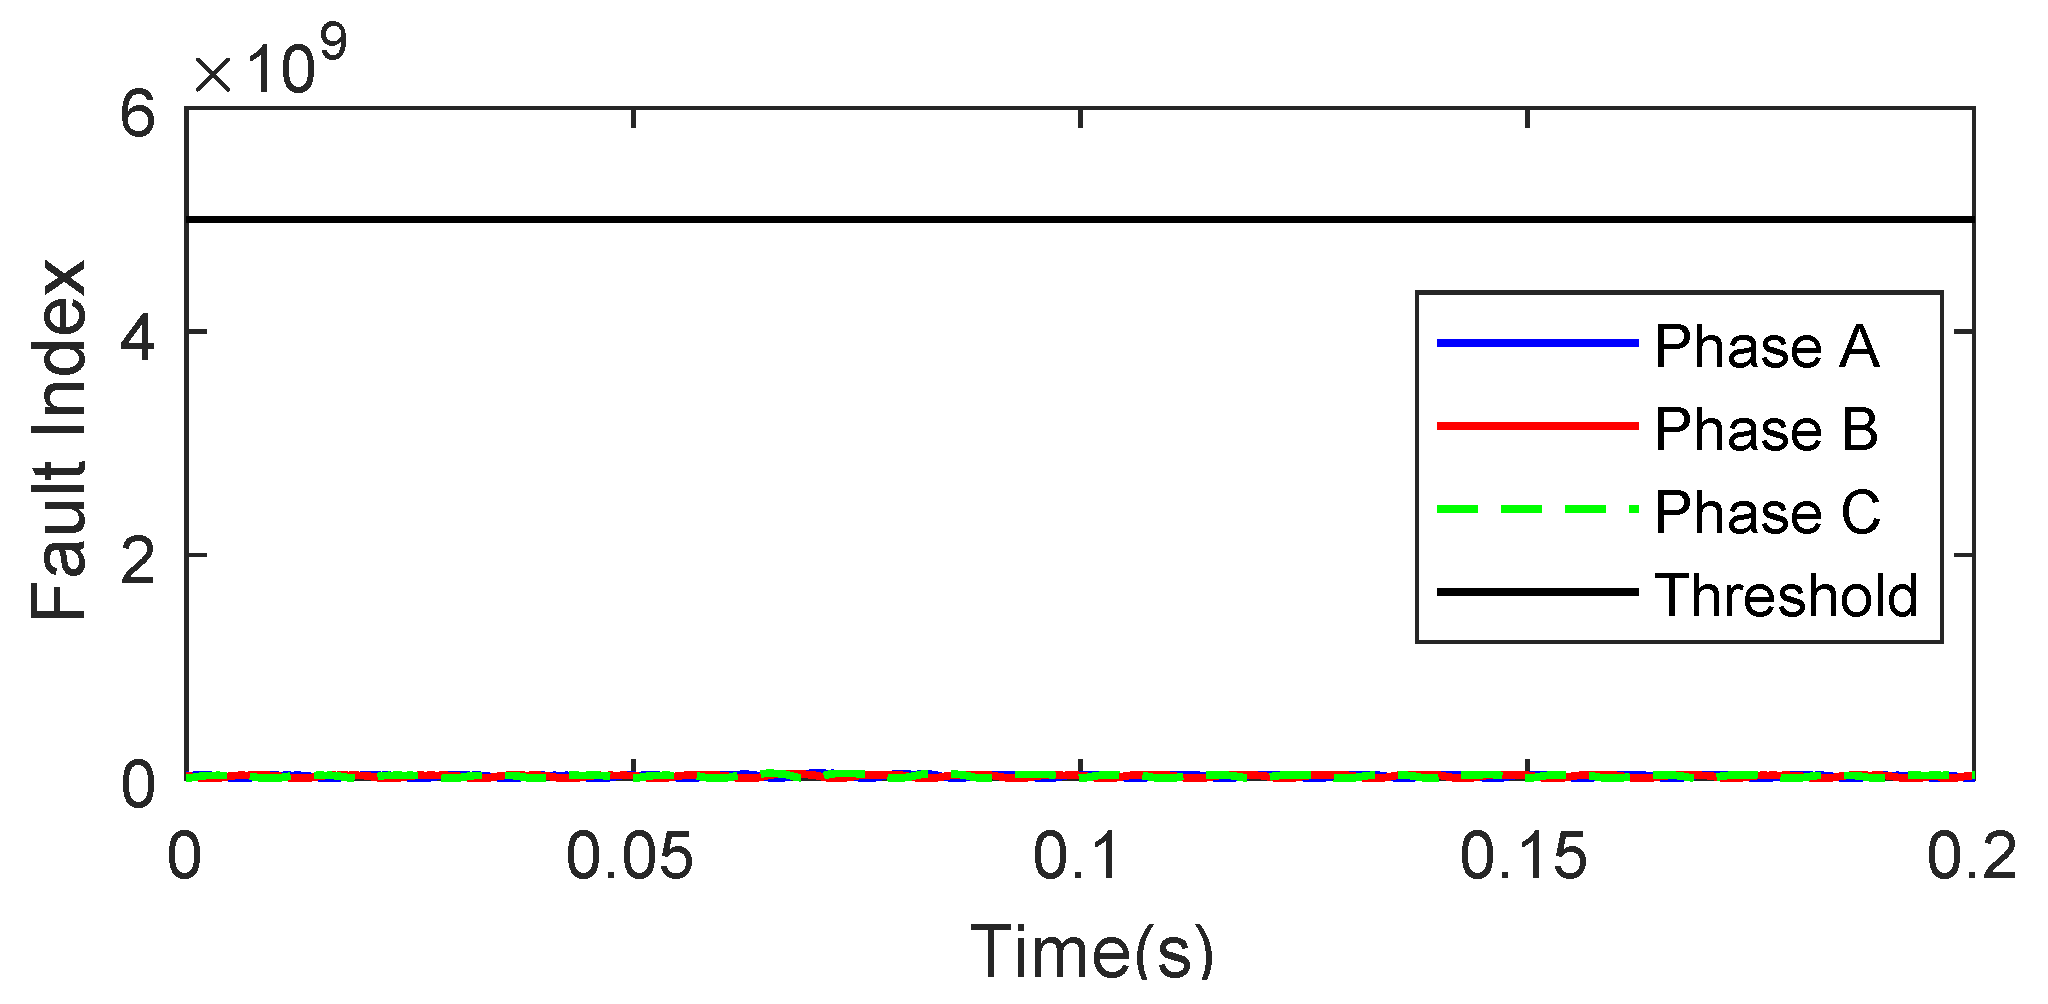
4. Transmission Line Fault Detection

The developed technique is implemented to detect all fault types incident on the power transmission line (PTL). A threshold value of 5 × 10 9 is utilized to differentiate the fault and healthy phases. The L-G fault is realized at the center of the PTL. The signals of the current measured at the sending end of the PTL, the W-index, the S-index, and the proposed FI are illustrated in Figure 3a–d, respectively.
It is clear from Figure 3b that the magnitude of the W-index for all phases is near zero prior to the incidence of the fault event. The magnitude of this index for Fault Phase A increases just after the fault occurrence, whereas for the healthy phases, the magnitude of the W-index continues to remain near zero even after the incidence of the fault. As observed from Figure 3c, the S-index increases after the fault event for Fault Phase-A and continues to be near zero for the healthy phases. Further, from Figure 3d, it is clear that the FI is zero in the pre-fault condition, increases immediately following the fault incident for Fault Phase A, and remains zero for the healthy phases. The FI associated with Phase A is above the pre-set threshold just after the occurrence of the fault of an LG nature, whereas this FI continues to be zero for healthy Phases B and C. Hence, the algorithm introduced in this manuscript can be effectively implemented for the identification of L-G faults.
By short circuiting Phases A and B, the LL fault is created at middle of the transmission link. Figure 4a–d illustrates the current signal captured at the sending terminal of the transmission link, the W-index, the S-index, and the F-index, respectively, at the time of the LL fault.
From Figure 4b, it is clearly established that the magnitude of the W-index falls to nearly zero prior to the fault incidence, corresponding to all phases. However, just after the fault event, this index corresponding to Fault Phases A and B is increased, whereas for the healthy Phase C, the magnitude of the W-index continues to remain near zero even after the incidence of the fault. As can be inferred from Figure 4c, the S-index related to Phases A and B rises immediately following the fault event and continues to be near zero for the healthy Phase C. Figure 4d shows that the F-index is zero in the pre-fault condition, but increases just after the fault event for Fault Phases A and B. Further, it remains zero for healthy phase C. The FI related to Phases A and B is above the pre-set threshold just after the occurrence of the fault with an LL nature, whereas this F continues to be zero for healthy Phase C. Therefore, to detect the fault with an LL nature, the proposed algorithm is effectively utilized.
By grounding Phases A and B, at the same time, the LL-G fault appears in middle of the PTL. The current signal recorded at the sending terminal of the transmission link, the W-index, the S-index, and FI at the time of the LL-G fault are illustrated in Figure 5a–d, respectively.
From Figure 5b, it is clearly established that the magnitude of the W-index falls nearly to zero prior to the fault incidence related to all phases. This index related to Fault Phases A and B rises immediately following the fault event, whereas for the healthy Phase C, the magnitude of the W-index continues to remain near zero even after the incidence of the fault. As can be inferred from Figure 5c, the S-index pertaining to Phases A and B increases just after the fault event and continues to be near zero for the healthy Phase C. From Figure 5d, it is clear that the FI is zero at the moment of the pre-fault condition and increases just after the fault event for Phases A and B, which are the fault, but remains zero for Phase C, which is healthy. The FI pertaining to Phases A and B is above the pre-set threshold just after the occurrence of the fault with an LLG nature, whereas this FI continues to be zero for healthy Phase C. Therefore, the LL-G fault is efficiently recognized by the use of the technique introduced in this manuscript.
All the phases are grounded at the same moment at the middle of the PTL to realize the fault with an LLL-G nature. The current measured at the sending end of the PTL, the W-index, the S-index, and the FI during the event of the LLL-G fault are illustrated in Figure 6a-d, respectively.
From Figure 6b, it is clearly inferred that the magnitude of the W-index falls nearly to zero prior to the fault incidence related to all phases. This index associated with all phases rises immediately following the fault event. As pointed out in Figure 6c, the S-index related to all the phases rises immediately following the fault event. It can be concluded from Figure 6d that the FI is zero in the pre-fault condition and increases just after the fault event for all the phases. The FI related to all phases is high in comparison to the pre-set threshold just after the occurrence of the LLL-G fault. Hence, the LLL-G fault can be efficiently detected with the help of the proposed technique.

5. Transmission Line Fault Classification

Transmission line faults are categorized using the algorithm described in Figure 2. The peak magnitude of the FI is high in comparison to the pre-set threshold magnitude for one phase and below the threshold for two phases presenting the L-G fault. If the FI has higher magnitudes related to all phases compared to the threshold, then the LLL fault is present in the system. The severity of the LLL fault with and without ground involvement is the same; therefore, further identification is not required for protection purposes. If the FI has a higher magnitude related to the two phases than the threshold value and a lesser value than the threshold for one phase, in this case, faults with an LL nature are present where the ground may or may not be involved. These can be discriminated from each other with the help of the proposed GFI. The threshold value (GFTH) of 4 × 10 10 is selected for the discrimination of the LL faults with and without the connection of the ground. The values of the GFI for differentiation among the LL and LL-G faults using the GFI are illustrated in Figure 7. The GFI corresponding to the LL fault without involving the ground is higher compared to the GFTH, whereas it is below the GFTH for the LL faults involving the ground. Therefore, all types of faults were recognized effectively by the use of the proposed algorithm.

6. Fault Detection and Classification Case Studies

Cases are considered for study to validate the algorithm for identification and to classify the faults of a different nature, which include faults at different locations, the variable fault impedance, and the variable incidence angle of fault.

6.1. Variation of the Fault Location

Faults at different locations on the PTL are recognized to validate the protection approach. The incidence angle of the fault and impedance are maintained at zero for various kinds of faults when the effect of the fault location is investigated. Faults L-G, LL, LL-G, and LLL-G are realized at distances of 30 km, 60 km, 90 km, 120 km, 150 km, 180 km, and 210 km from the sending end bus. The proposed FI with various fault locations is shown in Figure 8.
From Figure 8a, it is clear that the highest magnitude of the FI associated with Phase A is greater relative to the pre-set threshold. The FI related to Phases B and C has a lower magnitude compared to the pre-set threshold at the moment of the fault with an L-G nature on Phase A at all fault locations. This is pointed out in Figure 8b: the peak magnitude of the FI related to Phases A and phase B is greater relative to the threshold value, whereas the FI pertaining to Phase C is lower relative to the pre-set threshold at the moment of the fault with an LL nature at all locations. From Figure 8c, it can be concluded that the peak of the FI associated with Phases A and B is high relative to the pre-set threshold, and the FI associated with Phase C is low relative to the pre-set threshold at the time of the fault with an LL-G nature at all locations. Figure 8d indicates that the peak of the FI related to all phases is greater relative to the threshold at the moment of the LLL-G fault.

6.2. Variable Fault Impedance

The effects of the changing fault impedance on the proposed technique are investigated by utilizing all categories of faults with various impedances involved in the fault events, which include 0 Ω , 5 Ω , 10 Ω , 15 Ω , 20 Ω , and 25 Ω . The fault distance for all types of faults is considered to be 30 km from the sending end terminal. The incidence angle of the fault is maintained at zero for all kinds of faults at the time of the varying fault impedance. The FIs for all kinds of faults with different impedances are presented in Figure 9.
From Figure 9a, it is clear that the peak magnitude of the FI associated with Phase A is greater relative to the pre-set threshold. The FI associated with Phases B and C is lower relative to the pre-set threshold at the moment of the L-G fault on Phase A for the different quantities of the impedance. It is revealed in Figure 9b that the peak of the FI related to Phases A and B is greater compared to the pre-set threshold. This FI pertaining to Phase C is lower relative to the pre-set threshold at the moment of fault of an LL nature with different quantities of the impedance. In Figure 9c, it is clear that the peak quantities of the FI related to Phases A and B are greater relative to the threshold value, whereas the FI related to Phase C is lower relative to the pre-set threshold at the time of fault of an LL-G nature for all quantities of the impedance. Figure 9d indicates that the peak quantities of the FI related to all phases is greater compared to the threshold quantity at the moment of fault with an LLL-G nature with different values of the fault impedance.

6.3. Fault Incidence Angle Variation

The impact of the changing fault incidence angle over the sinusoidal waveform of the current signal on the performance of the algorithm is investigated by recognizing all categories of faults incident at angles of 0°, 30°, 60°, 90°, 120°, and 150°. These faults are created at a location 30 km away from the sending terminal. The impedance of all kinds of faults is maintained at zero at the moment of the varying angles of the fault incidence. Figure 10 presents the FI for the faults of all natures at different angles of the fault incidence.
From Figure 10a, it is clearly seen that the peaks of the FI corresponding to Phase A are greater compared to the pre-set threshold. The FI related to Phases B and C is lower than the threshold quantity ( 5 × 10 9 ) at the time of the LG fault on Phase A for different values of the angle of the fault incidence. From Figure 10b, it is clear that the peak quantities of the FI associated with Phases A and B are greater relative to the threshold value, whereas the FI related to Phase C is lower relative to the pre-set threshold at the moment of the LL fault with different quantities of the angle of the fault incidence. From Figure 10c, it is clear that the peak quantities of the FI associated with Phases A and B are greater relative to the threshold value, whereas the FI related to Phase C is low relative to the pre-set threshold at the moment of the LL-G fault for all quantities of the angle of the fault incidence. Figure 10d indicates that the peak quantities of the FI pertaining to all phases are high relative to the pre-set threshold quantity at the moment of the LLL-G fault with different values of the fault incidence angle.

6.4. Additional Case Studies

The protection technique is investigated for the identification of the fault with Phase A to the ground, which is realized at 30 km from Bus 1 of the utilized transmission line model during the condition of reverse power flow when the power flows from Bus 2 to Bus 1. The fault indices corresponding to all the phases are detailed in Table 2. It is clearly seen from this table that the peak quantity of the FI related to Phase A is greater relative to the pre-set threshold. The FI related to Phases B and C is lower than the pre-set threshold magnitude ( 5 × 10 9 ). Therefore, the fault with an L-G nature realized in Phase A of the modified transmission link system creates the reverse power flow.
The proposed protection technique is examined for the identification of the Phase A to the ground fault realized at 30 km from Bus 1 of the PTL with the noise level of 10 dB SNR (signal-to-noise ratio). The fault indices corresponding to all the phases are detailed in Table 2. It is clear that the peak of the FI associated with Phase A is greater relative to the pre-set threshold magnitude, whereas the FI related to Phases B and C is lower than the threshold magnitude ( 5 × 10 9 ). However, due to the presence of noise, the fault indices corresponding to all the phases increase significantly compared to the condition when the noise is not present. Hence, the fault with an L-G nature on Phase A of the modified test system in the noisy environment is detected successfully.
The proposed protection technique is investigated for the identification of the fault with Phase A to the ground realized at 50 km from Bus 1 of the modified test PTL considering the hybrid nature with the sections of the overhead line and underground cable. The line section of the 20 km from Bus 1 is designed as the overhead line, and the next 20 km section is designed as the underground cable, while the remaining part of the line is designed as the overhead line. The fault indices corresponding to all the phases are detailed in Table 2. It is clear that the peak quantity of the FI related to Phase A is greater relative to the pre-set threshold magnitude. The FI pertaining to Phases B and C is lower relative to the threshold magnitude ( 5 × 10 9 ). However, due to the hybrid arrangement of the underground cable and overhead line, the fault indices corresponding to all the phases decrease slightly compared to the condition when the overhead line section is considered. Hence, the fault with an LG nature on Phase A of the hybrid test PTL (overhead line and underground cable) is identified efficiently.

7. Testing of the Algorithm to Discriminate Switching Events from Faults

The proposed approach is tested for the operational events including capacitor bank switching and the switching of inductive load to establish that the operational events do not generate tripping signals for the relay system. Capacitor switching and inductive load switching are two commonly occurring events, which are discussed in this section.

7.1. Capacitive Switching

The performance of the algorithm is evaluated for the event of switching the capacitor bank with a capacity of 20 MVAR. The switching on the capacitor bank event is realized at the fourth cycle, and the switching off the capacitor bank event is realized at the eighth cycle. The respective FI for these events is presented in Figure 11. It can be seen that the value of the FI is less relative to the threshold magnitude of 5 × 10 9 . Hence, the technique introduced in this paper is efficient in the differentiation of the switching (capacitor bank) events from the faults.

7.2. Inductive Switching

The algorithm is tested for switching of the inductive load having a rating of 20 MVAR. The switching on the load event is realized at the fourth cycle, and the switching off the load event is realized at the eighth cycle. The respective FI for these events is presented in Figure 12. It is clear that the peak of the FI is less compared to the pre-set threshold, which is 5 × 10 9 . Hence, the proposed technique is efficient in the differentiation of the switching (inductive load) events from the faults.

8. Performance Comparison

The proposed technique’s performance is evaluated in comparison with the algorithm discussed in [24]. The algorithm presented in [24] is based on the wavelet transform, and its is influenced by the noise in the current signal. Further, this algorithm uses GPS for the synchronization of the sampling frequency at both terminals of the transmission line and communication channel, which involves a high cost and makes the method complex. The algorithm introduced in this manuscript is less affected by noise, and it is less complex and eliminates the requirement of the communication channel and GPS. Fault indices for the LG fault computed using the proposed algorithm and the algorithm reported in [24] are described in Figure 13a,b, respectively. It is observed that the time taken to attain the value of the threshold for the FI associated with Phase A is high in the algorithm reported in [24] compared to the proposed approach. Further, the values of the FI associated with healthy Phases B and C is zero after the fault incidence for proposed algorithm, whereas it is non-zero for the algorithm reported in [24]. Hence, the algorithm reported in [24] might generate a false tripping signal, the probability of which is very low when using the protection scheme proposed in this paper. Hence, the proposed protection scheme is superior compared to the protection scheme reported in [24].

9. Conclusions

A protection algorithm supported by the S-transform and the WDF is introduced in this manuscript for the identification and classification of transmission line faults. The merit of the S-transform having the minimum influence of noise and the WDF analyzing the data over a specified window width are combined in this approach. The proposed S-index calculated from the S-transform depending on the decomposition of the current signal and the W-index obtained from the WDF of the current signal over a quarter cycle are combined to obtain the FI. This FI is utilized to detect different fault conditions by comparing the peak values with the threshold. Faults’ categorization is obtained using the number of fault phases in an event. The classification of the LL fault and the LL-G fault is achieved using the proposed GFI, which is based on the WD of the zero sequence current over the quarter cycle. The proposed technique is performed by testing the algorithm in different case studies such as the variation of the fault impedance, the fault incidence angle, the location, the reverse power flow, the presence of noise, and the fault on the hybrid PTL, which has sections of underground cable and overhead line. The algorithm is also analyzed for operating events such as switching off the capacitor bank and inductive load. This algorithm can obtain efficient protection of the transmission link using the data recorded at one end, eliminating the requirement of the communication channel and GPS. It is observed that the developed technique is efficient in the identification and classification of the faults on the power transmission line in the period of a quarter cycle. Furthermore, it is less complex than previous algorithms and easy to implement.

Author Contributions

Conceptualization, A.K., O.P.M. and M.K.G.; methodology, A.K. and O.P.M.; software, A.K. and O.P.M.; validation, A.K., O.P.M. and B.K.; formal analysis, A.K., O.P.M., and B.K.; investigation, A.K. and O.P.M.; resources, A.K., O.P.M. and M.K.G.; data curation, A.K., O.P.M., and B.K.; writing, original draft preparation, A.K. and O.P.M.; writing, review and editing, A.K. and O.P.M.; visualization, B.K., M.K.G., H.H.A. and P.S.; supervision, O.P.M., M.K.G., H.H.A. and P.S. All authors read and agreed to the published version of the manuscript.

Funding

This research received no external funding.

Conflicts of Interest

The authors declare no conflict of interest.

Abbreviations

The abbreviations used in this article are detailed below:
CSAEConvolutional sparse auto-encoder
FDOSTFast discrete orthogonal Stockwell transform
FIFault index
GFIGround fault index
GFTHGround fault index threshold value
GPSGlobal Positioning System
GSSGrid substations
HTHilbert transform
L-GPhase-to-ground fault
LLTwo phase fault
LL-GTwo phases-to-ground fault
LLL-GThree phases-to-ground fault
MATLABMatrix Laboratory
PTLPower transmission line
SAVSum absolute values
SNRSignal-to-noise ratio
S-transformStockwell transform
STStockwell transform
THFault threshold
UGUnderground
WDWigner distribution
WDFWigner distribution function
WPTWavelet packet transform
WTWavelet transform

References

  1. Prasad, C.; Nayak, P.K. A DFT-ED based approach for detection and classification of faults in electric power transmission networks. Ain Shams Eng. J. 2019, 10, 171–178. [Google Scholar] [CrossRef]
  2. Musa, M.H.; He, Z.; Fu, L.; Deng, Y. A covariance indices based method for fault detection and classification in a power transmission system during power swing. Int. J. Electr. Power Energy Syst. 2019, 105, 581–591. [Google Scholar] [CrossRef]
  3. Rathore, B.; Shaik, A.G. Wavelet-alienation based transmission line protection scheme. IET Gener. Transm. Distrib. 2017, 11, 995–1003. [Google Scholar] [CrossRef]
  4. Peng, N.; Zhou, L.; Liang, R.; Xu, H. Fault location of transmission lines connecting with short branches based on polarity and arrival time of asynchronously recorded traveling waves. Electr. Power Syst. Res. 2019, 169, 184–194. [Google Scholar] [CrossRef]
  5. Lee, C.J.; Park, J.B.; Shin, J.R.; Radojevie, Z.M. A new two-terminal numerical algorithm for fault location, distance protection, and arcing fault recognition. IEEE Trans. Power Syst. 2006, 21, 1460–1462. [Google Scholar] [CrossRef]
  6. Rathore, B.; Mahela, O.P.; Khan, B.; Haes Alhelou, H.; Siano, P. Wavelet-Alienation-Neural Based Protection Scheme for STATCOM Compensated Transmission Line. IEEE Trans. Ind. Inf. 2020. [Google Scholar] [CrossRef]
  7. Chen, K.; Hu, J.; He, J. Detection and Classification of Transmission Line Faults Based on Unsupervised Feature Learning and Convolutional Sparse Autoencoder. IEEE Trans. Smart Grid 2018, 9, 1748–1758. [Google Scholar] [CrossRef]
  8. Sharma, R.; Mahela, O.P.; Agarwal, S. Detection of Power System Faults in Distribution System Using Stockwell Transform. In Proceedings of the 2018 IEEE International Students’ Conference on Electrical, Electronics and Computer Science (SCEECS), Bhopal, India, 24–25 February 2018; pp. 1–5. [Google Scholar] [CrossRef]
  9. Adly, A.R.; Aleem, S.H.E.A.; Algabalawy, M.A.; Jurado, F.; Ali, Z.M. A novel protection scheme for multi-terminal transmission lines based on wavelet transform. Electr. Power Syst. Res. 2020, 183, 106286. [Google Scholar] [CrossRef]
  10. Ola, S.R.; Saraswat, A.; Goyal, S.K.; Jhajharia, S.K.; Rathore, B.; Mahela, O.P. Wigner distribution function and alienation coefficient-based transmission line protection scheme. IET Gener. Transm. Distrib. 2020, 14, 1842–1853. [Google Scholar] [CrossRef]
  11. Ram Ola, S.; Saraswat, A.; Goyal, S.K.; Jhajharia, S.K.; Khan, B.; Mahela, O.P.; Haes Alhelou, H.; Siano, P. A Protection Scheme for a Power System with Solar Energy Penetration. Appl. Sci. 2020, 10, 1516. [Google Scholar] [CrossRef] [Green Version]
  12. Ola, S.R.; Saraswat, A.; Goyal, S.K.; Sharma, V.; Khan, B.; Mahela, O.P.; Alhelou, H.H.; Siano, P. Alienation Coefficient and Wigner Distribution Function Based Protection Scheme for Hybrid Power System Network with Renewable Energy Penetration. Energies 2020, 13, 1120. [Google Scholar]
  13. Adly, A.R.; Ali, Z.M.; Elsadd, M.A.; Abdel Mageed, H.M.; Abdel Aleem, S.H. An integrated scheme for a directional relay in the presence of a series-compensated line. Int. J. Electr. Power Energy Syst. 2020, 120, 106024. [Google Scholar] [CrossRef]
  14. Patel, B. A new FDOST entropy based intelligent digital relaying for detection, classification and localization of faults on the hybrid transmission line. Electr. Power Syst. Res. 2018, 157, 39–47. [Google Scholar] [CrossRef]
  15. Malhotra, A.; Mahela, O.P.; Doraya, H. Detection and Classification of Power System Faults using Discrete Wavelet Transform and Rule Based Decision Tree. In Proceedings of the 2018 International Conference on Computing, Power and Communication Technologies (GUCON), Greater Noida, Uttar, 28–29 September 2018; pp. 142–147. [Google Scholar] [CrossRef]
  16. Kulshrestha, A.; Mahela, O.P.; Gupta, M.K. Identification and Classification of Faults in Utility Grid with Solar Energy Using Discrete Wavelet Transform and Decision Rules. In Proceedings of the 2020 12th International Conference on Computational Intelligence and Communication Networks (CICN), Bhimtal, India, 25–26 September 2020; pp. 251–257. [Google Scholar] [CrossRef]
  17. Mahela, O.P.; Sharma, J.; Kumar, B.; Khan, B.; Alhelou, H.H. An algorithm for the protection of distribution feeder using Stockwell and Hilbert transforms supported features. CSEE J. Power Energy Syst. 2020, 1–9. [Google Scholar] [CrossRef]
  18. Karmakar, S.; Ahmad, G.; Mahela, O.P.; Choudhary, R.R. Algorithm Based on Combined Features of Stockwell Transform and Hilbert Transform for Detection of Transmission Line Faults with Dynamic Load. In Proceedings of the 2020 First International Conference on Power, Control and Computing Technologies (ICPC2T), Raipur, India, 3–5 January 2020; pp. 354–358. [Google Scholar] [CrossRef]
  19. Karmakar, S.; Mahela, O.P.; Ahmad, G.; Choudhary, R.R. Transmission Line Protection Scheme Based on Combined Features of Stockwell Transform and Hilbert Transform. In Proceedings of the 2020 First International Conference on Power, Control and Computing Technologies (ICPC2T), Raipur, India, 3–5 January 2020; pp. 348–353. [Google Scholar] [CrossRef]
  20. Stockwell, R.G.; Mansinha, L.; Lowe, R.P. Localization of the complex spectrum: The S transform. Signal Process. IEEE Trans. 1996, 44, 998–1001. [Google Scholar] [CrossRef]
  21. Behera, H.S.; Dash, P.K.; Biswal, B. Power quality time series data mining using S-transform and fuzzy expert system. Appl. Soft Comput. 2010, 10, 945–955. [Google Scholar] [CrossRef]
  22. Khan, N.A.; Taj, I.A.; Jaffri, M.N.; Ijaz, S. Cross-term elimination in Wigner distribution based on 2D signal processing techniques. Signal Process. 2011, 91, 590–599, Advances in Fractional Signals and Systems. [Google Scholar] [CrossRef]
  23. Cheng, J.Y.; Huang, S.J.; Hsieh, C.T. Application of Gabor–Wigner transform to inspect high-impedance fault-generated signals. Int. J. Electr. Power Energy Syst. 2015, 73, 192–199. [Google Scholar] [CrossRef]
  24. Shaik, A.G.; Pulipaka, R.R.V. A new wavelet based fault detection, classification and location in transmission lines. Int. J. Electr. Power Energy Syst. 2015, 64, 35–40. [Google Scholar] [CrossRef]
Figure 1. Modified case study system.
Applsci 10 07985 g001
Figure 2. The proposed technique’s flowchart.
Applsci 10 07985 g002
Figure 3. Identification of the fault with the L-G nature: (a) signals of the current (b) W-index (c) S-index and (d) FI.
Applsci 10 07985 g003
Figure 4. Identification of the fault with an LL nature: (a) signals of the current (b) W-index (c) S-index, and (d) FI.
Applsci 10 07985 g004
Figure 5. Identification of the fault with an LL-G nature: (a) signals of the current (b) W-index (c) S-index, and (d) FI.
Applsci 10 07985 g005
Figure 6. Identification of the fault with an LLL-G nature: (a) signals of the current, (b) W-index, (c) S-index, and (d) FI.
Applsci 10 07985 g006
Figure 7. Differentiation among the LL and LL-G faults using the GFI.
Applsci 10 07985 g007
Figure 8. Effects of varying the fault location for detecting and classifying (a) L-G, (b) LL, (c) LL-G, and (d) LLL-G faults.
Applsci 10 07985 g008
Figure 9. Effect of the varying impedance involved during the fault for detecting and classifying (a) L-G, (b) LL, (c) LL-G, and (d) LLL-G faults.
Applsci 10 07985 g009
Figure 10. Effect of the varying angle of the fault incidence for detecting and classifying (a) L-G, (b) LL, (c) LL-G, and (d) LLL-G faults.
Applsci 10 07985 g010
Figure 11. FI at the moments of capacitor switching operations.
Applsci 10 07985 g011
Figure 12. FI at the time of inductive load switching.
Applsci 10 07985 g012
Figure 13. Fault index for the L-G fault (a) computed using the proposed algorithm and (b) computed using the algorithm reported in [24].
Applsci 10 07985 g013
Table 1. System parameters.
System ParameterSimulated Parameter
Line length230 km
Generator 1 voltage500 20° kV
Generator 2 voltage500 0° kV
Generator 1 impedance (equivalent)17.177 + j45.529 Ω
Generator 2 impedance (equivalent)15.31 + j45.925 Ω
Transmission link positive sequence impedance4.983 + j117.83 Ω
Transmission link zero sequence impedance12.682 + j364.196 Ω
Transmission link admittance (positive sequence)j1.468 m℧
Transmission link zero sequence admittancej1.099 m℧
Transmission link rated power (apparent)433.63 + j294.52 MVA
Table 2. F-index peak magnitude.
Case StudyPeak Magnitude of the Fault Index
Phase APhase BPhase C
Reverse Power Flow 9.5 × 10 9 9695
Presence of Noise 13.5 × 10 9 207204
Hybrid Line 7.1 × 10 9 7170
Publisher’s Note: MDPI stays neutral with regard to jurisdictional claims in published maps and institutional affiliations.

