Abstract
The plane formed by the intersection of bilateral porions (PoR and PoL) and left orbitale (OrL) is conventionally defined as the Frankfort horizontal (FH) plane. We aim to test the influence of the FH plane definition on a 3D cephalometric assessment. We selected 38 adult patients (20 males, 18 females; average age: 22.87 ± 5.17 years) without any gross asymmetry from retrospective records and traced and analyzed their cone-beam computed tomographic images. The findings were categorized into the following four groups: FH1: conventional; FH2: PoR, PoL, right orbitale (OrR); FH3: OrR, OrL, PoL; FH4: OrR, OrL, PoR. The average menton (Me) deviation from the MSP was statistically significant for the FH1 group (0.56 ± 0.27 mm; p < 0.001), compared to the FH3 (1.37 ± 1.23 mm) and FH4 (1.33 ± 1.16 mm) groups. The spatial orientation level (SOL) of the FH plane showed a marked difference (p < 0.05) between the FH2 (0.602° ± 0.503°) and FH4 (0.944° ± 0.778°) groups. The SOL of the MSP was comparatively small (p < 0.001) for FH2 (0.015° ± 0.023°) in comparison to both FH 3 (0.644° ± 0.546°) and FH 4 (0.627° ± 0.516°). Therefore, the FH plane definition can significantly influence the interpretation of cephalometric findings. Future studies should focus on standardization to improve the reliability and reproducibility of 3D cephalometry.
1. Introduction
The Frankfort Craniometric Agreement of August 1882 is considered a landmark development in anthropometrics. It developed a horizontal plane of reference, referred to as the Frankfort horizontal (FH) plane. The FH plane or the auriculo-orbital plane closely represents the natural head position. Thus, it was rapidly adapted for patient orientation in cephalometric imaging [1]. The use of this plane has been increasingly employed with the advancement of cephalometry in orthodontics. Various analytical parameters and norms are in tandem with the FH plane.
Craniofacial imaging modalities have undergone a marked evolution. Furthermore, 3D imaging modalities, such as cone-beam computed tomography (CBCT), have gained a large impetus. The ongoing advancement of CBCT imaging is concomitant with its rapid clinical adaptation for craniofacial analysis. The 3D perspective has made CBCT essential for the diagnosis of skeletal malformations, particularly concerning the assessment of facial symmetry [2]. However, the assessment standards have not kept pace amidst the increasing use of CBCT. Moreover, researchers often use variable definitions to describe similar cephalometric reference plane(s) [3]. Studies report on numerous combinations for defining the FH plane. The basic landmarks defining the plane are, namely, the orbitale (Or) and porion (Po). Nonetheless, researchers have used the variability among the choices viz. a four-point plane with bilateral Or and Po [4], a three-point plane with unilateral Po, Or [5], or a calculated median of either Po [6] and Or [7] landmarks.
All 3D analyses require the orientation of the acquired image. A digital orientation device is used to reproduce the natural head position (NHP) or landmark-based orientation [8]. The popularity of landmark-based orientation can be attributed to its ease of application. This, in turn, adds to the significance of landmark standardization for the reference planes, such as the FH plane [9]. Moreover, the corresponding midsagittal and coronal planes are oriented with reference to the established horizontal plane. In other words, the spatial orientation of the intracranial reference planes is interdependent. Moreover, a similar orientation methodology is applied to reorient the CBCT model to synthesize the cephalograms [8].
However, a change in the landmarks defining the horizontal reference plane increases the sensitivity of the dependent cephalometric landmark coordinates. Consequently, this influences the accuracy of the metric assessment. Furthermore, there is an inherent variation in Or and Po detection. This can produce notable transversal errors, particularly while using the FH plane to assess cranial symmetry [10].
The 3D cephalometric analysis draws its significance from the accuracy of the 3D assessment of skeletal deformity and asymmetry. Variable descriptions of reference planes have made the repeatability and reliability of the 3D analysis a challenging area of interest. However, the study design has been highly selective, with either a dry skull model [11,12] or high-resolution CT [11,12,13]. Furthermore, several studies have deployed specialized [9,14] or custom-coded software [3], factoring the generation of a threshold dependent model for analyses.
Therefore, we aim to evaluate the impact of changes in the FH plane definition on frontal symmetry analysis using a clinically adaptable protocol, such as one in an orthodontic specialty setup. Our null hypothesis is that geometric deviations between the planes do not significantly impact the diagnostic evaluation of facial symmetry.
2. Materials and Methods
2.1. Study Design and Patients
We collected retrospective records of adult patients who underwent orthodontic treatment at Yonsei University Dental Hospital, Seoul, the Republic of Korea, from October 2017 to April 2019. The inclusion criteria were as follows: (1) age >18 years; (2) menton (Me) deviation <2 mm, as measured by the perpendicular distance from the Me to the midsagittal plane (MSP); (3) available 3D CBCT before treatment; (4) CBCT data sets of a large field of view (FOV) and a voxel size ≤0.4 mm. The exclusion criteria for this study were as follows: (1) a history of orthodontic treatment or orthognathic surgery; (2) congenital craniofacial anomalies, such as cleft lip or palate; (3) a history of maxillofacial trauma; (4) inappropriate CBCT images because of artifacts, motion blurring, or beam hardening; (5) cases screened at geographically different locations with different protocols. Thirty-eight patients met the abovementioned criteria and were selected for further evaluation (Table 1).

Table 1.
Sample characteristics (n = 38).
Our study was approved by the institutional review board of Yonsei University Dental Hospital (2-2020-0059). It followed the tenets of the Declaration of Helsinki. All patients provided their written informed consent before the orthodontic treatment.
2.2. Image Acquisition
All patients were seated upright in a natural head position with their heads fixed with a chin cup and temple rests. The specifications of the CBCT images were acquired using an Alphard-3030 (Alphard Roentgen Ind., Ltd., Kyoto, Japan) at 80 kVp and 10 mA, with a 200 × 200 mm FOV and a voxel size of 0.39/voxel mm. We obtained the images as multifile Digital Imaging and Communications in Medicine (DICOM) files and analyzed them using the 3DAnalysis module of InVivo Dental 5.0 (Anatomage, San Jose, CA, USA). We selected 3D anatomical landmarks in accordance with previously published craniometry procedures (Table 2).
Table 2.
Definition of the landmarks and 3D cephalometric reference planes and measurements for the evaluation of symmetry.
2.3. 3D cephalometric Analysis
2.3.1. Analysis of Symmetry
We maintained the original image orientation of the CBCT data and identified the landmarks on the 3D surface models directly in combination with multiplanar reformatting (MPR). We compared the differences in absolute distance between the measured parameters on the right and left against the MSP to evaluate frontal symmetry. We calculated the angular measurements to evaluate the respective roll angles against the horizontal reference plane (Figure 1).
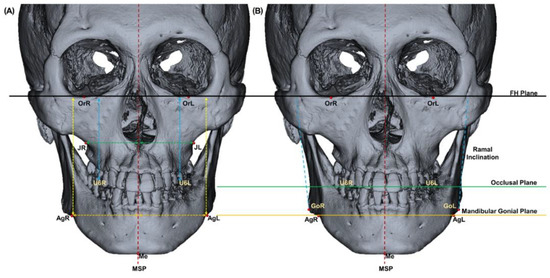
Figure 1.
Schematic representation of the 3D image of symmetry analysis. (A) The absolute distance differences were calculated as the distance differences between the right and left sides in millimeters and (B) the angular difference between the planes in degrees (Table 1).
2.3.2. Analysis of the Horizontal Reference Plane
The operator identified four landmarks (OrL, OrR, PoL, and PoR) to construct a plane in 3D. In addition, four possibilities of the FH plane were defined. FH1 (conventional FH plane) and FH2 were drawn using bilateral porions (PoR, PoL) to OrL and OrR, respectively. In contrast, FH3 and FH4 were drawn using the bilateral orbitale (OrR, OrL) to PoL and PoR, respectively. We evaluated the FH planes and their corresponding MSPs by comparing the angular differences (Figure 2).
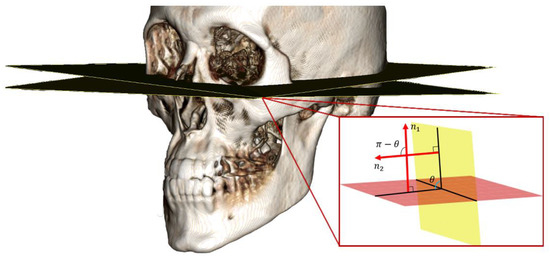
Figure 2.
Calculation of the angle between the different Frankfort horizontal (FH) planes, where n1 and n2 are the normal vectors of the two planes.
We calculated the angles of planes FH2, FH3, and FH4 and an average based on FH1. The value was used to estimate the relative spatial orientation level (SOL) of the FH planes. We used Equation (1) to obtain the normal vector of each plane from the three landmarks. We calculated the angle between the planes using Equation (2).
A normal vector of the plane passing through three points is computed by
And the angle of two planes is computed by
where are normal vectors of two planes and denotes the Euclidean norm (Figure 2). SOL acts as an indicator of deviation between the planes, such that an increase in SOL represents an increase in the variation between the FH and MSP planes. The FH plane and MSP plane measures for each patient were calculated using Pytorch (v1.5.1) software.
2.4. Reliability
A single observer traced the anatomical landmarks in 10 patients, twice in 2 weeks. The estimated intraexaminer correlation (ICC) coefficient was good to excellent for landmarks in all axes (coronal and sagittal: ICC ≥ 0.990, axial: ICC ≥ 0.755).
2.5. Statistical Analyses
All statistical analyses were performed using SPSS software for Windows, version 22.0 (IBM Corp., Armonk, NY, USA). We used G*Power 3 (Dusseldorf, Germany) for calculating the sample size. This facilitated the detection of statistical significance in the Me deviation with the change in the FH plane. We obtained a minimum sample size of 32 at a significance level of p < 0.05, power of 80%, and effect size of 0.8. All 38 retrospective records that met the inclusion criteria were selected for analysis.
We used a one-way analysis of variance (ANOVA) followed by Tukey’s test to compare the absolute differences between the measurements based on the four FH planes. One-way ANOVA was also used to compare the SOL, distance, and angle between the FH planes and the corresponding MSP. A p-value < 0.05 was considered statistically significant. In addition, we conducted a linear-by-linear association test to compare the deviation of Me from MSP between the groups.
3. Results
3.1. Comparison of Angular Measurements Between the Planes
Table 3 summarizes the differences in the SOL, calculated with reference to FH1. The angular differences in relation to FH1 were significant when comparing the SOL values of FH2–4. FH2 and FH3 SOL were similar in magnitude. Nonetheless, FH4 showed a significantly higher SOL (p < 0.05). The corresponding MSPs also showed a significant difference (p < 0.001). However, the SOL difference of MSP in the FH2 group was significantly smaller than those in the FH3 and FH4 groups, without any statistical significance (Figure 3).
Table 3.
Comparison of the spatial orientation level (SOL) between the FH planes with FH1.
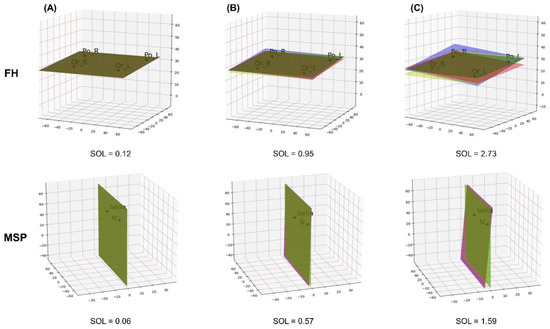
Figure 3.
Comparison of the different spatial orientation levels (SOLs) of an increasing magnitude from column (A–C). An increase in the deviation in the Frankfort Horizontal (FH) plane results in a corresponding difference in the midsagittal plane (MSP), defined by nasion (N) and sella points. FH and MSP are color-coded to improve visualization of the differences (FH1: yellow; FH2: green; FH3: purple; FH4: pink). All numerical values are in degree angles.
3.2. Comparison of the Absolute Difference Measurements
There was no substantial variation in the absolute difference in cephalometric measurements between the linear and angular values of the right and left sides when compared pairwise with different groups. However, we observed a notable difference in the values between the planes in Me to MSP. In addition, we recorded a statistically significant difference (p < 0.001) in the pattern of FH3 ≈ FH4 > FH1 ≈ FH2 (Table 4).
Table 4.
Comparison of each variable according to each FH plane.
3.3. Comparative Assessment With MSP
3.3.1. Me Deviation Frequency
Table 5 summarizes the analysis of the deviation in the Me and the differences with respect to different FH plane orientations, as calculated with the linear-by-linear association test. We observed 100% case concordance to the subject selection criteria, with FH1 (0.56 ± 0.27 mm) and FH2 (0.55 ± 0.28 mm), thus showing a Me deviation below 2 mm. However, we recorded a distinct redistribution in the FH3 (1.37 ± 1.23 mm) and FH4 (1.33 ± 1.16 mm) reference planes. A statistically substantial deviation measurement >2mm (p < 0.001) was recorded in more than 18% of cases for a similar group of samples (Figure 4A).
Table 5.
Frequency change of the amount of mention (Me) deviation according to each FH plane.
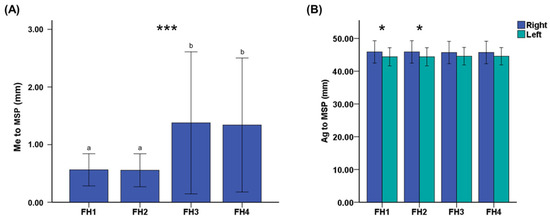
Figure 4.
Influence of the different FH plane definitions on the (A) Me deviation and (B) bilateral Ag to MSP (error bars represent standard deviation). Me, menton; Ag, antegonion; MSP, midsagittal plane. Differences in the lower-case letters indicate a significant difference between the groups. * p < 0.05, *** p < 0.001.
3.3.2. Bilateral Variation in Antegonion
Considering the significant difference in the anterior mandibular landmark, Me, with MSP in transverse measurement, we conducted a further statistical analysis of the bilateral variation for Ag (posterior mandibular landmark). There was a statistically significant difference (p < 0.05) between the right and left sides for both FH1 and FH2 groups. Despite similar patterns (right > left) of transverse measurements at Ag among all four groups, FH3 and FH4 showed no statistically significant difference.
4. Discussion
The variation in methods of defining a plane depends on the selected points while transferring the definition of a 2D plane to a 3D plane. The variations in the different FH plane definitions arise from the number of landmarks involved and the orientation preferences. However, the rationales behind the choice are either not stated or are circumstantial, thus leading to an element of contention.
Several studies have reported on such variations in the past decade. They have focused on identifying a new reference point or new horizontal plane of reference [14,20]. However, the abovementioned studies differ from the practical application of 3D CBCT analysis, one that can be adapted in a clinical setup. Researchers have drawn their conclusions using customized setups that necessitate the extraction of threshold-based stereolithographic (STL) models. This, in turn, would not be viable in a typical clinical setup [3,20]. Pittayapat et al. suggested the use of an internal acoustic foramen as an alternative landmark for superior reproducibility, compared to Po [20]. However, in contrast to their study that involved the use of dry human skulls, soft tissue interaction and the limitation of exposure dose pose challenges to the effective visualization of intracranial landmarks in a clinical scenario. Similarly, Park et al. suggested substituting the inion (tip of the external occipital protuberance) for Po, thus making it essential to capture a large FOV image, with an increase in the anteroposterior dimension [11].
We used a commercially designed software for clinics without additional customization in the acquired images or code. Furthermore, our subjects included the cases indicated for a CBCT scan, using FOV in the ethical guidelines [21] and abiding by the “as low as diagnostically acceptable” (ALADA) [22] principle.
Lonic et al. reported higher discordance and lower specificity while using alternate planes for cephalometric evaluation [14]. This suggests the importance of the FH plane and the significance of its evaluation for its basic possible permutations (FH1 to FH4). This was in agreement with our objectives.
Previous studies have also reported a similar objective to compare the influence of different horizontal reference planes in cephalometry. Santos et al. [3] compared all four definitions, FH1 to FH4, used in the present study, along with the constructed medial points. However, their study was limited to common anteroposterior measurements. In contrast, Oh et al. [12] and Yoon et al. [23] included only FH3 or FH4 and limited the comparison to the occlusal cant and landmark deviation, respectively. Pittayapat et al. [20] conducted a pairwise comparison for the absolute angular differences for the horizontal planes. However, the included planes comprised the derived landmarks, and they did not consider the standard definition (FH1). Notwithstanding the cephalometric comparison reported in the abovementioned studies, they did not report an objective assessment of the deviation between the planes (SOL), unlike the present study.
Alternate definitions for the FH plane in 3D cephalometry have often advocated the use of a median landmark for either porion or orbitale [24]. Adherence to such a definition will incorporate a constructed point, calculated based on the underlying algorithm. Thus, it will present a tendency to vary within the range of anatomical coordinates. In other words, a median-constructed landmark will offer one of the multiple possibilities of a plane within the range of the defined anatomic landmarks (Or and/or Po). The SOL comparison validates the presence of significant differences, even with anatomical landmarks. Nonetheless, we observed a good to excellent ICC for the individual landmarks. Therefore, larger possibilities of intermediary reference planes can occur in cases of higher SOL, with constructed reference points at different levels.
In addition, our study also presented and compared the SOL for the MSP formed in the individual groups. The assessment of facial symmetry while establishing a treatment plan is based on the MSP. Thus, a change in the MSP can either underestimate or overestimate the degree of asymmetry. Ras et al. recommended the use of a plane that is perpendicular to the horizontal reference plane to define the MSP [25]. A recently published study by An et al. compared the groups of MSPs constructed with and without the FH plane. It suggested using MSPs that are perpendicular to the FH plane in clinical practice [26]. The horizontal plane should be defined in reference to the MSP to reduce the dependence of the latter on the FH plane [23]. However, the deviation of the median landmarks used to define the MSP can show an inherent variation, particularly for skeletal asymmetry. Furthermore, the bilateral Po and Or are not always coplanar [27]. Hence, a horizontal reference plane based on a predefined MSP will result in a new plane, with or without the traditional landmarks (Or and Po).
Me deviation serves as a reliable marker for the assessment and surgical correction of asymmetry. This can be attributed to the close relationship between the direction of canting and deviation of the Me point [28]. In addition, it also impacts the perception of symmetry for laypersons and professionals. This calls for the need for surgical correction to restore the transverse facial balance [29]. Therefore, we used similar guidelines to measure Me deviation by keeping a constant MSP definition while altering the FH plane group-wise. However, there were significant differences in the amount of Me deviation. FH1 and FH2 showed a significantly lower deviation, which was in corroboration with the preliminary findings, thus showing no gross asymmetry. In contrast, the Me to MSP distance presented an asymmetry >4 mm in more than 5% cases while referencing FH3 and FH4. This overestimation represented a perceptible gross asymmetry of the face [30]. The findings of FH3 and FH4 were also observed by Lin et al. [9], who did not find any difference in the measurements from Me to MSP between the two reference planes. However, their study did not include FH1 and FH2. Subsequently, the researchers did not conduct an intergroup comparison, as in the present study. Both over- and underestimation of the changes in the transverse dimension can potentially affect the overall treatment plan in the case of orthognathic surgery for a functional and aesthetic correction. The similarity between the asymmetry findings for FH1–2 and FH3–4 could be argued by the way a plane is defined in 3D coordinate space, using three points and a normal vector. Thus, it can be implied that the commonality of landmarks between the planes gives similar outcomes.
In addition, measurements in FH1 and FH2 revealed a statistically significant difference in the bilateral transverse dimension from Ag. Despite the statistical insignificance of the absolute differences, the selection of either FH1 or FH2 can lead to the overestimation of the mandibular transverse width.
Our study comprised retrospective data where gross asymmetry was ruled out during the preliminary examination. However, we observed variations in the results with changes in the definition of the FH plane (FH1–4). Thus, such variations will likely also present in patients diagnosed with gross asymmetry, which in terms of clinical implication can be seen as magnified deviations from the norms. In a maxillofacial clinical practice, cephalometric measurement forms an integral tool to obtain accurate values for treatment planning. Application of CBCT data in virtual design and 3D printing also demands an accurate analysis to help the clinicians execute a precise design for appliances such as surgical splints and guides. Moreover, the variation between the FH plane definition also indicates a confounding factor when comparing reference literature based on different definitions of the horizontal reference plane.
Our study had some limitations, such as a relatively small sample size and sample selection from a single-center source. Furthermore, the presence of a nonhomogenous malocclusion cohort, racial diversity, and geographically different screening protocols can potentially affect the outcomes. However, unlike previous literature, our study did not aim to establish a new plane or suggest new reference points. Rather, it focused on the analysis of differences between the existing methods of defining the FH reference plane.
An underlying cause that induces a notable variation in 3D cephalometry could be inferred from our findings. However, it does not suffice to propose a standard methodology at this stage. Future studies with multicentric data collection are needed to make progress towards the standardization of 3D cephalometrics to ensure repeatability.
5. Conclusions
Our study objectively compared the differences between the four definitions of the FH plane using anatomic landmarks. Our findings were conclusive to reject the null hypothesis. The variations in the FH planes were significantly different from each other and in the interpretation of facial symmetry using 3D cephalometry. Future studies should focus on standardization to improve the reliability and reproducibility of 3D cephalometry.
Author Contributions
Conceptualization, J.J.H. and S.-H.C.; methodology, U.M., J.J.H., S.M.L., H.J., and S.-H.C.; validation, U.M., J.J.H., S.M.L., and S.-H.C.; formal analysis, S.M.L. and S.-H.C.; resources, Y.-H.J., B.-H.C., and J.-Y.C.; data curation, U.M., J.J.H., S.M.L., H.J., and S.-H.C.; writing—original draft preparation, U.M., S.M.L., and H.J.; writing—review and editing, J.-J.H. and S.-H.C.; visualization, U.M. and S.M.L.; supervision, J.J.H. and S.-H.C.; project administration, J.J.H. and S.-H.C.; funding acquisition, J.J.H. and S.-H.C. All authors have read and agreed to the published version of the manuscript.
Funding
This research was supported by a grant from the Korea Health Technology R&D Project through the Korea Health Industry Development Institute (KHIDI), funded by the Ministry of Health and Welfare, the Republic of Korea (grant number: HI20C0611).
Conflicts of Interest
The authors declare no conflict of interest.
References
- Madsen, D.P.; Sampson, W.J.; Townsend, G.C. Craniofacial reference plane variation and natural head position. Eur. J. Orthod. 2008, 30, 532–540. [Google Scholar] [CrossRef]
- Sievers, M.M.; Larson, B.E.; Gaillard, P.R.; Wey, A. Asymmetry assessment using cone beam ct. A class i and class ii patient comparison. Angle Orthod. 2012, 82, 410–417. [Google Scholar] [CrossRef] [PubMed]
- Santos, R.; De Martino, J.M.; Haiter Neto, F.; Passeri, L.A. Influence of different setups of the frankfort horizontal plane on 3-dimensional cephalometric measurements. Am. J. Orthod. Dentofac. Orthop. 2017, 152, 242–249. [Google Scholar] [CrossRef] [PubMed]
- Cheng, Y.; Leow, W.K.; Lim, T.C. Automatic identification of frankfurt plane and mid-sagittal plane of skull. In Proceedings of the 2012 IEEE Workshop on the Applications of Computer Vision (WACV), Breckenridge, CO, USA, 9–11 January 2012; pp. 233–238. [Google Scholar]
- Sonneveld, K.A.; Mai, P.T.; Hardigan, P.C.; Portnof, J.E. Theoretical basis for virtual skull orientation according to three-dimensional frankfort horizontal plane for computer-aided surgical simulation. J. Craniofac. Surg. 2019, 30, 1902–1905. [Google Scholar] [CrossRef] [PubMed]
- Swennen, G.R.; Schutyser, F.A.; Hausamen, J.-E. Three-Dimensional Cephalometry: A Color Atlas and Manual; Springer Science & Business Media: Berlin/Heidelberg, Germany; New York, NY, USA, 2005. [Google Scholar]
- Song, W.W.; Kim, S.S.; Sandor, G.K.; Kim, Y.D. Maxillary yaw as the primary predictor of maxillary dental midline deviation: 3d analysis using cone-beam computed tomography. J. Oral Maxillofac. Surg. 2013, 71, 752–762. [Google Scholar] [CrossRef] [PubMed]
- Cevidanes, L.; Oliveira, A.E.; Motta, A.; Phillips, C.; Burke, B.; Tyndall, D. Head orientation in cbct-generated cephalograms. Angle Orthod. 2009, 79, 971–977. [Google Scholar] [CrossRef]
- Lin, H.H.; Chuang, Y.F.; Weng, J.L.; Lo, L.J. Comparative validity and reproducibility study of various landmark-oriented reference planes in 3-dimensional computed tomographic analysis for patients receiving orthognathic surgery. PLoS ONE 2015, 10, e0117604. [Google Scholar] [CrossRef]
- Medelnik, J.; Hertrich, K.; Steinhauser-Andresen, S.; Hirschfelder, U.; Hofmann, E. Accuracy of anatomical landmark identification using different cbct- and msct-based 3d images: An in vitro study. J. Orofac. Orthop. 2011, 72, 261–278. [Google Scholar] [CrossRef]
- Park, J.A.; Ha, T.J.; Lee, J.S.; Song, W.C.; Koh, K.S. Use of the orbito-occipital line as an alternative to the frankfort line. Anat. Cell Biol. 2020, 53, 21–26. [Google Scholar] [CrossRef]
- Oh, S.; Ahn, J.; Nam, K.U.; Paeng, J.Y.; Hong, J. Frankfort horizontal plane is an appropriate three-dimensinal reference in the evaluation of clinical and skeletal cant. J. Korean Assoc. Oral Maxillofac. Surg. 2013, 39, 71–76. [Google Scholar] [CrossRef]
- Hofmann, E.; Fimmers, R.; Schmid, M.; Hirschfelder, U.; Detterbeck, A.; Hertrich, K. Landmarks of the frankfort horizontal plane: Reliability in a three-dimensional cartesian coordinate system. J. Orofac. Orthop. 2016, 77, 373–383. [Google Scholar] [CrossRef] [PubMed]
- Lonic, D.; Sundoro, A.; Lin, H.H.; Lin, P.J.; Lo, L.J. Selection of a horizontal reference plane in 3d evaluation: Identifying facial asymmetry and occlusal cant in orthognathic surgery planning. Sci. Rep. 2017, 7, 2157. [Google Scholar] [CrossRef] [PubMed]
- Nur, R.B.; Cakan, D.G.; Arun, T. Evaluation of facial hard and soft tissue asymmetry using cone-beam computed tomography. Am. J. Orthod. Dentofac. Orthop. 2016, 149, 225–237. [Google Scholar] [CrossRef] [PubMed]
- Brown, A.A.; Scarfe, W.C.; Scheetz, J.P.; Silveira, A.M.; Farman, A.G. Linear accuracy of cone beam ct derived 3d images. Angle Orthod. 2009, 79, 150–157. [Google Scholar] [CrossRef]
- Choi, K.Y. Analysis of facial asymmetry. Arch. Craniofac. Surg. 2015, 16, 1–10. [Google Scholar] [CrossRef]
- Grummons, D.C. A frontal asymmetry analysis. J. Clini. Orthod. 1987, 21, 448–465. [Google Scholar]
- Hwang, H.S.; Min, Y.S.; Lee, S.C.; Sun, M.K.; Lim, H.S. Change of lip-line cant after 1-jaw orthognathic surgery in patients with mandibular asymmetry. Am. J. Orthod. Dentofac. Orthop. 2009, 136, 564–569. [Google Scholar] [CrossRef]
- Pittayapat, P.; Jacobs, R.; Bornstein, M.M.; Odri, G.A.; Lambrichts, I.; Willems, G.; Politis, C.; Olszewski, R. Three-dimensional frankfort horizontal plane for 3d cephalometry: A comparative assessment of conventional versus novel landmarks and horizontal planes. Eur. J. Orthod. 2018, 40, 239–248. [Google Scholar] [CrossRef]
- Molen, A.D. Protocols for the use of cone beam computed tomography in orthodontic practice. In Cone Beam Computed Tomography in Orthodontics: Indications, Insights, and Innovations; Kapila, S.D., Ed.; John Wiley & Sons: Ames, IA, USA, 2014; pp. 139–164. [Google Scholar]
- Center, O.B.M. Ncrp: Achievements of the Past 50 Years and Addressing the Needs of the Future. 2014. Available online: https://ncrponline.org/wp-content/themes/ncrp/PDFs/PROGRAM_2-10.pdf (accessed on 29 September 2020).
- Yoon, K.W.; Yoon, S.J.; Kang, B.C.; Kim, Y.H.; Kook, M.S.; Lee, J.S.; Palomo, J.M. Deviation of landmarks in accordance with methods of establishing reference planes in three-dimensional facial ct evaluation. Imaging Sci. Dent. 2014, 44, 207–212. [Google Scholar] [CrossRef]
- Yatabe, M.; Gomes, L.; Ruellas, A.C.; Lopinto, J.; Macron, L.; Paniagua, B.; Budin, F.; Prieto, J.C.; Ioshida, M.; Cevidanes, L. Challenges in measuring angles between craniofacial structures. J. Appl. Oral Sci. 2019, 27, e20180380. [Google Scholar] [CrossRef]
- Ras, F.; Habets, L.L.; van Ginkel, F.C.; Prahl-Andersen, B. Method for quantifying facial asymmetry in three dimensions using stereophotogrammetry. Angle Orthod. 1995, 65, 6. [Google Scholar]
- An, S.; Lee, J.Y.; Chung, C.J.; Kim, K.H. Comparison of different midsagittal plane configurations for evaluating craniofacial asymmetry by expert preference. Am. J. Orthod. Dentofac. Orthop. 2017, 152, 788–797. [Google Scholar] [CrossRef] [PubMed]
- Pelo, S.; Deli, R.; Correra, P.; Boniello, R.; Gasparini, G.; Moro, A. Evaluation of 2 different reference planes used for the study of asymmetric facial malformations. J. Craniofac. Surg. 2009, 20, 41–45. [Google Scholar] [CrossRef]
- Kwon, S.M.; Baik, H.S.; Jung, H.D.; Jang, W.; Choi, Y.J. Diagnosis and surgical outcomes of facial asymmetry according to the occlusal cant and menton deviation. J. Oral Maxillofac. Surg. 2019, 77, 1261–1275. [Google Scholar] [CrossRef] [PubMed]
- Thiesen, G.; Gribel, B.F.; Freitas, M.P.M.; Oliver, D.R.; Kim, K.B. Mandibular asymmetries and associated factors in orthodontic and orthognathic surgery patients. Angle Orthod. 2018, 88, 545–551. [Google Scholar] [CrossRef]
- Thiesen, G.; Gribel, B.F.; Freitas, M.P. Facial asymmetry: A current review. Dent. Press J. Orthod. 2015, 20, 110–125. [Google Scholar] [CrossRef]
Publisher’s Note: MDPI stays neutral with regard to jurisdictional claims in published maps and institutional affiliations. |
© 2020 by the authors. Licensee MDPI, Basel, Switzerland. This article is an open access article distributed under the terms and conditions of the Creative Commons Attribution (CC BY) license (http://creativecommons.org/licenses/by/4.0/).