Article

A Study on Data Pre-Processing and Accident Prediction Modelling for Occupational Accident Analysis in the Construction Industry

1
Department of Safety Engineering, Incheon National University, Incheon 22012, Korea
2
Research Institute for Engineering and Technology, Incheon National University, Incheon 22012, Korea
3
School of Civil, Architectural Engineering and Landscape Architecture, Sungkyunkwan University, Gyeonggi 440-746, Korea
4
Department of Fire Administration and Disaster Management, Dong-Eui University, 176 Eomgwang-ro, Busanjin-gu, Busan 47340, Korea
*
Authors to whom correspondence should be addressed.
Appl. Sci. 2020, 10(21), 7949; https://doi.org/10.3390/app10217949
Submission received: 14 October 2020 / Revised: 6 November 2020 / Accepted: 9 November 2020 / Published: 9 November 2020
(This article belongs to the Special Issue Artificial Intelligence Technologies for Structural Health Monitoring)

Abstract

:
In the construction industry, it is difficult to predict occupational accidents because various accident characteristics arise simultaneously and organically in different types of work. Furthermore, even when analyzing occupational accident data, it is difficult to deduce meaningful results because the data recorded by the incident investigator are qualitative and include a wide variety of data types and categories. Recently, numerous studies have used machine learning to analyze the correlations in such complex construction accident data; however, heretofore the focus has been on predicting severity with various variables, and several limitations remain when deriving the correlations between features from various variables. Thus, this paper proposes a data processing procedure that can efficiently manipulate accident data using optimal machine learning techniques and derive and systematize meaningful variables to rationally approach such complex problems. In particular, among the various variables, the most influential variables are derived through methods such as clustering, chi-square, Cramer’s V, and predictor importance; then, the analysis is simplified by optimally grouping the variables. For accident data with optimal variables and elements, a predictive model is constructed between variables, using a support vector machine and decision-tree-based ensemble; then, the correlation between the dependent and independent variables is analyzed through an alluvial flow diagram for several cases. Therefore, a new processing procedure has been introduced in data preprocessing and accident prediction modelling to overcome difficulties from complex and diverse construction occupational accident data, and effective accident prevention is possible by deriving correlations of construction accidents using this process.

1. Introduction

In recent decades, various industrial safety management systems have been introduced and improved upon; however, occupational safety remains unstable and low. In particular, in the construction industry, various fields and types of work are undertaken simultaneously and organically, and a wide range of hazard factors are present. Thus, safety management in the construction industry is difficult, owing to the complexity of numerous activities and the involvement of various entities [1]. Moreover, most of the work is performed by humans; hence, techniques to predict occupational accidents through simple correlations—and thereby establish safety measures to prevent them—are limited. Thus, extensive research has been conducted over the past decades to increase the safety performance of construction sites. In 2002, Hinze conducted a study to improve the safety performance of and incentives for minimizing injuries on construction sites [2]; then, in 2005, Chi et al. analyzed the correlations of factors contributing to different types of falls [3]. In 2008, Choudhry et al. analyzed fundamental safety factors through a questionnaire, based on the practical abilities of construction safety experts to ensure site safety, and they proposed measures to improve safety in the industry [4]. However, the existing literature on safety improvement methods is limited in certain respects. For example, the concept of occupational safety at construction sites was not well defined at an early stage; thus, the data collected were not sufficient to identify accidents. Furthermore, the dynamic characteristics of construction projects have not been adequately reflected in most studies, and because most of the developed models did not rely on empirical data, they could only be applied to limited cases.
After that, to overcome the problem of insufficient data, numerous studies have been conducted using the previous occupational accident data, including more detailed accident information. For example, in 2009, Jacinto et al. argued that injury data-based industrial accident analysis has focused on identifying common causes of occupational accidents to design appropriate preventive measures [5]. In 2011, Vidal et al. applied a dataset complexity reduction method to simplify the process of understanding the occupational accident data [6]. In 2014, Matsunaga et al. applied various technologies such as machine learning (ML) and big data analysis (including data statistics and data mining) to analyze occupational accident data [7]. In 2019, Sarkar et al. considered the importance of standardizing accident data prior to analyzing construction accident data [8]. As described above, the analysis of occupational accidents in the past was mainly performed through descriptive statistical methods [9], but recently, it has been developed into accident prediction studies applying various ML analysis methods to accident data. Even with traditional statistical methods, advanced analysis can be performed using large datasets, to identify hidden patterns in the data [10]. However, many studies have shown that when comparing traditional statistical models with ML methods, the latter is superior in predicting future events [8]. Thus, disaster and occupational accident analyses have been performed across various fields using ML methods. Typical ML-based classification algorithms include decision trees (DTs), artificial neural networks (ANNs), extreme learning machines, Bayesian networks, and support vector machines (SVMs) [11]. More specifically, ANNs [12,13,14], SVMs [15,16], and DTs [17,18,19,20] suitable for prediction rather than other ML methods have been used as the main prediction methods of occupational accident. ANNs generally provide better results than conventional, simple classification techniques. However, because this approach is a black-box technology, it is difficult for humans to interpret, hence it is difficult to identify the correlations between variables in the accident data [21]. SVMs have attracted considerable attention owing to their capacity for self-learning and their high generalization ability [22]. Sánchez et al. used SVMs to classify workers suffering from work-related accidents over the course of a year. Their data consisted of 11,054 responses received from workers employed across a wide range of economic activities in Spain, and their results show that SVMs outperform backpropagating neural networks without encountering overfitting problems [23]. However, SVMs use a long trial-and-error process to determine an appropriate kernel function [21], have a high level of algorithmic complexity, and require extensive memory [24]. DTs have gained popularity as a powerful classification algorithm that is transparent and easily interpretable [25]; they are mainly used for their ability to analyze quantitative and qualitative patterns of data to search for hidden information [8].
Among the various DT-based classification algorithms, boosting has come to be regarded as one of the most important advances in ML over the past 20 years, because it can convert an ensemble of weak classifiers into powerful ones [26]. Boosting is an ensemble approach that combines many weak learners to generate predictions [27]. Previous studies have found the boosting method superior to other competing methods (including DT, ANN, and SVM) in terms of predictive performance, even when the dataset is defective and small [28,29]; furthermore, it offers considerably greater applicability than competing techniques, owing to its single parameter [30]. DT instabilities can be overcome by a boosting approach; that is, by growing a forest of DTs and performing multiple verifications of a given tree’s classification result [31,32]. With these advantages, DTs have been successfully applied in a variety of research fields, including medicine [33], social sciences [25], business management [34], construction engineering and management [35], and process industry [36]. Table 1 summarizes the latest research trends in the prediction of construction accidents using occupational accident data; here, as in other fields, ANN-, SVM-, and DT-based ensemble methods have been applied [1,8,37,38]. In accordance with the research findings in various fields and the latest trends in construction accident research, this study applied SVM- and DT-based ensemble methods, because they are more suitable for classifying and predicting construction accident data.
Many researchers have conducted analysis studies across numerous fields using various past accident data; however, several limitations have been found in the analysis of occupational accident data. First, the individual and subjective opinions of the person who prepares the occupational accident report are reflected in the data; therefore, it is difficult to process and reflect the characteristics of the occupational accident data in the construction industry, which are created without a composition procedure and include many types of variables and values [1]. Second, the structure of occupational accident data includes mixed variables (e.g., numerical and categorical text representations) and absent information. These numerous variable types, along with the composition of many categories, create difficulties and ambiguities in interpreting the results with data elements; as a result, only limited correlations can be derived between variables [8]. The following conclusions can be drawn from the existing research results. Numerous types of variables and values are present in the occupational accident data, which makes it difficult to process data, reflect characteristics, and interpret correlations. However, if the variables are excessively reduced, their characteristics are lost, and meaningful conclusions cannot be drawn. Therefore, the types and ranges of values for suitable variables must be standardized to properly utilize data containing more construction accident information. Moreover, a process that can easily capture construction accident trends must be established, and a prediction method capable of learning from past accidents to minimize the risk of future ones is required.
The previous accident analysis has the disadvantage of evaluating a single dependent variable by a single independent variable, and it is only predicting one dependent variable (severity, etc.) with data written qualitatively and subjectively. The purpose of this study is to overcome this and derive a correlation between objective variables without alternatively manipulating the data, and to establish an accident prediction model through this, and to establish accident prevention measures. Therefore, we propose an optimized data preprocessing method to minimize the major variables and elements in diverse and complex occupational accident data, and we construct an ML prediction model to achieve this. Furthermore, correlation analysis is conducted via an alluvial flow diagram. Finally, accident concept analysis—employing clustering and visualization through principal component analysis (PCA) of the relationships between major variables—is used to provide more extensive conclusions.

2. Materials and Methods

The procedure applied in this study consisted of four steps, as shown in Figure 1; here, each step included further details on the segmentalized procedure. In the first step, the elements of the occupational accident data (subjectively and qualitatively prepared beforehand) were standardized into similar elements, and an initial dataset containing 16 variables and 21 elements was constructed. In the second step, the first data preprocessing step reduces the variables via four methods: latent class cluster analysis (LCCA), chi-square, Cramer’s V, and predictor importance; from the results of these four methods, seven variables were selected. In the third step, a second data preprocessing step was performed, to reduce the elements in the variables. Three variables contained more than ten elements; thus, their severity was predicted by the ML method while decreasing the number of elements. The optimal number of elements was determined by comparing the maintenance of the prediction performance, and a final dataset was constructed. In the fourth step, correlation analysis between variables, using the final dataset; detailed analysis of the grouping of clusters; and visualization analysis through PCA were performed. The correlations of input variables were analyzed by varying the output variable using the final dataset; the correlations of all variables were analyzed using the alluvial flow diagram for the major output. Next, detailed analyses for each group were conducted by grouping the final dataset using LCCA. Finally, the severity levels were visualized using the three major variables extracted by PCA.

2.1. Initial Data and Data Description

The occupational accident data used in this study were collected from the database of the safety management system of a large construction company in Korea, for the period from 2015–2020; in total, 963 occupational accident data entries for the construction site were used. Since there are some studies using similar or small data in previous studies for accident analysis and prediction, the number of samples in this study is judged to be sufficient for machine learning [1,39,40]. However, the initial occupational accident dataset included too many factors, as well as over 130 occupational categories, and over 400 assailing materials. When an occupational accident occurs, the person in charge of writing the accident information differs between construction sites, and because the information is qualitative and subjective, the same content can be expressed differently owing to the non-systematic manner of information entry. Therefore, after checking terms used as standard or general from the Occupational Safety and Health Administration (OSHA) in the USA, Health and Safety Executive (HSE) in the UK, and Korea Occupational Safety and Health Agency (KOSHA) in Korea, we standardized the elements and preprocessed them with similar ones, to reconstruct the occupational accident data. The reconstructed initial dataset consisted of 16 variables (14 categorical and two binary), and they are the same as or similar to variables in other studies [1,8]. Here, the terms that are not generally defined are written for easy understanding. Brief descriptions of each variable are presented in Table 2.
(i) Type of work (TW): This variable represents the victim’s job role at the construction project. It consists of 15 elements: “carpenter,” “painter,” “scaffolder,” “stonemason,” “safety officer,” “welder,” “equipment operator,” “electric piping equipment worker,” “landscaper,” “window worker,” “structural steel/steel frame worker,” “concrete worker,” “tunnel worker,” “earth worker,” and “woodworker.”
(ii) Type of accident (TA): This indicates the type of accident that the victim suffered. It consists of ten elements: “jamming,” “fall down,” “fall off,” “hit,” “collapse,” “struck,” “imbalance and uncontrolled motion,” “occupational diseases,” “mutilation/cut/puncture,” and “fire/explosion/blast.”
(iii) Injured part (IP): This refers to the part of the body that received the injury. It consists of 12 elements in total: pelvis, ear, eye, leg, multiple head location, foot, hand, brain, mouth, nose, arm, and chest/abdomen.
(iv) Assailing material (AM): This variable is a standard used by the Korea Occupational Safety and Health Agency (KOSHA); it refers to the substance directly responsible for causing harm to the victim. In this study, a total of 21 elements were considered: “formwork/shores,” “construction and mining machinery,” “stair and ladder,” “metal fine particles/trace elements/dust/fumes,” “other buildings/structures/etc.,” “end portion and opening,” “fauna and flora,” “floor and ground/etc.,” “scaffolding and work plate,” “equipment,” “machinery parts and appendages,” “hand tool nonpowered,” “container and pack,” “transporting,” “lifting equipment,” “machinery,” “land transportation,” “manpower machinery,” “processing equipment/machinery,” and “natural phenomena” (e.g., working environment and atmospheric conditions), “material,” “electrical equipment/parts,” “debris/garbage,” and “hand tool powered.”
(v) Cause of accident (CA): This indicates the cause of the accident and contains seven factors: “unsafe work,” “lack of personal protective equipment,” “facility defect/collapse,” “lack of safety measures,” “work equipment defect,” “carelessness,” and “third-party liability.”
(vi) Severity: This represents the accident’s severity categorization, based on the risk assessment criteria used by OO Construction in Korea. It is divided into three stages: Level 1 (“slight injury”) describes a minor injury, including ligaments and fractures; Level 2 (“serious injury”) includes fractures of critical areas (face, chest, and abdomen); and Level 3 (“fatal injury”) includes critical-area fractures requiring surgery and permanent disabilities caused by problems such as damage to the five senses (vision, hearing, etc.). These severity criteria were a classified list of personal damage in Korea (steps 1–14). Steps 1–7 are classified as fatal injury, steps 8–14 are serious injury, and other injuries are slight injuries.

2.2. Data Preprocessing

Data preprocessing is an essential task in data mining and has been reported to consume (on average) more than 60% of the total effort of the entire process [41]. In particular, because construction accident data include numerous variables and types of values, the dataset must be preprocessed or standardized before analysis; otherwise, the presence of outliers, omissions, and term inconsistencies in the data makes interpreting the analysis results difficult; this renders the trends incomprehensible and can thereby produce misleading analysis results. Furthermore, when reducing variables and elements to facilitate meaningful interpretations, data preprocessing must be performed by cross-comparing several methods instead of one.

2.2.1. Latent Class Cluster Analysis (LCCA)

LCCA is an unsupervised learning algorithm based on a probability model [42]; it sorts data with similar properties into potential clusters, by classifying them into maximally heterogeneous data groups. It analyzes the complex interrelationships between the observed variables and applies these to a comprehensive dataset irrespectively of the data type (categorical, binary, or continuous), to derive maximum heterogeneity [43]. To determine the number of clusters in LCCA, the optimal number of layers is first determined by analyzing various statistical criteria (i.e., the Akaike information criteria (AIC), Bayesian information criteria (BIC), and consistent AIC (CAIC)) and the entropy R-squared value. The more constant the statistical criteria values are, the larger the entropy R-squared value, and the more appropriate the potential grouping [44]. In this study, LCCA was first used as a form of contribution analysis between variables; then, it was used to conduct a detailed analysis of the construction accident data.

2.2.2. Chi-Square Test

The chi-square test analyzes categorical data by using the chi-square distribution to verify the significance of the observed and expected frequencies. It is primarily used to verify the goodness of fit, homogeneity, and independence of the data [8]. The chi-square test is used when comparing the distributions of individual groups; and the independence test determines whether a dependency exists between the two characteristics of the data. In this study, the chi-square test was compared in 16 cases with one dependent variable and 15 independent variables, and a variable with a p-value of 0.05 or less was used to select the main variable.

2.2.3. Cramer’s V test

The chi-square test increases in proportion to the number of rows and columns in the contingency table; however, it is limited in that relative comparisons are difficult. Cramer’s V test is a new test method derived from the chi-square test. A value closer to 1 in the positive range (0,1) signifies the greatest relevance [45]. Cramer’s V test was performed in the same way as the chi-square test, and was used as one of the common major variable extraction methods.

2.3. Machine Learning (ML)

2.3.1. Support Vector Machine (SVM)

An SVM, proposed by Cortes and Vapnik (1995), is a statistical supervised learning algorithm; it was initially developed for regression work but was later applied to linear and nonlinear classification. In an SVM, the hyperplane that marks the boundary in the dataspace is trained to maximize the distance to the nearest data [22]. SVMs can achieve a higher performance in classification and regression problems than other statistical and ML techniques; this is because, unlike existing ML techniques (which are prediction methods based on probability estimation), they do not directly estimate probability but only predict classification results. The most important element of constructing an SVM model is setting the appropriate parameters [23]. When inappropriate parameters are set, the prediction accuracy can drop sharply, or problems of inability can arise due to overfitting [21]. Furthermore, when it becomes difficult to classify data within a limited dimension, the SVM can map data to a higher-dimensional space and classify them using a kernel function. This kernel function performs a dot product operation to prevent the computation requirements (which are proportional to the dimensions of the data) from increasing; examples include linear, radial basis, and order polynomial functions.

2.3.2. Ensemble

The ensemble method guides a final learner to derive the optimal result by combining existing weak learners; bagging (bootstrap aggregating) and boosting are representative examples of such methods. The bagging method creates several partial datasets by sampling the test dataset, and it derives the final, optimal result by combining the results of weak learners trained for each partial dataset. The boosting method goes beyond the bagging method and sequentially assigns weights to the misclassified data using the results of weak learners in the partial dataset to learn the next weak learner and derive the result [27]. In this study, a DT was used as a weak learner, and the LSBoost (Least-Square Boost) method was used to reflect the weights of misclassified data. Misclassification can be compensated for by implementing a weight equal to the current misclassification in the partial dataset of each step in the sequential training process in the next dataset [31,32]. In addition, in this study, it was used to predict the dependent variable and to analyze the contribution of independent variables that contribute to the dependent variable during prediction.

2.4. Principal Component Analysis (PCA)

PCA expresses independent variables as principal components through a linear combination. It selects the axis containing the eigenvector featuring the largest variance (which is the principal component in three dimensions or higher) and plots it in a lower dimension while preserving the characteristics of the data as much as possible. PCA was first proposed by Pearson (1901) and subsequently developed by Hotelling (1936) and Jolliffe to establish a modern theory [46,47]. PCA derives the covariance matrix of the existing dataset and calculates the eigenvector V and eigenvalue λ. Through this, the eigenvector with the largest variance is used and analyzed as the main axis. However, in some cases, an eigenvector with a large variance does not necessarily indicate a high degree of division in the data. In this study, PCA was used to visualize categorical data and predict severity.

3. Results and Analysis

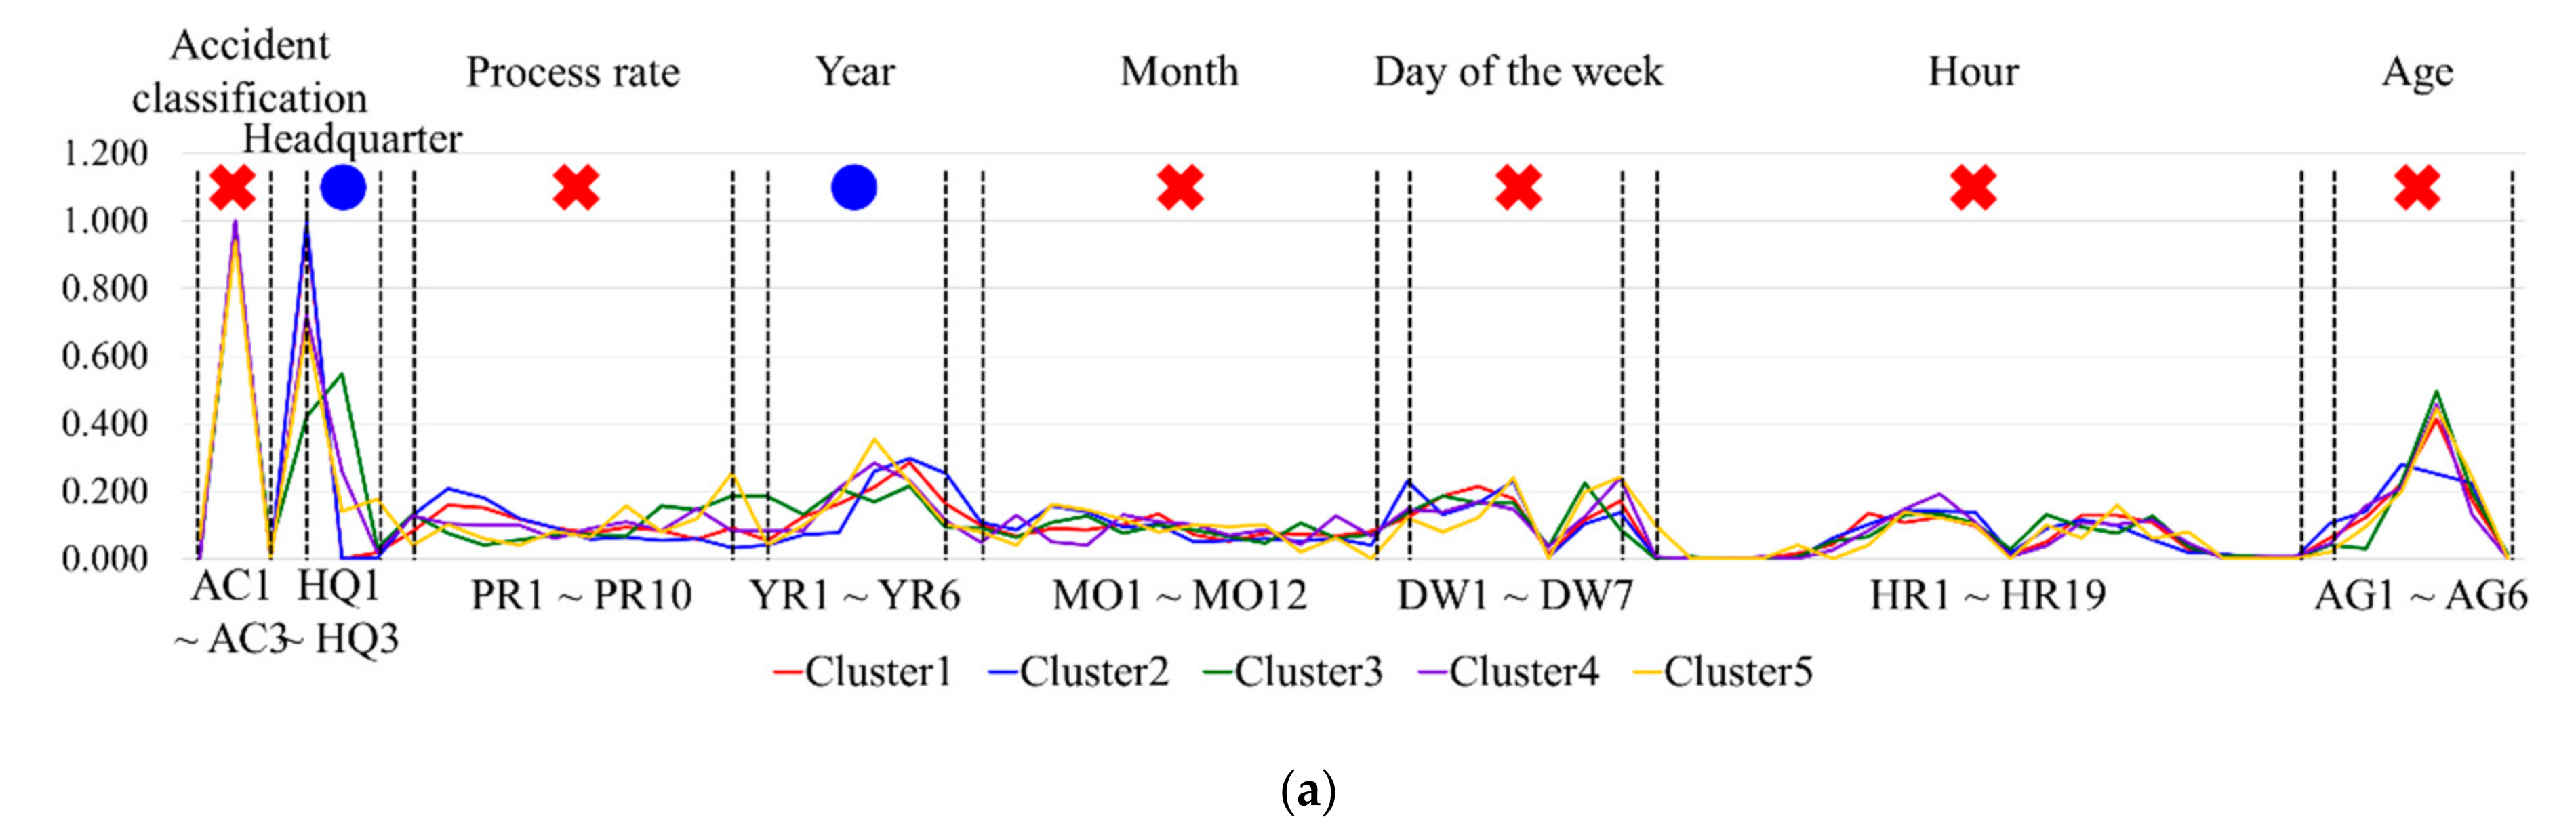
3.1. First Data Preprocessing for Selection of Major Variables

Since it is difficult to perform meaningful analysis by simply predicting construction accident data including various variables and elements with ML methods, the standardization and preprocessing of data are essential. Therefore, the first data preprocessing was carried out to derive the main variables that have a major influence on the construction accident. First, LCCA was conducted using XLSTAT (2020) software, to select key variables in the construction accident data. Datasets containing both binary and categorical variables were used for the analysis because the type of data does not affect LCCA implementation. Furthermore, LCCA was first applied as a data preprocessing method, because it can group without specifying a separate target. First, grouping was conducted by increasing the number of clusters from 1 to 10, to determine the optimal number for classifying accident data. Then, the statistical values of BIC, AIC, and CAIC and the entropy R-squared (indicator) values were checked, to determine the optimum number of clusters; the most suitable way to determine this number is to observe the decrease in BIC, AIC, and CAIC and select the point at which the value remains stable after a certain point. The AIC value decreased as the number of clusters was increased; however, the BIC and CAIC values began to stabilize after the number of clusters reached 5. The entropy R-squared value was used as another control criterion. R values close to 1.0 indicate the importance of the model. However, large multivariate datasets generally tend to become more important when the number of clusters increases, owing to the high level of heterogeneity; thus, they play an ancillary role in determining the optimal model. After dividing the data into 1 to 10 clusters, we found that when the number of clusters was 5, the BIC value was 18,500, the CAIC value was 17,800, and the entropy R-squared value began to stabilize at 0.93. Therefore, the appropriate number of clusters was determined to be 5.
Figure 2 shows the results of dividing the initial dataset into five clusters. Eight variables (e.g., accident classification, process rate, and month) included in the five clusters at the same rate did not affect grouping; therefore, they were excluded from the major variables, and nine variables showing differentiation from other cluster groups were selected. When using the variables selected by LCCA in the first data preprocessing step (i.e., headquarter, year, type of work, type of accident, injured part, workplace, assailing materials, cause of accident, and severity), it was found that the construction accident data could be grouped more accurately using five clusters.
Although LCCA was able to select nine major variables [1], the reliability of extracted major variables can be increased if a common one is selected using various methods rather than selecting them using only the results of one method. Therefore, the predictor importance and the independence of variables were calculated using the chi-square, Cramer’s V, and ML methods, which are generally used to calculate the independence of variables and identify highly correlated variables in text and categorical data analysis. The relationships between variables in the accident data were analyzed. From the 16 variables, one was used as the output, and the remaining 15 were used as inputs, to find the most important variables. Variables that contributed to the predicted output for 16 cases were found to be generally similar, and Table 3 shows the severity results for the predictions. Among the 15 input variables predicting severity, six that were used by all four methods were included among the eight most significant variables. The selected variables were year, type of work, type of accident, injured part, assailing materials, and cause of accident; in total, seven variables (including severity) were determined to exhibit a strong correlation.

3.2. Second Data Preprocessing for Reduction of Elements

Through the first data preprocessing stage, 16 variables from the initial dataset were reduced to seven important ones. However, because there were up to 13 elements under each variable, numerous elements remained, which made it difficult to interpret the construction accident data and identify trends. Therefore, the second data preprocessing step was performed, to reduce the number of elements while preserving the data characteristics as much as possible; in this step, the elements showing similar trends in the type of work, injured part, and assailing materials variables (which each contained more than ten elements) were standardized and reduced down to 5–6 elements. Among the ML methods, the severity was predicted for eight cases using the SVM and the DT-based ensemble method which were reported to be more suitable for the analysis of construction accident data [8], and this was performed to find the minimum number of elements that maintains the prediction accuracy.
In previous studies, the injury types (bruise, ligament injury, fracture, etc.) were included to predict severity [1,8,37]. However, since most severity levels are determined based on the injury type, there is a very large correlation between the two. In this study, it was confirmed that the prediction including variable of the injury type has high accuracy and low bias as in previous studies. However, since this study aims to extract and optimize the main variables through a simple method and to confirm the correlation between the variables through the alluvial flow diagram, variables of the injury type that significantly weaken the contribution of other variables were excluded. Therefore, because the variable having the greatest relationship with the severity is excluded, the predictive performance may be lower compared to previous studies.
Table 4 shows the severity prediction results for eight cases, obtained using ensemble- and SVM-based methods. The nested cross validation (CV) was applied for the purpose of minimizing the bias of the prediction result due to overfitting in training and verification of ML. The SVM predicted severity with high accuracy prior to the nested CV, though it showed low accuracy afterward. These results are thought to be a more generalized result by the nested CV.
In the ensemble method, the errors before and after nested CV were small, and relatively minimal overfitting was predicted to occur compared to the SVM model. In the nested CV prediction results for eight cases, the ensemble method was predicted to achieve a ~10% higher accuracy than the SVM method, and it was found to be more suitable for datasets containing a variety of variables and elements. When predicting severity by reducing the elements of a variable, we found that if all three variables were reduced, the ensemble method showed an accuracy of 67.29%, only ~3% lower than the case without reduction. This indicates that the characteristics of the data did not change significantly. Therefore, reducing the elements in the data made it easier to analyze the accident data and identify trends, and it simplified the analysis of complex data in which correlations are difficult to find.
A final dataset—featuring seven variables and a maximum of ten elements—was formed by selecting the major variable through the first data preprocessing stage and standardizing the elements through the second one. Similar results were obtained when selecting each of the seven variables as outputs and predicting using ML; thus, we concluded that this final dataset was valid.

3.3. Prediction of Various Dependent Variables

In the second data preprocessing stage, the injured part was expected to strongly correlate with the severity prediction; in some cases, the prediction accuracy was significantly lowered when elements of other variables were simultaneously changed. Therefore, the correlations between variables were analyzed because some variables may be highly influential among the seven variables. In addition, an analysis was conducted to confirm the predictability of other variables, instead of simply predicting the severity of the seven variables. Correlation analysis was performed through ensemble-based prediction and predictor importance calculation because the ensemble method is more suitable than the SVM for the data in this study. Similar to the first data preprocessing step, seven predictions were made with one variable as an output and the other as an input, and the accuracy, precision, recall, and F1 score were calculated as reliability indicators; the results are presented in Table 5.
In general, the proportions of element data in the output are similar; furthermore, when analyzing two elements, the accuracy was used to evaluate the model performance. However, because this study’s occupational accident data contained variables with more than five elements, it was difficult to accurately evaluate the model reliability using accuracy alone. Therefore, the F1 score was calculated and analyzed, and the developed model’s reliability evaluation results are presented in Table 5. Here, for each element, a true positive (TP) denotes a value that correctly predicts the correct (actual) result, a false positive (FP) denotes a value that incorrectly predicts the correct (actual) result, and a false negative (FN) is a value that incorrectly predicts the wrong (non-actual) result. The precision was calculated using Equation (1) for the TP and FP in each class, and the recall was calculated using Equation (2) for the TP and FN in each class. After that, the average precision and recall were calculated using Equations (3) and (4), and the F1 score was calculated using Equation (5).
P r e c i s i o n =   T P / T P + F P
R e c a l l =   T P / T P + F N
A v e r a g e   P r e c i s i o n = P A + P A D + P C + P C D / 4
A v e r a g e   R e c a l l = R A + R A D + R C + R C D / 4
F 1   Score   =   2   ×   A v e r a g e   P r e c i s i o n   ×   A v e r a g e   R e c a l l A v e r a g e   P r e c i s i o n + A v e r a g e   R e c a l l
In the SVM and ensemble predictions with the nested CV, the accuracy of most results exceeded 50%; however, in the predictions for year, the accuracy was relatively low. This was not expected to correlate strongly with the variables used as the other inputs. The F1 score—which represents the harmonic average of precision and recall—measured most output scores considerably lower than their accuracy scores. This is because the data were concentrated on certain elements when predicting elements lower than the output variable; furthermore, because of the nature of the algorithm, the prediction method may have been more concentrated on variables with considerable data. However, in the case of severity, the accuracy and F1 score values were very similar; the injured part was predicted with six elements but showed a tendency to decrease slightly compared to other variables. Although it did not achieve high accuracy in predicting various outputs, predictions were possible to some extent, and because separate correlations may exist between variables and elements, a detailed analysis of each output was conducted.

4. Discussion

4.1. Correlation Analysis between Variables

In most previous studies, simply predicting one dependent variable with ML or analyzing the relationship between one dependent variable and the remaining independent variables through chi-square test [8,37,48]. Moreover, current studies of causal inference have been performed by a complex algorithm [49,50], so reasonable inference results have not effectively been applied to qualitative and subjective accident data in construction field. Preferably, it may be more appropriate to analyze it in stages rather than an algorithm that solves everything at once. Separate preprocessing requires less computational cost and effort because it can pre-filter more data to select and use major variables. The major variables can be managed in advance, enabling efficient data management. Thus, the proposed model can extract major variables in an easy and simple way for many types of data written on qualitative and subjective judgments and predict accident outcomes.
Figure 3 compares the contributions of input variables to the output predicted by the ensemble method. By predicting the output, variables that strongly contribute to the prediction can be identified. Variables with large contributions vary according to the predicted output, and variables with larger predicted contributions indicate greater correlations. When the severity was predicted, the injured part and type of accident were found to correlate strongly; when the injured part was predicted, the severity and type of accident were found to correlate strongly. Thus, it can be seen that strong correlations exist between some variables, though not all.
Although Figure 3 clearly shows the contributions of input variables to individual outputs, it does not clearly show the overall relevance. Therefore, network analysis results are schematically illustrated in Figure 4 to clarify the relationships between variables. The arrows indicate the direction of the contribution, and the line thickness indicates its magnitude. Large correlations are observed between the type of accident and assailing materials, cause of accident and injury site, and injured part and severity. As such, it has been confirmed that there is a separate correlation between the major variables having a large relationship in the occurrence of construction accidents, and it needs to be utilized to prevent construction accidents through correlation analysis.

4.2. Correlation Analysis between Elements

In order to apply the accident analysis results to the safety measures at the construction site, it is necessary to pay attention to the correlation between variables contributing to the accident, rather than simply increasing the prediction accuracy [37,48].
Correlations between variables can be analyzed through contribution and network analyses; however, these analyses struggle to capture the correlations between the elements included in the variables. Therefore, in Figure 5, a detailed correlation analysis is shown for the top three variables in terms of F1 score (severity, injured area, and type of accident, respectively) using an alluvial flow diagram; these three variables strongly contributed to predicting the type of accident. The trends of correlation contribution to the type of accident show that injuries on the outside of the upper body occurred mostly as a result of “fall down” due to “heavy non-fixture” or “light non-fixture (equipment),” or due to the “carelessness” of the victim. Here, it is thought that such accidents can be prevented if workers who work “heavy non-fixture” or “light non-fixture (equipment)” are aware of accident cases through pre-work education.
Figure 6 shows an alluvial flow diagram for the type of accident and severity, which both contribute strongly to the prediction of the injured part. Overall, serious injuries were found to occur most often due to “fall off” and “fall down” accidents; it can also be seen that injuries occurred to the outside of the upper or lower body. The most fatal injuries are seen to occur as a result of falling accidents, and injuries to the face or upper body were most common. By analyzing these overall trends, we expect to be able to reduce the occurrence of accidents by providing customized safety training and safety protection equipment to workers in high-risk roles.
The variables that primarily contribute to severity prediction are year, type of accident, and injured part; the alluvial flow diagram for these factors is shown in Figure 7. In the relationship between year and type of accident, “fall down” can be seen to be the most prevalent accident across most years, followed by “fall off.” The most frequently injured areas were the outside of the upper and lower body, and most of these were found to suffer from serious or slight injuries; fatal injuries were most frequently caused by lower-body injuries due to falling accidents. Moreover, a strong correlation was confirmed between fatal injuries and accidents in which the victim’s head was hit by an object.
The correlations were analyzed for variables with large correlations when the output was found to differ in the alluvial flow diagram. Through the two data preprocessing steps, the complexity of the initial construction accident data was resolved, and the correlations of construction accidents could be readily understood through the alluvial flow diagram using variables with a large correlation to the output. Through this, we expect to be able to help prevent construction accidents, provided appropriate safety measures are established for the specific accident types. However, in alluvial flow diagram analysis, identifying detailed trends can be difficult because the flow of the previous variable is integrated with the next. Therefore, detailed analysis was carried out, by grouping the final dataset via the LCCA used in the first data preprocessing step.

4.3. Analysis of Other Major Variables Influencing Severity

4.3.1. Grouping with LCCA

LCCA can be used to identify data trends via detailed analysis of the major elements included in the group; it can also select major variables by identifying variables that heavily contribute to grouping, similar to the first data preprocessing stage. Advantageously, this method can capture the flow when two or more variables that are difficult to represent in the alluvial flow diagram are connected. The five attributes that are most influential in the differentiability of clusters are presented in Table 6, which summarizes the ratio between the total number of observations in the dataset and the specified cluster. Each cluster can be grouped by clustering objects with high similarity according to the similarity of seven variables out of 963 objects. In the previous study, there is a limitation in selecting the variable by applying LCCA only to binary variables with two elements. However, in this study, LCCA was applied to categorical variables with many elements [1].
Cluster 1 includes data elements such as “permanent fixture” (under assailing material), “fall down” and “fall off” (under type of accident), outside of the lower body (under injured parts), and “serious injury.” Cluster 2 includes data on “hit” and “struck” accidents (under type of accident), “third-party liability” (under cause of accident), “heavy non-fixture” (under assailing material), and outside of the upper body. Occupational accident data in the construction industry can be distinguished through the selection of differentiated elements between clusters. However, influential elements in each cluster can be partially duplicated in other clusters. For example, Clusters 1 and 4 contain falls as a major attribute among the types of accident; however, they are otherwise differentiated in terms of injured part and severity. By their nature, construction accidents can be affected by numerous variables, and identifying trends may be difficult; however, accident data can be grouped by the relationships between other influential attributes. The construction accident concept of each cluster, using the influential attributes in Table 6, are defined and presented in Table 7.
In Table 7, Cluster 1 includes the “fall down” and “fall off” accidents that result in serious injury to the outside of the lower body from a “permanent fixture.” Cluster 2 includes cases of injury to the outside of the upper body due to “hit” accidents caused by a “heavy non-fixture.” Cluster 3 includes cases of injury to the outside of the upper body whilst using a “light non-fixture (equipment)” or “portable tool.” Hence, each cluster contains the types of accidents that occur most frequently in the construction industry, and their proportions are also similar. By grouping construction accident data, we can quantitatively verify the existing empirical knowledge of construction managers, and we anticipate that construction site safety can be improved by establishing appropriate safety measures for the different types of construction accidents.

4.3.2. Visualization with PCA

In general, the PCA method selects a major variable that can be easily used to classify data, by finding a variable with a large influence across many variables and utilizing it to reduce the dimensions of the variable. PCA primarily uses numerical data [51]; categorical data are difficult to use because they do not have separate numerical values according to the variables and items. In a study that applied PCA based on the construction industry survey data, scores were set for each item and used to conduct PCA and reduce dimensions using numerical values [38]. In this study, four methods were used to identify major variables; then, PCA was applied as a visualization method rather than a dimension-reduction one. To visualize the severity level, which was the variable with the highest predictive accuracy as determined through ML analysis, the major variables (e.g., year, type of accident, and injured part) were used as PCA data. The character-type categorical data were converted into numeric-type categorical data and utilized. Figure 8 shows the results of PCA using three variables, and each data point is displayed in red, blue, and light green, depending on the severity level. By plotting the major variables through PCA, the severity levels can be distinguished relatively clearly. Moreover, it can be seen that the severity level is classified by the injured part (PC3) rather than the year (PC1) or type of accident (PC2); this shows that the variable most strongly correlated with severity in the correlation analysis is the injured part. In other words, it is possible to predict the severity through PCA classification using three major variables.
In this study, in order to overcome the limitations of the current accident data processing, the correlation between major variables derived from occupational accident data was constructed by various ML algorithms and new data process procedure. In previous studies, only one method was used to select major variables, whereas, in this study, four methods were used to select the main variables. Next, there is a difference in selecting an optimized element at a point where prediction accuracy is maintained using the ML method. In addition, for accident analysis currently used in the field, risk assessment is the most representative method, mainly to derive hazard factors based on experience, to calculate severity by intensity and frequency, and to prepare countermeasures. However, this method of this study is a case analysis using the result of accident prediction analysis for each variable of accident data, which is more suitable for actual accidents. Through the correlation between the major variables identified in this study, various construction accident data can be used to establish more practical accident prevention measures by constructing an accident prediction model.

5. Conclusions

In this study, an efficient data preprocessing technique and ML application were developed to analyze occupational accident data in the construction industry, where it is difficult to derive features owing to a large number of variables and elements in the accident data. The following conclusions were drawn:
  • For construction accident data involving many variables and wide categories, it is possible to identify the most influential variable among many variables by using clustering, chi-square test, and other procedures.
  • Because the types or categories of the major variables are numerous, it is difficult to identify meaningful relationships. Therefore, standardization and element grouping can be performed, and the accuracy can be analyzed according to the categories of the variables; through this, an optimal grouping using the fewest elements can be found.
  • The correlations between factors can be analyzed by examining the correlations between and contributions of variables, using ML analysis on the optimal variable type and category.
  • Through PCA and clustering, the distribution and combinations of variables that contribute to the prediction of each variable can be understood, and we anticipate that effective accident prevention measures can be established by utilizing these results.
  • The severity level in the classified list of personal damage was predicted and analyzed, so this study can have some limitations. The more quantitative data such as the days of convalescence for each accident can yield more reliable results.
  • There are differences in variables and elements to be filled out because construction accident data are all different in forms managed by countries and companies. Therefore, to apply the analysis method proposed in this study, the data standardization is necessary.

Author Contributions

J.Y.L. conceived and designed the experiments; S.P. and T.K.O. performed the experiments and analyzed the data; S.I.R. contributed device/analysis tools; Y.G.Y. and T.K.O. wrote the paper. All authors have read and agreed to the published version of the manuscript.

Funding

This work was supported by the Research Assistance Program (2020) of the Incheon National University and by the Basic Science Research Program through the National Research Foundation of Korea (NRF), funded by the Ministry of Education (No.2018R1D1A1A02085377).

Conflicts of Interest

The authors declare no conflict of interest.

References

  1. Ayhan, B.U.; Tokdemir, O.B. Accident Analysis for Construction Safety Using Latent Class Clustering and Artificial Neural Networks. J. Constr. Eng. Manag. 2020, 146, 04019114. [Google Scholar] [CrossRef]
  2. Hinze, J. Safety incentives: Do they reduce injuries? Pract. Period. Struct. Des. Constr. 2002, 7, 81–84. [Google Scholar] [CrossRef]
  3. Chi, C.F.; Chang, T.C.; Ting, H.I. Accident patterns and prevention measures for fatal occupational falls in the construction industry. Appl. Ergon. 2005, 36, 391–400. [Google Scholar] [CrossRef] [PubMed]
  4. Choudhry, R.; Fang, D.; Ahmed, S. Safety management in construction: Best practices in Hong Kong. J. Prof. Issues Eng. Educ. Pract. 2008, 134, 20–32. [Google Scholar] [CrossRef]
  5. Jacinto, C.; Canoa, M.; Guedes Soaresa, C. Workplace and organizational factors in accident analysis within the food industry. Saf. Sci. 2009, 47, 626–635. [Google Scholar] [CrossRef]
  6. Vidal, L.A.; Marle, F.; Bocquet, J. Measuring project complexity using the analytic hierarchy process. Int. J. Proj. Manag. 2011, 29, 718–727. [Google Scholar] [CrossRef]
  7. Matsunaga, F.T.; Brancher, J.D.; Busto, R.M. Data mining applications and techniques: A systematic review. Rev. Eletrônica Argentina-Brasil Tecnologias Informação Comunicação 2014, 1, 1–14. [Google Scholar] [CrossRef]
  8. Sarkar, S.; Vinay, S.; Raj, R.; Maiti, J.; Mitra, P. Application of optimized machine learning techniques for prediction of occupational accidents. Comput. Oper. Res. 2019, 106, 210–224. [Google Scholar] [CrossRef]
  9. Matías, J.M.; Rivas, T.; Martín, J.E.; Taboada, J. A machine learning methodology for the analysis of workplace. Int. J. Comput. Math. 2008, 85, 559–578. [Google Scholar] [CrossRef]
  10. Chen, H.; Luo, X. Severity prediction models for falling risk for workers at height. Procedia Eng. 2016, 164, 439–445. [Google Scholar] [CrossRef]
  11. Witten, I.H.; Frank, E.; Hall, M.A.; Pal, C.J. Data Mining: Practical Machine Learning Tools and Techniques, 3rd ed.; Morgan Kaufman: Burlington, MA, USA, 2011. [Google Scholar]
  12. Goh, Y.M.; Chua, D. Neural network analysis of construction safety management systems: A case study in Singapore. Constr. Manag. Econ. 2013, 31, 460–470. [Google Scholar] [CrossRef]
  13. Patel, D.A.; Jha, K.N. Neural network model for the prediction of safe work behavior in construction projects. J. Constr. Eng. Manag. 2015, 141, 04014066. [Google Scholar] [CrossRef]
  14. Kim, Y.C.; Yoo, W.S.; Shin, Y. Application of artificial neural networks to prediction of construction safety accidents. J. Korean Soc. Hazard Mitig. 2017, 17, 7–14. [Google Scholar] [CrossRef]
  15. Yajuan, F.; Jia, C. Study on prediction model of building construction safety accidents based on GA-SVM. In Proceedings of the 2013 6th International Conference on Information Management, Innovation Management and Industrial Engineering, Xi’an, China, 23–24 November 2013; pp. 460–462. [Google Scholar]
  16. Zhou, Y.; Su, W.; Ding, L.; Luo, H. Predicting safety risks in deep foundation pits in subway infrastructure projects: Support vector machine approach. J. Comput. Civ. Eng. 2017, 31, 04017052. [Google Scholar] [CrossRef]
  17. Cho, Y.; Kim, Y.C.; Shin, Y. Prediction model of construction safety accidents using decision tree technique. J. Korea Inst. Build. Constr. 2017, 17, 294–303. [Google Scholar]
  18. Rivas, T.; Paz, M.; Martín, J.E.; Matías, J.M.; García, J.F.; Taboada, J. Explaining and predicting workplace accidents using data-mining techniques. Reliab. Eng. Syst. Saf. 2011, 96, 739–747. [Google Scholar] [CrossRef]
  19. Mistikoglu, G.; Gerek, I.H.; Erdis, E.; Mumtaz Usmen, P.E.; Cakan, H.; Kazan, E.E. Decision tree analysis of construction fall accidents involving roofers. Expert. Syst. Appl. 2015, 42, 2256–2263. [Google Scholar] [CrossRef]
  20. Sarkar, S.; Patel, A.; Madaan, S.; Maiti, J. Prediction of occupational accidents using decision tree approach. In Proceedings of the 2016 IEEE Annual India Conference (INDICON), Bangalore, India, 16–18 December 2016; pp. 1–6. [Google Scholar]
  21. An, S.H.; Park, U.Y.; Kang, K.I.; Cho, M.Y.; Cho, H.H. Application of support vector machines in assessing conceptual cost estimates. J. Comput. Civ. Eng. 2007, 21, 259–264. [Google Scholar] [CrossRef]
  22. Cheng, M.Y.; Peng, H.S.; Wu, Y.W.; Chen, T.L. Estimate at completion for construction projects using evolutionary support vector machine inference model. Autom. Constr. 2010, 19, 619–629. [Google Scholar] [CrossRef]
  23. Sánchez, A.S.; Fernández, P.R.; Lasheras, F.S.; Juez, F.J.D.C.; Nieto, P.J.G. Prediction of work-related accidents according to working conditions using support vector machines. Appl. Math. Comput. 2011, 218, 3539–3552. [Google Scholar] [CrossRef]
  24. Kumar, P.R.; Ravi, V. Bankruptcy prediction in banks and firms via statistical and intelligent techniques—A review. Eur. J. Oper. Res. 2007, 180, 1–28. [Google Scholar] [CrossRef]
  25. Olson, D.L.; Delen, D.; Meng, Y. Comparative analysis of data mining methods for bankruptcy prediction. Decis. Support Syst. 2012, 52, 464–473. [Google Scholar] [CrossRef]
  26. Hastie, T.; Tibshirani, R.; Friedman, J. The Elements of Statistical Learning; Springer Series in Statistics; Springer: New York, NY, USA, 2001. [Google Scholar]
  27. Freund, Y.; Schapire, R.; Abe, N. A short introduction to boosting. J. Jpn. Soc. Artif. Intell. 1999, 14, 771–780. [Google Scholar]
  28. Arditi, D.; Pulket, T. Predicting the outcome of construction litigation using boosted decision trees. J. Comput. Civ. Eng. 2005, 19, 387–393. [Google Scholar] [CrossRef]
  29. Shin, Y.; Kim, T.; Cho, H.; Kang, K.I. A formwork method selection model based on boosted decision trees in tall building construction. Automat. Constr. 2012, 23, 47–54. [Google Scholar] [CrossRef]
  30. Shin, Y.; Kim, D.W.; Kim, J.Y.; Kang, K.I.; Cho, M.Y.; Cho, H.H. Application of AdaBoost to the retaining wall method selection in construction. J. Comput. Civ. Eng. 2009, 23, 188–192. [Google Scholar] [CrossRef]
  31. Caruana, R.; Niculescu-Mizil, A. An empirical comparison of supervised learning algorithms. In Proceedings of the 23rd International Conference on Machine Learning, Pittsburgh, PA, USA, 25–29 June 2006; pp. 161–168. [Google Scholar]
  32. Bastos, J. Credit scoring with boosted decision trees. Munich Pers. RePEc Arch. 2008, 8156, 1–13. [Google Scholar]
  33. Oztekin, A.; Al-Ebbini, L.; Sevkli, Z.; Delen, D. A decision analytic approach to predicting quality of life for lung transplant recipients: A hybrid genetic algorithm based methodology. Eur. J. Oper. Res. 2018, 266, 639–651. [Google Scholar] [CrossRef]
  34. Aviad, B.; Roy, G. Classification by clustering decision tree-like classifier based on adjusted clusters. Expert Syst. Appl. 2011, 38, 8220–8228. [Google Scholar] [CrossRef]
  35. Leu, S.S.; Chang, C.M. Bayesian-network-based safety risk assessment for steel construction projects. Accid. Anal. Prev. 2013, 54, 122–133. [Google Scholar] [CrossRef]
  36. Bevilacqua, M.; Ciarapica, F.E.; Giacchetta, G. Industrial and occupational ergonomics in the petrochemical process industry: A regression tree approach. Accid. Anal. Prev. 2008, 40, 1468–1479. [Google Scholar] [CrossRef]
  37. Tixier, A.J.P.; Hallowell, M.R.; Balaji, R.; Bowman, D. Application of machine learning to construction injury prediction. Autom. Constr. 2016, 69, 102–114. [Google Scholar] [CrossRef] [Green Version]
  38. Salas, R.; Hallowell, M.; Balaji, R.; Bhandari, S. Safety Risk Tolerance in the Construction industry: Cross-Cultural Analysis. J. Constr. Eng. Manag. 2020, 146, 04020022. [Google Scholar] [CrossRef]
  39. Alawad, H.; Kaewunruen, S.; An, A.M. Learning From Accidents: Machine Learning for Safety at Railway Stations. IEEE Access 2020, 8, 633–648. [Google Scholar] [CrossRef]
  40. Sameen, M.L.; Pradhan, B. Severity Prediction of Traffic Accidents with Recurrent Neural Networks. Appl. Sci. 2017, 7, 476. [Google Scholar] [CrossRef] [Green Version]
  41. Houari, R.; Bounceur, A.; Kechadi, M.; Tari, A.; Euler, R. Dimensionality reduction in data mining: A copula approach. Expert Syst. Appl. 2016, 64, 247–260. [Google Scholar] [CrossRef]
  42. Vermunt, J.K.; Magidson, J. Latent class cluster analysis. In Applied Latent Class Analysis; Hagenaars, J., McCutcheon, A., Eds.; Cambridge University Press: Cambridge, UK, 2002; pp. 89–106. [Google Scholar]
  43. Ona, J.D.; Lopez, G.; Mujalli, R.; Calvo, F.J. Analysis of traffic accidents on rural highways using latent class clustering and Bayesian Networks. Accid. Anal. Prev. 2013, 51, 1–10. [Google Scholar] [CrossRef] [Green Version]
  44. Biernacki, C.; Govaert, G. Choosing models in model-based clustering and discriminant analysis. J. Stat. Comput. Simul. 1999, 64, 49–71. [Google Scholar] [CrossRef] [Green Version]
  45. Cramér, H. Mathematical Methods of Statistics; Princeton University Press: Princeton, NJ, USA, 1946; Chapter 21; p. 282. [Google Scholar]
  46. Hotelling, H. Analysis of a complex of statistical variables into principal components. J. Educ. Psychol. 1993, 24, 417–441. [Google Scholar] [CrossRef]
  47. Jolliffe, I.T. Principal Component Analysis, 2nd ed.; Springer: New York, NY, USA, 2002. [Google Scholar]
  48. Kakhki, F.D.; Freeman, S.A.; Mosher, G.A. Use of Neural Networks to Identify Safety Prevention Priorities in Agro-Manufacturing Operations within Commercial Grain Elevators. Appl. Sci. 2019, 9, 4690. [Google Scholar] [CrossRef] [Green Version]
  49. Zink, A.; Rose, S. Fair regression for health care spending. Biometrics 2019, 76, 1–10. [Google Scholar] [CrossRef] [Green Version]
  50. Athey, S. Machine learning and causal inference for policy evaluation, KDD ’15. In Proceedings of the 21th ACM SIGKDD International Conference on Knowledge Discovery and Data Mining, Sydney, NSW, Australia, 10–13 August 2015; pp. 5–6. [Google Scholar]
  51. Choi, I.H.; Son, J.A.; Koo, J.B.; Yoon, Y.G.; Oh, T.K. Damage Assessment of Porcelain Insulators through Principal Component Analysis Associated with Frequency Response Signals. Appl. Sci. 2019, 7, 3150. [Google Scholar] [CrossRef] [Green Version]
Figure 1. Research procedure and methods.
Applsci 10 07949 g001
Figure 2. Latent Class Cluster Analysis (LCCA) selection of major variables for construction accident data. (a) Variables 1–8; (b) Variables 9–16.
Applsci 10 07949 g002aApplsci 10 07949 g002b
Figure 3. Contributions of input variables according to output.
Applsci 10 07949 g003
Figure 4. Visualization of contribution network between occupational accident variables.
Applsci 10 07949 g004
Figure 5. Alluvial flow diagram using variables with high correlation when predicting type of accident. D: Injured part (D1: Inside the upper body; D2: Outside of the upper body; D3: Face; D4: Inside the lower body; D5: Outside of the lower body); E: Assailing materials (E1: Light non-fixture; E2: Light non-fixture (equipment); E3: Permanent fixture; E4: Temporary fixture; E5: Heavy non-fixture; E6: Heavy non-fixture (equipment)); F: Cause of accident (F1: Unsafe work; F2: Lack of personal protective equipment; F3: Facility defect/collapse; F4: Lack of safety measures; F5: Work equipment defect; F6: Carelessness; F7: Third-party liability), C: Type of accident (C1: Jamming; C2: Fall down; C3: Fall off; C4: Hit; C5: Collapse; C6: struck; C7: Imbalance/Uncontrolled motion; C8: Occupational diseases; C9: Mutilation/Cut/Puncture; C10: Fire/Explosion/Blast).
Applsci 10 07949 g005
Figure 6. Alluvial flow diagram using variables with large correlations for predicting injured part. C: Type of accident (C1: Jamming; C2: Fall down; C3: Fall off; C4: Hit; C5: Collapse; C6: struck; C7: Imbalance/Uncontrolled motion; C8: Occupational diseases; C9: Mutilation/Cut/Puncture; C10: Fire/Explosion/Blast); S: Severity (S1: Slight injury; S2: Serious injury; S3: Fatal injury); D: Injured part (D1: Inside the upper body; D2: Outside of the upper body; D3: Face; D4: Inside of the lower body; D5: Outside of the lower body).
Applsci 10 07949 g006
Figure 7. Alluvial flow diagram using variables with large correlation in prediction of severity. A: Year (A1: 2015; A2: 2016; A3: 2017; A4: 2018; A5: 2019; A6: 2020); C: Type of accident (C1: Jamming, C2: Fall down; C3: Fall off; C4: Hit; C5: Collapse; C6: struck; C7: Imbalance/Uncontrolled motion; C8: Occupational diseases; C9: Mutilation/Cut/Puncture; C10: Fire/explosion/blast); D: Injured part (D1: Inside the upper body; D2: Outside of the upper body; D3: Face; D4: Inside of the lower body; D5: Outside of the lower body); S: Severity (S1: Slight injury; S2: Serious injury; S3: Fatal injury).
Applsci 10 07949 g007
Figure 8. Classification of severity with principal component analysis (PCA) using three major variables.
Applsci 10 07949 g008
Table 1. Examples of studies utilizing occupational accident data in construction applications.
Year/ReferenceMethodsInput DataOutput DataDetails
2016/[37]Random Forest, Stochastic Gradient Tree Boosting69 variables, such as construction materials, tools, and equipment.
9 variables, such as work procedure and carelessness
Injured area, energy source, severityPrediction and accuracy comparison for Machine learning method using 78 construction site parameters
2019/[8]Latent Dirichlet Allocation, Support vector machine, Artificial neural network(ANN), Decision Tree16 variables such as accident day, month, department, outcome, impact type, injury type, and topicInjury, near miss, property damageEmphasized the importance of preprocessing of accident data, reduced variables with chi-square, and predicted accident types
2020/[1]Latent Class Cluster Analysis (LCCA), ANNCategorical (project type, age (interval), occupation, experience (interval), incident case etc.), binary (incident, human factor, hazardous behavior)Prediction for 6 accident types (recognition of risk, improper use of equipment, insufficient preventive measures, etc.)By reducing 142 variables down to 60, the severity of construction accidents was predicted. Limitation: only binary variables were reduced
2020/[38]K-means Clustering, Principal component analysis (PCA)Survey based score of 35 questions, considering age, employment type, career, and risk in each countryConstruction risk prediction by countryPCA was performed on the survey scores, major components were extracted and grouped by k-means clustering. Limitation: the principal component values of PCA were grouped simply
Table 2. Description of variables from 963 occupational accident data entries.
VariableTypeNumber of ElementsElement Names
Accident classificationCategorical3Injury, death, property damage, etc.
HeadquarterCategorical3Housing construction, civil, plant construction
Process rateCategorical101–10, 11–20, …, 91–100
YearCategorical62015, 2016, 2017, 2018, 2019, 2020
MonthCategorical121–12
Day of the weekCategorical7Monday, Tuesday, Wednesday, Thursday, Friday, Saturday, Sunday
HourCategorical19Occupational accident occurrence time from 0 to 23:00 in hourly increments
AgeCategorical620–30, 31–40, 41–50, 51–60, 61–70, 71–80
GenderBinary2Male, Female
Type of workCategorical15Carpenter, painter, scaffolder, stonemason, safety officer, welder, equipment operator, electric piping equipment worker, landscaper, window worker, structural steel/steel frame worker, concrete worker, tunnel worker, earth worker, woodworker
Type of accidentCategorical10Jamming, fall down, fall off, hit, collapse, struck, imbalance and uncontrolled motion, occupational diseases, mutilation/cut/puncture, fire/explosion/blast
Injured partCategorical12Pelvis, ear, eye, leg, multiple head location, foot, hand, brain, mouth, nose, arm, chest/abdomen
WorkplaceBinary2Internal work, external work
Assailing materialsCategorical21Formwork/shores, construction and mining machinery, stair and ladder, metal fine particles/trace elements/dust/fumes, other buildings/structures/etc., end portion and opening, fauna and flora, floor and ground/etc., scaffolding and work plate, equipment/machinery parts and appendages, hand tool nonpowered, container and pack, transporting, lifting equipment, machinery, land transportation, manpower machinery, processing equipment/machinery, natural phenomena (e.g., working environment and atmospheric conditions), material, electrical equipment/parts, debris/garbage, hand tool powered
Cause of accidentCategorical7Unsafe work(worker), lack of personal protective equipment(worker), facility defect/collapse(management), lack of safety measures(management), work equipment defect(worker), carelessness(worker), third-party liability(worker)
SeverityCategorical3slight injury, serious injury, fatal injury
Table 3. Comparison of four methods applied to severity for extraction of major variables.
VariablesPredictor
Importance
RankChi-Square
p-Value
RankCramer’s VRankCluster GroupSelected Variable
Accident classification0127.09 × 10−660.1210X-
Headquarter0125.74 × 10−1140.0414O-
Process rate1.36 × 10−464.46 × 10−1120.1012X-
Year4.46 × 10−451.20 × 10−850.175O
Month1.06 × 10−4101.84 × 10−2100.148X-
Day of the week0129.03 × 10−1150.0613X-
Hour1.29 × 10−473.42 × 10−2110.176X-
Age4.21 × 10−5111.17 × 10−290.1111X-
Gender1.11 × 10−491.73 × 10−470.139X-
Type of work6.65 × 10−448.55 × 10−380.167O
Type of accident2.07 × 10−321.59 × 10−2020.272O
Injured part7.94 × 10−312.36 × 10−7810.481O
Work place0125.30 × 10−1130.0415O-
Assailing materials1.15 × 10−331.26 × 10−940.253O
Cause of accident1.14 × 10−489.76 × 10−1130.194O
Table 4. Machine Learning (ML) prediction result after the reduction of elements under variables.
No.CaseML MethodAccuracyAccuracy
(Nested CV Applied)
1A-B(15)-C-D(12)-E(21)-FEnsemble72.17%70.19%
SVM94.60%58.32%
2A-B(15)-C-D(12)-E(6)-FEnsemble71.34%69.26%
SVM93.98%55.87%
3A-B(15)-C-D(5)-E(21)-FEnsemble68.02%69.57%
SVM93.67%55.66%
4A-B(15)-C-D(5)-E(6)-FEnsemble68.33%69.26%
SVM92.63%54.36%
5A-B(5)-C-D(12)-E(21)-FEnsemble69.57%66.87%
SVM91.28%57.54%
6A-B(5)-C-D(12)-E(6)-FEnsemble68.54%66.87%
SVM89.30%56.41%
7A-B(5)-C-D(5)-E(21)-FEnsemble67.29%66.87%
SVM89.62%55.02%
8A-B(5)-C-D(5)-E(6)-FEnsemble67.08%67.29%
SVM87.54%55.45%
A: year; B: type of work; C: type of accident; D: injured part; E: assailing material; F: cause of accident.
Table 5. Output performance in terms of accuracy, precision, recall, and F1 score.
Output VariableMethodAccuracyPrecisionRecallF1 Score
YearEnsemble34.50%41.93%26.63%32.57%
SVM26.69%16.89%21.08%18.75%
Type of workEnsemble66.04%30.28%21.79%25.34%
SVM64.46%23.06%16.54%19.26%
Type of accidentEnsemble50.34%32.05%37.12%34.40%
SVM37.24%28.72%19.44%23.19%
Injured partEnsemble48.86%29.31%27.10%28.16%
SVM45.03%36.26%22.71%27.93%
Assailing materialsEnsemble53.27%28.63%33.86%31.03%
SVM48.34%27.25%15.15%19.47%
Cause of accidentEnsemble69.89%31.47%24.95%27.84%
SVM66.24%33.51%21.08%25.88%
SeverityEnsemble67.29%68.60%65.14%66.82%
SVM55.45%52.59%54.40%53.48%
Table 6. Five most influential variables and elements in the formation of each cluster.
Cluster IDAttributesProbabilities of Current ClusterBeing Observed (Total)Being ObservedPercentage
VariableElement(in the Cluster)
Cluster 1Assailing materialPermanent fixture0.59424422090.16%
Type of accidentFall down0.56625021786.80%
Type of accidentFall off0.35817413275.86%
Injured partOutside of the lower body0.43927116059.04%
SeveritySerious injury0.34346224051.95%
Cluster 2Type of accidentHit0.45715712277.71%
Type of accidentStruck0.3131289271.88%
Cause of accidentThird-party liability0.657856171.76%
Assailing materialHeavy non-fixture0.56533714843.92%
Injured partOutside of the upper body0.40339510526.58%
Cluster 3Type of accidentMutilation, Cut, Puncture0.376716490.14%
Assailing materialLight non-fixture (equipment)0.5311099183.49%
Type of accidentJamming0.3571086661.11%
Injured partOutside of the upper body0.87139514336.20%
Type of workCivil0.2411384331.16%
Cluster 4SeverityFatal injury0.96112711489.76%
Injured partInside the upper body0.400764761.84%
Injured partFace0.3951104641.82%
Year20190.3832548834.65%
Type of accidentFall off0.3561744224.14%
Cluster 5Cause of accidentUnsafe work0.825544583.33%
Type of accidentOccupational diseases0.16911981.82%
Type of accidentImbalance and uncontrolled motion0.778584272.41%
Injured partInside the lower body0.4701112522.52%
Assailing materialHeavy non-fixture0.6783373710.98%
Table 7. Concept definitions of construction accidents by cluster.
Cluster ID.Conceptual DefinitionNumber of Data Entries
(Percentage (%))
Cluster 1Serious injury to the outside of the lower body from a permanent fixture (floor, etc.) by fall down and fall off accidents369(38)
Cluster 2Injury to the outside of the upper body from being hit or struck by a heavy non-fixture (construction material)259(27)
Cluster 3Injury due to mutilation, cut, or puncture on the outside of the upper body whilst using light non-fixture (equipment)165(17)
Cluster 4Fatal injury on the inside of the upper body and face from fall off118(12)
Cluster 5Injury to the inside of the lower body (pelvis) from unbalanced and uncontrolled movements during heavy non-fixture work53(6)
Total 963(100)
Publisher’s Note: MDPI stays neutral with regard to jurisdictional claims in published maps and institutional affiliations.

