1. Introduction
1.1. Future Propulsion Targets
Future aircraft propulsion systems must be able to meet targets set by governments and organizations. The Advisory Council for Aviation Research and Innovation in Europe (ACARE) has set a target of a 75% reduction in CO
2 emissions and a 90% reduction of NOx emissions by 2050 [
1]. One of the main steps towards meeting these targets is to reduce the specific fuel consumption (SFC) through increases in propulsive efficiency by the reduction of specific thrust. However, there are different limits to the fuel saving potential (e.g., the optimized design is a tradeoff between SFC, engine installed weight, and nacelle drag as these parameters increase with reduced specific thrust).
Generally, future trends in aero engines have been a point of interest for aerospace researchers and industries during the last five decades. This historical progress in investigation of the future trends for air travel can for convenience be divided into four phases:
Phase 1 (1970s) [
2,
3,
4,
5,
6]: Pioneering Work. The first studies were undertaken, resulting in some landmark analytic architectural design. In the first years of the 1970s, studies were concentrated on review and survey of gas turbine development progress since it first emerged. However, later studies started predicting the conceptual future trends and proposing structures for future large civil turbofans for air travel.
Phase 2 (1980s) [
7,
8,
9,
10]: Growth. Between 1980 and 1990, there were fundamental studies about different concepts for future aircraft engines. Concepts such as aircraft counter rotation propellers and ultra-high bypass ratio (UHBPR) turbofan engines were considered in this period.
Phase 3 (1990s) [
11,
12,
13,
14,
15]: Detailed design. Comprehensive studies based on detailed design and analysis (which largely focused on modification of the previous concepts) and real applications were published. Rolls Royce plc contributed widely in this phase. The main objectives of research studies in this decade were to:
Examine the parameters that influence the design of new engines for large transport aircraft
Optimize the installed SFC
Consider weight and cost effects
Identify the technology necessary to achieve a competitive product
Phase 4 (after 2000) [
16,
17,
18,
19,
20,
21,
22,
23,
24,
25,
26,
27,
28,
29,
30,
31]: Development and Optimization. From 2000 to the present day, more detailed results were published that largely focused on optimization algorithms and multidisciplinary design procedure and its applications in propulsion system design and performance analysis. The focus of the research studies published in this phase can be divided into two main topics:
Following the above-mentioned literature and phases, the following summary can be made:
Geared turbofan engines (GTFs) with ultra-high bypass ratios (UHBRs) would be the best option for the next generation of propulsion systems [
18,
20,
21,
24,
25,
31].
An optimal engineering design procedure is required to design/set the performance parameters for the engine to deal with future limitations and targets set by organizations and industries [
26,
27,
28,
29,
30].
1.2. UHBR Thermal Management System
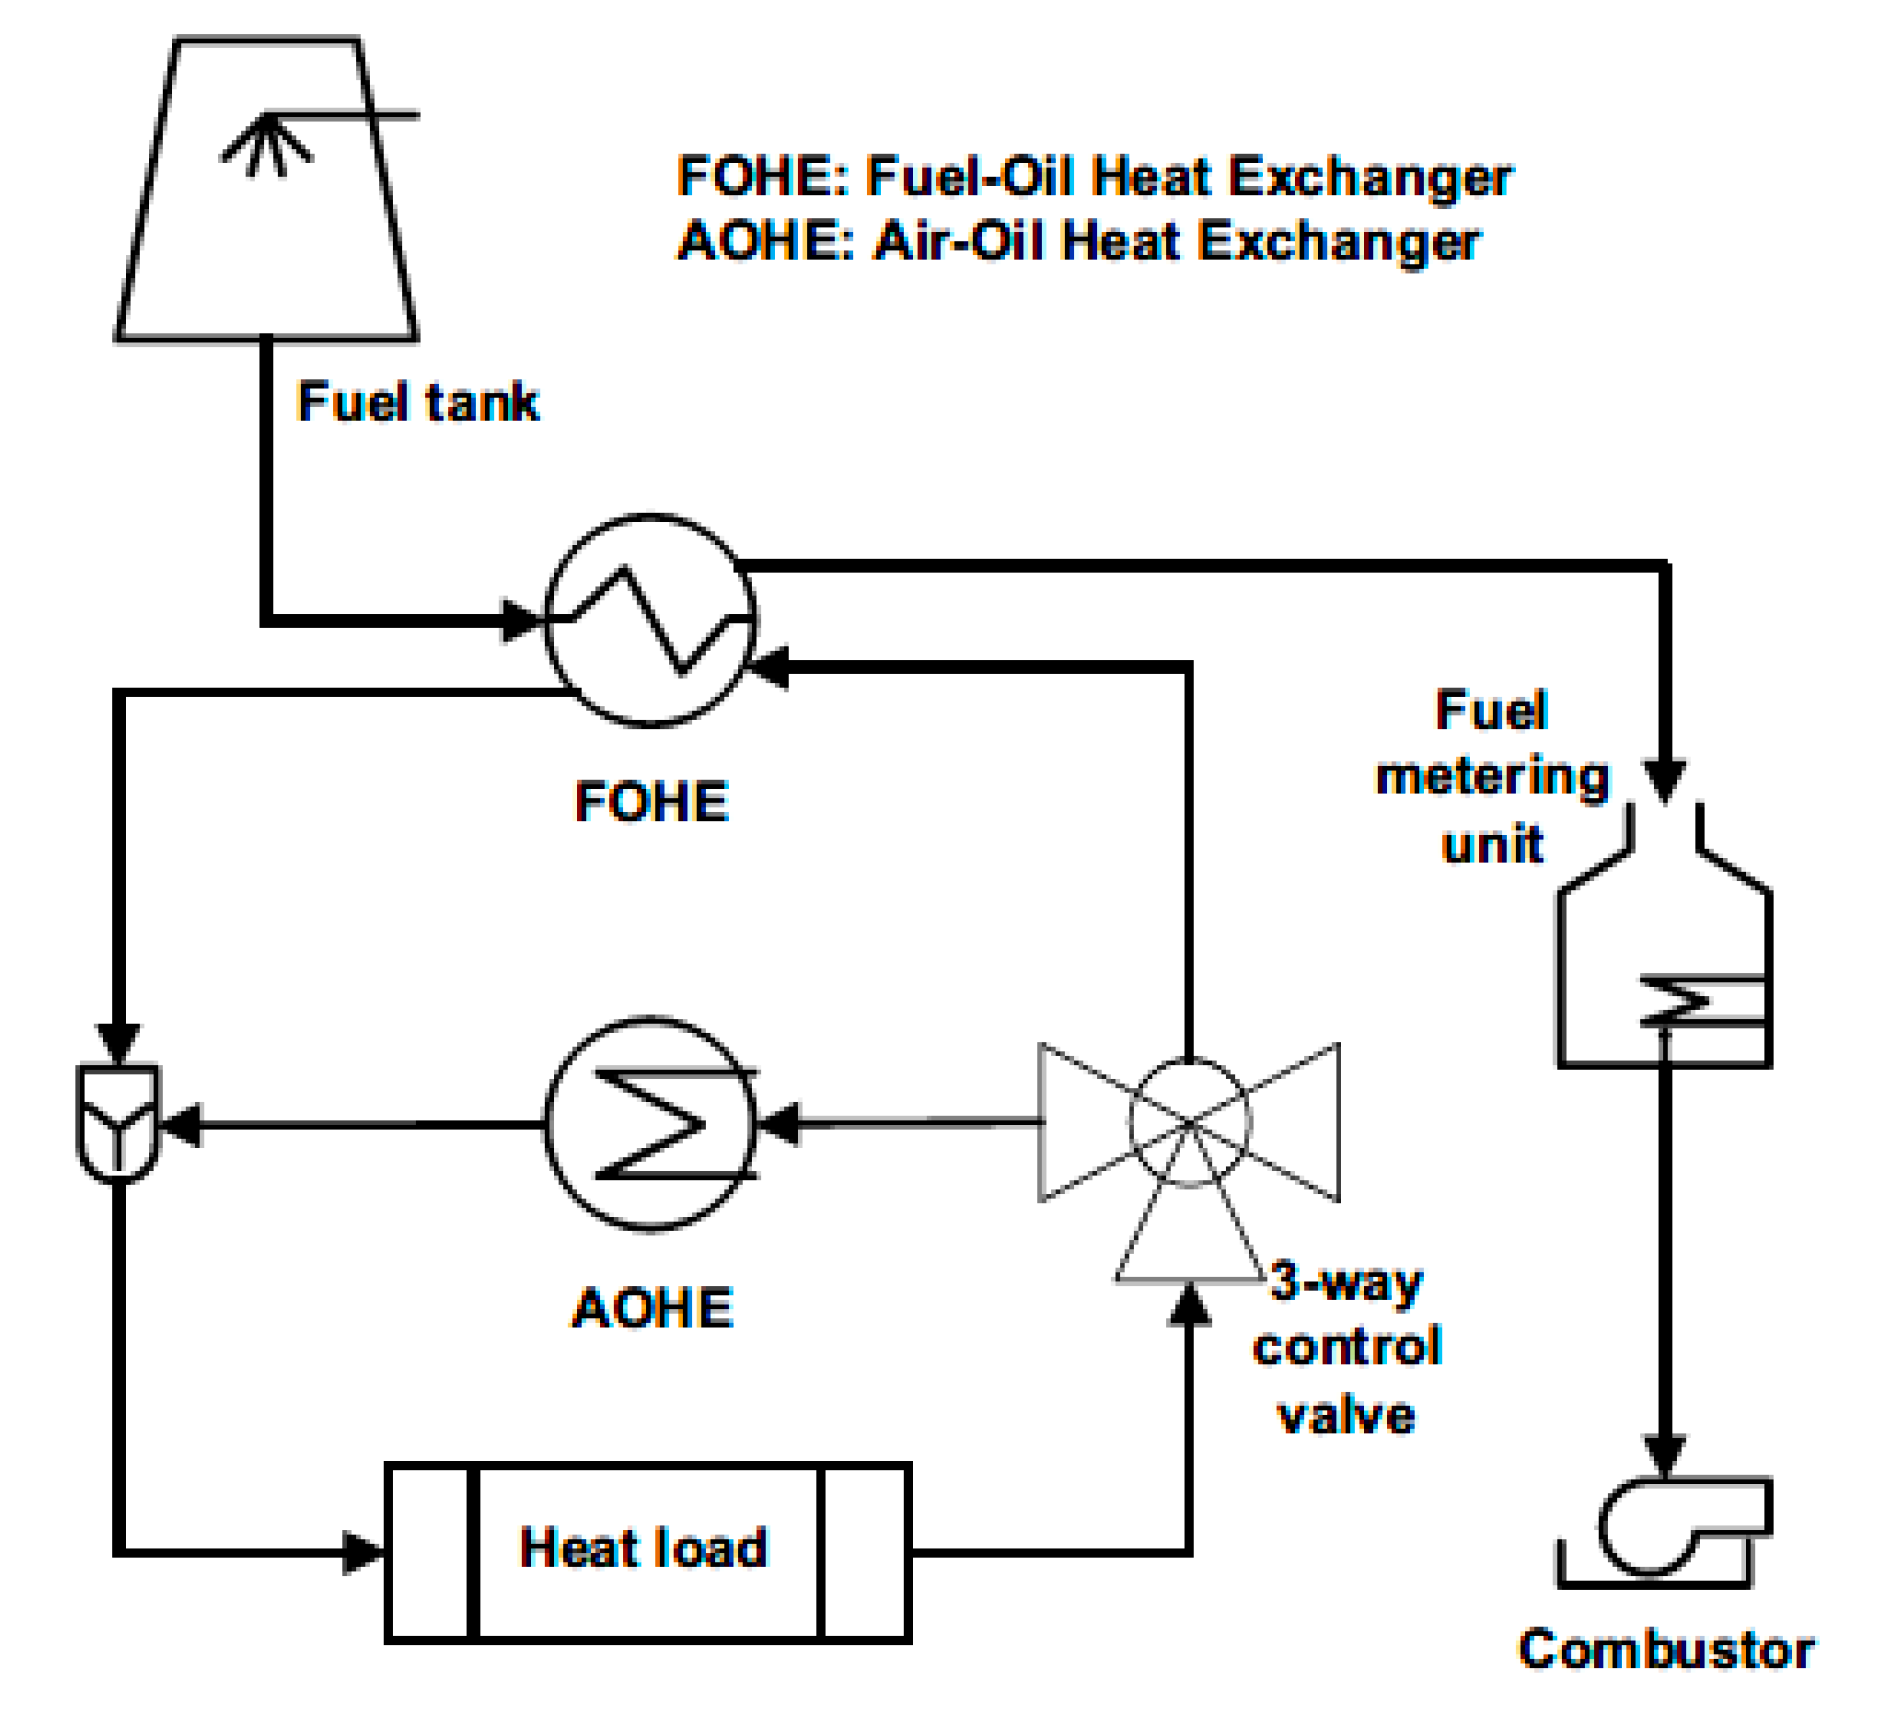
A typical engine thermal management system (TMS) comprises two oil circuits, namely one for the generator and one for other engine components, such as power gearbox, accessory gearbox, and bearings. The primary function of the oil is to lubricate the engine components, with a secondary function being cooling and transporting heat away from the heat source to available heat sinks. As a result of thermal cycling and high temperatures, the oil degrades because of oxidative and thermal breakdown. This manifests itself as increased viscosity and higher total acidity, which leads to lower oil performance. Unacceptably high oil temperature reduces oil viscosity and increases the oxidation rate or breakdown of the oil. It also affects component life because of the higher component temperatures coupled with reduced oil lubricating film thickness on contacting gear teeth and bearing surfaces, which increase wear. High oil temperature can also reduce the life of the shaft oil seals. Therefore, to achieve longer component design life, the operating oil temperature should be maintained within the working temperature range of the oil. Typically, oil temperature should be limited not to exceed 140 °C to 150 °C, depending on the engine rating.
The heat generated from these oil system components is managed by the TMS (
Figure 1).
The primary function of the TMS is to cool the oil and prevent it from exceeding limiting temperatures and to enable engine components that generate excess heat to operate safely and reliably. The secondary function of the TMS is to manage excess heat in the most efficient manner, thus to minimize the impact of the TMS on fuel consumption.
The TMS typically manages engine excess heat with fuel as the primary heat sink on the engine, and bypass-air as the secondary heat sink. It is preferable to transfer heat primarily into fuel prior to combustion as by doing so, the energy is maintained within the engine cycle, i.e., the fuel is pre-heated and less fuel is needed for the same combustor outlet gas temperature. This improves the thermal efficiency and the specific fuel consumption. However, there is a limit on the value of the fuel temperature before combustion due to fuel cracking effects. This limits the maximum amount of heat that the TMS can transfer into the fuel. For kerosene, this limit is about 135 °C. The excess heat is transferred to the atmosphere by a typical arrangement of an air–oil heat exchanger installed in the bypass-air duct (
Figure 2).
The bypass-air duct heat exchange system will impose air pressure drop and air temperature rise. While heat addition to bypass air has a positive effect on the bypass thrust, this benefit is negligible as compared to the large SFC penalty due to the pressure drop across inlet and outlet ducts and the heat exchanger. In the design process, many other alternative cooling architectures and installations can be considered, each having their own impact on engine performance. Thus, it is important to understand the trade-offs between various thermal management system design options and the engine specific fuel consumption. Exchange rates presented in this paper provide a first-hand preliminary assessment tool to enable quick investigation of these trade-offs.
1.3. Exchange Rates
The exchange rate analysis was used to describe the effects of deviations in the parameters from the reference condition in the performance and operability of the whole system. As a result, a correlation function was generated based on a systematic approach to find the relationship between engine exchange rates and the signatures from the engine reference database [
33]. Therefore, the results of the exchange rate analysis carry high credibility. Thus, it is a powerful tool to analyze the technology summary [
34] and to be used in the design procedure for the development of next generation gas turbine engines [
35].
In general, two scenarios were examined, namely the design point (DP), and the synthesis exchange rates. In the former, the engine geometry was changed, and the cycle was fixed. The objective was to study the impact of a small change in leading component performance levels on engine DP performance parameters. In synthesis exchange rates, the engine geometry is fixed (i.e., fixed components defined for the DP) and engine cycle changes. The objective was to study the effect of changing a cycle parameter with the rest of the engine hardware unchanged.
Rahman et al. [
36] recently presented a comprehensive study on the utilization of exchange rate analysis for a diagnostics-oriented modelling approach of micro gas turbines for fleet monitoring and maintenance optimization [
36]. They used an exchange rate analysis to develop a scheme for fault identification and finally presented the correlation coefficients between exchange rates and signatures for their case studies with a single fault. The exchange rate analysis was also used to explore the effect of turbine stage efficiency on fuel consumption in [
37] by utilizing the fundamentals of sensitivity analysis on component efficiencies [
38] and Brayton cycle [
39] in a zero-dimensional feature. The results of the analysis showed that by increasing the efficiency of the first stage of a turbine from 82% to 84% in an aerial engine, the fuel consumption decreased by 1%.
On future high bypass ratio engines, in which significant heat load will be generated through the use of a power gearbox, a much higher amount of heat will have to be managed, which will further impose the importance of designing a thermal management system that can both manage excess heat safely and reliably and improve engine specific fuel consumption.
Consequently, the current work investigated the exchange rates on SFC for different architectures of a thermal management system of a UHBR-GTF engine. More specifically, it assessed the impact of bypass pressure loss and air mass extraction from the bypass flow. The investigation also included the effect of core mass flow extraction and the power offtake from the high pressure turbine (HPT). Both DP and synthesis exchange rates results were presented and discussed. Therefore, the following section provides the problem definition, while
Section 3 provides a description of the engine model. The latter also includes the design point definition and the engine performance results for a flight profile. The SFC exchange rate results are discussed in
Section 4, followed by the conclusions.
2. Problem Statement
Given the fact that UHBR engines is a promising solution for near future aircraft propulsion, the engine’s thermal management system needs to manage any increased heat loads.
The objective was to develop an optimized representative UHBPR-GTF (as the best candidate for dealing with limitations set by governments and organizations for optimal future air travel) engine performance computational model assuming a 2025 entry into service level of technology.
The problem was addressed by two main steps: The first one is the design of optimized engine parameters. For this purpose, the engine design point (DP) is set at the take-off (T/O) condition to achieve a maximum net thrust value (FN). The cycle is then optimized to obtain the maximum efficiency for the components at cruise conditions by satisfying pre-defined constrains. The outcome of this step is an accurate, optimized model for the UHBPR-GTF engine, which is used for the subsequent steps.
The second step is to perform SFC exchange rate analysis to relate changes in component performance levels to change in engine parameters. This is done in both scenarios of design point and synthesis exchange rates. More specifically, the following cases are examined for both scenarios:
Effect of bypass duct pressure loss of 1% to 4% (i.e., reflecting the air oil heat exchanger (AOHE) installation in the bypass duct)
Effect of bypass duct mass flow loss of 1% to 4% (i.e., AOHE effect)
Effect of core mass flow into bypass of 1% to 4% (i.e., core bleed effect)
Added heat of 50 kW to 150 kW either to the bypass duct (reflecting AOHE installation) or to the fuel (reflecting the fuel oil heat exchanger (FOHE) utilization to pre heat the fuel).
For the synthesis scenario, an additional case was also investigated to consider the effect of power offtake from a high pressure turbine (HPT) by extracting extra power on top of the DP (reference) value. This is the case when more power is required by the auxiliary systems due to the sizing of specific components such as the power gearbox (related to the fan size and bypass ratio (BPR)), shaft bearings, auxiliary gearbox, etc. Therefore, 20 kW, 30 kW, 40 kW, and 50 kW were added on top of the 37.5 kW (DP value).
3. Engine Model
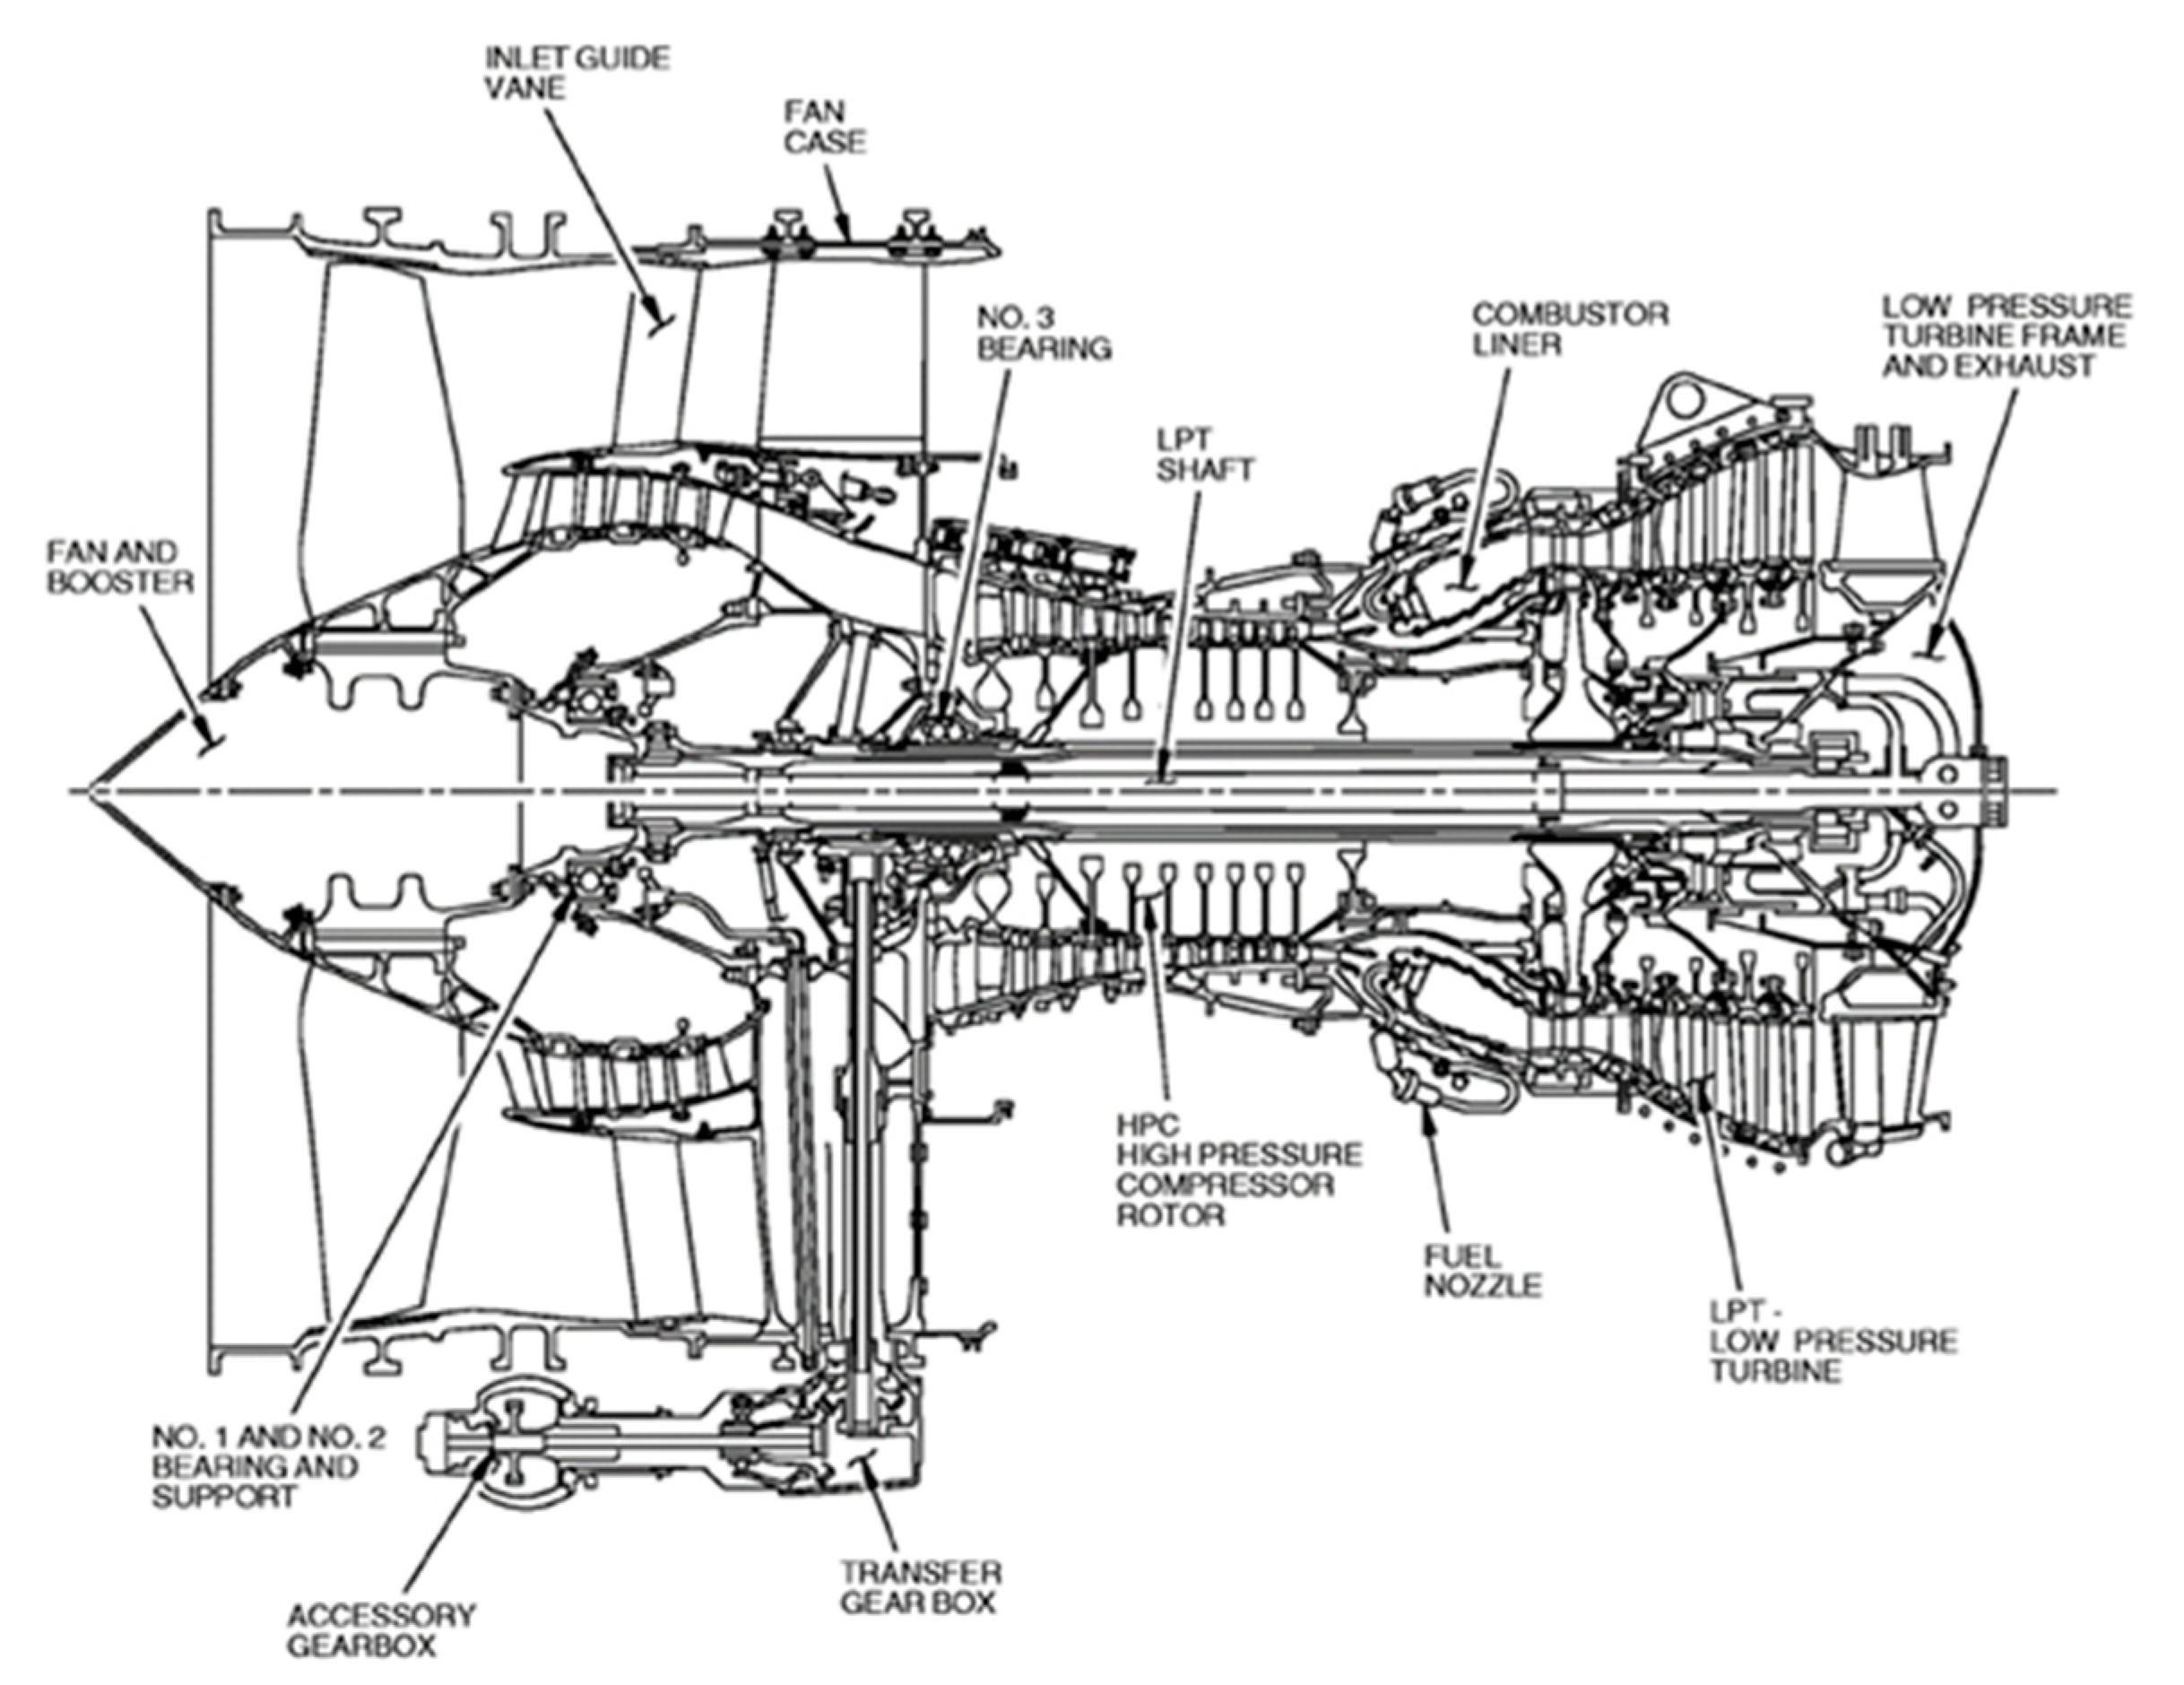
With respect to literature survey results, a typical geared 2-spool turbofan engine configuration was set up. The engine architecture was inspired by the CFM56 engine (
Figure 3).
With the addition of a power gearbox connected to the fan, the cycle parameters were adjusted for the required DP FN assuming a level of technology as entry into service for the year 2025. The schematic of the engine model is shown in
Figure A1. The model consists of a fan (core and bypass section), low pressure compressor (LPC), and high pressure compressor (HPC) connected with the HPT (high pressure components) and low pressure turbine (LPT) (low pressure components) and a convergent fixed area nozzle. The model includes different air bleeds from the core gas path to model the secondary flow for compressor surge protection, turbine cooling, and overboard bleed for the aircraft.
The first objective was to establish the DP performance of the engine, which was the take-off (T/O) condition. The rationale for this selection was the thrust requirement for the take-off phase and the availability of engine data in the public domain. The objective was to achieve the required DP FN at the T/O condition, while at cruise conditions, the engine should satisfy the cruise FN requirement with the maximum compressor and turbine efficiency and within certain safety limits of combustor outlet temperature (COT), fan pressure ratio (FPR), etc.
Engine performance was evaluated using Turbomatch, an in-house code developed at Cranfield University and used extensively for research projects. Turbomatch is a 0-D performance simulation code, featuring Off-Design (OD) and transient simulation as well. Turbomatch comprises several pre-programmed modules, known as “bricks”, which correspond to models of individual gas turbine components. They can be called up to simulate the action of the different components of the engine, resulting finally in output of engine thrust or power, specific fuel consumption, etc. Its modularity, which is supported by the implementation of generic component maps, enables the detailed design of any gas turbine configuration [
40,
41].
Scaled generic component maps were used for the engine simulation. Due to the lack of available data related to engine component design, a performance optimization using the Turbomatch code was conducted to evaluate the engine’s optimum parameters. Therefore, a number of parameters were varied in specific range (
Table 1), and the target was to achieve the following objectives at cruise conditions:
The following values and ranges were used for the simulation based on the literature, industrial consultations, and benchmarking analysis to start the simulation.
Using the above-mentioned architecture, assumptions, and objectives full engine performance results were produced demonstrating the engine’s behavior under different flight phases to achieve the optimized results. The optimized design parameters for the engine are presented in
Table 2.
In order to assess engine performance at off-design, a full mission analysis was conducted for a long-range aircraft model inspired by an aircraft similar to the Airbus A-320 aircraft equipped with two UHBR-GTF engines. The aircraft performance simulation for a full flight profile was conducted by using Hermes software, an in-house tool developed at Cranfield University. The tool was used to predict aerodynamic characteristics given the required inputs for an aircraft and was combined with Turbomatch in order to calculate the overall performance as an integrated aircraft/engine system. Therefore, for a complete mission, it simulates the trajectory and produces as outputs various engine performance parameters during the flights schedule (i.e., take-off, climb, cruise, descent, and landing) [
42,
43].
The aircraft model was set up using Euro-control Base of Aircraft Data (BADA) for an A320 [
44]. Simulation of a complete mission was conducted including different operating points (
Table 3).
Given the setup of the aircraft-engine model, the FN values were calculated for the different flight phases, and the FN fraction relative to T/O is presented in
Figure 4.
The OD performance study was done for three different ambient temperature conditions: ISA, cold, and hot day for every operating point. This means that at sea level, there was a −66 °C (cold day) and +20 °C (hot day) T
ambient ISA deviation. For the different altitudes, a variation to T
ambient was imposed according to standard atmosphere (
Figure 5). The simulation was performed by using a constant thrust value for each operating point (i.e., altitude and flight speed,
Table 3), reflecting the fact that the aircraft thrust demand does not change with the variation of ambient temperature.
4. Engine Performance Results Analysis
Engine performance was simulated and assessed for a typical mission. The results are presented in this section. In terms of FN and Turbine Entry Temperature (TET), the altitude and flight Mach number were the driving factors affecting thrust level at off-design operation (
Figure 6). TET varied accordingly in order for the engine to provide the required thrust. The hot day caused an increase in TET by 128 K at max cruise conditions. In the cold day, the reduction of TET for constant FN was about 56 K. The effects were more pronounced at T/O SLS, where the ambient temperature difference was higher. Therefore, in a cold day (i.e., −66 °C T
ambient ISA deviation) the engine could produce the DP FN (111.2 kN) with a reduced TET by 371 K relative to the DP value. In the hot day, TET should be increase by 109 K relative to the DP value for the same FN (
Figure 6).
The variation of fuel flow (Wf) and SFC was considerable during the different flight operating points due to the different FN requirements and the operating conditions (
Figure 7). Wf decreased at cruise conditions, as the FN requirement was lower. The increase at the end of descent was observed due to the effect of flight Ma (Ma = 0.388) at an altitude of 457 m and the thrust requirement for this phase of flight.
Engine SFC was affected by the ambient conditions, and considerable variations were observed relative to the ISA flight conditions (
Figure 8). During a hot day, SFC increased by 4.3% at T/O. This rise was 5.4% at max cruise. On the contrary, SFC decreased during a cold day. In this engine, the reduction was 14.7% at T/O and 2.3% at max cruise, indicating the effect of ambient temperature and the fact that the temperature variation was not the same at sea level as it was at cruise altitude.
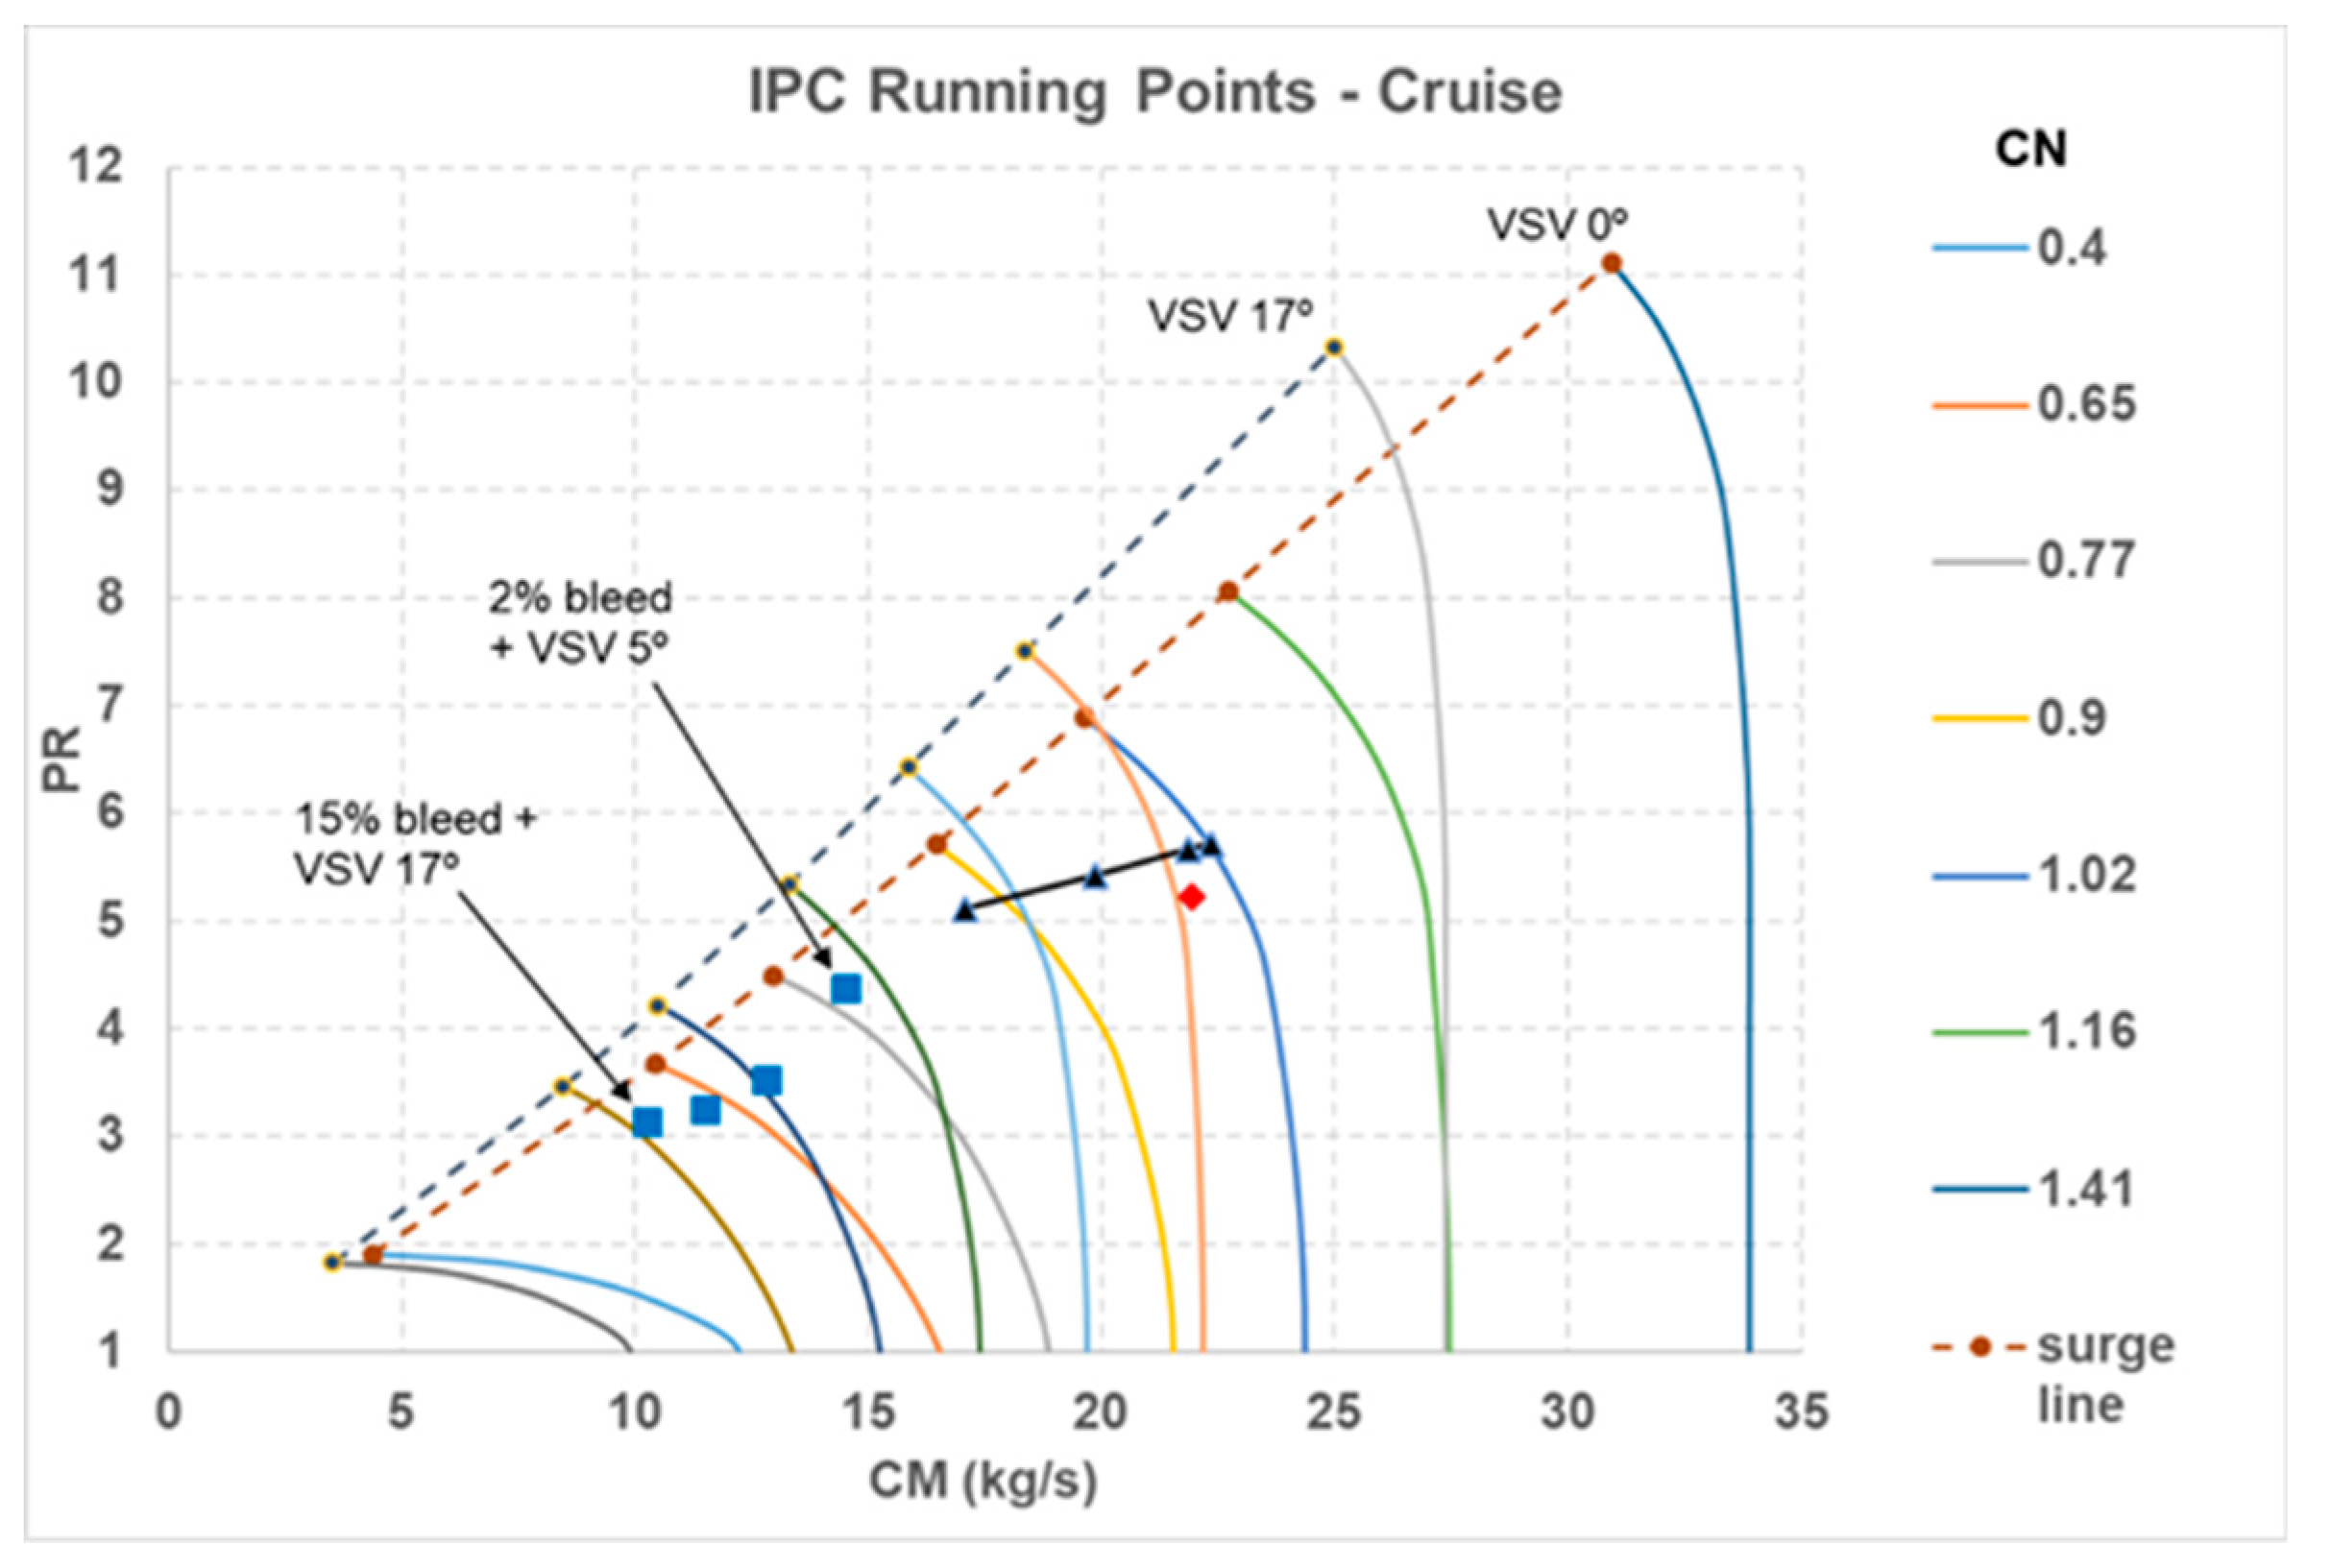
As the engine operates at different flight phases, the component operating points move within their characteristics map. An example is presented in
Figure 9, where the IPC operating point moved from T/O to ground idle with all the flight points of
Table 3. Ground idle operating point was approaching surge due to the minimum FN requirement.
Engine performance at cruise conditions was assessed for different fuel flow values (i.e., TET and FN levels). For simulation purposes, fuel flow was reduced to a very small value. This caused a reduction of the engine’s rotational speed, Overall Pressure Ratio (OPR), mass flow, and consequently on engine’s performance. As was expected, there was a reduction in fan PR and corrected mass flow (CM), which was more evident when the bypass nozzle became un-choked at low combustion outlet temperature (COT) (i.e., low NL CN). IPC approached to surge as the fuel flow was reduced. In this case, a combination of bleed and variable stator vane (VSV) angles were used in order to protect the IPC from surge (
Figure 10). The results showed that IPC’s operating point remained well within the map when VSV = 17 °C and 15% bleed mass was extracted from the outlet of IPC.
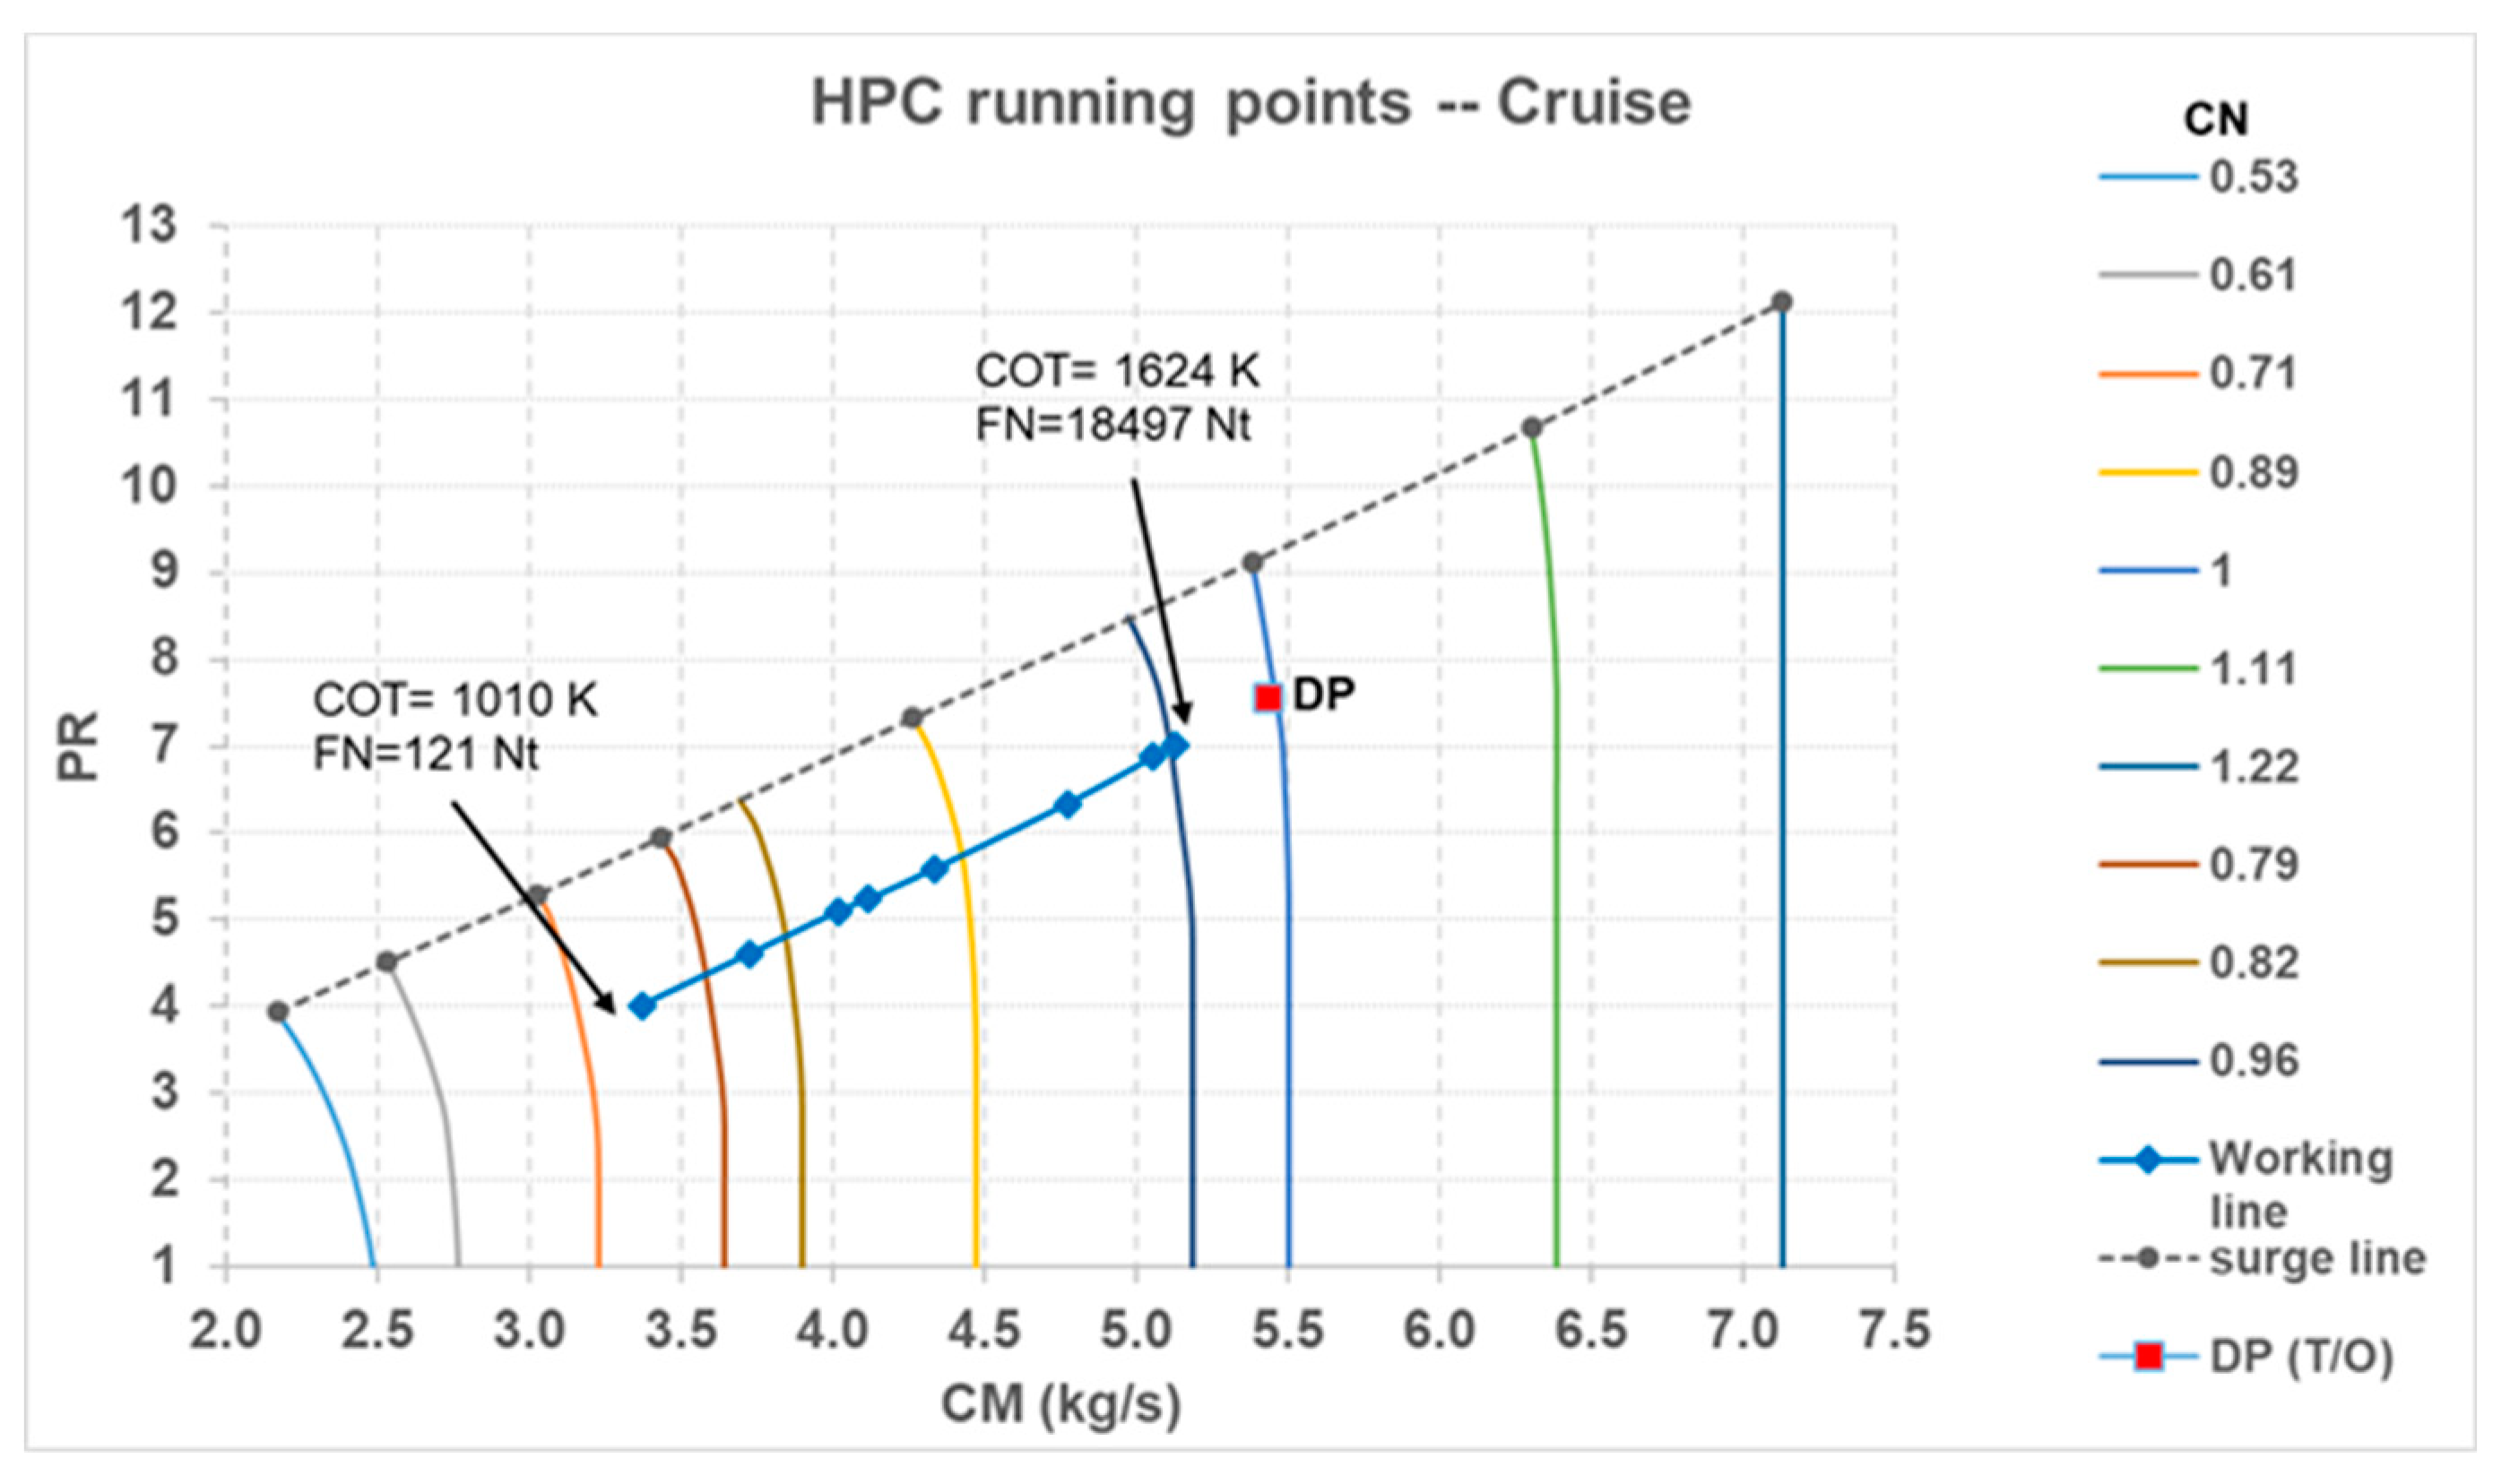
HPC had a more stable behavior for the different values of fuel flow (
Figure 11). COT was reduced (i.e., NH CN), and consequently the nozzle mass flow capacity was reduced; thus, the core nozzle became un-choked.
5. SFC Exchange Rate Analysis
After analyzing the engine performance, exchange rates analysis was conducted to explore the relationship between changes in component performance levels and their resulting impact on engine parameters. Different cases were examined to assess the effect of bypass pressure loss and air mass extraction on the engine SFC. Both DP exchange rate and synthesis exchange rate analysis were investigated. The engine performance simulation code (Turbomatch) was used to assess engine performance. Preliminary calculations were done to estimate the effect of adding heat and increasing the fuel temperature as well. The scenarios are as follow:
Design point (DP) exchange rates: in this scenario, the engine geometry is changed, and the cycle is fixed at cruise conditions by running the simulation as design point steps. The objective is to study the impact of a small change in leading component performance levels on engine DP performance parameters.
Synthesis exchange rates: in this scenario, the engine geometry is fixed (i.e., fixed components defined for the DP) and engine cycle changes. (T/O is set as design point, and then simulations are run at off-design cruise condition). The objective is to study the real effect of making only the subject change with the rest of the engine hardware unchanged.
In both scenarios, the following cases were examined:
Effect of bypass duct pressure loss 1% to 4%
Effect of bypass duct mass flow loss 1% to 4%
Effect of core mass flow into bypass 1% to 4%
For the synthesis scenario, an additional case was also examined to consider the effect of power offtake from HPT by extracting 20 kW, 30 kW, 40 kW, and 50 kW on top of the 37.5 kW (DP value).
5.1. Design Point Exchange Rates
To conduct the simulation in this scenario, the engine was sized at cruise conditions as the engine operates at this point for the majority of the flight mission duration, and the cycle was fixed (i.e., all the simulations were performed as DP). The operating parameters are shown in
Table 4.
In these cases, the components design parameters (pressure ratios (PRs), efficiencies (ETAs), COT, etc.) were fixed, and only the bypass duct pressure loss (Ploss) and extraction air mass flow from the core (Wair) varied. The engine geometry changed to meet the design point requirements. The value of SFC was calculated and compared with the initial DP (Ploss 1% and no Wair extraction). It was found that in all cases, there was a detrimental effect on SFC when Ploss and bleed Wair increased.
In terms of the bypass duct P
loss (station 25–26,
Figure A1), there was a linear relation due to the effect of pressure force in the thrust calculation, as the nozzle operated at choked conditions (
Figure 12). SFC values were normalized to the initial DP (i.e., P
loss 1%), which was shown by when the pressure loss in the bypass duct increased from 1% to 4%, there was an SFC deterioration by 6.7%. This additional P
loss caused a reduction of PR across the bypass nozzle and consequently a reduction of thrust contribution from the bypass stream.
Similar effects were found when airflow was extracted from LPC and HPC, and it was driven to the bypass duct (stations 6 and 8, respectively, in
Figure A1). One more case was also examined: the extraction of airflow from the bypass air duct to the aircraft cabin (station 24 in
Figure A1).
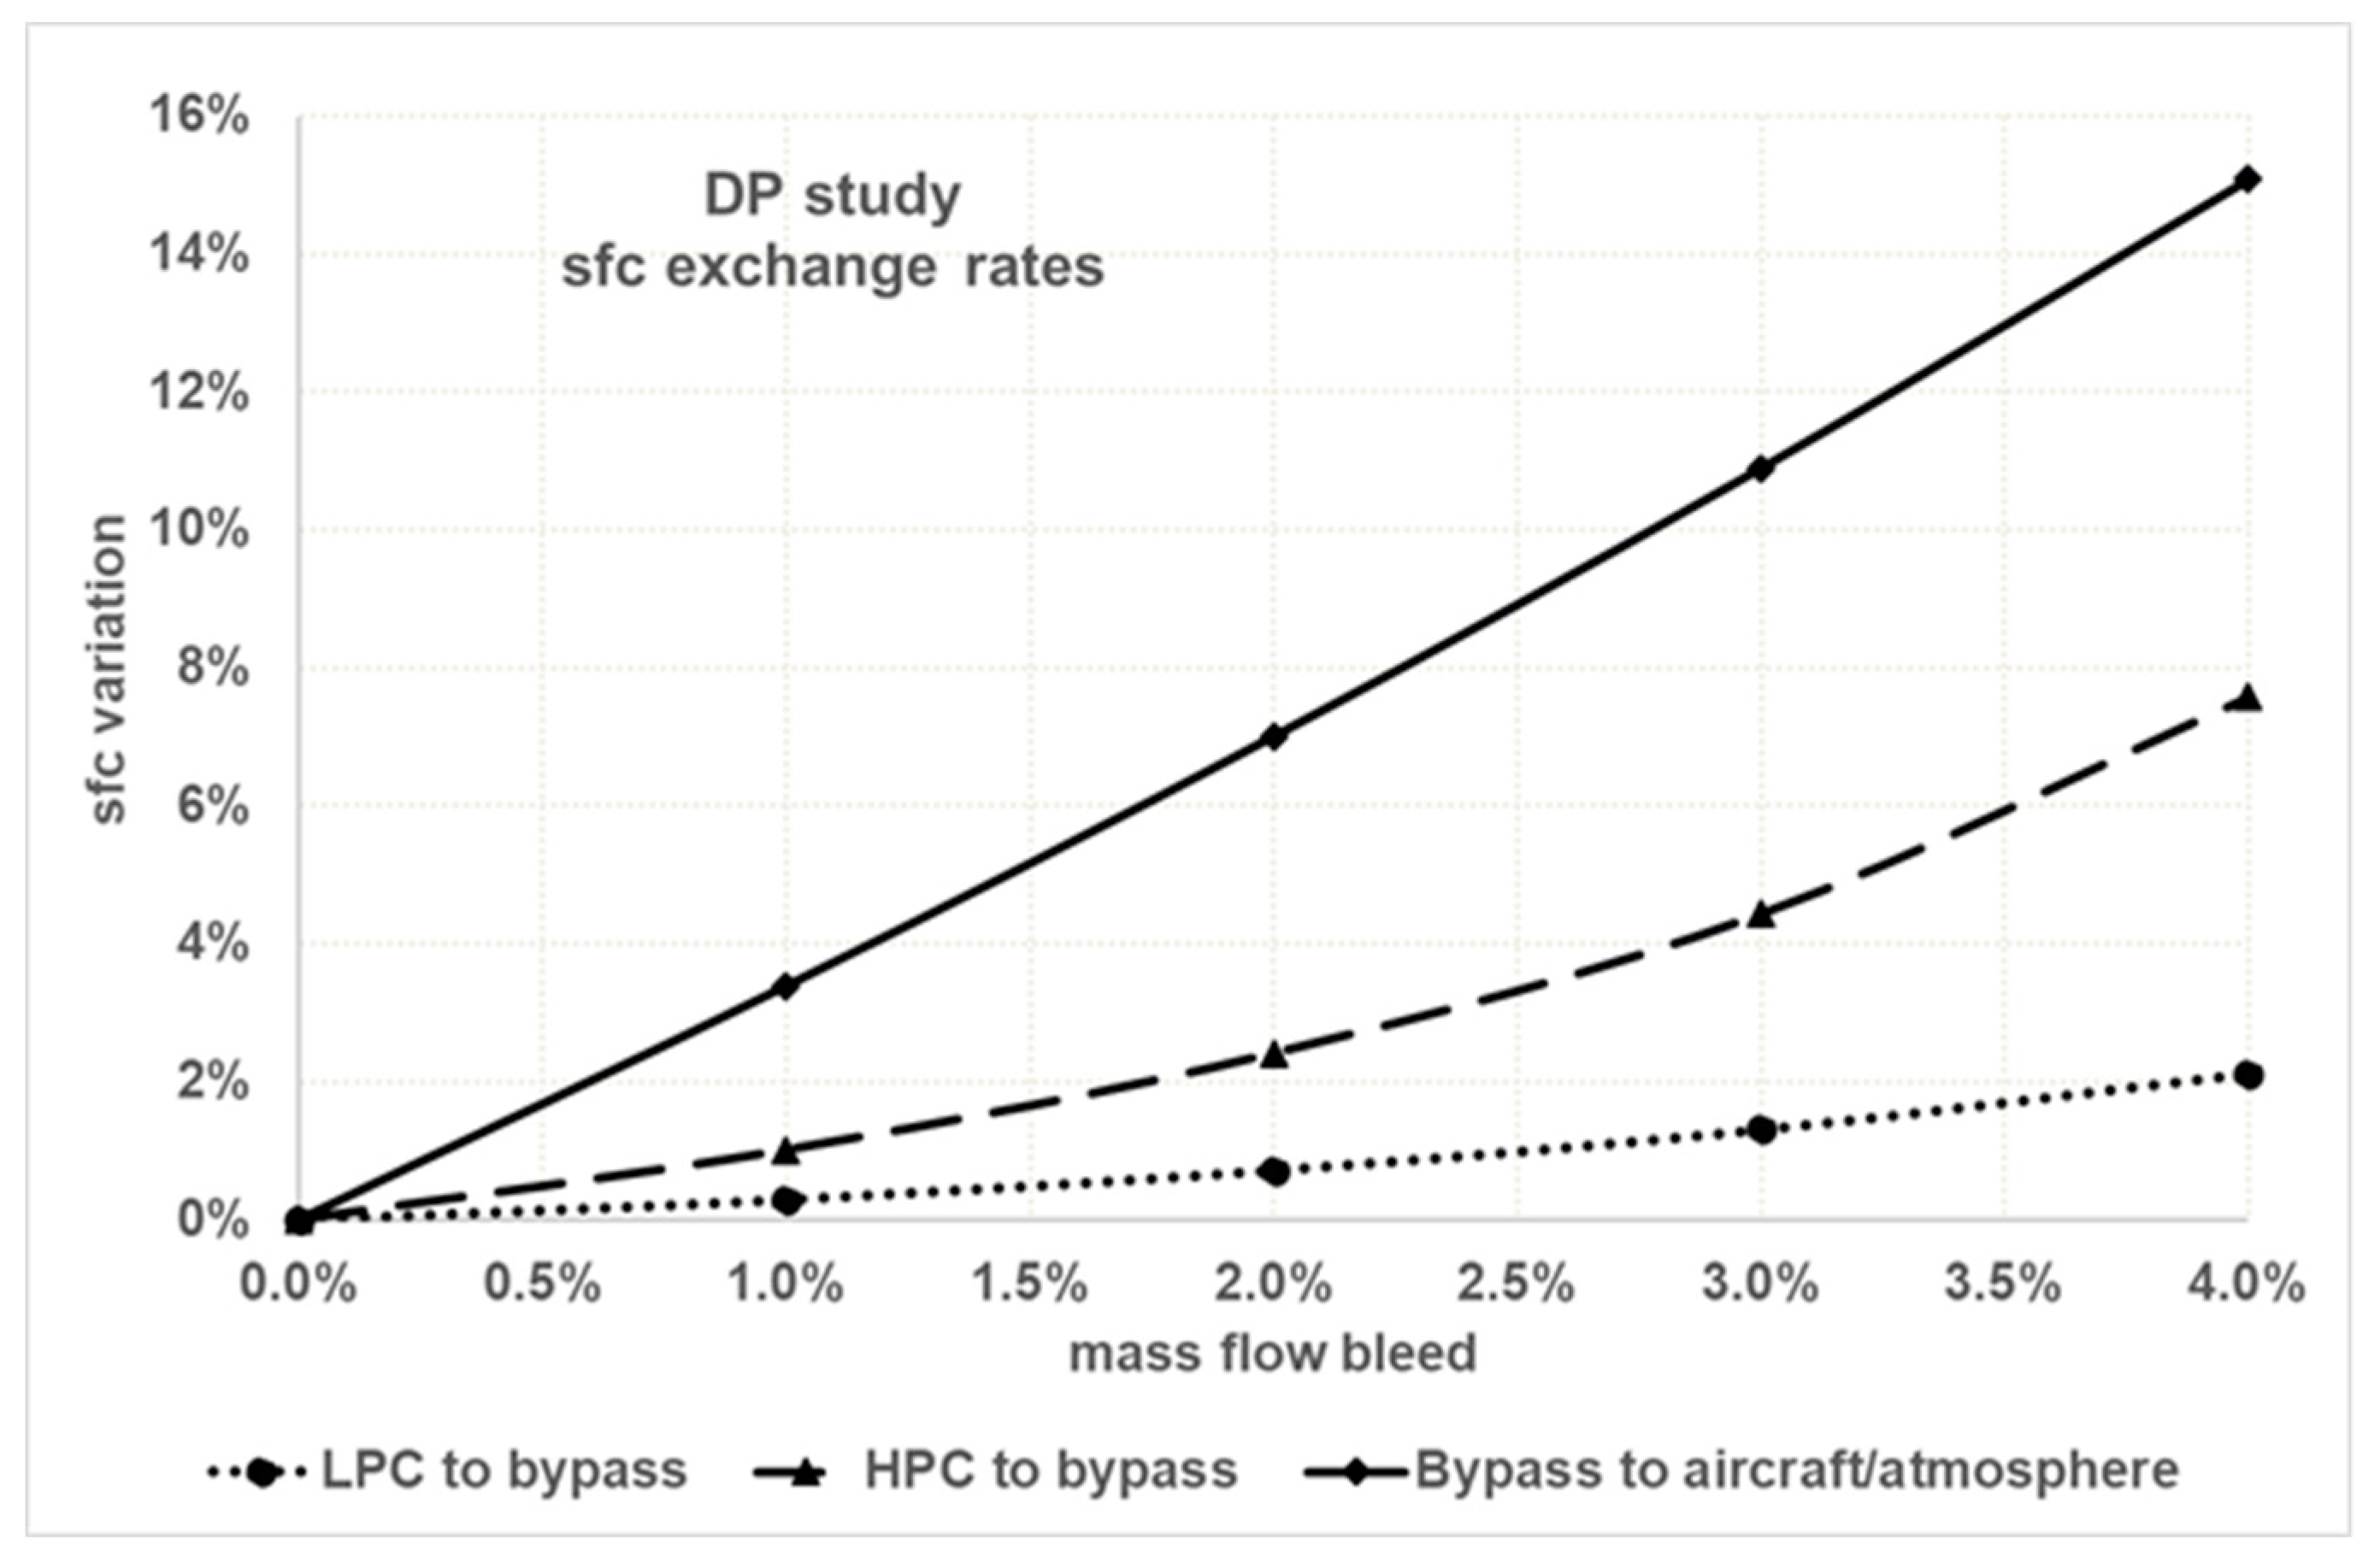
Air was extracted from the LPC and HPC and driven to the bypass duct. The air, which was extracted from the bypass duct, was driven to the aircraft systems, i.e., it escaped from the engine air path. It is worth noting that the cases were considered independently. It was shown that the bypass mass flow extraction had a great influence on engine exchange rates (3% bleed causes an 11% SFC deterioration, as shown in
Figure 13). This was explained by the first order effect the bypass mass flow had on the thrust calculation, and the high value of bypass air mass flow compared with the core flow.
The utilization of AOHE using air from the bypass duct and FOHE using the fuel to cool the oil is common in an engine’s thermal management architecture. The added heat of 50 kW to 150 kW either to the bypass duct (reflecting AOHE installation) or to the fuel (reflecting the FOHE utilization to pre heat the fuel) was investigated. Taking into account the fuel’s low heating value (LHV) and based on enthalpy calculations, the added heat to the fuel caused a reduction in fuel flow for the same value of combustor temperature rise. The cases were examined independently (not in any combination of them) for constant FN. Additionally, the Ploss for the AOHE was assumed constant at 1%.
The results in the case of the design point exchange rates showed that the use of FOHE had a greater beneficial effect than the use of AOHE on the SFC exchange rates. Having preheated the fuel to an equivalent of 150 kW, the SFC was reduced by 1.33%, while this reduction was 0.45% when the bypass air was heated by the same amount (
Figure 14). This was justified by the fact that adding heat to the bypass duct had a minor effect on the bypass air flow T due to the high value of mass flow.
5.2. Synthesis Exchange Rates
In this case, the DP was at T/O (DP parameters, as in
Table 2), and the exchange rates were calculated at cruise, which is an OD operating point (cruise parameters in
Table 4). Therefore, the engine geometry was fixed and the cycle changed. The engine was sized at T/O conditions, and the geometry was fixed. Then, the simulations for the exchange rates were performed at cruise conditions as OD steps.
For the above operating condition, different bypass duct Ploss values and mass flow extraction points were simulated for constant power settings (i.e., COT), and the impact on performance was calculated.
The results showed similar trends as the fixed cycle cases (
Figure 13 and
Figure 14). There was a considerable impact when P
loss increased in the bypass duct. SFC deteriorated linearly when P
loss increased (from 1% to 4%, SFC deteriorated 7%;
Figure 15).
Regarding the air mass bleed, the following cases were investigated (1% to 4% variation, stations refer to the engine model in
Figure A1):
LPC bleed to the bypass flow (station 6)
HPC bleed to the bypass flow (station 8)
Bypass bleed overboard (station 24)
LPC bleed overboard (station 7)
HPC bleed overboard (station 9)
It was found that any air mass flow extraction either from the bypass duct or the core flow had a considerable deterioration in SFC. This was justified by the fact that air mass flow had a direct effect on the bypass thrust. This was well evident when mass flow bled from the bypass duct, causing a 3.3% SFC reduction for 1% bleed, which corresponded to 1.9 kg/s. However, the magnitude of the impact on engine performance was different and depended strongly on the bleed port location for the same bleed mass flow percentage. It was observed that apart from extracting mass flow from the bypass duct, having an HPC overboard bleed was also detrimental for engine performance. For a 4% HPC bleed, SFC deteriorated by 4.7% and 6.6% when air was driven to bypass and overboard, respectively (
Figure 16). Extracting high pressure air from the core had a detrimental effect, as the turbine work (both HPT and LPT) were reduced. When the air was driven to the bypass duct, there was a small compensation due to bypass mass flow and pressure increase.
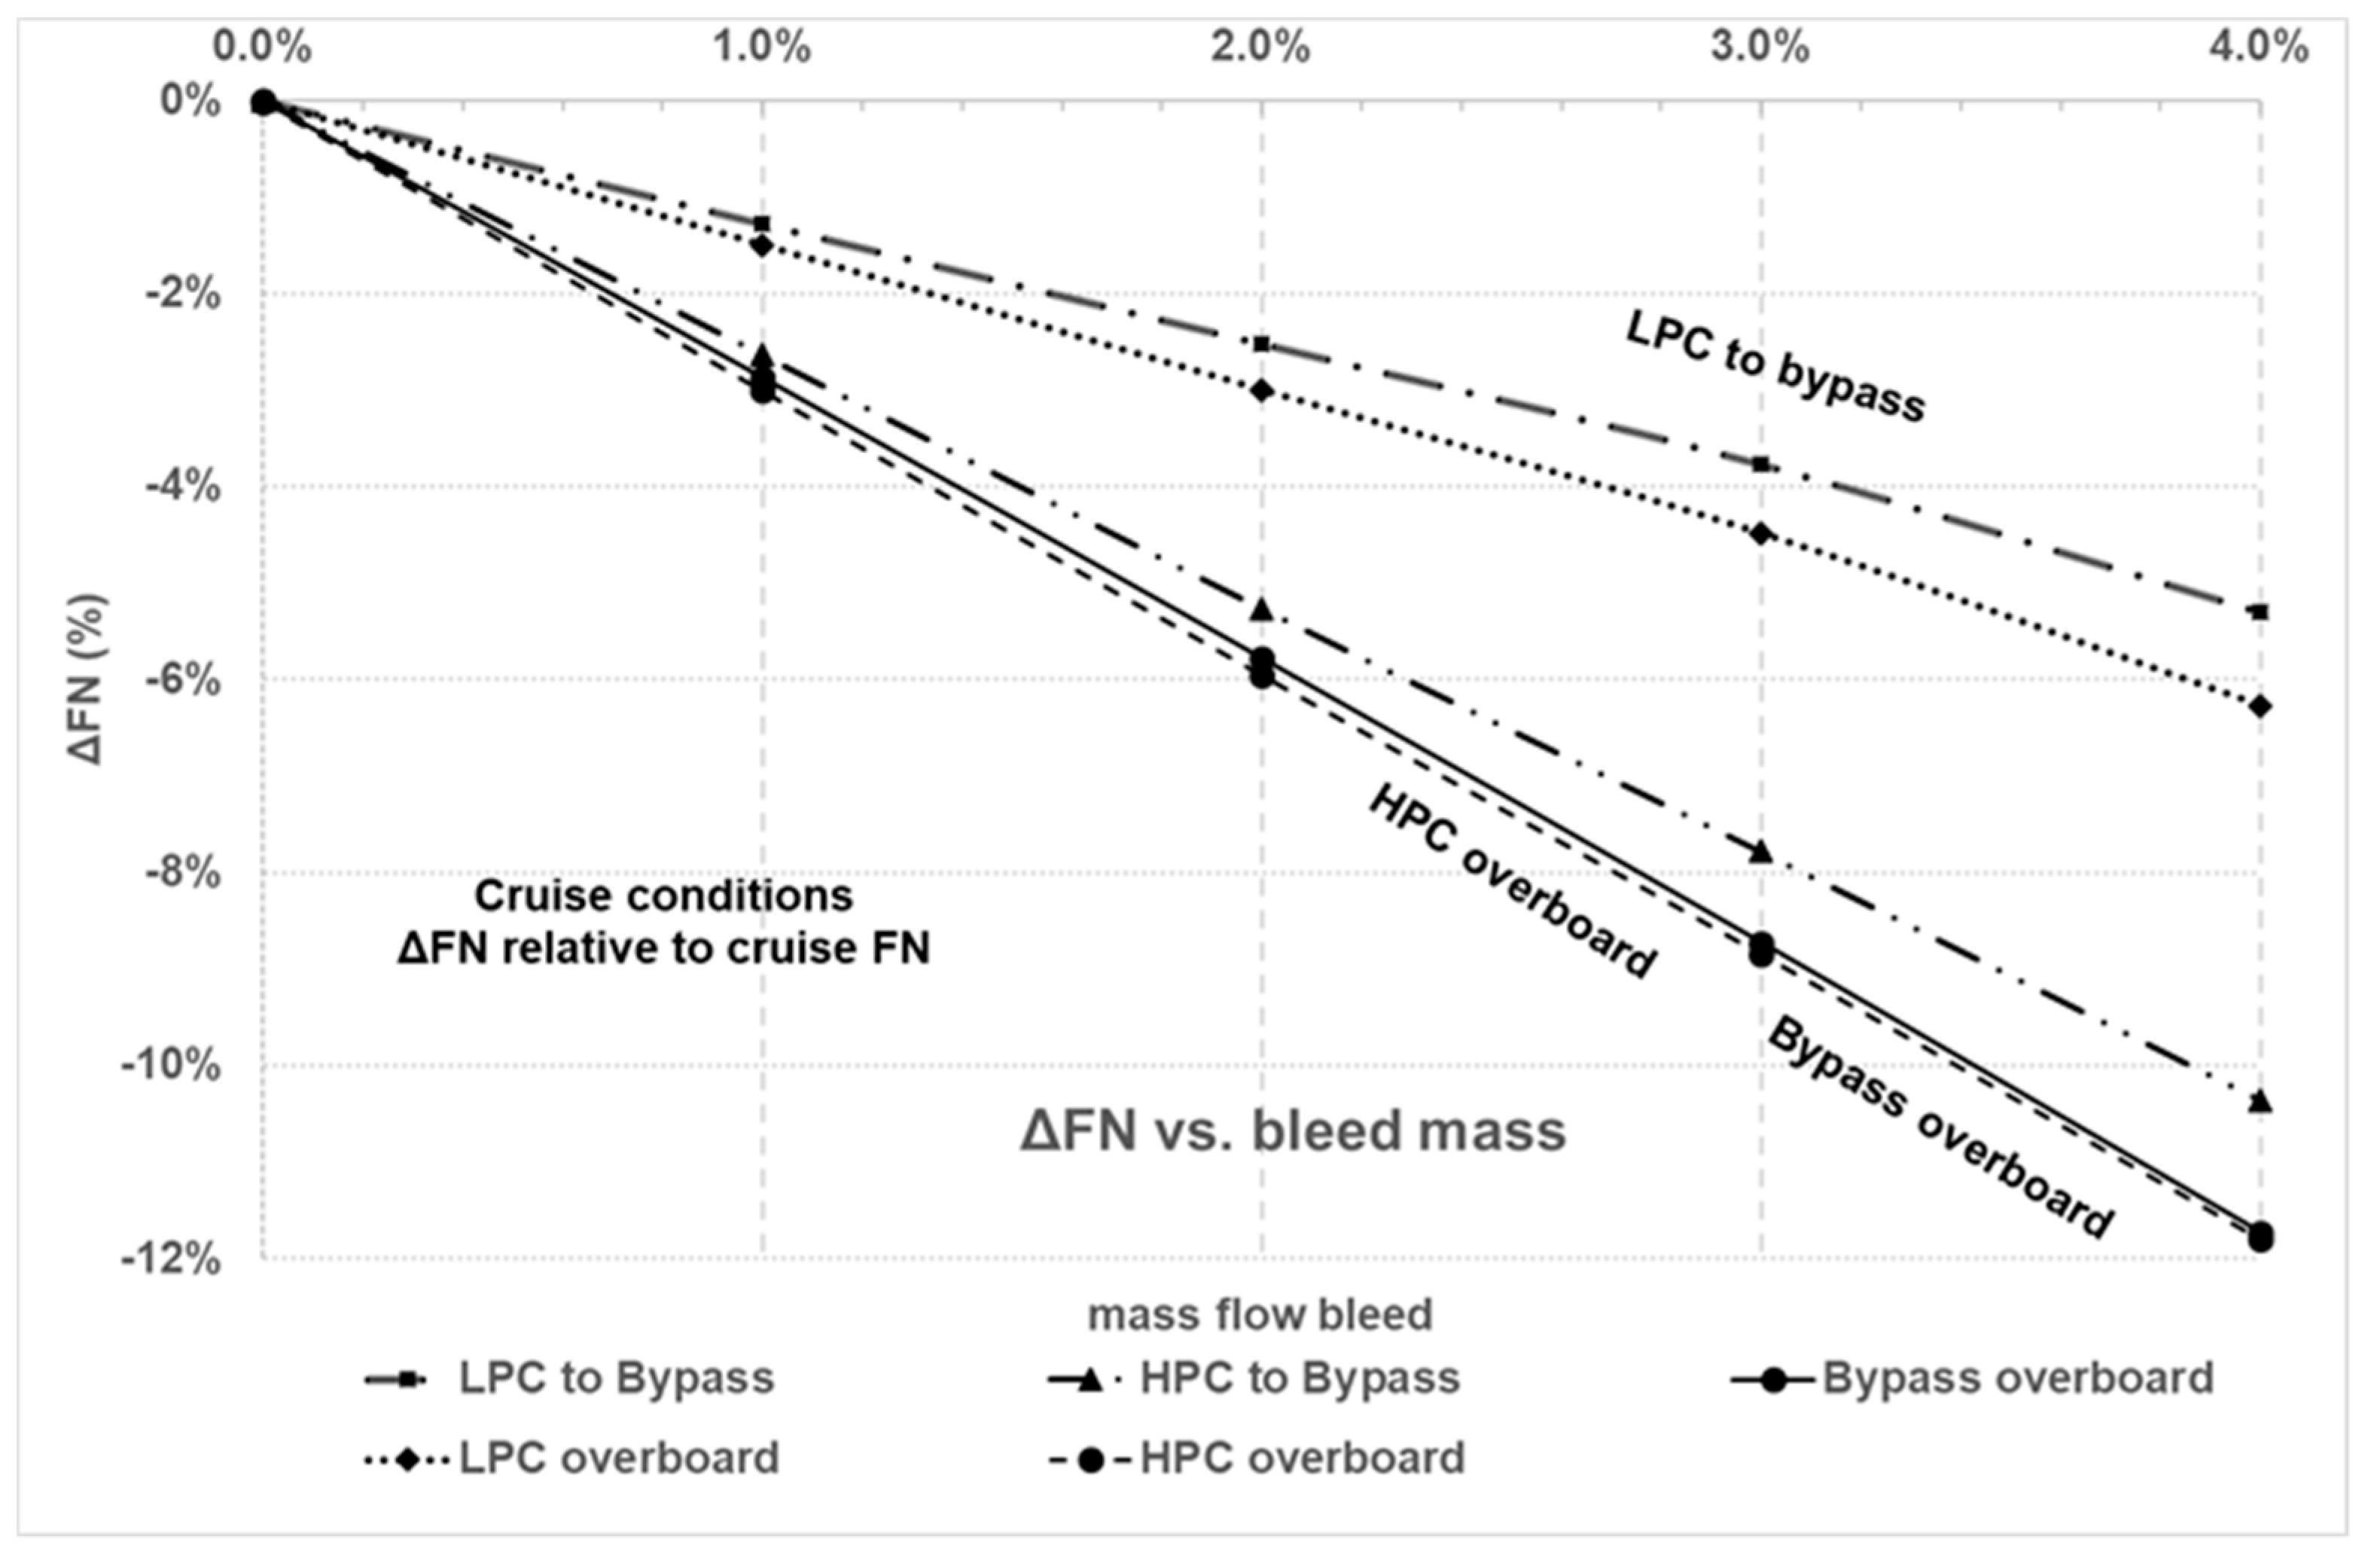
For constant power settings (i.e., COT), the FN was reduced for the different bleed port locations and extracted mass flow values. HPC and bypass overboard had a dominant effect on FN reduction, being 11.73% and 11.8%, respectively, for 4% mass flow bleed (
Figure 17).
With regard to the added heat due to the utilization of AOHE and FOHE, it was shown that preheating the fuel offered a greater reduction to the SFC compared to the case in which the heat was directed to the bypass duct. The synthesis exchange rates showed a reduction of 1.32% for 150 kW added to the fuel before combustion (
Figure 18). For the same amount of heat, the reduction was 0.38% in the case of AOHE.
Therefore, for the thermal management point of view, it is better to cool the oil by using FOHE. However, there is a limitation on the maximum temperature the fuel can have before combustion due to cracking problems. Consequently, the use of AOHE is necessary in combination with FOHE.
The effect of HPT power offtake on engine performance at cruise conditions was also investigated. At DP, HPT auxiliary work for this engine model is 37.5 kW. A number of cases were investigated for constant power setting at cruise conditions, with a range of HPT power offtake up to 133% to reflect the additional auxiliary power requirements from the aircraft and engine systems. The increase of power offtake caused an increase in SFC, as the HPT expands to lower P in order to provide the extra power. Doubling the HPT power offtake increases the SFC by approximately 0.63%, while an addition of 133% HPT power offtake causes an increase in SFC by 0.96% (
Figure 19).
6. Conclusions
The performance parameters and design characteristics for the next generation of ultra-high bypass ratio geared turbofan engines were presented in this paper. This type of engine is the best candidate to be assumed with a 2025 entry into a service level of technology. By using a systematic categorization, it is concluded that the ultra-high bypass ratio geared turbofan engine has the potential to deal with the remaining challenges for future propulsion systems in air travel applications.
For this type of engine, thermal management is a big challenge, as the increased BPR requires a larger power gearbox, and this will increase drastically the generated heat loads. The utilization of AOHE and FOHE has an impact on engine performance.
In order to assess this impact, the design point and synthesis exchange rates analysis were conducted to study the relationship between changes in component performance levels and changes in engine parameters. The exchange rates results show a linear relation between the amount of bypass duct pressure loss and deterioration of the engine SFC. The exchange rates analysis on the air bleed extraction (LPC bleed to the bypass flow, HPC bleed to the bypass flow, bypass bleed overboard, LPC bleed overboard, and HPC bleed overboard) confirms that any air bleed from the bypass duct has a considerable deterioration in SFC (i.e., for 4% HPC air bleed, SFC deteriorates 4.7% and 6.6%, when air is driven to bypass and overboard, respectively).
It was found that any pressure loss in the bypass duct causes a considerable increase in the SFC. For the engine under investigation with a BPR of 15 and thrust level of 111.2 kN at take-off, a 4% pressure loss in the bypass duct causes a 7% SFC increase at cruise conditions. Therefore, minimizing the pressure loss in the AOHE should be a priority for the designer.
It was also found that the utilization of FOHE improves the SFC at a higher rate than AOHE. For the performance characteristics of the examined engine, the benefit was 1.33%, while for the AOHE it was 0.38%. Therefore, for the thermal management system design, the utilization of FOHE should be done to the maximum level trying to increase the fuel temperature to the maximum permissible level.
The effect of HPT power offtake was also investigated, and the results confirm that the increase of this work caused a deterioration in SFC (i.e., when the HPT auxiliary work increases by 133%, SFC deteriorates by 0.96%).
The reported results and design could be utilized for the detailed design, optimization, and development of the next generation of civil turbofan engines for 2025 and beyond.
Author Contributions
Conceptualization, T.N. and P.P.; methodology, T.N. and S.J.; software, S.J.; validation, T.N., S.J., and D.B.; formal analysis, T.N. and P.P.; investigation, T.N., S.J., and D.B.; resources, P.P.; data curation, D.B.; writing—original draft preparation, T.N.; writing—review and editing, T.N., S.J., and D.B.; visualization, T.N.; supervision, T.N. and P.P.; project administration, P.P.; funding acquisition, T.N. and P.P. All authors have read and agreed to the published version of the manuscript.
Funding
This work was conducted under the Ultra High Bypass Ratio Aero Engine Thermal Systems (UHBR Thermals) Programme, funded by Meggitt PLC and Innovate UK (grant No: 91855-263266).
Conflicts of Interest
The authors declare no conflict of interest.
Appendix A
Figure A1.
Engine model drawing (grey area: bypass duct).
Figure A1.
Engine model drawing (grey area: bypass duct).
References
- European Commission Directorate-General for Research and Innovation Directorate General for Mobility and Transport. Flightpath 2050 Europe’s Vision for Aviation; Report of the High Level Group on Aviation Research; Publications Office of the EU: Luxembourg, 1972; ISBN 978-92-79-19724-6. [Google Scholar] [CrossRef]
- Denning, R.M.; Hooper, J.A. Prospects for Improvement in Efficiency of Flight Propulsions Systems. AIAA J. Aircraft 1972, 9, 9–15. [Google Scholar] [CrossRef]
- Armstrong, F.W. The aero engine and its progress—Fifty years after Griffith. RAeS Aeronaut. J. 1976, 80, 499–520. [Google Scholar]
- Jackson, A.J.B. Some Future Trends in Aero Engine Design for Subsonic Transport Aircraft. ASME J. Eng. Power 1976, 98, 281–289. [Google Scholar] [CrossRef]
- Wilde, G.L. Future large civil turbofans and power plants. RaeS Aeronaut. J. 1978, 82, 281–299. [Google Scholar]
- Watts, R. European air transport up to the year 2000. RAeS Aeronaut. J. 1978, 82, 300–312. [Google Scholar]
- Strack, W.C.; Knip, G.; Weisbrich, A.L.; Godston, J.; Bradley, E. Technology and Benefits of Aircraft Counter Rotation Propellers. In Proceedings of the 1982 Aerospace Congress and Exposition, Anaheim, CA, USA, 25–28 October 1982. NASA Technical Memorandum 82983, Document ID 19830002859. [Google Scholar]
- Bates, R.E.; Morris, J. A McDonnell Douglas Perspective—Commercial Aircraft for the Next Generation. In Proceedings of the AIAA Aircraft Design, Systems and Technology Meeting, Fort Worth, TX, USA, 17–19 October 1983. [Google Scholar] [CrossRef]
- Borradaile, J.A. Towards the optimum ducted UHBR engine. In Proceedings of the AIAA/SAE/ASME/ASEE 24th Joint Propulsion Conference, AIAA-89-2954, Boston, MA, USA, 11–13 July 1988. [Google Scholar]
- Zimbrick, R.A.; Colehour, J.L. An Investigation of Very High Bypass Ratio Engines for Subsonic Transports. In Proceedings of the AIAA/SAE/ASME/ASEE 24th Joint Propulsion Conference, AIAA-88-2953, Boston, MA, USA, 11–13 July 1988. [Google Scholar]
- Peacock, N.J.; Sadler, J.H.R. Advanced Propulsion Systems for Large Subsonic Transports. ASME J. Propuls. Power 1992, 8, 703–708. [Google Scholar] [CrossRef]
- Cumpsty, N. Jet Propulsion: A Simple Guide to the Aerodynamic and Thermodynamic Design and Performance of Jet Engines; Cambridge Engine Technology Series; Cambridge University Press: Cambridge, UK, 1997; ISBN 978-0521541442. [Google Scholar]
- Jenkinson, L.R.; Simpkin, P.; Rhodes, D. Civil Jet Aircraft Design, 1st ed.; Arnold: London, UK, 1999; ISBN 0-340-74152-X. [Google Scholar]
- Birch, N.T. 2020 vision: The prospects for large civil aircraft propulsion. Aeronaut. J. 2000, 104, 347–352. [Google Scholar]
- Ruffles, P.C. The future of aircraft propulsion. Proc. Inst. Mech. Eng. Part C J. Mech. Eng. Sci. 2000, 214, 289–305. [Google Scholar] [CrossRef]
- Saravanamuttoo, H.I.H. The Daniel and Florence Guggenheim Memorial Lecture—Civil Propulsion; The Last 50 Years. In Proceedings of the ICAS 23rd International Congress of Aeronautical Sciences, Toronto, ON, Canada, 8–13 September 2002. [Google Scholar]
- Schimming, P. Counter Rotating Fans—An Aircraft Propulsion for the Future. J. Therm. Sci. 2003, 12, 97–103. [Google Scholar] [CrossRef]
- Newton, P.; Holsclaw, C.; Ko, M.; Ralph, M. Long Term Technology Goals for CAEP/7. In Proceedings of the 7th Meeting of CAEP, ICAO Colloquium on Aviation Emissions with Exhibition, London, UK, 14–16 May 2007. [Google Scholar]
- Kyprianidis, K.G.; Grönstedt, T.; Ogaji, S.O.T.; Pilidis, P.; Singh, R. Assessment of Future Aero-engine Designs with Intercooled and Intercooled Recuperated Cores. ASME J. Eng. Gas Turbines Power 2011, 133. [Google Scholar] [CrossRef]
- Larsson, L.; Grönstedt, T.; Kyprianidis, K.G. Conceptual Design and Mission Analysis for a Geared Turbofan and an Open Rotor Configuration. In Proceedings of the ASME 2011 Turbo Expo: Turbine Technical Conference and Exposition, Vancouver, BC, Canada, 6–10 June 2011; pp. 359–370. [Google Scholar] [CrossRef]
- Bijewitz, J.; Seitz, A.; Hornung, M. Architectural Comparison of Advanced Ultra-High Bypass Ratio Turbofans for Medium to Long Range Application; Document ID 340105; Deutscher Luft- und Raumfahrtkongress: Augsburg, Germany, 2014. [Google Scholar]
- Graham, W.R.; Hall, C.A.; Morales, M.V. The potential of future aircraft technology for noise and pollutant emissions reduction. Transp. Policy 2014, 34, 36–51. [Google Scholar] [CrossRef] [Green Version]
- Filippone, A. Aircraft noise prediction. Progress Aerosp. Sci. 2014, 68, 27–63. [Google Scholar] [CrossRef]
- Leeham Co EU. GE Engines Faces Challenge from PW, RR GTF Technology. 2014. Available online: http://leehamnews.com/2014/04/07/ge-engines-faces-challenge-from-pw-rr-gtf-technology/ (accessed on 9 May 2020).
- Tobi, A.L.M.; Ismail, A.E. Development in Geared Turbofan Aero-engine. In Proceedings of the 4th International Conference on Manufacturing, Optimization, Industrial and Material Engineering (MOIME 2016), Bali, Indonesia, 19–20 March 2016. [Google Scholar] [CrossRef] [Green Version]
- Hemmer, H.; Otten, T.; Plohr, M.; Lecht, M.; Döpelheuer, A. Influence of the Bypass Ratio on Low Altitude NOx Emissions. In Proceedings of the 1st CEAS European Air and Space Conference Proceedings, CEAS-2007-137, Berlin, Germany, 10–13 September 2007; pp. 1185–1193. [Google Scholar]
- Jackson, A.J.B. Optimisation of Aero and Industrial Gas Turbine Design for the Environment. Ph.D. Thesis, Cranfield University, Cranfield, UK, 2009. [Google Scholar]
- Kyprianidis, K.G. Multi-Disciplinary Conceptual Design of Future Jet Engine Systems. Ph.D. Thesis, Cranfield University, Cranfield, UK, 2010. [Google Scholar]
- Collier, F.; Thomas, R.; Burley, C.; Nickol, C.; Lee, C.M.; Tong, M. Environmentally Responsible Aviation—Real Solutions for Environmental Challenges Facing Aviation. In Proceedings of the 27th International Congress of the Aeronautical Sciences (ICAS), Nice, France, 19–24 September 2010. [Google Scholar]
- Matias, F.M. Turbofan Engine Optimization for Low NOx Emissions. Master’s Thesis, University of Tecnico, Lisbon, Portugal, September 2016. Available online: https://fenix.tecnico.ulisboa.pt/cursos/memec/dissertacao/283828618789824 (accessed on 30 September 2016).
- MTU Aero Engines AG Company Presentation, Investor Relations. 2018. Available online: http://www.mtu.de/fileadmin/EN/5_Investor_Relations/3_Company_Profile/IR_company_presentation.pdf (accessed on 12 October 2018).
- Meggitt PLC. Project Internal Presentation; Meggitt PLC: Coventry, UK, 2019. [Google Scholar]
- International Civil Aviation Organization. ICAO Engine Exhaust Emissions Data Bank—CFM56-5B1; ICAO: Montreal, QC, Canada, 2013. [Google Scholar]
- European Turbine Network (ETN). Micro Gas Turbine Technology Summary: Research and Development for European Collaboration; Technical Report; European Turbine Network (ETN): Brussels, Belgium, 2017. [Google Scholar]
- European Turbine Network (ETN). Research and Development Recommendation Report 2016—For the Next Generation of Gas Turbines; Technical Report; European Turbine Network (ETN): Brussels, Belgium, 2017. [Google Scholar]
- Rahman, M.; Zaccaria, V.; Zhao, X.; Kyprianidis, K. Diagnostics-oriented modelling of micro gas turbines for fleet monitoring and maintenance optimization. J. Process. 2018, 6, 216. [Google Scholar] [CrossRef] [Green Version]
- Zeinalpour, M.; Mazaheri, K.; Irannejad, A. Sensitivity Analysis of Gas Turbine Fuel Consumption With Respect to Turbine Stage Efficiency. In Proceedings of the ASME 2012 International Mechanical Engineering Congress and Exposition, Houston, TX, USA, 9–15 November 2012; pp. 419–423. [Google Scholar] [CrossRef]
- Di Montenegro, G.N.; Peretto, A. Sensitivity Analysis on Brayton Cycle Gas Turbine Performance. ASME J. Eng. Gas Turbines Power 1997, 119, 910–916. [Google Scholar] [CrossRef]
- Kwak, H.-Y.; Kang, K.-M. Sensitivity analysis of component efficiencies on performance of a gas turbine cogeneration system. Int. J. Exergy 2011, 9, 337–345. [Google Scholar] [CrossRef]
- Macmillan, W.L. Development of a Modular Type Computer Program for the Calculation of Gas Turbine Off-Design Performance. Ph.D. Thesis, Cranfield Institute of Technology, Cranfield, UK, 1974. [Google Scholar]
- Nikolaidis, T. The TURBOMATCH Scheme for Gas Turbine Performance Calculations; Cranfield University: Cranfield, UK, 2019. [Google Scholar]
- Laskaridis, P.; Pilidis, P.; Kotsiopoulos, P. An integrated engine - aircraft performance platform for assessing new technologies in aeronautics. In Proceedings of the 17th International Symposium on Air Breathing Engines, ISABE-2005-1165, Munich, Germany, 4–9 September 2005. [Google Scholar]
- Nalianda, D.K.; Kyprianidis, K.G.; Sethi, V.; Singh, R. Techno-economic viability assessments of greener propulsion technology under potential environmental regulatory policy scenarios. Appl. Energy 2015, 157, 35–50. [Google Scholar] [CrossRef] [Green Version]
- Available online: http://www.eurocontrol.int/services/bada (accessed on 14 May 2019).
- Walsh, P.; Fletcher, P. Gas Turbine Performance; Blackwell Science: Hoboken, NJ, USA, 2004; ISBN 9780470774533. [Google Scholar] [CrossRef]
Figure 1.
Typical thermal management system.
Figure 1.
Typical thermal management system.
Figure 2.
Bypass heat exchange system [
32].
Figure 2.
Bypass heat exchange system [
32].
Figure 3.
CFM56 drawing [
33].
Figure 3.
CFM56 drawing [
33].
Figure 4.
FN profile relative to T/O value.
Figure 4.
FN profile relative to T/O value.
Figure 5.
ISA hot and cold day ambient temperature variations with altitude [
45].
Figure 5.
ISA hot and cold day ambient temperature variations with altitude [
45].
Figure 6.
TET variation due to ISA ambient temperature variation.
Figure 6.
TET variation due to ISA ambient temperature variation.
Figure 7.
SFC and fuel flow at different flight phases.
Figure 7.
SFC and fuel flow at different flight phases.
Figure 8.
SFC variation due to ambient conditions.
Figure 8.
SFC variation due to ambient conditions.
Figure 9.
IPC running points at different flight phases (ISA).
Figure 9.
IPC running points at different flight phases (ISA).
Figure 10.
IPC running line at cruise.
Figure 10.
IPC running line at cruise.
Figure 11.
HPC running line at cruise.
Figure 11.
HPC running line at cruise.
Figure 12.
Bypass duct P loss effect on SFC (DP at cruise).
Figure 12.
Bypass duct P loss effect on SFC (DP at cruise).
Figure 13.
Bypass duct mass flow effect on SFC (DP study).
Figure 13.
Bypass duct mass flow effect on SFC (DP study).
Figure 14.
Added heat effect on SFC (DP study).
Figure 14.
Added heat effect on SFC (DP study).
Figure 15.
Effect of bypass duct pressure loss.
Figure 15.
Effect of bypass duct pressure loss.
Figure 16.
SFC exchange rates vs. bleed mass.
Figure 16.
SFC exchange rates vs. bleed mass.
Figure 17.
FN change vs. bleed mass.
Figure 17.
FN change vs. bleed mass.
Figure 18.
Added heat effect on SFC (synthesis exchange rates).
Figure 18.
Added heat effect on SFC (synthesis exchange rates).
Figure 19.
SFC exchange rates vs. HPT power offtake.
Figure 19.
SFC exchange rates vs. HPT power offtake.
Table 1.
Engine performance optimization parameters.
Table 1.
Engine performance optimization parameters.
| Parameter |
|---|
| OPR cruise: min = 35, max = 55 |
| FPR_hub cruise: min = 1.1, max = 1.8 and FPR_outer > FPR_hub |
| TET cruise: min = 1450 K, max = 1650 K |
| BPR cruise: min = 12, max = 18 |
| Max combustor outlet temperature: 1900 K |
| Max compressor outlet temperature: 1000 K |
| Max surge margin parameter Z for all compressors: 0.975 |
| Polytropic efficiency Eta_poly fan outer cruise: 93% |
| Polytropic efficiency Eta_poly fan inner cruise: 94% |
| Polytropic efficiency Eta_poly booster cruise: 91% |
| Polytropic efficiency Eta_poly HPC cruise: 89% |
| Polytropic efficiency Eta_poly HPT cruise: 90% |
| Polytropic efficiency Eta_poly LPT cruise: 91% |
| FN cruise: 18,500 N |
| FN T/O: 111,200 N |
Table 2.
DP (T/O) optimized parameters (International Standard Atmosphere (ISA)) for the UHBR-GTF.
Table 2.
DP (T/O) optimized parameters (International Standard Atmosphere (ISA)) for the UHBR-GTF.
| Parameter | Unit | Values |
|---|
| Mass flow | Kg/s | 446.9 |
| BPR | | 15.05 |
| Fan surge margin | | 0.862 |
| Bypass FPR | | 1.431 |
| Bypass isentropic efficiency | | 0.92471 |
| Core FPR | | 1.324 |
| Core isentropic efficiency | | 0.93724 |
| LPC PR | | 5.221 |
| HPC PR | | 7.575 |
| OPR | | 52.36 |
| COT | K | 1868 |
| TET | K | 1817.7 |
| Combustor Ploss | | 4.87% |
| Combustor efficiency | | 0.999 |
| HPT cooling flow from HPC | | 10% |
| LPT isentropic efficiency | | 0.93518 |
| HPT isentropic efficiency | | 0.91254 |
| HPT auxiliary power | kW | 37.5 |
| LPT auxiliary power | kW | 120.0 |
| FN | kN | 111.2 |
Table 3.
Flight operating points.
Table 3.
Flight operating points.
| Flight Phase | Alt (ft) | Flight Mach Number |
|---|
| Take off (T/O) | 0 | 0.222 |
| Begin climb | 1500 | 0.388 |
| Climb | 20,000 | 0.589 |
| Top of climb | 32,808 | 0.78 |
| Cruise | 32,808 | 0.78 |
| End of cruise | 36,417 | 0.792 |
| Begin of descent | 37,000 | 0.78 |
| End of descent | 1500 | 0.388 |
| Approach | 1500 | 0.233 |
| Ground idle, taxi | 0 | 0 |
Table 4.
Design engine parameters at cruise conditions.
Table 4.
Design engine parameters at cruise conditions.
| Parameter | Value—Units |
|---|
| Altitude | 10,000 m |
| Mach number | 0.78 |
| Mass flow | 200 kg/s |
| Combustion Outlet Temperature (COT) | 1624 K |
| PR | 54 |
| BPR | 15.6 |
| Bypass Ploss | 1% |
| Publisher’s Note: MDPI stays neutral with regard to jurisdictional claims in published maps and institutional affiliations. |
© 2020 by the authors. Licensee MDPI, Basel, Switzerland. This article is an open access article distributed under the terms and conditions of the Creative Commons Attribution (CC BY) license (http://creativecommons.org/licenses/by/4.0/).


