Article

Evaluation of Heat Insulation and Surface Resistivity of Mineral Lightweight Aggregate Concrete(MLAC)

1
Department of Tourism and Recreation Management, Fooyin University, Kaohsiung City 831, Taiwan
2
Department of Civil Engineering and Engineering Management, National Quemoy University, Quemoy 892, Taiwan
3
School of Architecture and Civil Engineering, Huizhou University, Huizhou 516007, China
4
Department of Civil Engineering, National Kaohsiung University of Science and Technology, Kaohsiung City 807, Taiwan
*
Author to whom correspondence should be addressed.
Appl. Sci. 2020, 10(21), 7871; https://doi.org/10.3390/app10217871
Submission received: 12 October 2020 / Revised: 2 November 2020 / Accepted: 3 November 2020 / Published: 6 November 2020

Abstract

:
In this study, the fixed water/binder ratio is 0.40, four mineral admixtures: fly ash (FA), blast furnace slag (BFS), desulphurization slag (DLS), and glass LED powder (GLP), were added to lightweight aggregate concrete (LWAC), replacing 10% or 30% of the cement content, to study their heat insulation efficiency and engineering performance and to compare the economic impact of mineral admixtures on LWAC. In terms of heat insulation, the thermal conductivity (K value) of the controlled sample was 0.484 kcal/(m.h. °C) and the addition of mineral admixtures changed the concrete unit weight and water absorption ratio, thus reducing the K value by 0.41% to 25.71% and improving the heat insulation. As the mineral admixture hydration products and chemical contents differed, the heat insulation of the LWAC varied as well. The study indicated that the heat insulation is the greatest in concrete with the addition of 30% FA, followed by concrete with the addition of 10% GLP. The addition of mineral admixtures is 30%, the resistivity is 72–455% of the control group, and the resistivity of FA and GLP is higher than the control group. The study is indicated that the proper addition of mineral powder material has an apparent effect on increasing heat insulation efficiency.

1. Introduction

With commercial and industrial development occurring worldwide, energy consumption keeps rising. Current technology R&D focuses on developing solar energy as the “next-generation energy”, but popularizing it in a short time is challenging. Due to global warming in recent years, an increasing problem is the reduction of energy consumption by air conditioning systems in buildings, among which improving air-cooling/heating facility power and building heat insulation has become an important topic [1]. The heat insulation, sound insulation, and fire resistance of the structure of the lightweight aggregate concrete (LWAC) building made of waste materials have been improved, proving its application potential in engineering, safety, and environment [2,3,4,5].
Concrete building accounts for 90% of the total building in Taiwan at present, indicating that concrete is the most commonly used construction material. However, it is not recyclable or environmentally friendly; it poses threats to the living environment and energy conservancy, and thus its use goes against construction trends around the world [1]. Lightweight aggregate is advantageous due to its heat insulation, light mass, and fire resistance [6]; therefore, making use of appropriate material and taking advantage of material physical properties to maximize the thermal energy efficiency is a very important part of all engineering projects. Taiwan possesses the technology necessary to produce excellent quality lightweight aggregate from reservoir sediments through high-temperature sintering. Besides the engineering features offered by this technology, it can increase reservoir capacities, replenish natural sandstone resources, and elevate economic and ecologic values, thus contributing to the conservation of resources [7]. Cement is the most cost and energy-intensive component of concrete [8]. The characteristics of pozzolanic ash historical mortar indicate that two types of volcanic ash have been used in the past: natural pozzolan ash (usually originated from volcanoes) and artificial pozzolan ash (such as ceramic powder) [9]. Partial substitution of pozzolan for cement can reduce cement consumption and lower carbon dioxide discharge. These factors are only indicators of pozzolan reactivity, and they cannot ensure that the lime/pozzolan mortar produced has the best potential performance. Therefore, some studies have shown that the consumption of Ca (OH) 2 in lime/pozzolan ash may be a reliable factor for evaluating pozzolan reactivity and detecting pozzolan products [10,11,12,13].
Concrete made of copper slag can replace sand, thereby obtaining good mechanical properties, while also having environmental protection and technical advantages [14,15]. Besides, many studies are also studying the use of auxiliary cementing materials, such as blast furnace slag, fly ash, silica fume, rice husk ash, and kaolin as calcined natural pozzolans to improve the performance of concrete, especially in combination with raw materials containing pozzolans, such as glass powder [16,17,18].
After adding 10%, 15%, and 20% of glass powder, the average compressive strength of concrete is 70.47, 72.01, and 73.31, respectively [19,20,21]. The average compressive strength values after adding 20%, 40%, and 60% copper slag to replace sand are 72.18, 74.38, and 73.08, respectively [22]. The average compressive strength values after adding 5% and 10% fly ash instead of cement are 71.56 and 73.22. After adding 5% and 10% silica fume instead of cement, the average compressive strength values are 72.33 and 73.53. After adding 5% and 10% rice husk ash instead of cement, the average compressive strength values are 72.86 and 69.49. Compared with glass concrete and copper slag high-strength concrete, the powder reaches the maximum strength under the 20% level of glass instead of cement [23,24,25,26,27]. Using 2 and 4 mm granulated expanded glass aggregate (GEGA) as ingredients with excellent insulating properties and 8 mm granulated fly ash aggregate (GAA) as an ingredient of lightweight aggregates (LWAs) is added to concrete, and these tests were carried out for the density, porosity, compressive strength, and the modulus of elasticity of lightweight concretes (LWCs) [28].
LWC type has higher density and better insulation than burnt brick, so it is more sustainable than it. The properties of fly ash, AAC, and CLC concrete types are further discussed and compared [29,30,31,32]. Compared with traditional concrete, the advantages of aerated lightweight concrete are that the strength/weight ratio is advanced, the thermal expansion coefficient is small, and the sound insulation is high [33,34,35,36]. In the proposed mixture, attention should be paid to dividing aerated lightweight concrete into foam concrete and autoclaved concrete. By taking the density as a constant parameter, it is possible to tabulate their load-bearing capacity in terms of compression, water absorption, and heat insulation and draw conclusions from their performance [37,38,39,40].
Compared with silica fume, fly ash, and nonzeolitic natural pozzolans, the pozzolanic activity of clinoptilolite the most common natural zeolite mineral) has been studied. The chemical, mineralogical, and physical properties of the material are considered in the comparative evaluation. Various test methods were used to evaluate the pozzolanic activity of natural zeolite, including the conductivity of the lime-pozzolan suspension as well as free lime content, compressive strength, and pore size distribution of hardened lime-volcanic ash [41,42,43,44]. The results show that clinoptilolite has lime-pozzolan reactivity comparable to silica fume and is higher than fly ash and nonzeolite natural pozzolans. The high reactivity of clinoptilolite is attributed to its specific surface area and reactive SiO2 content [45,46,47]. Although the pozzolanic activity is high, the strength contribution of clinoptilolite is relatively poor, which can be attributed to the larger pore size distribution of the hardened zeolite-lime product compared with the lime-fly ash system [48,49,50].
The crystalline state of glass is amorphous and contains a large amount of silicon (Si) and calcium (Ca). Based on this theory, glass powder should undergo a natural pozzolanic reaction and have cementing properties similar to cement. Therefore, it is feasible to add glass powder to cement for similar purposes to cement [51,52].
Glass cullet has been considered as a fine aggregate or supplementary cementitious material (SCM) for concrete. The kinetics of glass reaction depends on temperature and glass composition [53,54]. The uniform composition, amorphous nature, and high silica content of glass make it very suitable for studying the effect of glass type on reactivity at different temperatures. In this study, isothermal calorimetry, chemical shrinkage, and thermogravimetric analysis were used to measure pozzolans that crushed transparent and green glass smaller than 25 µm at three different temperatures [55,56]. In addition, at different temperatures and ages, the compressive strength of the mortar and the water absorption of the sample has been used to correlate the degree of reaction with the performance [57,58]. The results show that even at a very low temperature, it will cause the glass powder to exhibit a significant pozzolanic reaction. Besides, it can be seen that the glass composition has a great influence on the reactivity. In this study, the reactivity of green glass is higher than that of transparent glass [59,60].
Concrete with low thermal conductivity can be used for thermal insulation of buildings. The thermal conductivity (TC) of concrete increases with the increase of cement content and aggregate thermal conductivity [61]. The mineral admixtures in concrete also affect the TC of concrete. Silica fume (SF) reduces the TC of cement slurry and a small amount of SF, fly ash (FA), and blast furnace slag (BFS) also reduce the TC of mortar and lightweight aggregate concrete [62]. Regardless of the degree of underutilization of the construction industry, the use of local materials in the construction industry has become an essential part of solving the economic problems of developing countries [63]. The thermal properties of concrete are closely related to all types of concrete, especially structures with low thermal conductivity, high specific heat, and unnatural heating. Although a lot of research has been done on the influence of mineral admixtures on concrete engineering performance [64], the topic of thermal conductivity is still worthy of further discussion. Major factors that affect the concrete heat transfer include concrete moisture, aggregate mineral properties, cured cement paste properties, porosity, and heating methods [64]. Moreover, cement mortar and concrete thermal conductivity vary with the mixture ratio [65], independent of curing ages.

2. Experimental Procedure

2.1. Test Material

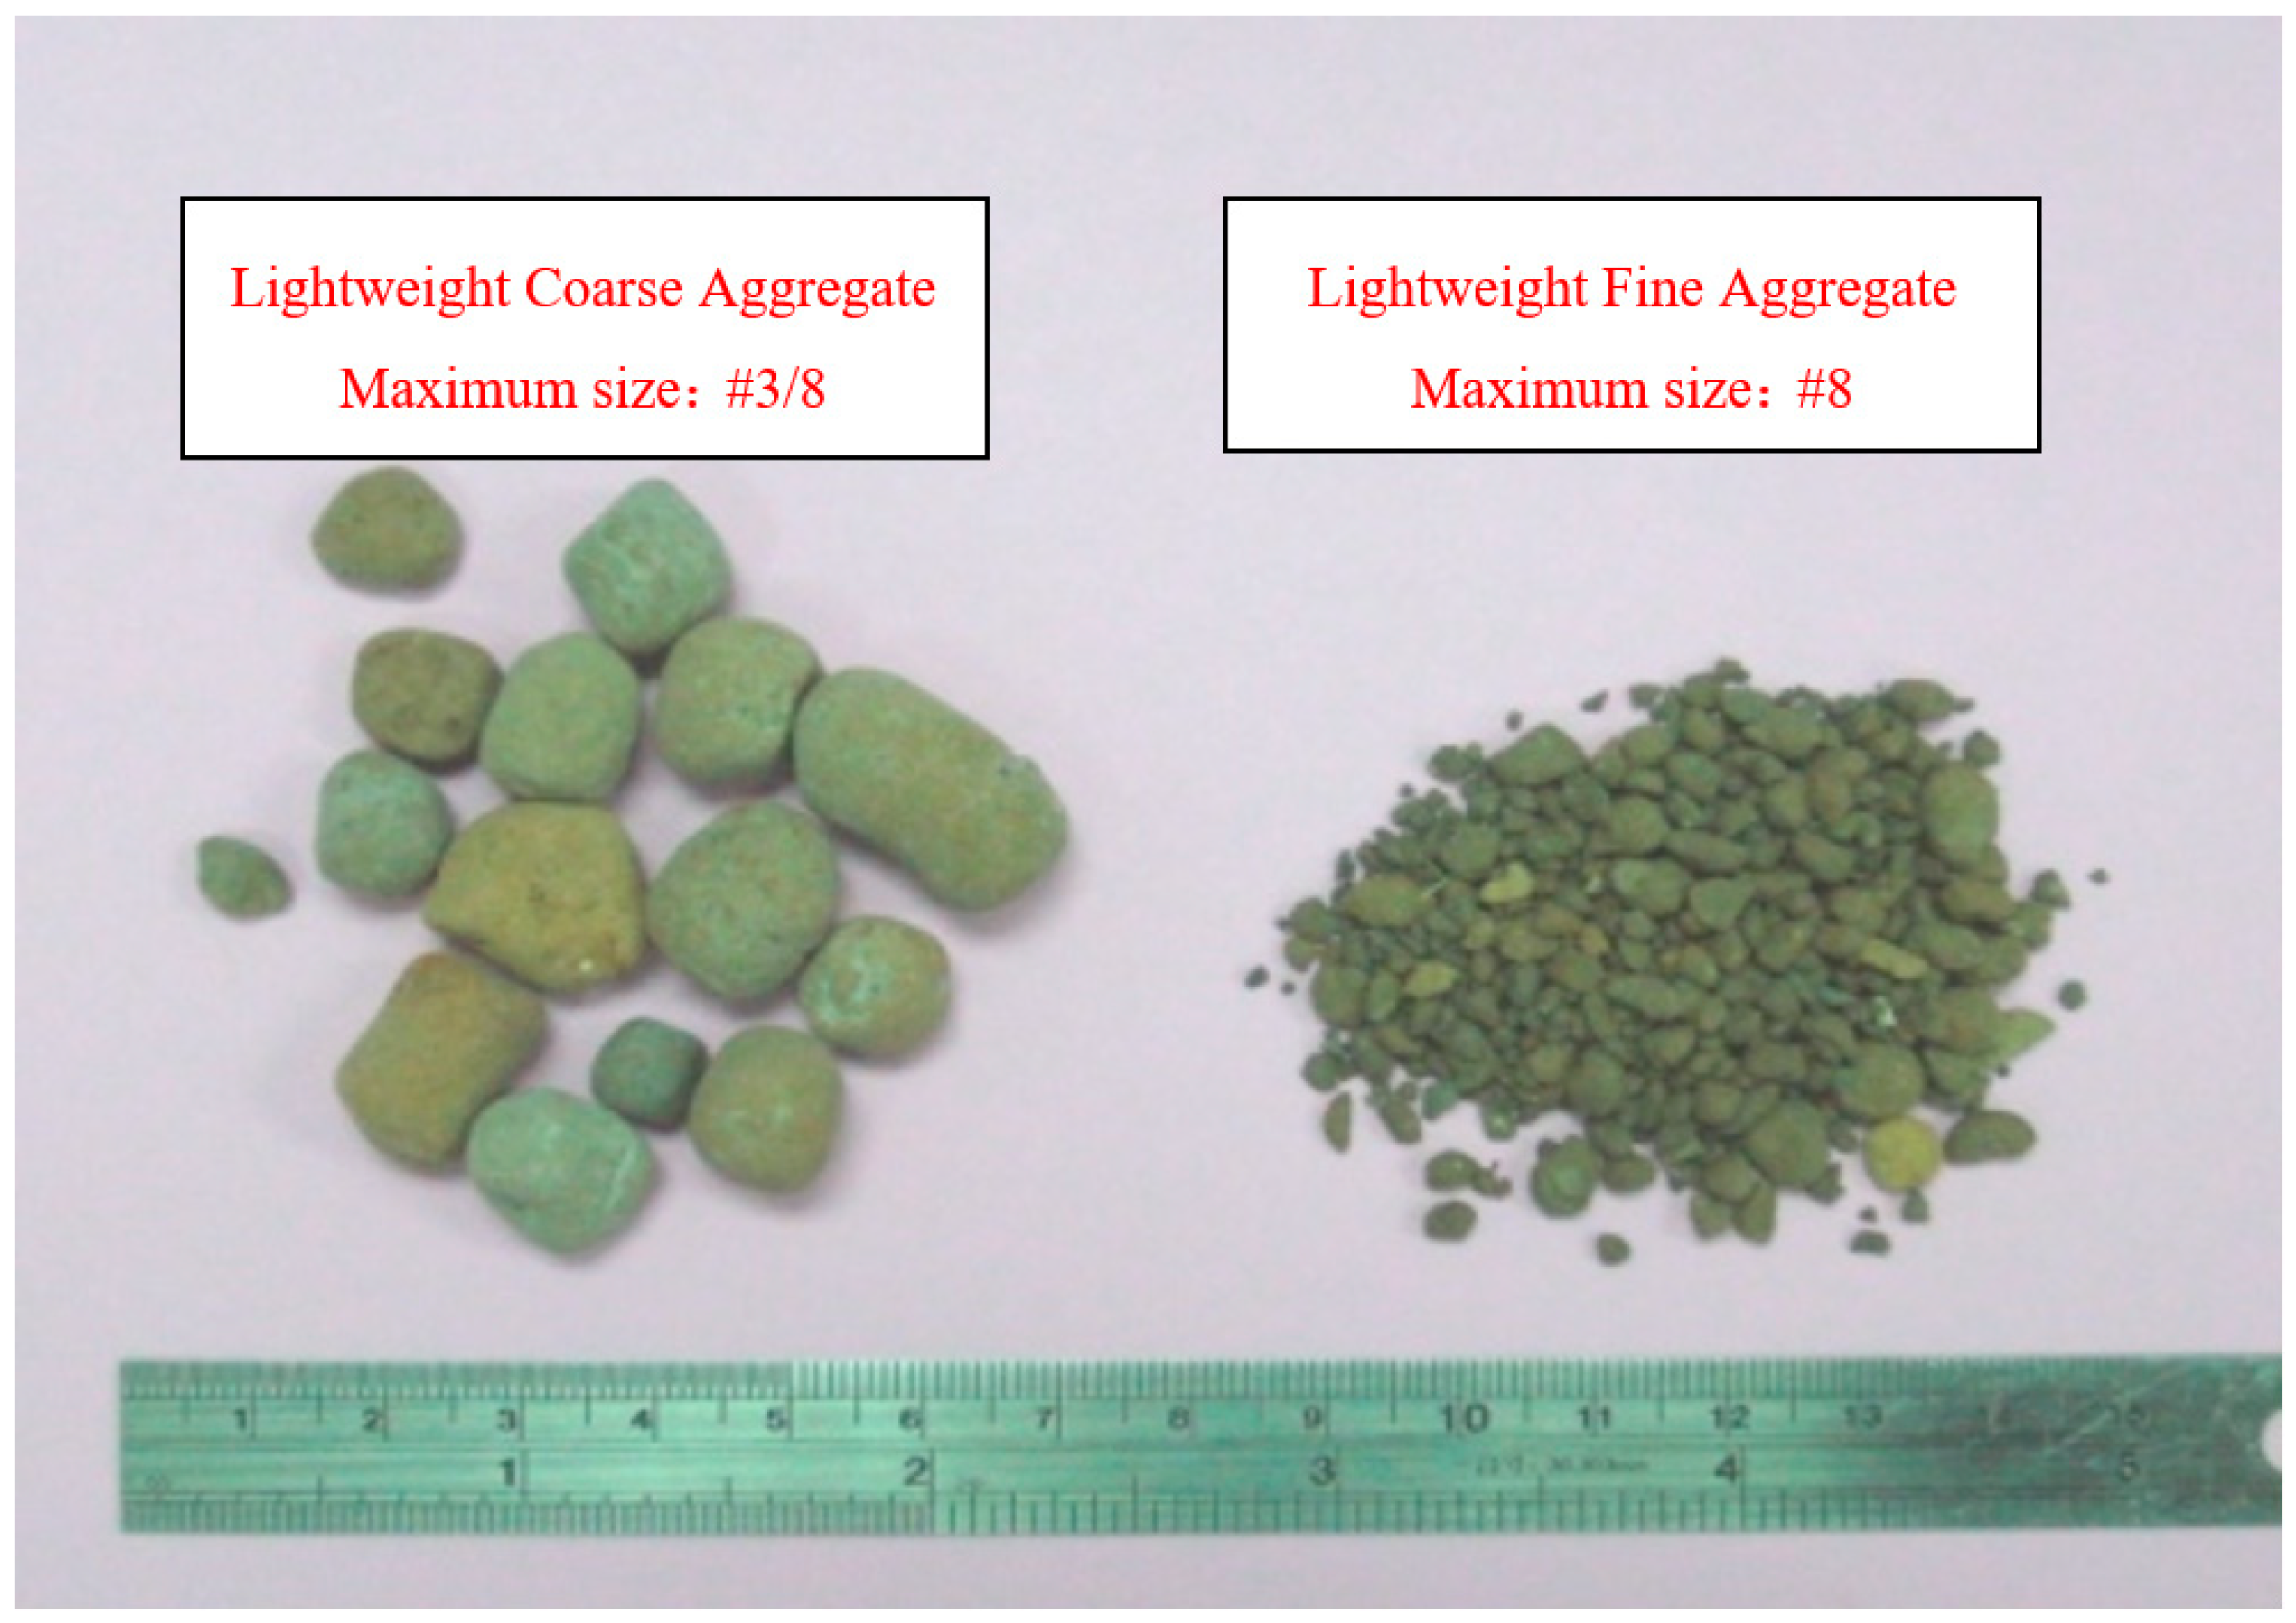
Type I Portland cement (Taiwan Cement Co., Ltd.), Class F fly ash (Taiwan Power Xing-Da Firepower Plant), and water-quenched blasted furnace slag (China Hi-Ment Corp.) were used in this experiment, as shown in Table 1 and Figure 1, and were all compliant with CNS 61, CNS 3036, and CNS 12549. Desulphurization slag was from Ti-Sa Chemical Industrial Corp., with fineness passing standard sieves #100. Glass powder was made of waste glass of recycled LCDs from Taiwan Chi Mei Optoelectronics (CMO), crushed by a breaker and ground by a ball mill. Properties of the lightweight aggregate material are shown in Table 2 and Figure 2. Coarse aggregate was a lightweight aggregate, with a 24 h water absorption ratio of 19.2% and a particle density of 1660 kg/m3; fine aggregate was light sand made from Taiwan A-Kung reservoir sediments by dewatering, pelleting, and sintering.

2.2. Test Variables and Mixture Ratios

The mixture in this experiment was composed of lightweight aggregate with a fixed ratio of water to binder is 0.40. The weight substitution method was used to substitute four kinds of mineral admixtures, namely, fly ash (FA), blast furnace slag (BFS), desulphurization slag (DLS), and glass powder (GLP) for 10% or 30% of the cement content. The mixing ratio of the controlled sample (MA0) was 0%. Specimens of 4 cm × 20 cm × 20 cm were prepared. The thermal conductivity test was conducted after 28 d, according to CNS 7332. The test mixture ratios are shown in Table 3. The fresh properties test is carried out following the regulations of CNS 1176 and CNS 11151. After the concrete material is uniformly mixed, the slump measurement and unit weight test is carried out immediately. In the concrete compressive strength and elastic modulus test, the cylindrical specimens of ψ10 cm × 20 cm are made according to CNS 1230 and 1232, and they are cured in saturated lime water. When the concrete is 7, 28, 91, and 120 days cured, the compressive strength test on the compressive machine and record the maximum load it receives when it is compressed to failure. During the compression test, a Linear Variable Differential Transformer (LVDT) was also used to measure its stress–strain curve. The surface resistivity test uses a four-pole resistance measuring instrument produced by Proceq in Switzerland. According to ASTM C876, the resistivity is measured by the section contacting the concrete, and it is set as current 180 μA, frequency 72 Hz, impedance 10 MΩ, measuring range 0 KΩ-cm–99 kΩ-cm, accuracy ±1 KΩ-cm. Regarding the thermal conductivity test, it is mainly carried out by the flat plate comparison method (CNS 7332). The number of samples to be prepared and measured is mainly produced and tested following the requirements of each test specification.

3. Results and Analysis

This study examined the fresh properties, pozzolan reactivity, and thermal conductivity of lightweight aggregate concrete after replacing part of the cement with mineral admixtures. The results are discussed below.

3.1. Mixture Design

As shown in Table 3, a higher paste level was designed to prevent lightweight aggregate from floating during casting, thus there was sufficient paste to bind to the surface of the aggregate. In this study, the ratio of water to binder is 0.40, the density of mixed water is 216 kg/m3, the density of lightweight coarse aggregate is 586 kg/m3, and the density of lightweight fine aggregate is 249 kg/m3. The ratio of mineral admixtures is fixed when replacing cement. Each mineral admixture has different effects on the performance of lightweight aggregate concrete; for example, the upper limit of FA consumption is 25–30%, and the mixing ratio of high-silicon GLP should be 10–15% [66]. Thus, the cement replacing ratios in this study were 0%, 10%, and 30%.

3.2. Fresh Properties

As shown in Table 4, to prevent the lightweight aggregate from floating, this study adopted a design slump of 75 mm–100 mm. After mixing each group of concrete, there was no bleeding and segregation by visual inspection, and the product matched the range of the designed slump. The slump of the controlled sample was 90 mm–100 mm. Except for FA, slumps of all other samples were lower than that of the controlled sample, as shown in Table 1. This is most likely since the particles of the admixture were finer than those of cement and had faster hydration. The FA slump was the highest, about 100 mm–110 mm. Since FA contains fine glass spheres with a smooth surface and can disperse cement particles with properties similar to the “ball bearing effect”, it can facilitate granule moving in concrete [67].

3.3. Compressive Strength

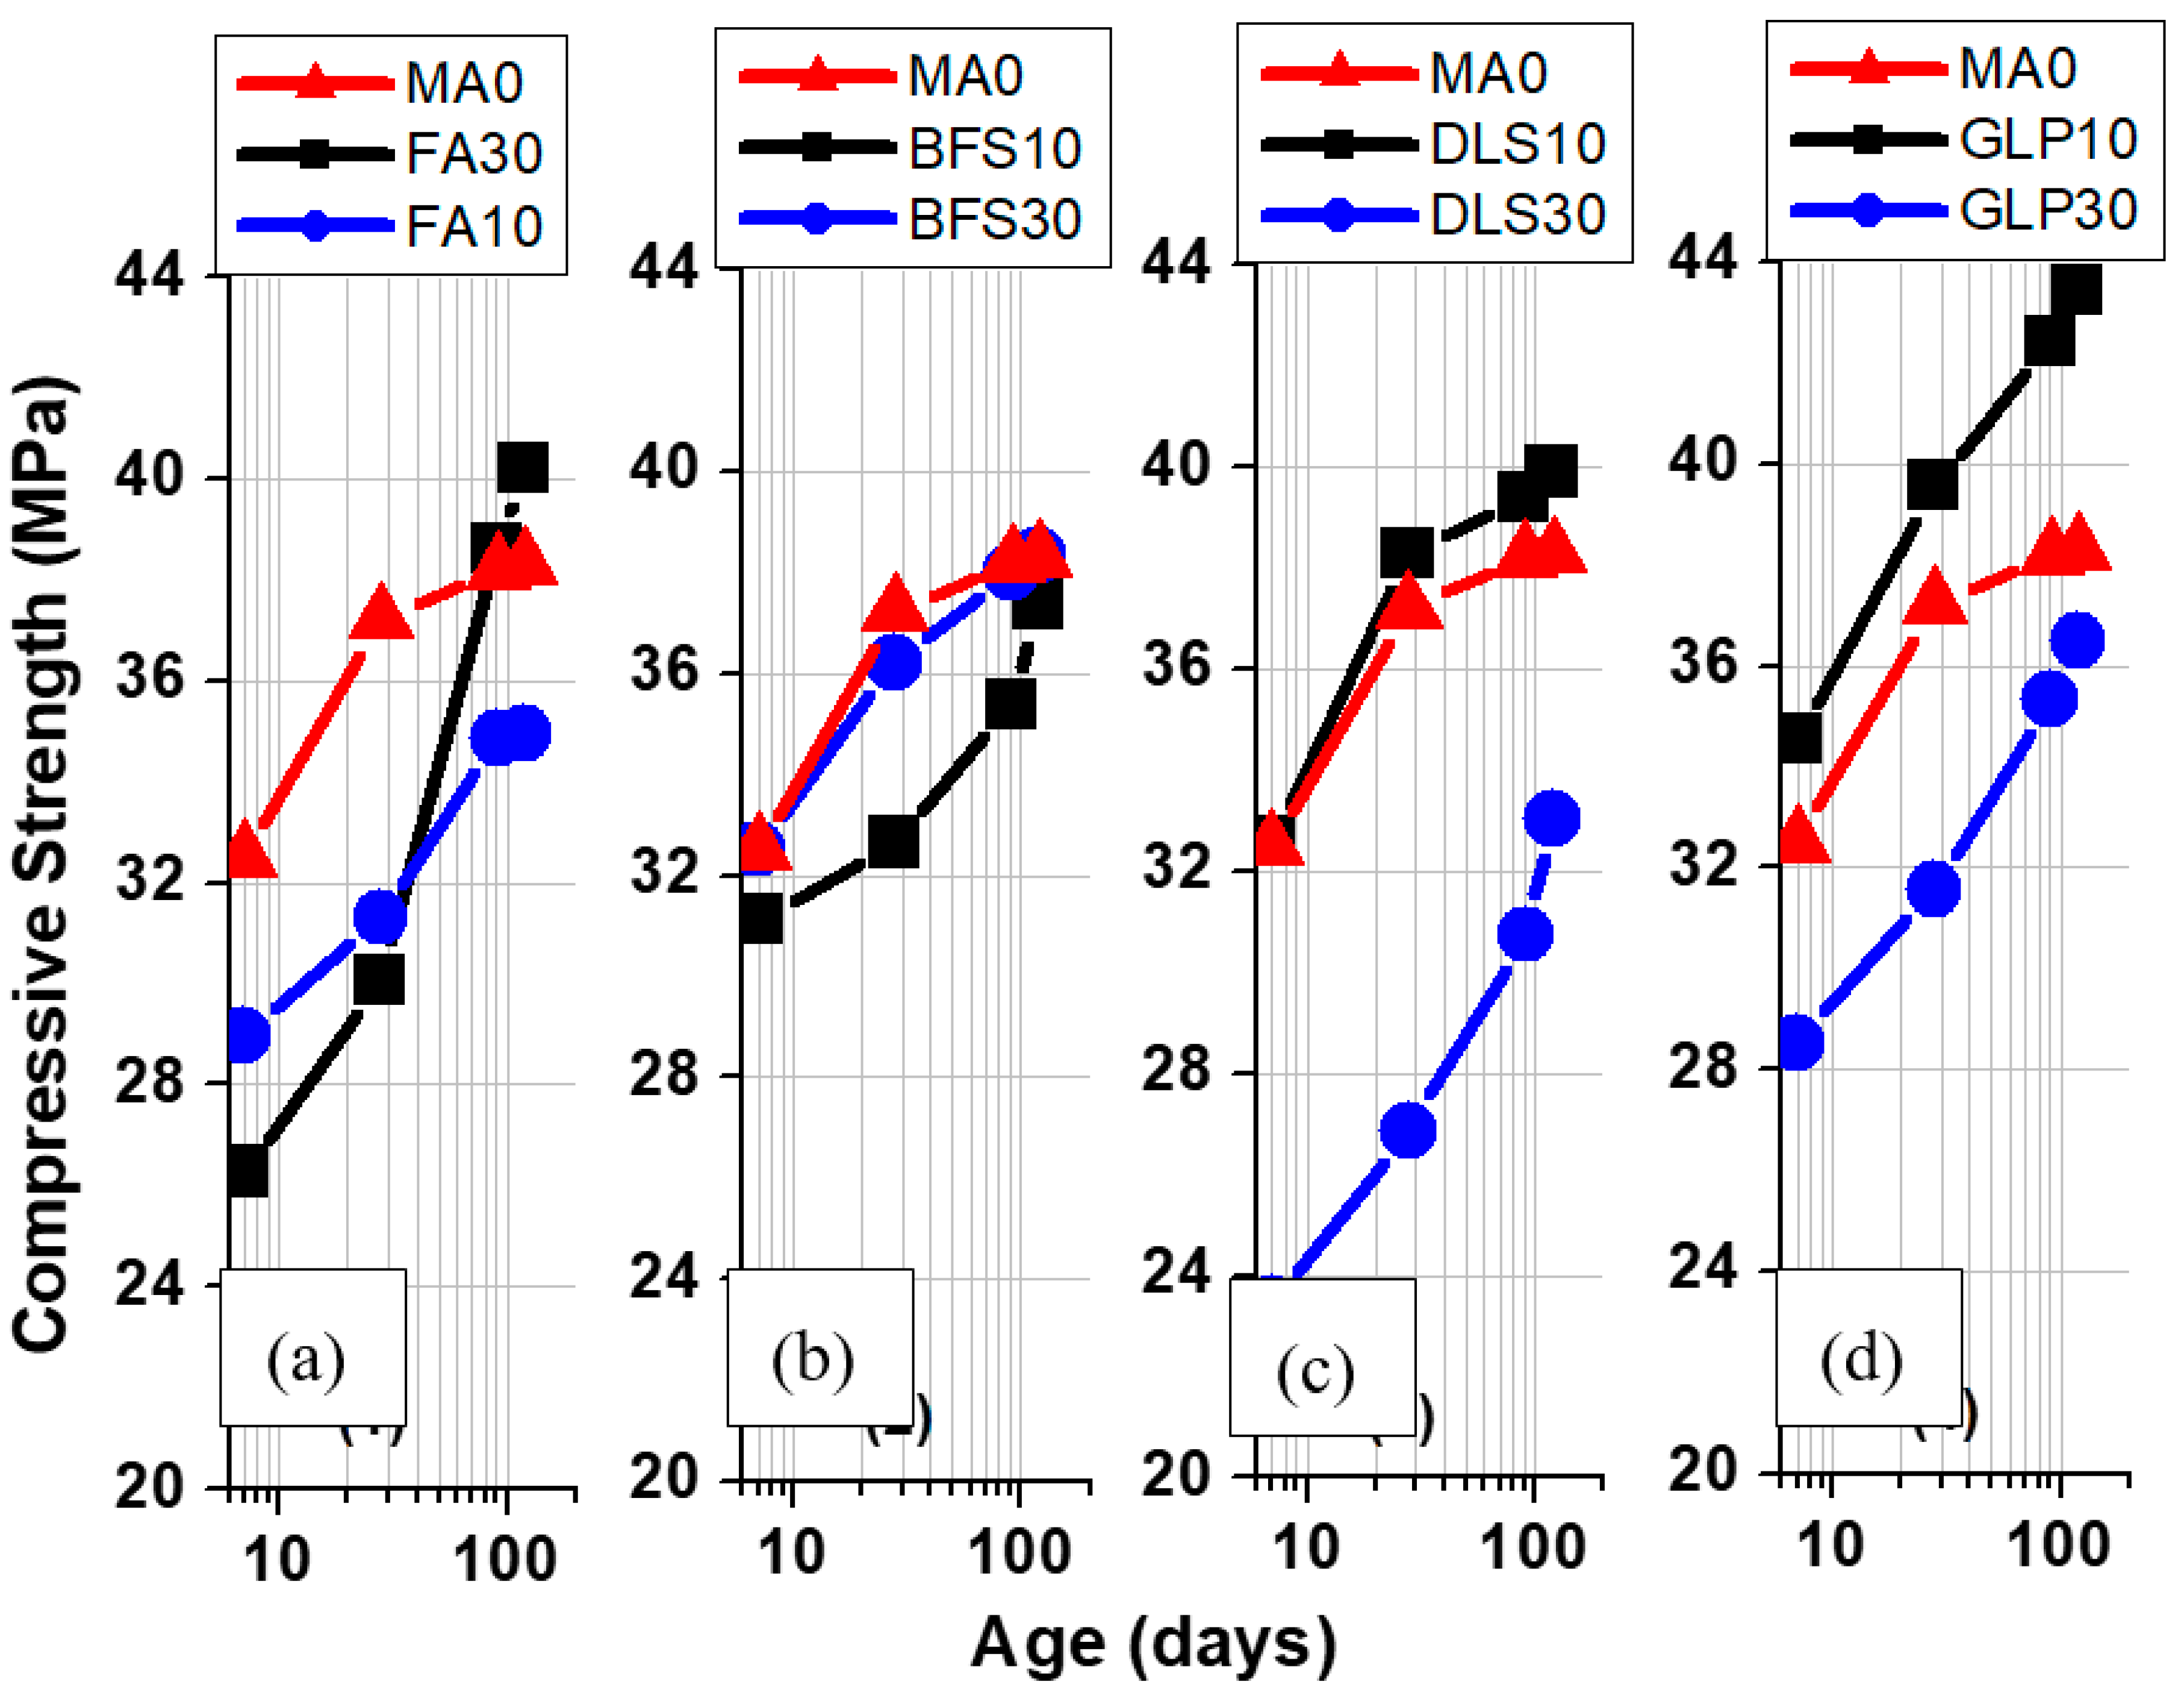
As shown in Figure 3a, the initial strength of the concrete with FA developed slowly, and higher replacing ratios led to lower strengths. The compressive strengths of FA10 and FA30 at 7d were 28.96 MPa and 26.26 MPa, reaching 28 d the compressive strengths of 93% and 87%, respectively. At 28d, the compressive strengths were 31.31 MPa and 30.05 MPa, respectively, which were 8.1% and 14.4% higher than those of the control group. At 91 d, the strengths were 11% and 28% higher than those at 28 d, and the FA30 strength was higher than those of FA10 and MA0. At 120d, the strength of FA30 even reached 40.19 MPa. In Figure 3b, the compressive strengths of BFS10 and BFS30 at 7 d and 28 d were similar to that of MA0. The compressive strength of BFS30 was the highest among all the samples with a cement substitution ratio of 30%. The strength of BFS10 was 38 MPa at 91 d, which was comparable to MA0 at the same age. In Figure 3c, the compressive strength of DLS10 at 7d is seen to be similar to that of MA0, but the strength of DLS30 was significantly lower, only 72% of the strength of DLS10. At 28 d, the strength of DLS10 was slightly higher than that of MA0. At 91d, the strength of DLS10 was 39.38 MPa, which was an increase of 2.8% compared with the control group, while the strength of DLS30 was increased to 30.74 MPa, which was an increase of 14.4% compared with the control group. In Figure 3d, the compressive strength of GLP10 at 7 d and 28 d is shown to be higher than those of MA0 and GLP30 at the same age. GLP10 exhibited pozzolan reactivity at an earlier age. At 91 d, the strength reached 42.41 MPa, which was the highest among all the samples, and then slowed down. As GLP30 had a higher replacement ratio, the strength did decrease, in addition to a longer reaction time; part of the glass powder might not have a chance to react with the pozzolan. Its strength reached 36.49 MPa at 120 d, which was 95.32% of the strength of MA0.

3.4. Surface Resistivity

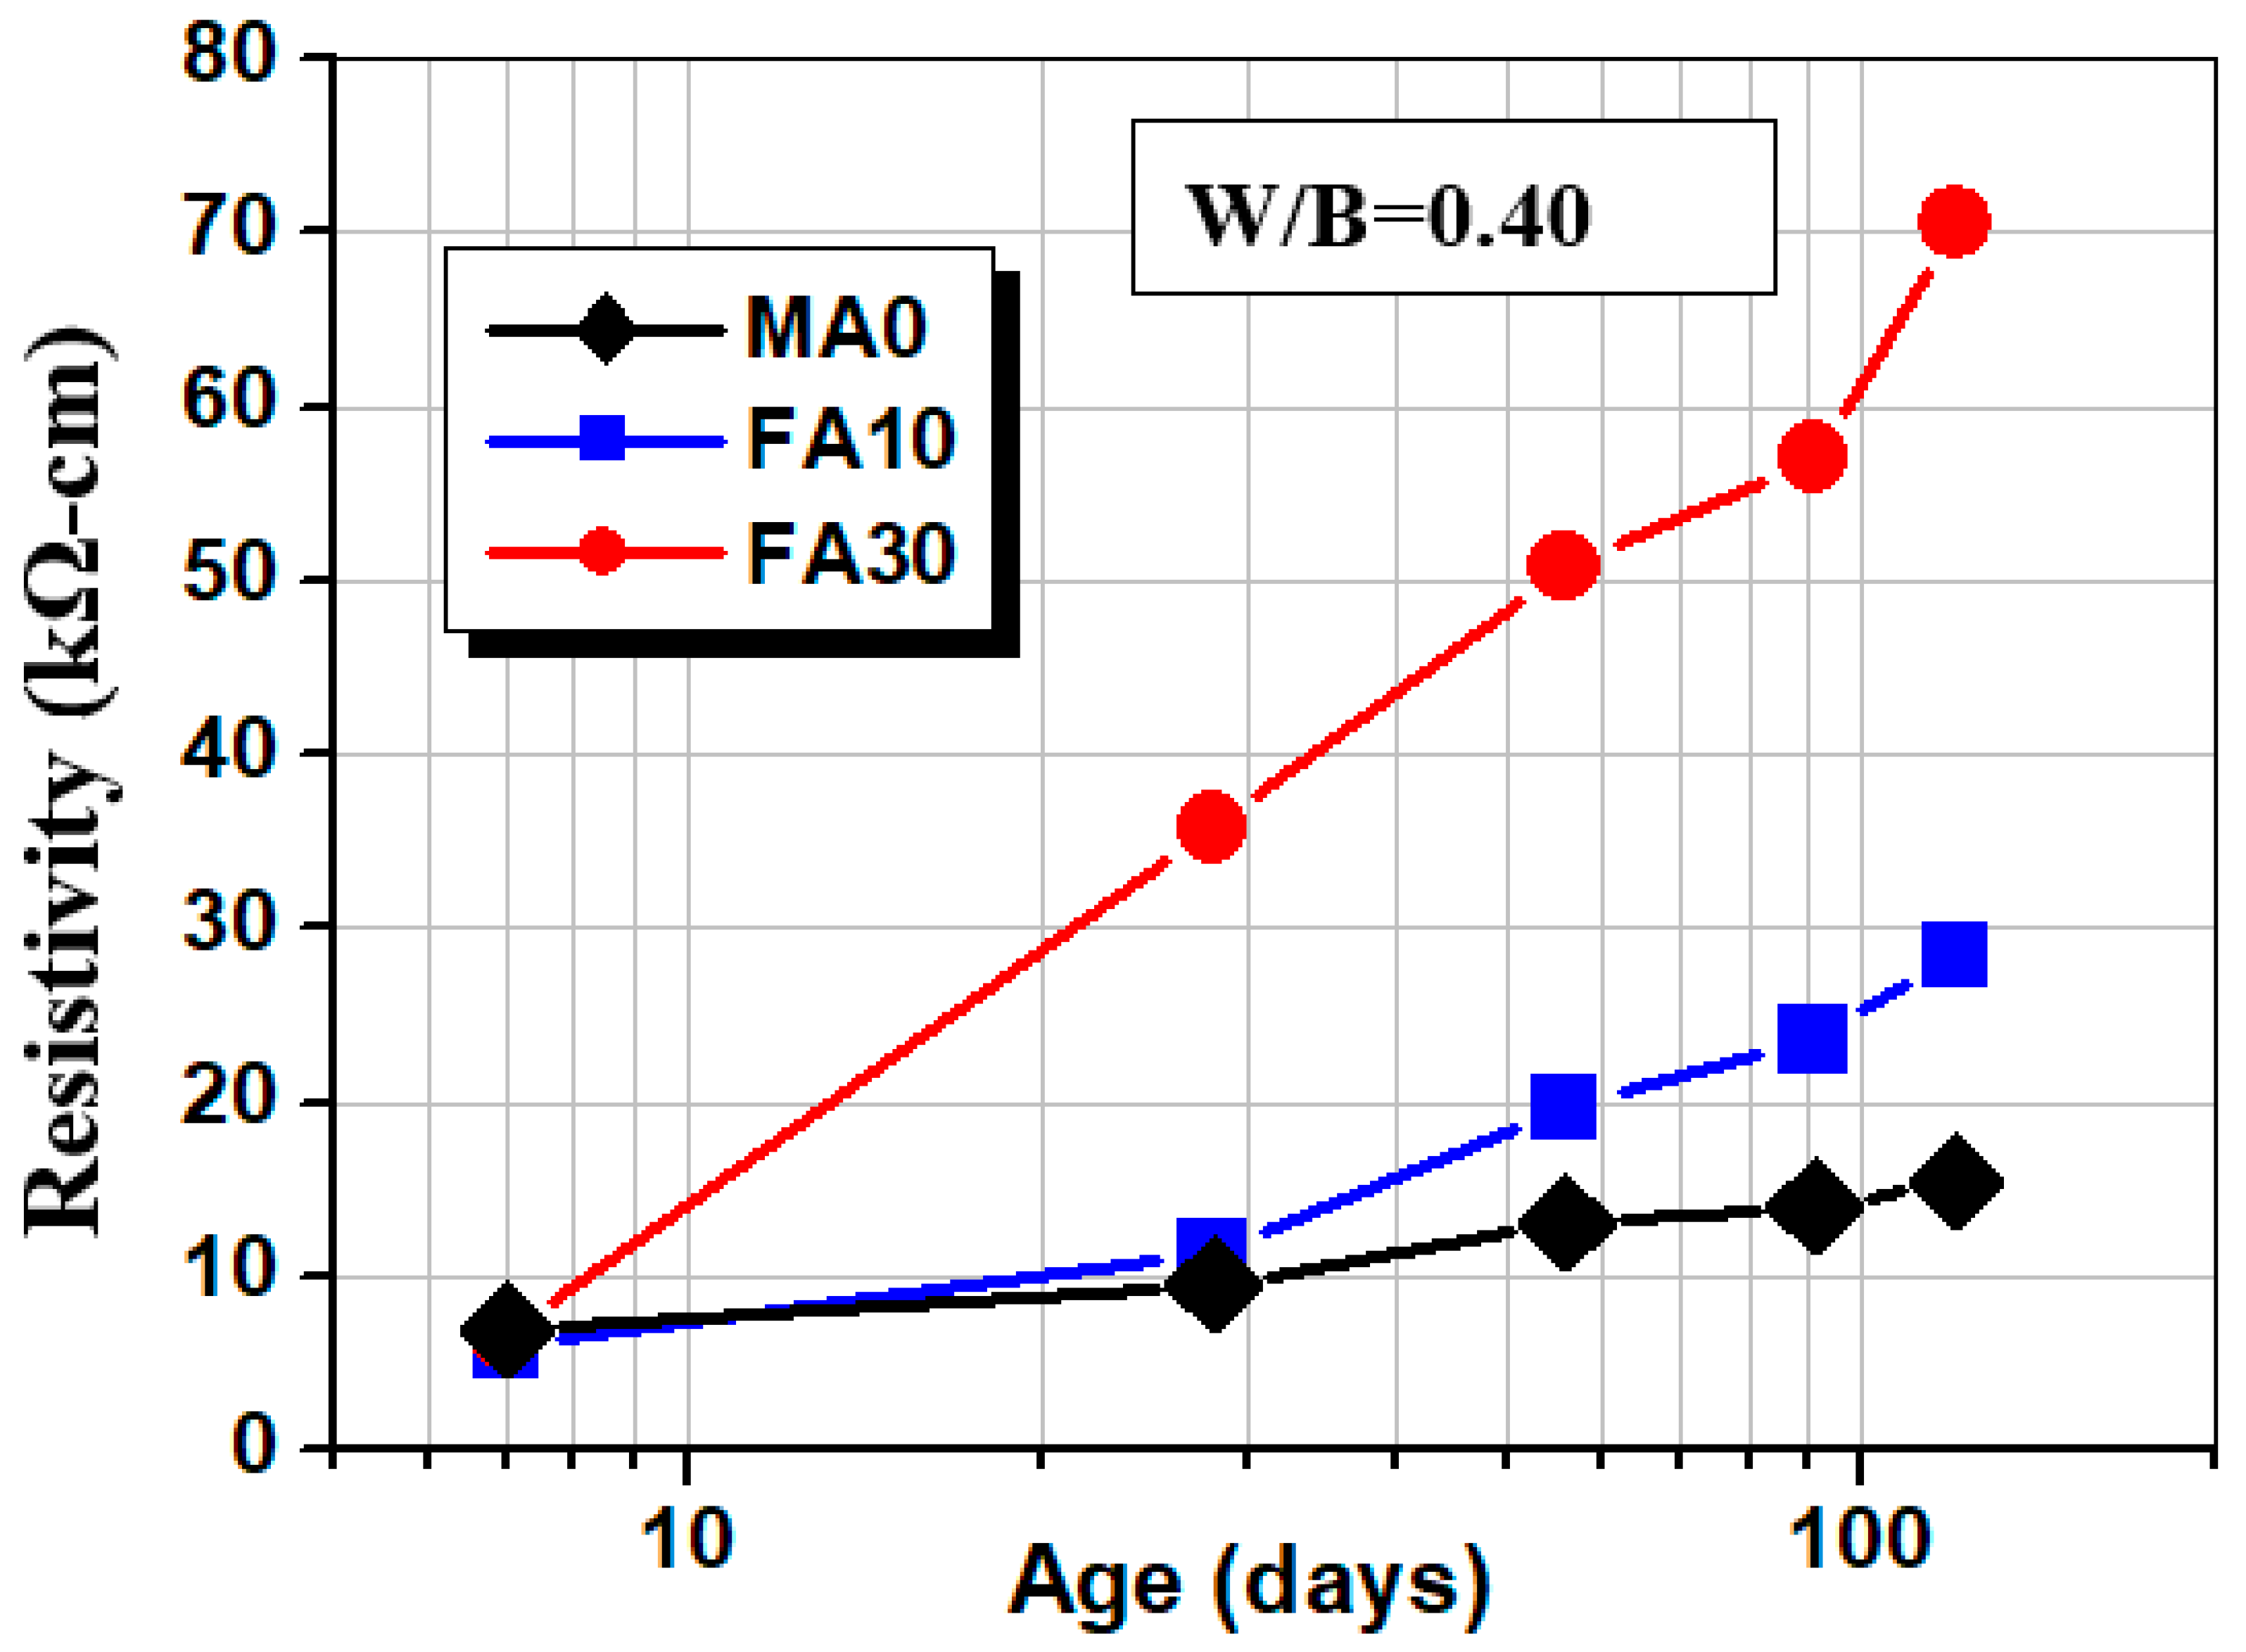
(1) Fly ash: Figure 4 shows that at the age of 28 days, the resistivity of FA10 and FA30 are 11.3 and 34.3 kΩ-cm respectively, which of FA30 at the ages of 56 days and 91 days are as high as 50.8 kΩ-cm and 57 kΩ-cm, meaning the resistivity increases with the fly ash replacement.
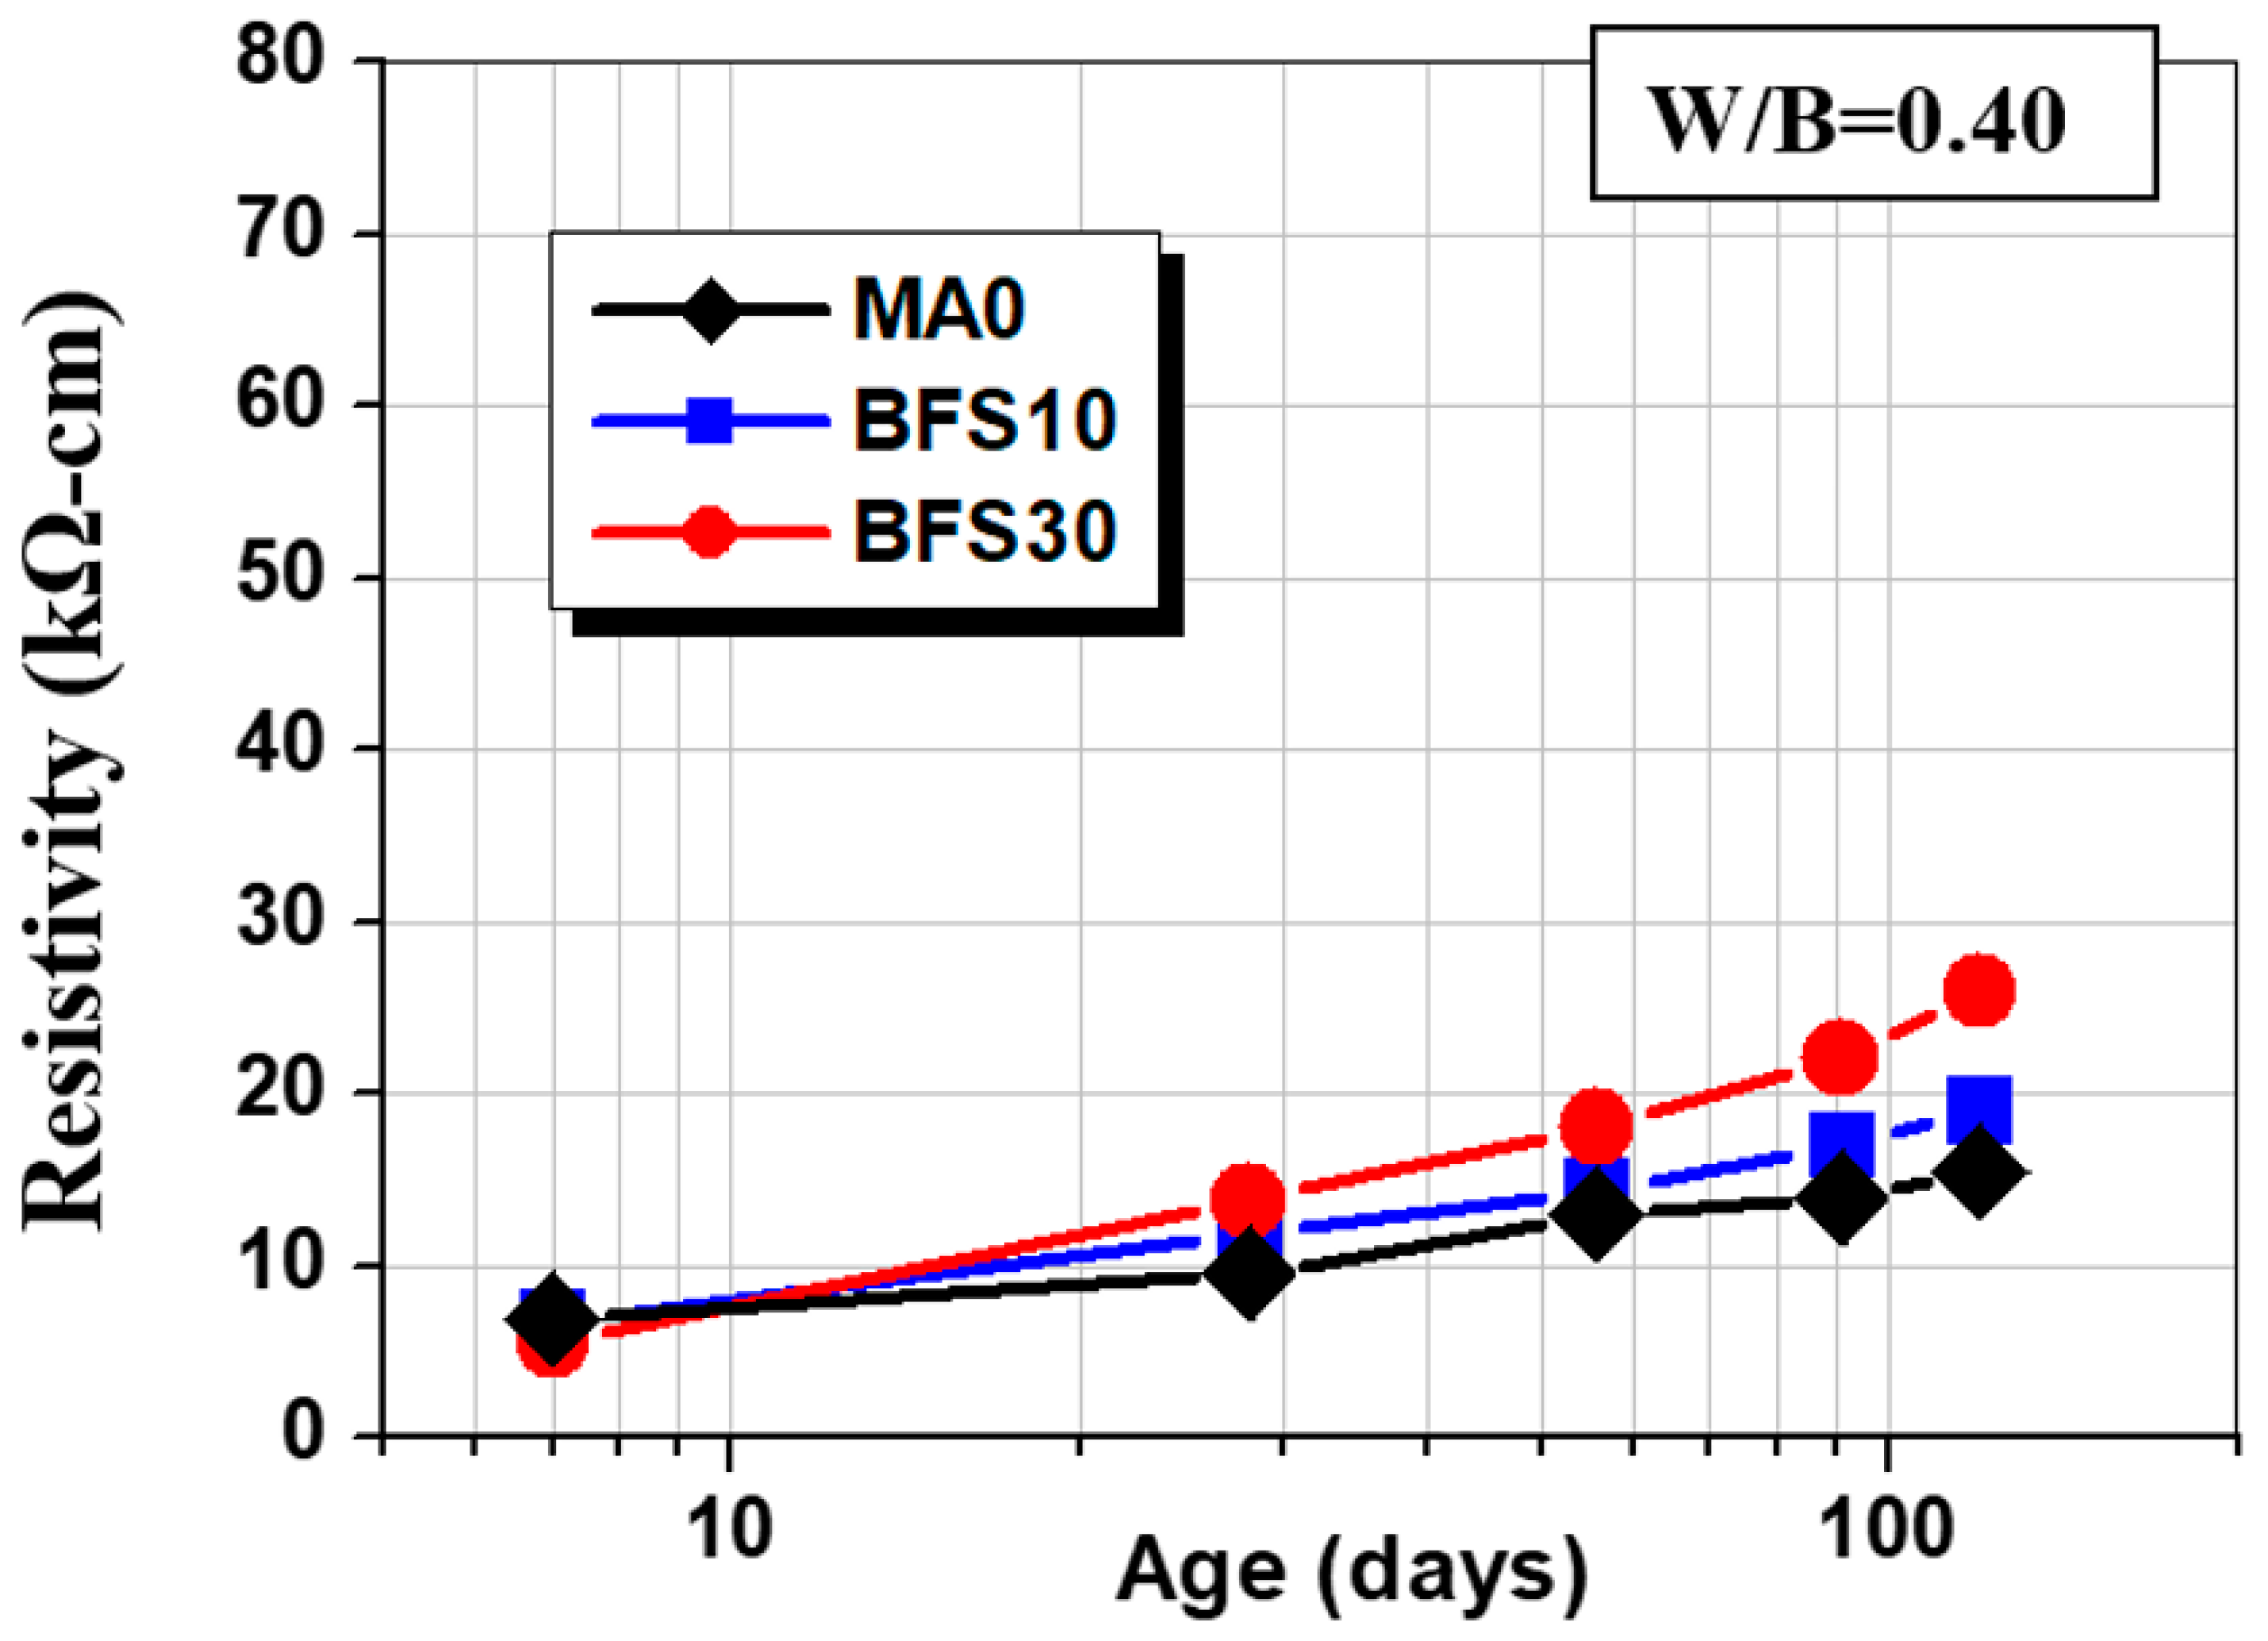
(2) Slag: The C-S-H gel generated by pozzolanic reaction increases the resistivity of concrete by blocking interconnected pores. Figure 5 shows that the resistivity of 10% and 30% slag additions at the age of seven days are close to the control group. The resistivity increases with curing time; it increases to 13.8 kΩ-cm on Day 28, higher than the control group.
(3) Desulfurization slag: Figure 6 shows that the resistivity of DLS10 and DLS30 additions are only 6.6 and 5.6 kΩ-cm before 28 days, that on Day 91 are only 11.5 and 10.3 kΩ-cm, and the resistivity at various ages are lower than a control group. It may be because there is no C-S-H gel after the desulfurization slag is hydrated; the interconnected pores cannot be filled or blocked, leading to the lowest resistivity among various mix proportions.
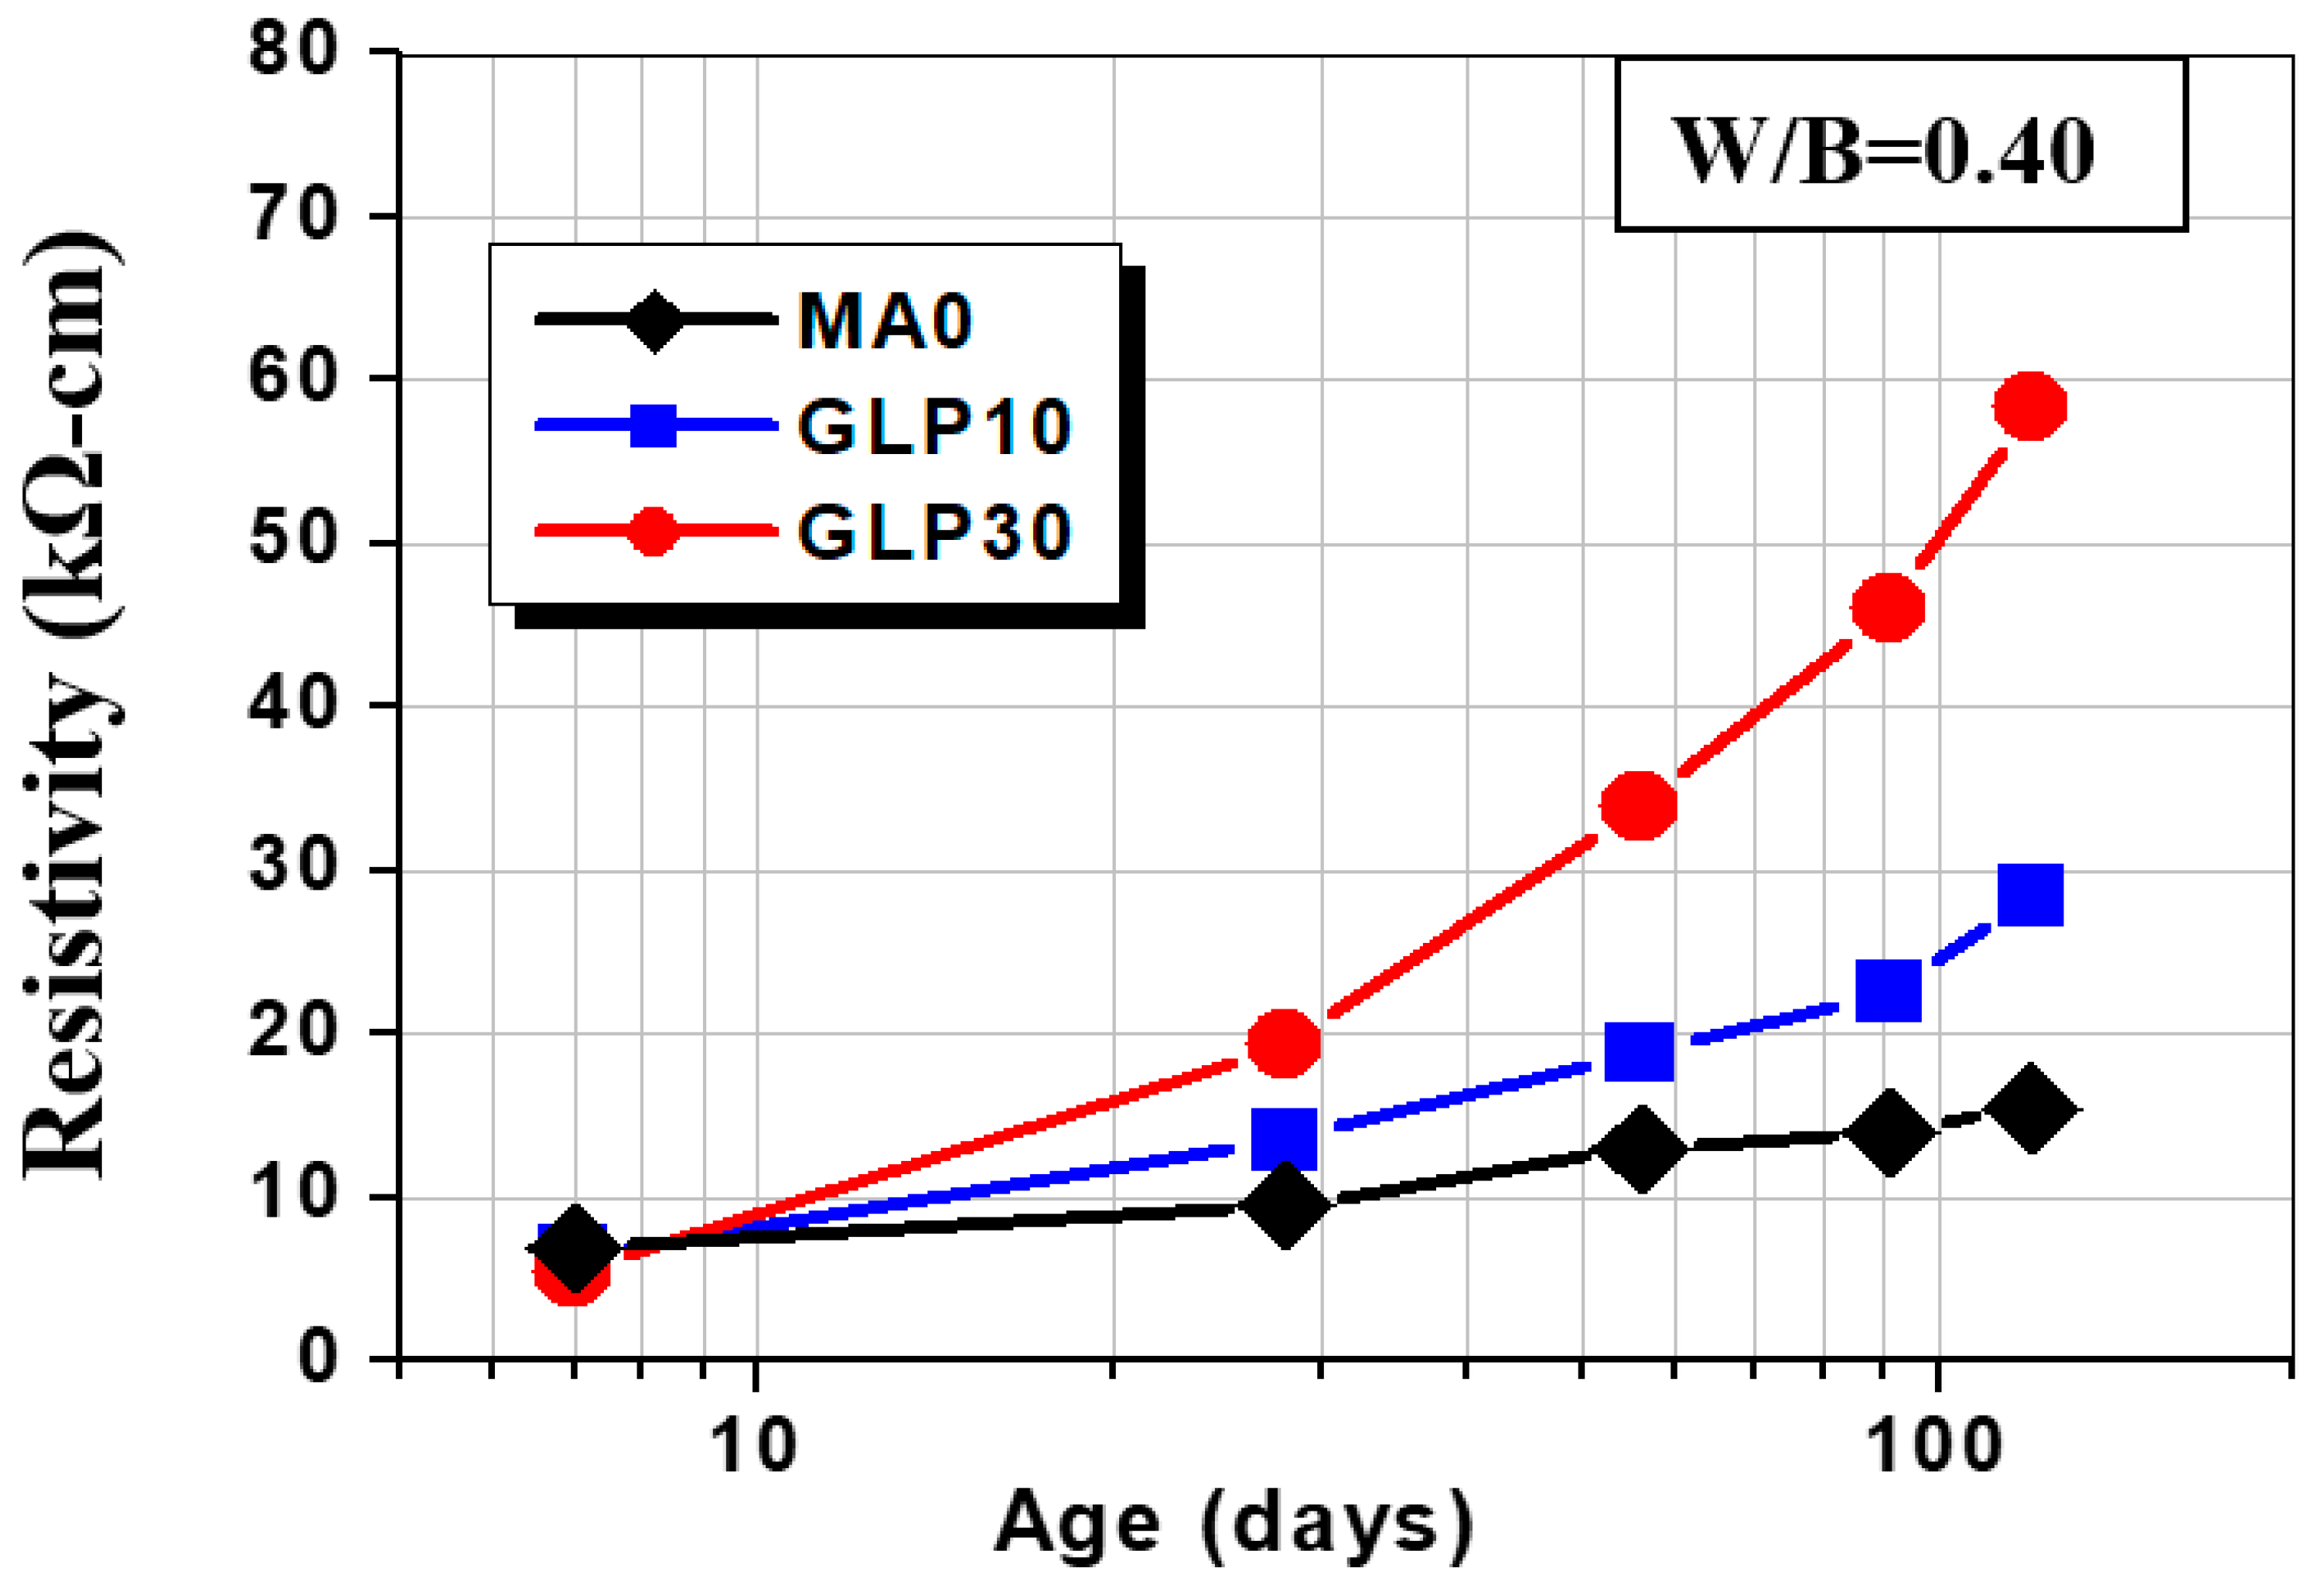
(4) Glass powder: Figure 7 shows that the resistivity of GLP10 and GLP30 additions are lower than the control group before the age of 28 days, but that is 13.5 and 19.3 kΩ-cm on Day 28, higher than the control group. The resistivity is 60 kΩ-cm at the age of 120 days; it may be because the glass powder has higher SiO2 content.
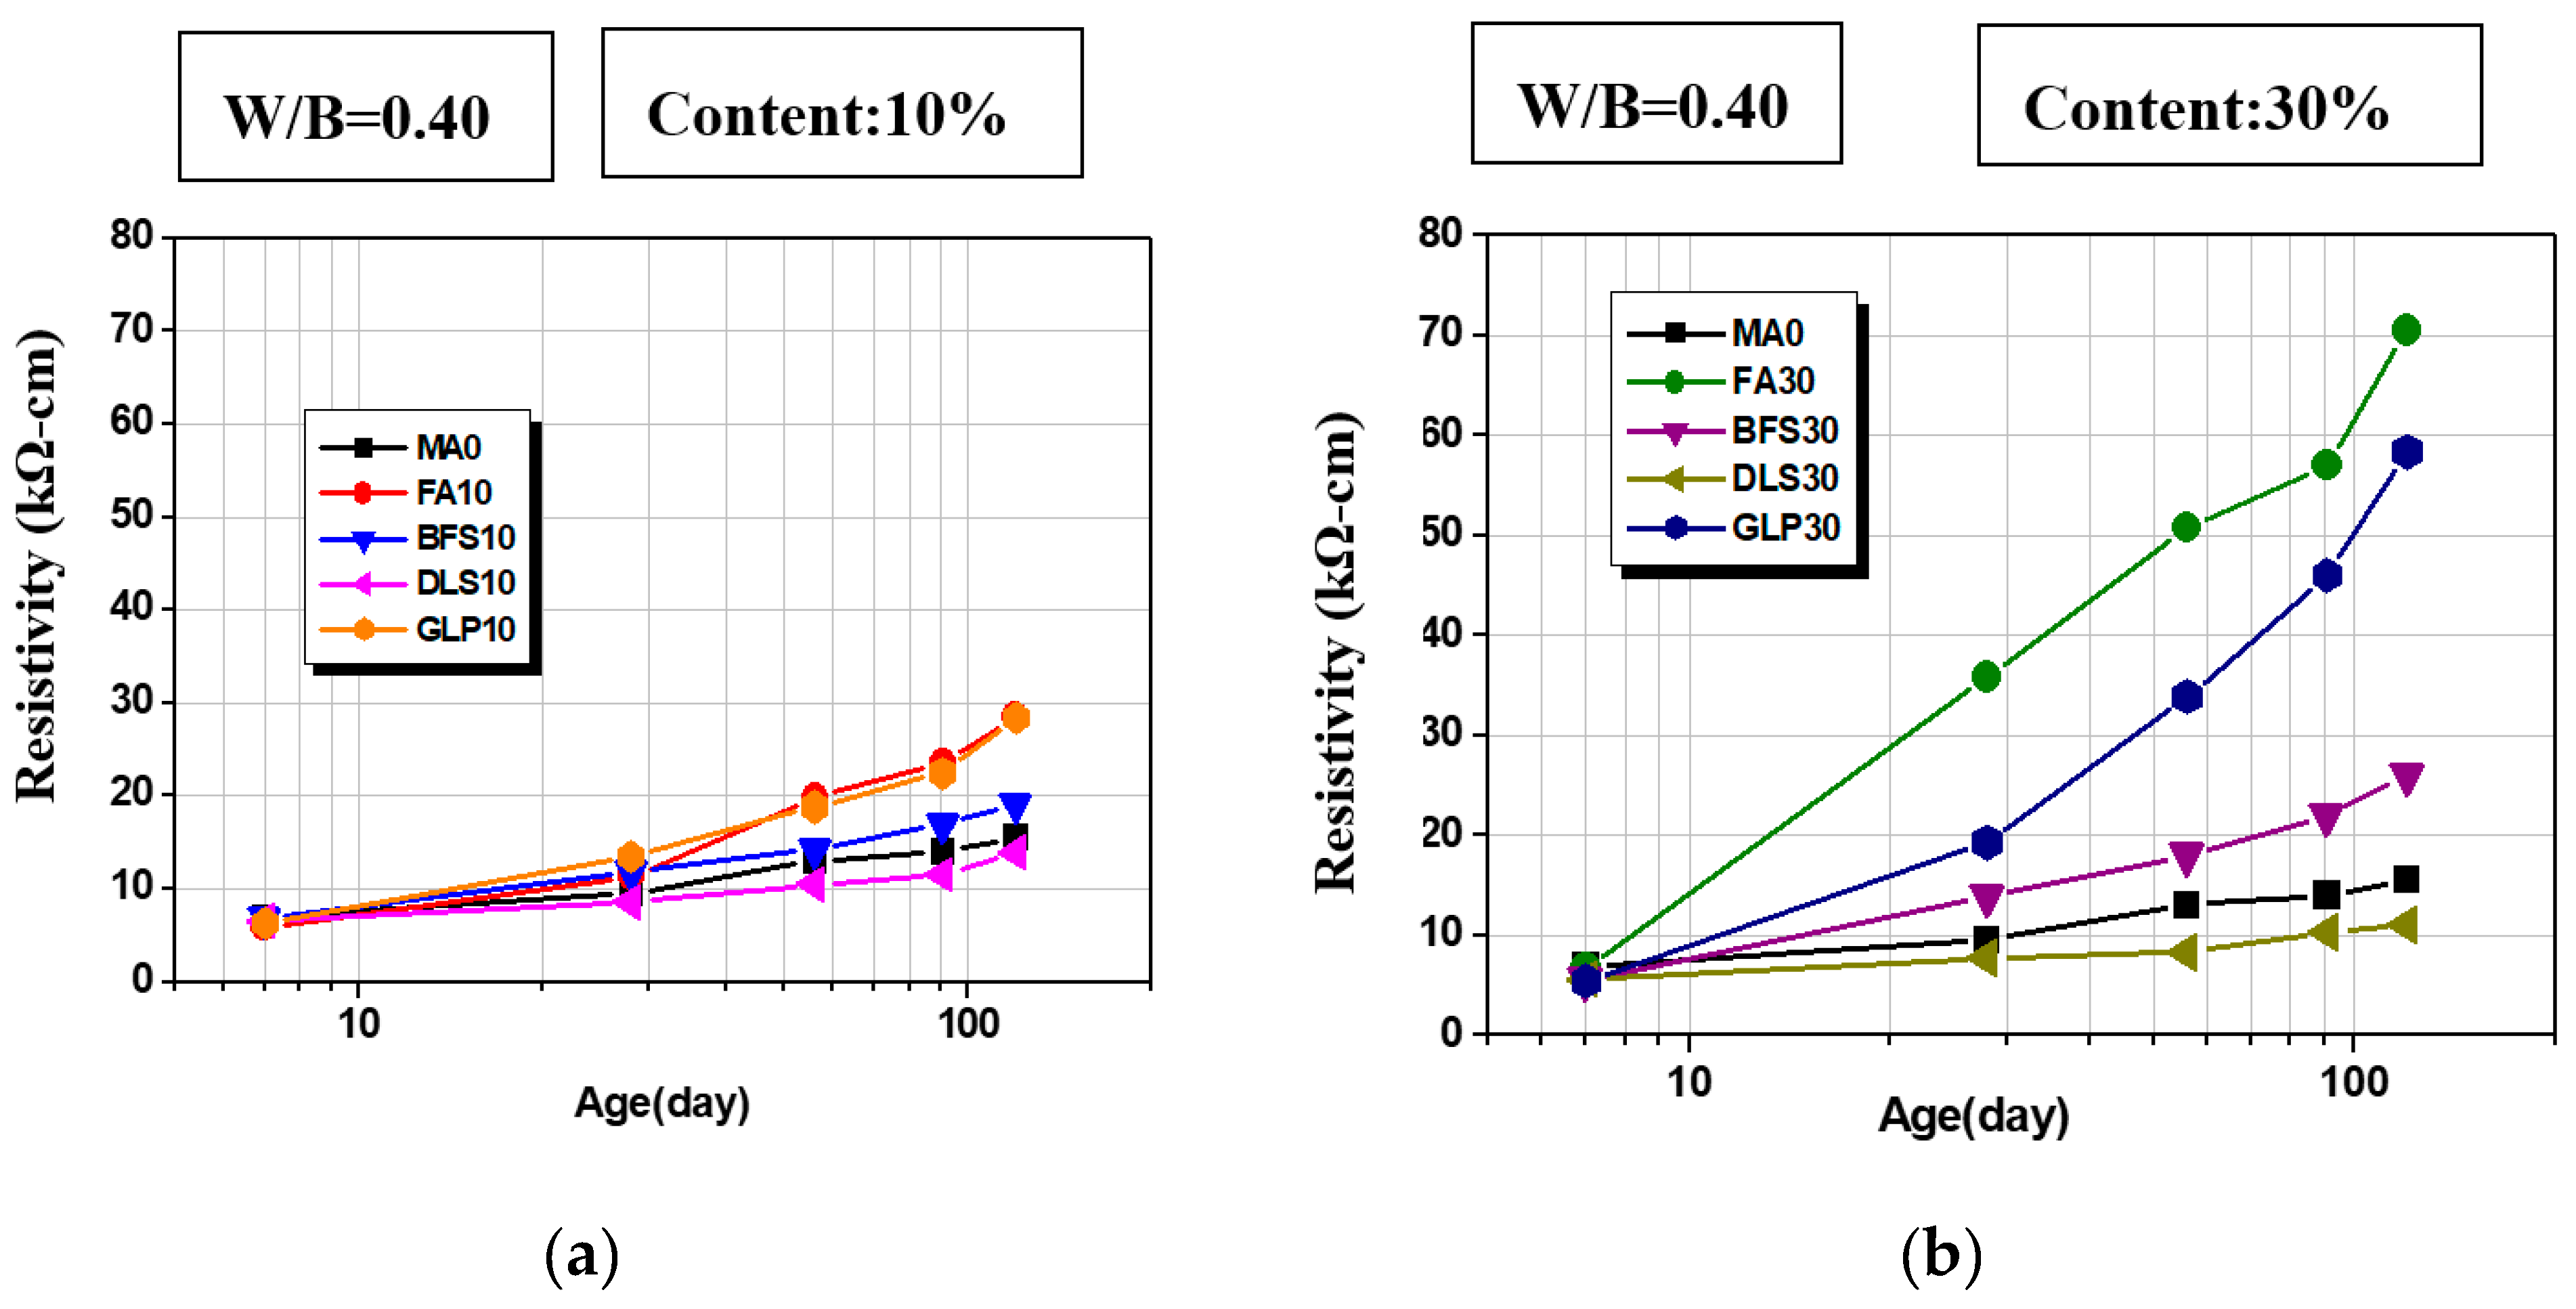
(5) Figure 8 shows that the resistivity of the mix proportion with 10% mineral admixtures on Day 120 is 90~183% of the control group; the resistivity of 30% mineral admixtures is 72~455% of the control group, the increasing amplitude is higher than the mix proportion with 10% mineral admixtures, the resistivity of 30% fly ash and 30% glass powder is higher than the control group; it may be because of the chemical properties of mineral admixtures. The corrosion degree of resistivity 10~20 kΩ-cm is medium to low, that above 20 kΩ-cm represents a low probability of corrosion [68,69], meaning the resistivity of FA10, FA30, BFS30, GLP10, and GLP30 are above standard. Figure 9 shows the regression analysis relation of resistivity and compressive strength, the R2 values of the control group and fly ash addition are 0.7512 and 0.7583, and the R2 values of slag and desulfurization slag additions are 0.5562 and 0.5429, respectively. The linear regression analysis result of glass powder addition is poor; its chemical properties influence the resistivity significantly.
The water absorptions of FA10 and FA30 are 5.61% and 7.85%, and the thermal conductivity is reduced by 14.7% and 25.7% respectively. The water absorptions of BFS10 and BFS30 are 4.62% and 5.61%; the thermal conductivity is reduced by 4% and 14.2% respectively. The water absorptions of DLS10 and DLS30 are 6.13% and 8.93%, and the thermal conductivity is reduced by 1.9% and 17.2% respectively. The water absorptions of GLP10 and GLP30 are 6.07% and 7.22%, and the thermal conductivity is reduced by 22.2% and 21.6% respectively.

3.5. Pozzolan Reactivity

As shown in Table 4 and Table 5, the pozzolan reactivity index differed significantly among the different types of mineral admixtures. Higher compressive strength led to a larger index of pozzolan activity. At an age of 7 d, except for FA10, which had an index of −0.10, the indices of the admixtures with a 10% ratio were higher than the admixtures with a 30% mixing ratio, and the indices of DLS10 and GLP10 were 1.02 and 1.53, respectively. DLS showed no pozzolan reactivity, possibly because hydration derived CaCO3 increased the concrete strength [69]. As hydrated glass powder contains a high content of SiO2, the reactivity index of GLP10 was greater. After 28 d, all mineral admixtures with a 30% mixing ratio had higher pozzolan reactivity indices than those of the same admixture with a 10% mixing ratio. Moreover, the pozzolan reactivity index of FA30 increased the most from 7 d to 120 d among admixtures with a replacing ratio of 30%, and the pozzolan reactivity index increased from 0.45 to 1.11. This is the only sample with a greater reactivity index than that of the same admixture at a mixing ratio of 10%, indicating the occurrence of a pozzolan reaction.

3.6. Thermal Conductivity Analysis

(1)
Changes due to mineral admixture
As shown in Table 6, the K value of the controlled sample (MA0) was the highest it is 0.484 kcal/m.h. °C, while the K values of the samples containing mineral admixtures were between 0.385 and 0.482 kcal/m.h. °C, corresponding to 79.5–99.6% of that of the controlled sample. This indicates that replacing cement with mineral admixtures can improve concrete heat resistance, possibly because the cement content is decreased. Besides altering concrete physical properties, such as the unit weight, water absorption ratio, and porosity ratio, the inherent hydration reactions and products would affect the concrete thermal conductivity.
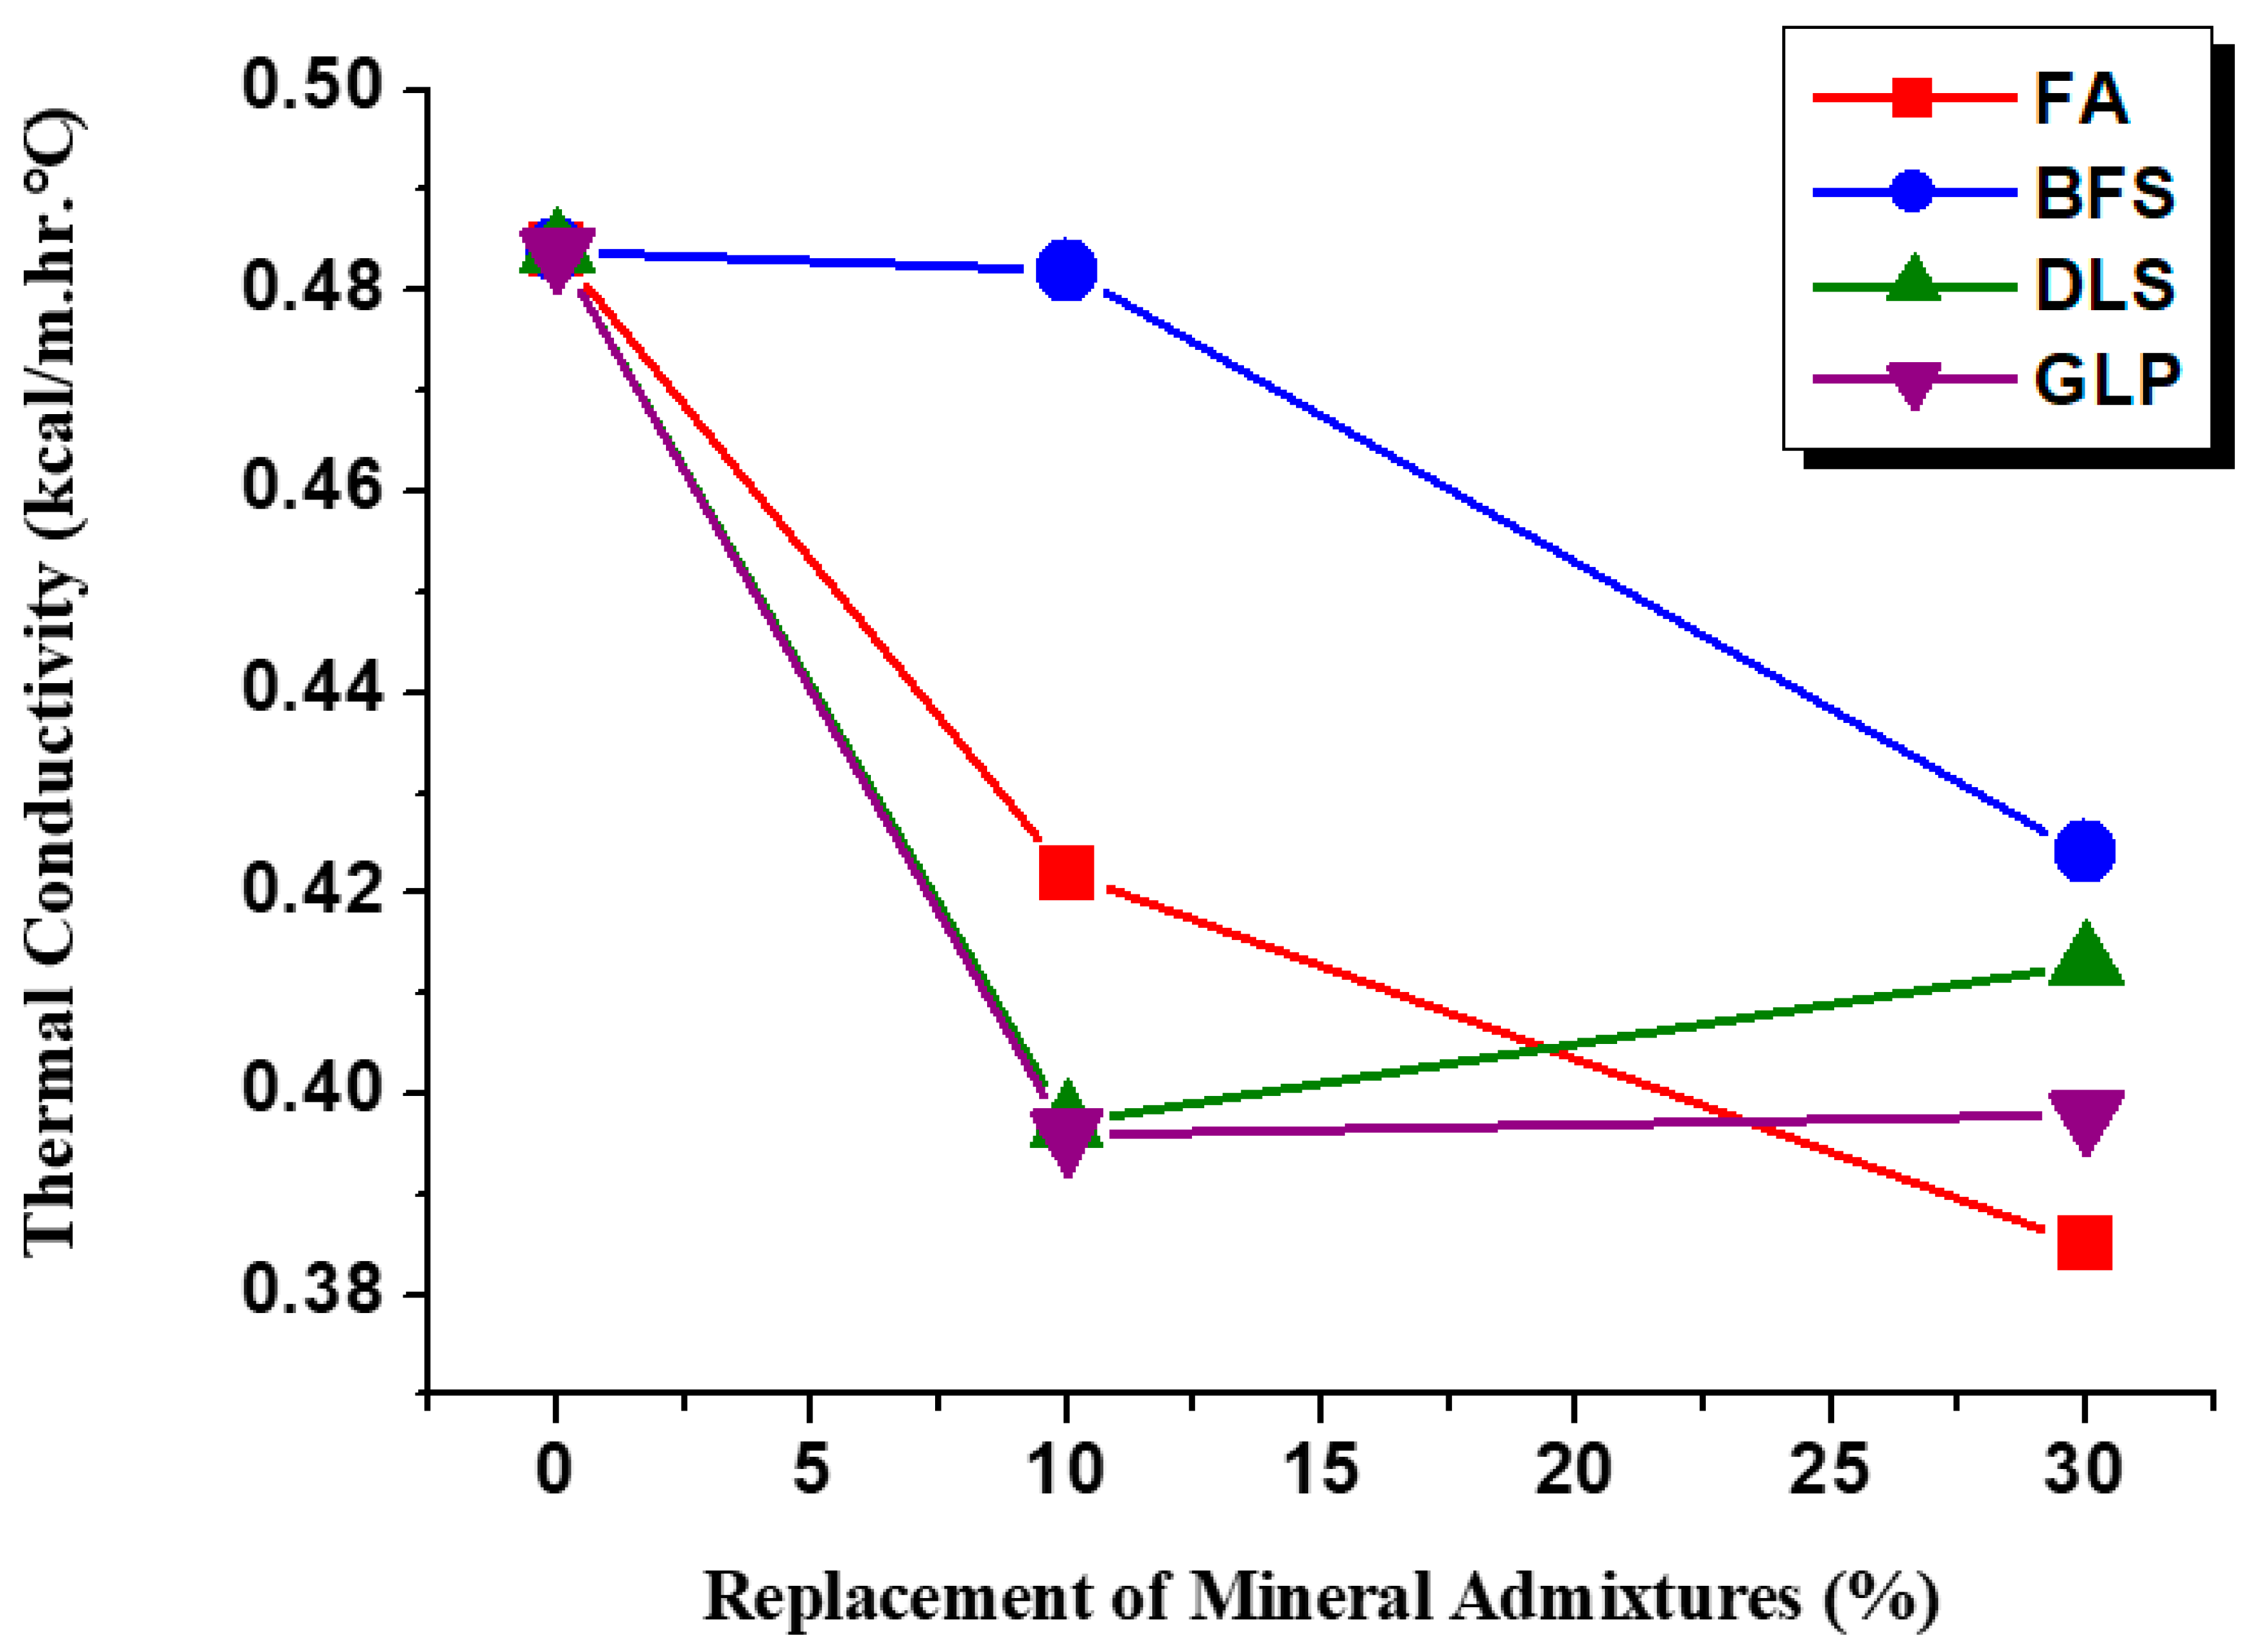
Figure 10 shows the thermal conductivity after replacing cement with FA, and the K values of FA10 and FA30 were 87.2% and 79.5% of that of the controlled sample, respectively. Fly ash will have a pozzolan reaction with CH in cement paste when water is present. Besides consuming CH to form C-S-H gel to fill pores, FA replaces space originally occupied by CH, indirectly reducing the thermal conductivity and increasing concrete thermal properties [70]. The K values of BFS10 and BFS30 reached 99.6% and 87.6% of that of the controlled sample, respectively. In particular, the difference between the thermal conductivity of BFS10 and the controlled sample was insignificant, possibly because the chemical contents, hydration reaction rates, hydration products, and specific weight of BSF are similar to those of cement. The K values of DLS10 and DLS30 were 82.0% and 85.3% of that of the controlled sample, respectively. The K value of DLS30 was higher than that of DLS10, possibly because the addition of DLS reduces the cement content, but the CaO that it contains is also one of the factors affecting the concrete thermal efficiency [71]. Thus, DLS would produce CaCO3 after hydration and increase the production of CaCO3 [72]. In the glass powder group, the thermal conductivity of GLP10 and GLP30 dropped 18.2% and 17.8%, respectively, indicating that the addition of GLP can consume the cement hydration product CH and increase SiO2 involved in reactivity [73], as well as reduce the thermal conductivity of concrete [74].
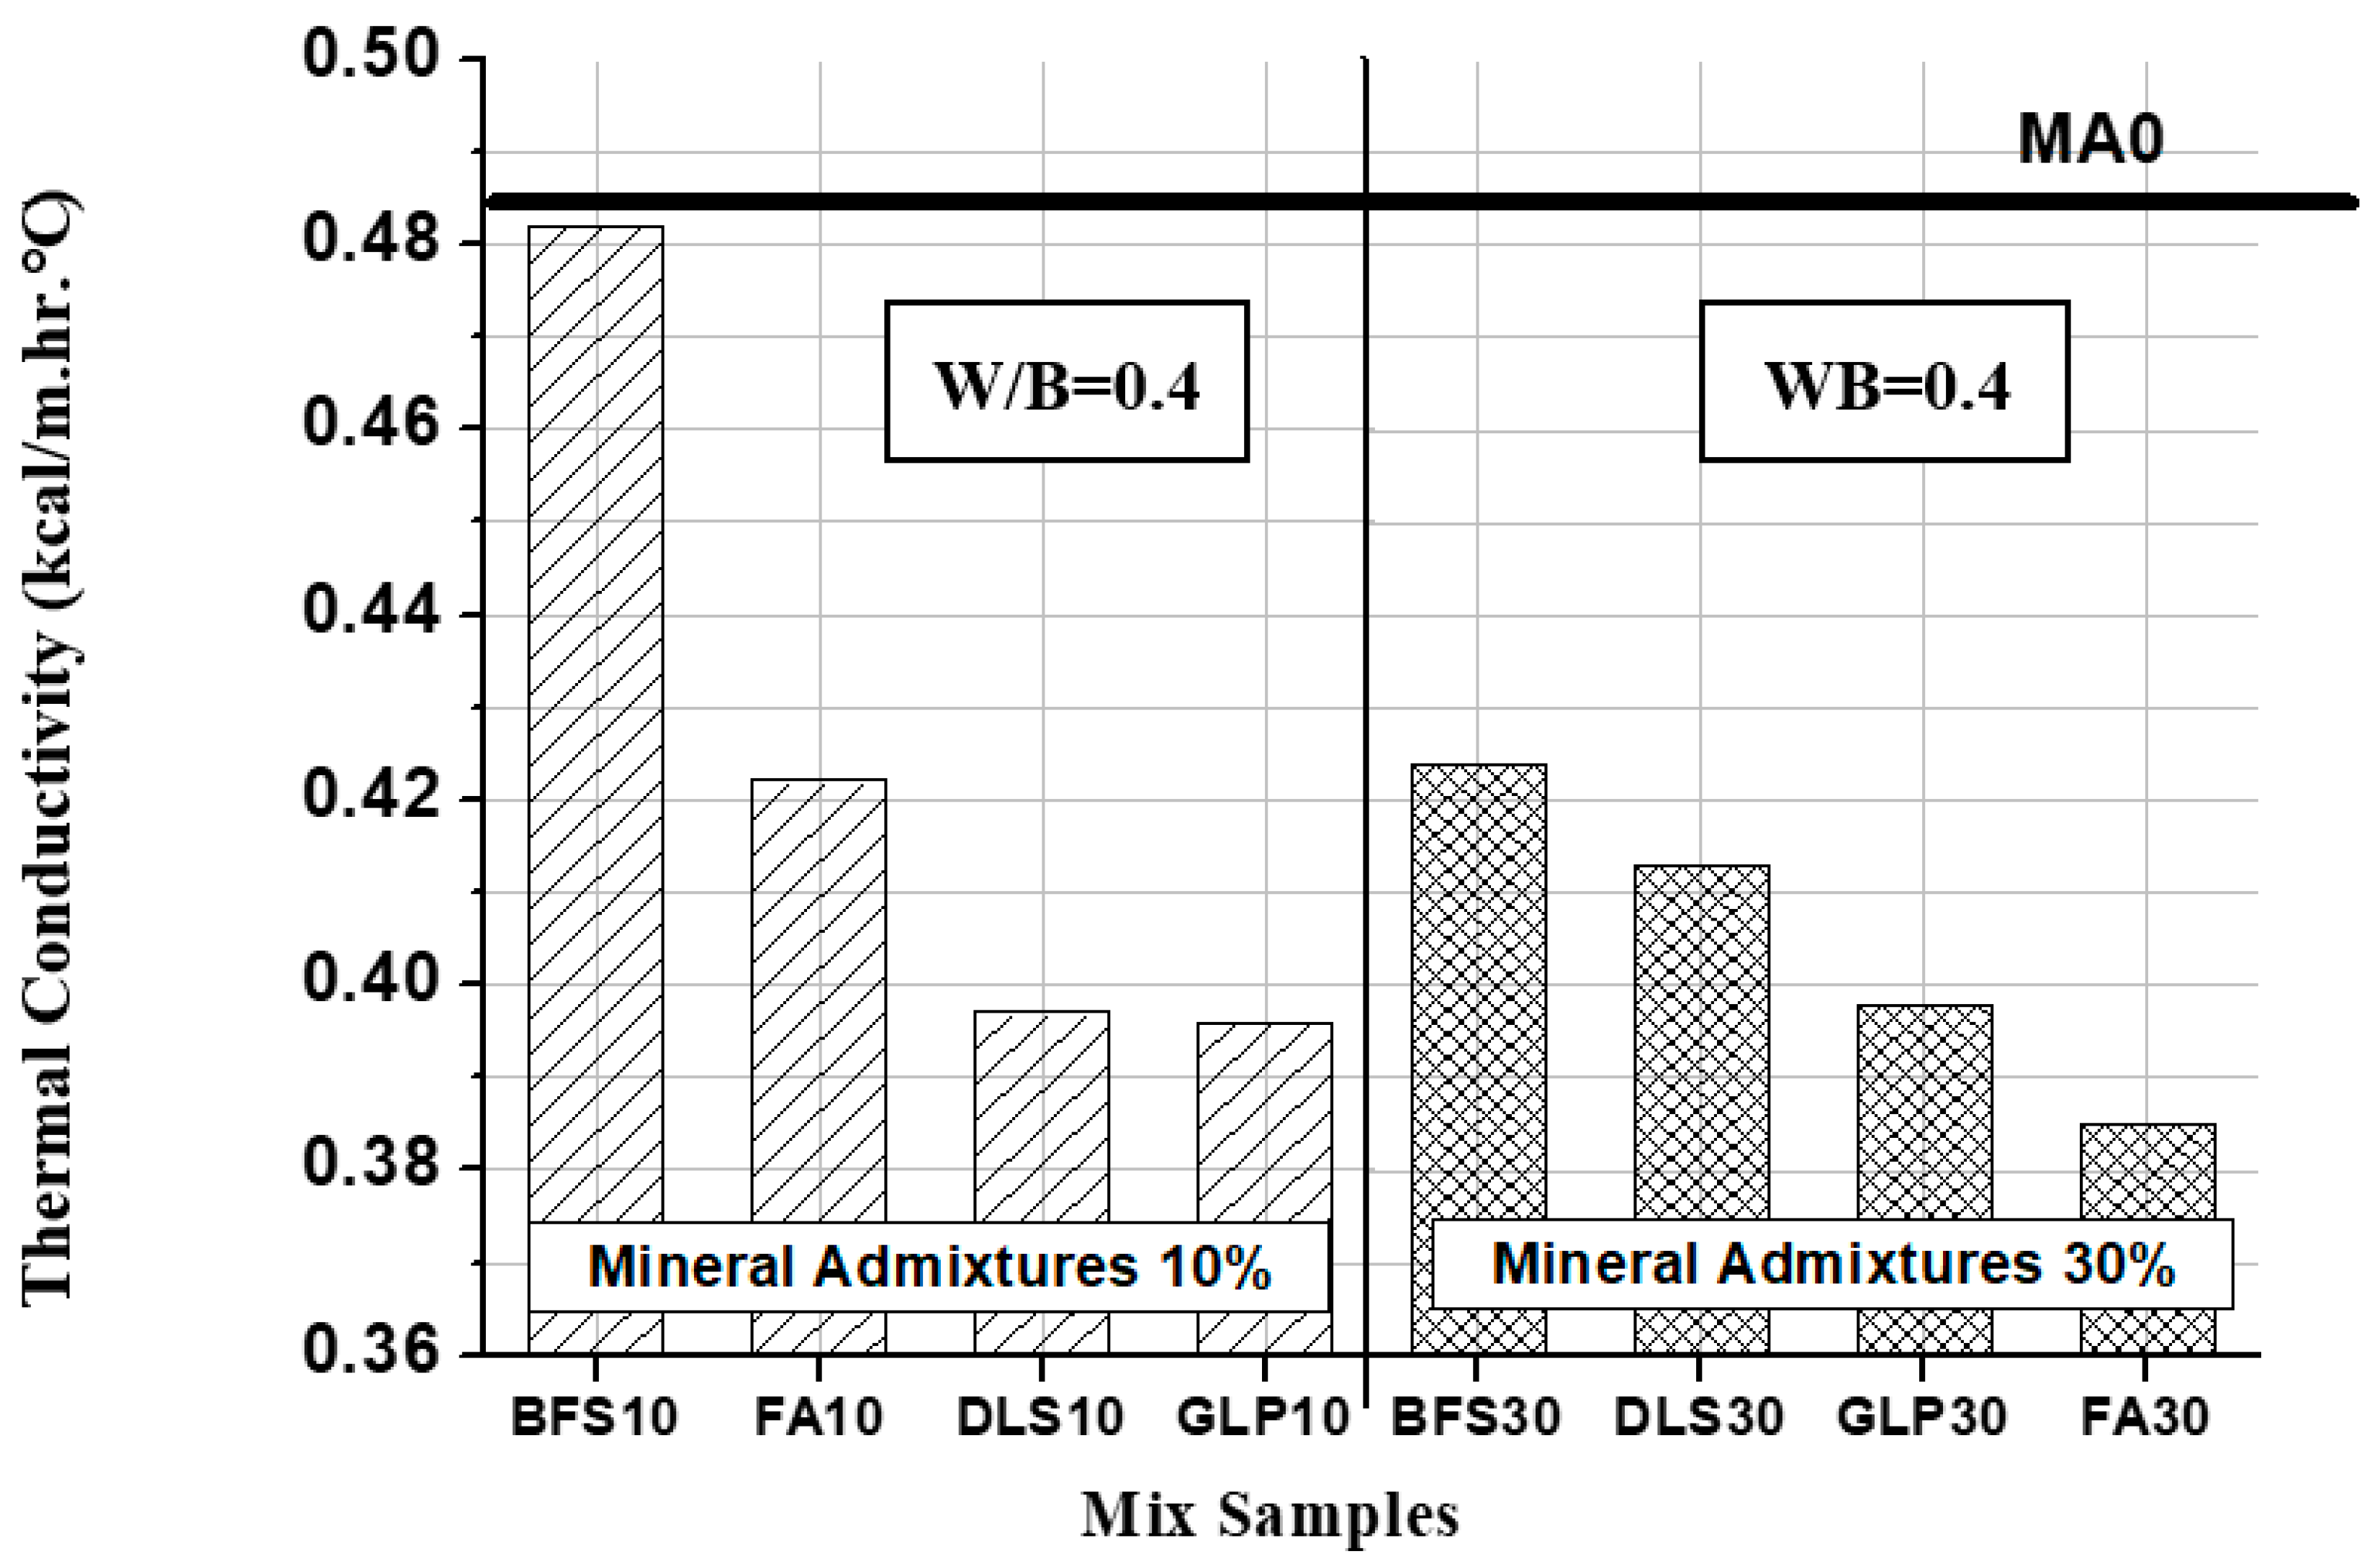
As shown in Figure 11, the K value of BFS30 was the highest among the samples with a 30% replacing ratio, even higher than that of FA10, DLS10, and GLP10, indicating that its impact on thermal conductivity is smaller. The K value of FA30 was the smallest among all the samples, indicating that its heat insulation is the best.
(2)
Differences in unit weight
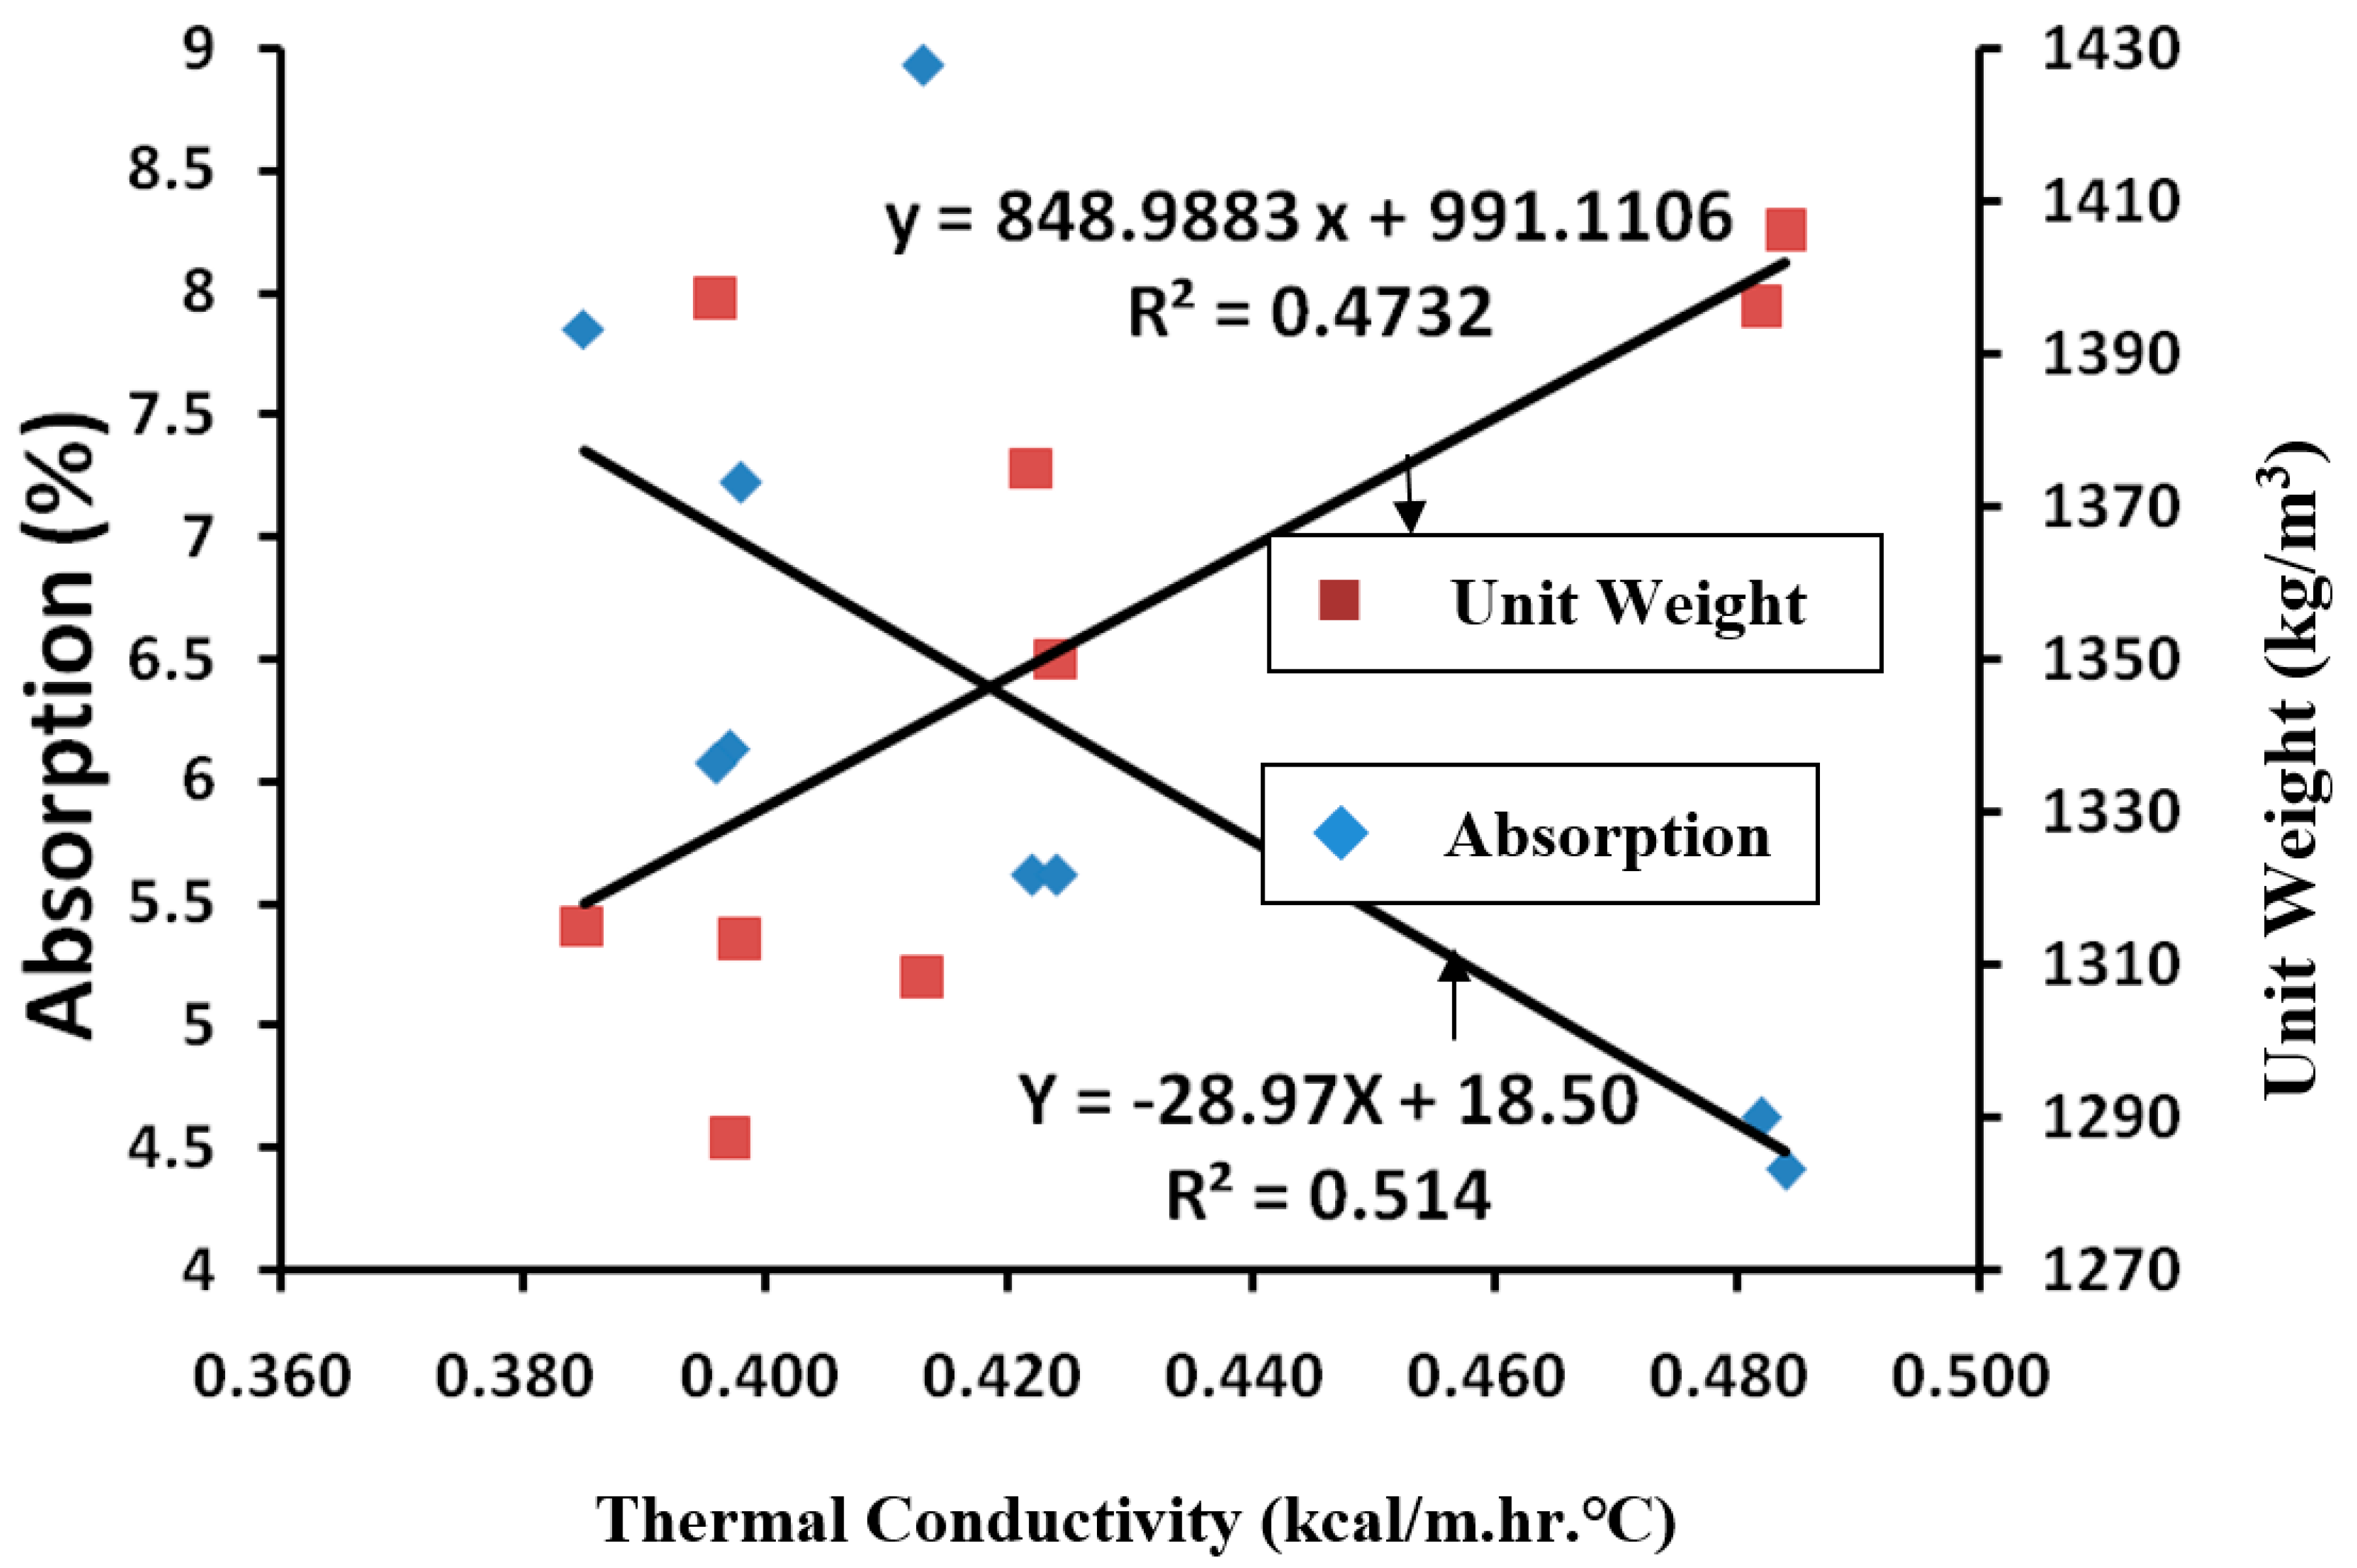
As shown in Table 6 and Figure 12, the unit weight of the lightweight aggregate concrete varies with mineral admixture type. Heavier unit weights did produce greater thermal conductivity. When the unit weight dropped from 1406 kgf/m3 to 1315 kgf/m3, which is a 6.92% reduction, the thermal conductivity also fell from 0.484 to 0.385 kcal/m.h. ℃ and it is reduced by 25.7%, which confirmed the findings of Ramazan et al. [74]. Concrete thermal conductivity is related to density. The test mixture ratios with maximal and minimal unit weights and thermal conductivities were MA0 and FA30, respectively, indicating that the unit weight is correlated with the thermal conductivity. In general, fewer internal voids would lead to a heavier unit weight; this is due to the cement being replaced by mineral admixtures. However, the opposite trend is found in the cases of DLS10 and DLS30; DLS30, with smaller unit weight, had a higher thermal conductivity than that of DLS10, which is due to hydration product properties. Thus, this effect should also be considered in the mixture. Overall, the unit weight had a slight effect on the thermal conductivity but with a low correlation shown by the linear regression correlation coefficient of R2 = 0.4732.
(3)
Changes in the water absorption ratio
Table 6 and Figure 12 show that the water absorption ratio and thermal conductivity index of the controlled sample were 4.41% and 0.484 kcal/m.h. °C, respectively. The water absorptions of FA10 and FA30 are 5.61% and 7.85%, and the thermal conductivity is reduced by 14.7% and 25.7% respectively. The water absorptions of BFS10 and BFS30 are 4.62% and 5.61%; the thermal conductivity is reduced by 4% and 14.2% respectively. The water absorptions of DLS10 and DLS30 are 6.13% and 8.93%, and the thermal conductivity is reduced by 1.9% and 17.2% respectively. The water absorptions of GLP10 and GLP30 are 6.07% and 7.22%, and the thermal conductivity is reduced by 22.2% and 21.6% respectively. The water absorption ratios of the mineral admixtures were greater than that of the controlled sample, indicating that, as the cement is replaced by mineral admixture, the derived concrete porosity varies; specifically, greater porosity did produce a higher water absorption ratio and smaller thermal conductivity. This is due to air acting as an insulator and reducing heat transfer.

3.7. Relationship of Compressive Strength and Thermal Conductivity

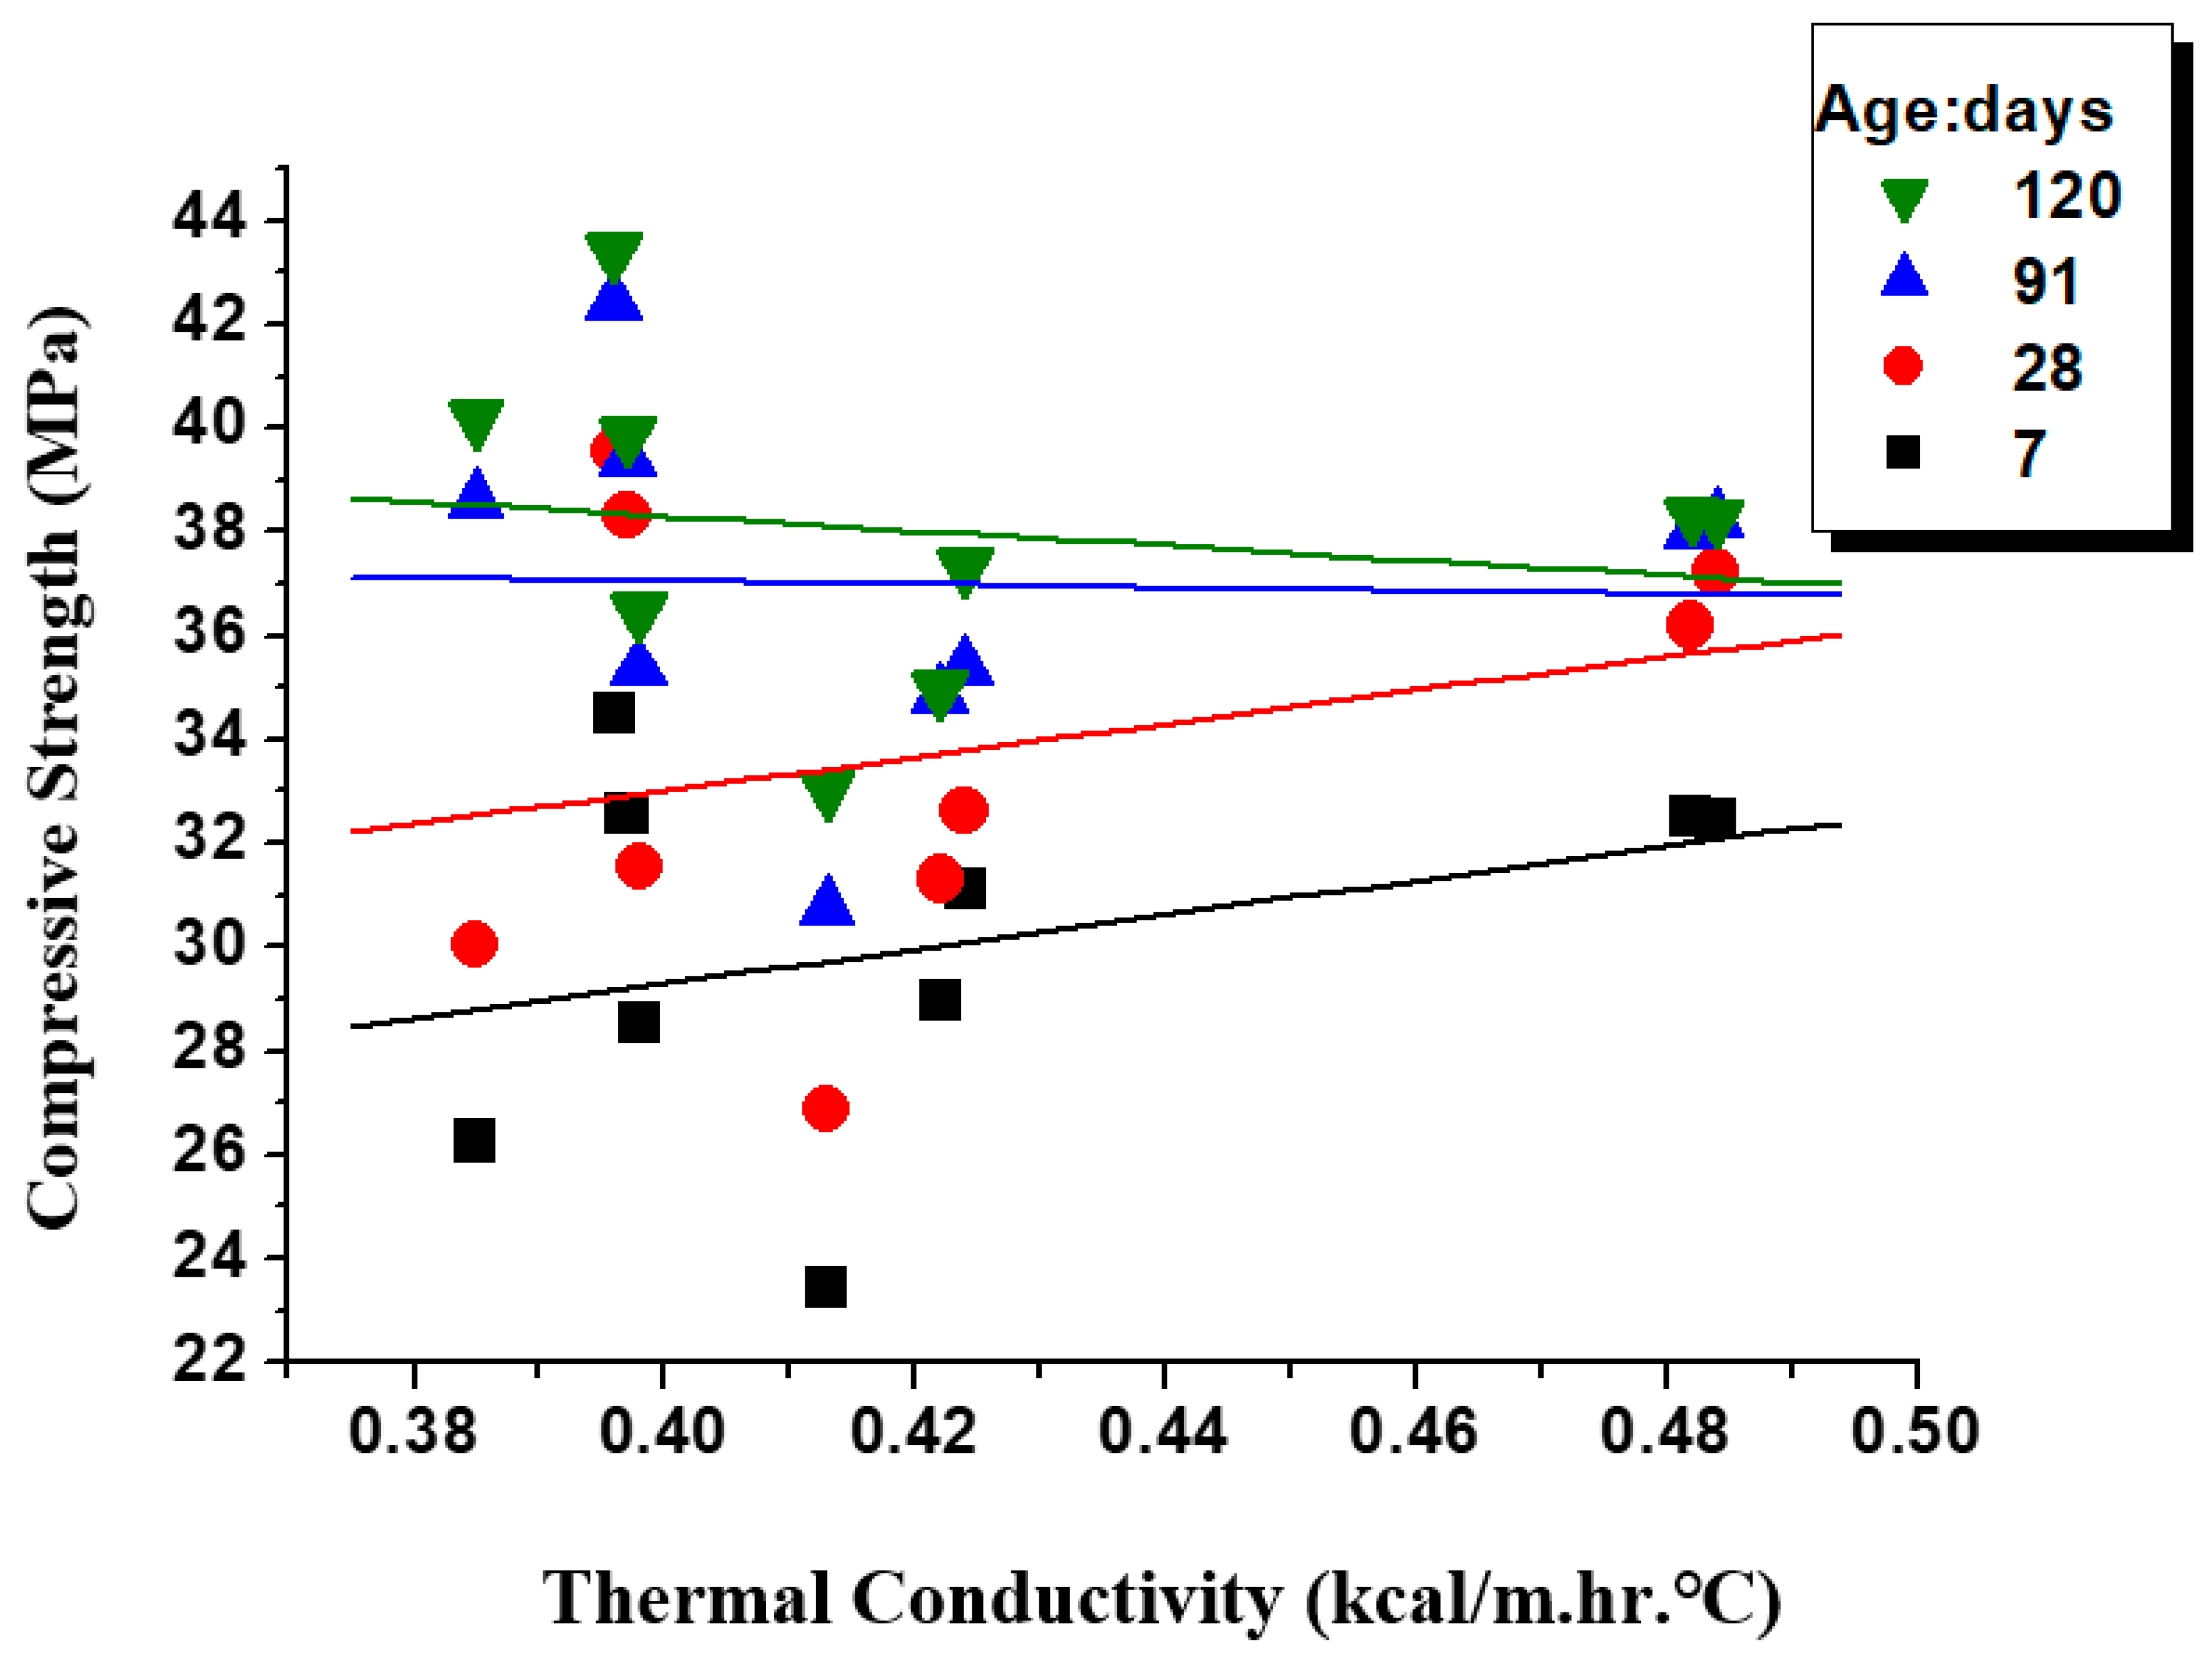
As shown in Figure 13 at an earlier age, when the proportion of mineral admixtures replacing cement amounts for 30% had slower hydration reactions, higher porosity ratios, lower unit weights, and smaller thermal conductivities. However, as the samples aged, mineral admixtures gradually produced pozzolan reactions and reacted with the cement hydration product CH to form a C-S-H gel; thus, the compressive strength increased significantly.
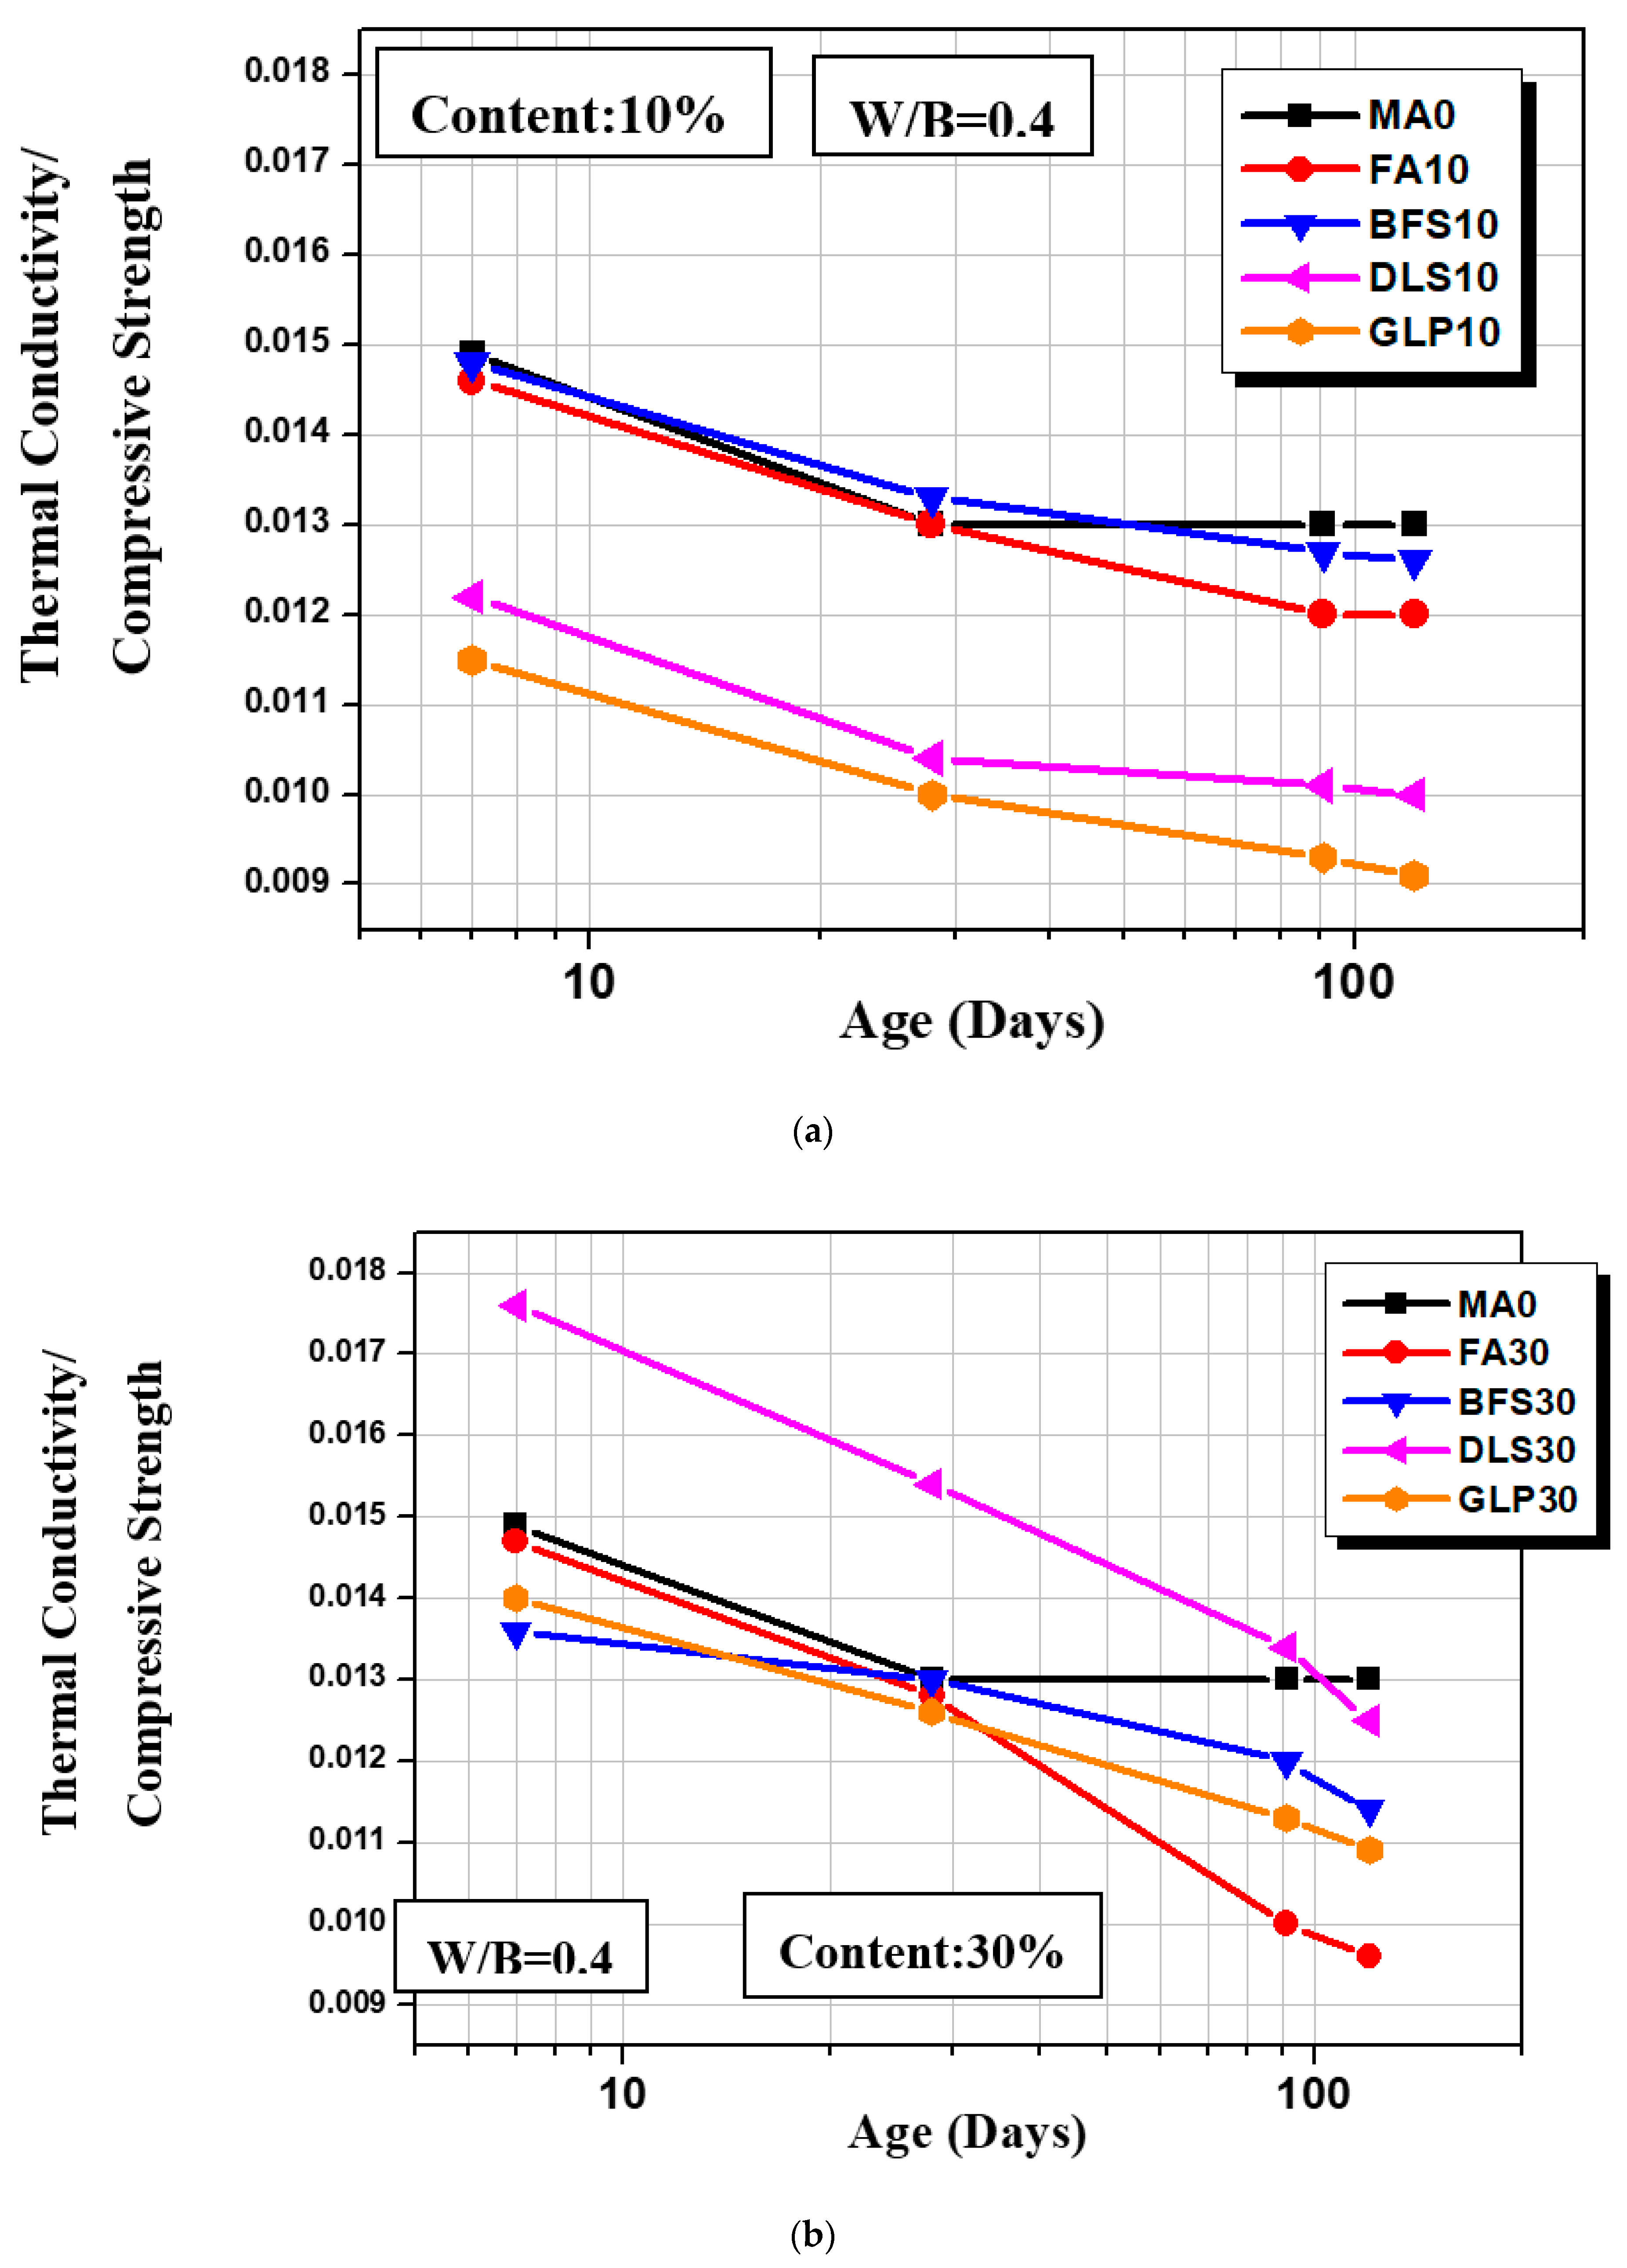
As shown in Figure 6, as the samples aged, the Thermal Conductivity/Compressive Strength (TC/CS) ratio decreased. After 120 d, the TC/CS ratios per unit compressive strength of most mixture ratios were higher than that of the controlled sample (MA0). After 7 d, only the TC/CS ratios of FA10 and BFS10 were slightly higher than those of MA0. Overall, GLP10 presents the highest TC/CS ratio: its TC/CS ratio at 7 d was 29.8% higher than that of MA0, and it increased to 41.3% higher at a later age. The TC/CS ratio of DLS30 at an earlier age was 18% higher than that of MA0; at 120 d, it was already slightly lower than that of MA0. As shown in Figure 14a, among samples with an addition of 10% mineral admixtures, GLP10 and DLS10 showed the highest TC/CS ratios. As shown in Figure 14b, among samples with an addition of 30% mineral admixtures, except for DLS30, whose TC/CS ratio was slightly higher than the controlled sample, the TC/CS ratios at a later age were higher than that of MA0.

3.8. Application Efficiency of Mineral Admixtures

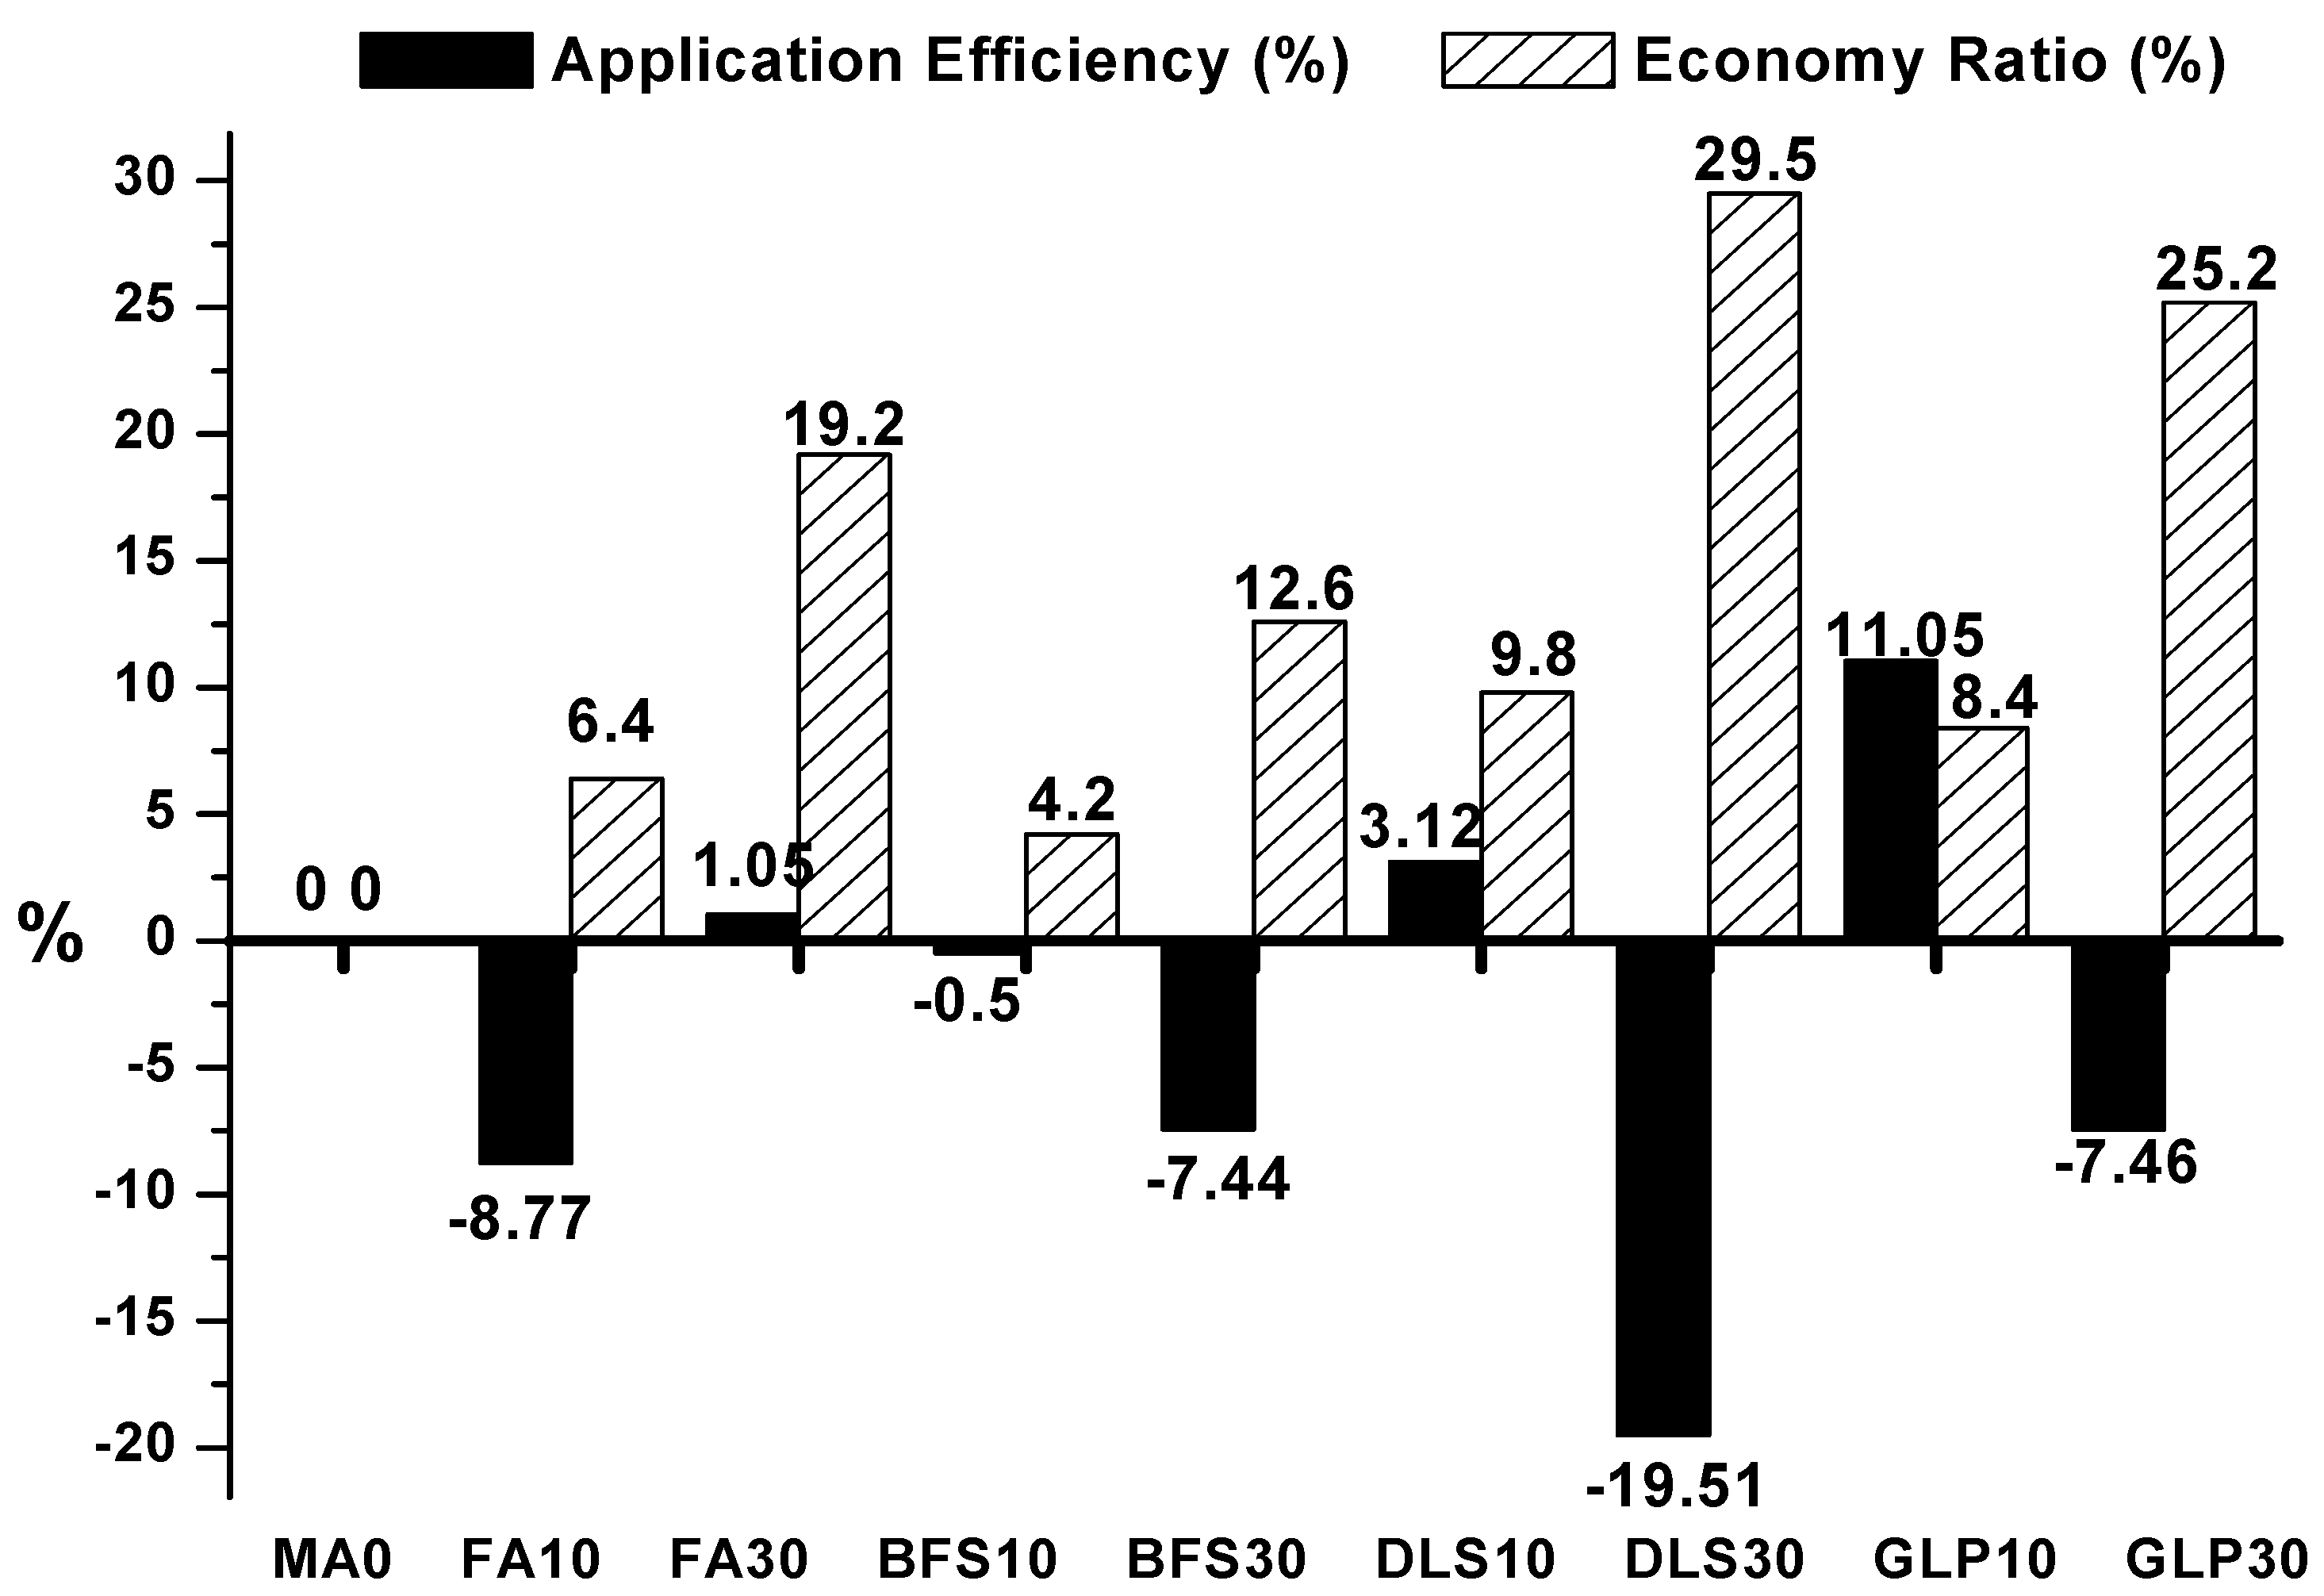
Table 7 shows the cement strength efficiency after adding the mineral admixtures to the concrete. As can be seen, in addition to reducing the cement content, mineral admixtures can provide excellent compressive strength. Figure 8 shows that the cement strength application efficiency is between −19.51% and +11.05%. The samples with application efficiencies higher than that of the controlled sample were FA30, DLS10, and GLP10. GLP10 had the highest application efficiency. The sample with the lowest efficiency was DLS30. The efficiencies of the other samples were below −10%. This indicates that, though not all samples with an addition of mineral admixtures had application efficiencies higher than that of the controlled sample; they could still present certain compressive strengths. Table 8 shows the cost estimation of lightweight aggregate concrete with mineral admixtures replacing a portion of the cement. The costs were calculated according to the cement amount replaced by mineral admixtures and unit price, as shown in Figure 15. The most economic sample was DLS, with a cost reduction of 9.8–29.5%, followed by GLP of 8.4–25.2%, fly ash of 6.4–19.2%, and BSF of 4.2–12.6%.

3.9. CO2 Reduction Benefit

The CO2 reduction of green buildings refers to reducing the consumption of building materials that produce high CO2 emission in their production processes during construction. For cement production, the limestone is mixed with an amount of iron sand and clay thoroughly and ground into finer power to form the crude material, which is preheated and put in the rotary kiln, fired at 1500 °C into granular clinker, cooled, and ground. Therefore, the production of one ton of cement approximately emits 0.85 MT CO2 [75]; the straightforward method for reducing the CO2 emission from cement is to replace cement with mineral admixtures to reduce the cement content. Table 9 shows that the mineral admixture replacement ratio of 10~30% can reduce the CO2 emission rate by 11.1~42.9%, meaning the more cement content is replaced, the more CO2 emission is reduced indirectly.

4. Conclusions

This study explores the various concrete properties of using mineral admixture to replace cement and mixing lightweight aggregate. The ratio is designed to use lightweight coarse and fine aggregates (particle density 1660 kg/m3), fixed water-binder ratio 0.40, mineral admixture. There are four types of materials: fly ash (FA), blast furnace slag (BFS), desulphurization slag (DLS), and glass powder (GLP), and they replace 10% and 30% of cement weight respectively. After various experiments and analysis results, the following conclusions are obtained:
  • After adding various mineral admixtures, the slump was still above 75 mm. Some hydrated mineral admixtures may have increased the paste viscosity and thus undermined the slump; however, all samples complied with the designed slump of 75 mm–100 mm.
  • The compressive strengths of FA10, BFS30, DLS30, and GLP30 at 28d were lower than that of the controlled sample (MA0), at 91%, 98%, 86%, and 95% of that of MAO, respectively. The compressive strengths of FA30, BFS10, DLS10, and GLP10 were higher than that of the controlled sample, at 105%, 100%, 104%, and 113% of that of MA0, respectively. It shows that the strength of lightweight aggregate concrete varies with the types and properties of mineral admixtures and the amount of addition.
  • The addition of fly ash, slag, and glass powder contributes to resistivity; FA30 has the highest resistivity, which is 455% of the control group at the age of 120 days; GLP30 takes second place, 377% of the control group, because the two admixtures consume a lot of cement hydration product CH, changing the ion concentration in concrete. The main reason is that these two admixtures consume a large amount of cement hydration product CH and change the internal ion concentration of concrete.
  • At 7 d, samples with 30% mineral admixtures had significantly lower reactivity indices, and their compressive strengths were also lower than those of samples with 10% mineral admixtures. After 28 d, except for FA10, pozzolan reactivity indices of samples with 30% mixture ratios were higher than those of samples with 10% mixture ratios, indicating that the strength is improved at later ages.
  • Adding mineral admixtures to lightweight aggregate concrete could decrease the thermal conductivity K value by about 0.4–25.7%. FA30 exhibited the optimum heat insulation, which was 79.5% of that of the controlled sample, followed by GLP10, GLP30, and DLS10 (82%). FA10, BFS10, and BFS30 showed no significant effects, indicating that the mineral admixture hydration product properties have a significant effect on the thermal conductivity of lightweight aggregate concrete.
  • MA0 have the highest unit weight and thermal conductivity, and FA30 was the lowest of both but had unit weight and thermal conductivity with a slight correlation of R2 = 0.4732. It shows that the properties of hydration products of mineral admixture have a great influence on the thermal conductivity of lightweight aggregate concrete.
  • The controlled sample had the lowest water absorption ratio. A greater water absorption ratio would lead to greater porosity and smaller thermal conductivity. The water absorption ratios of samples with an addition of mineral admixtures were 105–202% of that of the controlled sample, indicating that samples with mineral admixtures have better heat insulation.
  • Among the samples with the addition of 10% mineral admixtures, GLP10 showed a higher TC/CS ratio, with excellent heat insulation and compressive strength. As for samples with the addition of 30% mineral admixtures, their TC/CS ratios at 7d were less than that of MA0, but at a later age, their TC/CS ratios were higher than that of MA0. The TC/CS ratio of FA30 decreased most significantly.
  • The addition of mineral admixtures to the lightweight aggregate concrete can reduce the cost by 4.2~29.5%; the cost saved by the mineral admixtures varies with the material source, processing mode, and market demand. The mineral admixture replacement ratio of 10–30% can reduce the CO2 emission rate by as high as 11.1–42.9%.
In the future, based on the effect of adding mineral admixture to lightweight aggregate concrete, the applicable structure and application range can be explored.

Author Contributions

H.-Y.W. and J.-N.C. conceived and planned the experiments. T.-T.C. carried out the experiments. H.-Y.W. and T.-T.C. contributed to sample preparation. H.-Y.W., J.-N.C., T.-T.C. and C.-C.H. contributed to the interpretation of the results. H.-Y.W., J.-N.C., and C.-C.H. took the lead in writing the manuscript, and C.-C.H. revised the manuscript. All authors provided critical feedback and helped shape the research, analysis, and manuscript. All authors have read and agreed to the published version of the manuscript.

Funding

Ministry of Science and Technology of Taiwan under project no. MOST 109-2622-E-992-005-CC3.

Conflicts of Interest

The authors declare that they have no known competing financial interests or personal relationships that could have appeared to influence the work reported in this paper. The corresponding author confirms that the final submitted manuscript has been shared with all authors listed on the manuscript and that all authors have confirmed their agreement to the manuscript.

References

  1. Wu, H.H. Discussing the Improvement of the Function of Outer Wall Heat Insulation from the Perspective of Energy-Conserving Architecture. Master’s Thesis, Department of Bioenvironmental Systems Engineering, National Taiwan University, Taipei, Taiwan, 2002. [Google Scholar]
  2. Dondi, M.; Cappelletti, P.; D’Amore, M.; de Gennaro, R.; Graziano, S.F.; Langella, A.; Raimondo, M.; Zanelli, C. Lightweight aggregates from waste materials: Reappraisal of expansion behavior and prediction schemes for bloating. Constr. Build. Mater. 2016, 127, 394–409. [Google Scholar] [CrossRef]
  3. Moreno-Maroto, J.M.; González-Corrochano, B.; Azcárate, J.A.; Anselmo Acosta, L.R. Assessment of crystalline phase changes and glass formation by Rietveld-XRD method on ceramic lightweight aggregates sintered from mineral and polymeric wastes. Ceram. Int. 2018, 44, 11840–11851. [Google Scholar] [CrossRef]
  4. Caprai, V.; Gauvin, F.; Schollbach, K.; Brouwers, H.J.H. MSWI bottom ash as binder replacement in wood cement composites. Constr. Build. Mater. 2019, 196, 672–680. [Google Scholar] [CrossRef]
  5. Tung-Tsan, C.; Wei-Chien, W.; Her-Yung, W. Mechanical properties and ultrasonic velocity of lightweight aggregate concrete containing mineral powder materials. Constr. Build. Mater. 2020, 258, 119–550. [Google Scholar]
  6. Wang, H.Y. Study on durability of densified high-performance lightweight aggregate concrete. J. Comput. Concr. 2007, 4, 499–510. [Google Scholar] [CrossRef] [Green Version]
  7. Wang, H.Y.; Tsai, K.C. Engineering properties of lightweight aggregate concrete made from dredged silt. Cem. Concr. Compos. 2006, 28, 481–485. [Google Scholar] [CrossRef]
  8. Rafat, S. Performance characteristics of high-volume Class F fly ash concrete. Cem. Concr. Res. 2008, 34, 487–493. [Google Scholar]
  9. Moripolou, A.; Bakolas, A.; Aggelakopoulou, E. Evaluation of pozzolanic activity of natural and artificial pozzolans by thermal analysis. Thermochem. Acta 2004, 420, 135–140. [Google Scholar] [CrossRef]
  10. Cabrera, J.; Rojas, M.F. Mechanism of hydration of the metakaolin–lime–water system. Cem. Concr. Res. 2001, 311, 77–182. [Google Scholar] [CrossRef]
  11. Roszczynialski, W. Determination of pozzolanic activity of materials by thermal analysis. J. Therm. Anal. Calorim 2002, 70, 387–392. [Google Scholar] [CrossRef]
  12. Ubbriaco, P.; Bruno, P.; Traini, A.; Calabrese, D. Fly ash reactivity- formation of hydrate phases. J. Therm. Anal. Calorim 2001, 66, 293–305. [Google Scholar] [CrossRef]
  13. Rojas, M.F.; Cabrera, J. The effect of temperature on the hydration rate and stability of the hydration phases of metakaolin–lime–water systems. Cem. Concr. Res. 2002, 32, 133–138. [Google Scholar] [CrossRef]
  14. Al-Jabri, K.S.; Hisada, M.; Al-Oraimi, S.K.; Al-Saidy, A.H. Copper slag as sand replacement for high performance concrete. Cem. Concr. Compos. 2009, 31, 483–488. [Google Scholar] [CrossRef]
  15. Bhikshma, V.; Nitturkar, K.; Venkatesham, Y. Investigations on mechanical properties of high strength silica fume concrete, Asian. J. Civ. Eng. 2009, 10, 335–346. [Google Scholar]
  16. Ghavidel, R.; Madandoust, R. Mechanical properties of concrete containing waste glass powder and rice husk ash. BioSyst. Eng. 2013, 116, 113–119. [Google Scholar]
  17. Standard Concrete Mix Proportioning-Guidelines; Indian IS 10262; Indian Standard: New Delhi, India, 2009.
  18. Kumar, G.V.; Vishaliny, M.H.; Govindarajulu, D. Studies on glass powder as partial replacement of cement in concrete production. J. Emerg. Technol. Adv. Eng. 2013, 3, 2250–2459. [Google Scholar]
  19. Madheswaran, C.K.; Abily, P.S.; Dattatreya, J.K.; Rajamane, N.P. Studies on the use of copper slag as replacement material for river sand in building constructions. J. Inst. Eng. Ind. Ser. A 2014, 95, 169–177. [Google Scholar] [CrossRef] [Green Version]
  20. Obilade, I.O. Use of rice husk ash as partial replacement for cement in concrete. J. Eng. Appl. Sci. 2014, 5, 11–16. [Google Scholar]
  21. Patil, D.M.; Sangle, K.K. Experimental investigation of waste glass powder as partial replacement of cement in concrete. J. Adv. Technol. Civ. Eng. 2013, 2, 112–117. [Google Scholar]
  22. Qamruddin, M.; Kalurkar, L.G. Effect of unprocessed rice husk ash as a cementitious material in concrete (a comparison with silica fume). J. Civ. Eng. Technol. 2013, 4, 240–245. [Google Scholar]
  23. Schwarz, N.; Cam, H.; Neithalath, N. Influence of a fine glass powder on the durability characteristics of concrete and its comparison to fly ash. Cem. Concr. Compos. 2008, 30, 486–496. [Google Scholar] [CrossRef]
  24. Shekhawat, B.S.; Aggarwal, V. Utilization of waste glass powder in a concrete-a literature review. J. Innovat. Res. Sci. Eng. Technol. 2014, 3, 14823–14826. [Google Scholar]
  25. Vasudevan, G.; Pillay, S.G.K. Performance of using waste glass powder in concrete as a replacement of cement. Am. J. Eng. Res. 2013, 2, 175–181. [Google Scholar]
  26. Wankhede1, P.R.; Fulari, V.A. Effect of fly ash on properties of concrete. J. Emerg. Technol. Adv. Eng. 2014, 4, 284–289. [Google Scholar]
  27. Wei, W.; Weide, Z.; Guowei, M. Optimum content of copper slag as a fine aggregate in high strength concrete. Mater. Des. 2010, 31, 2878–2883. [Google Scholar]
  28. Kurpinska, M.; Ferenc, T. Experimental and numerical investigation of mechanical properties of lightweight concretes (LWCs) with various aggregates. Materials 2020, 13, 3474. [Google Scholar] [CrossRef]
  29. Kou, S.C.; Xing, F. The effect of recycled glass powder and reject fly ash on the mechanical properties of fiber-reinforced ultralight performance concrete. Adv. Mater. Sci. Eng. 2012, 8. [Google Scholar] [CrossRef] [Green Version]
  30. Berge, B. The Ecology of Building Materials, 2nd ed.; Architectural Press-Elsevier: Cambridge, MA, USA, 2009. [Google Scholar]
  31. Pelisser, F.; Barcelos, A.; Santos, D.; Peterson, M.; Bernandin, A.M. Lightweight concrete production with low Portland cement consumption. J. Clean. Prod. 2012, 23, 68–74. [Google Scholar] [CrossRef]
  32. Akcaozoglu, S.; Atis, C.D. Effect of granulated blast furnace slag and fly ash addition on the strength properties of lightweight mortars containing waste PET aggregates. Constr. Build. Mater. 2011, 25, 4052–4058. [Google Scholar] [CrossRef]
  33. Kockal, N.U.; Ozturan, T. Strength and elastic properties of structural lightweight concretes. Mater. Des. 2011, 32, 2396–2403. [Google Scholar] [CrossRef]
  34. Ducman, V.; Mirtic, B. The applicability of different waste materials for the production of lightweight aggregates. Waste Manag. (Oxford) 2009, 29, 2361–2368. [Google Scholar] [CrossRef]
  35. Xu, Y.; Jiang, L.; Xu, J.; Li, Y. Mechanical properties of expanded polystyrene lightweight aggregate concrete and brick. Constr. Build. Mater. 2012, 1, 32–38. [Google Scholar] [CrossRef]
  36. Trtik, P.; Munch, B.; Weiss, W.J.; Kaestner, A.; Jerjen, I.; Josic, L.; Lehman, E.; Lura, P. Release of internal curing water from lightweight aggregates in cement paste investigated by neutron and X-ray tomography. Nucl. Instrum. Methods A 2011, 651, 244–249. [Google Scholar] [CrossRef]
  37. Madandoust, R.; Ranjbar, M.M.; Mousavi, S.Y. An investigation on the fresh properties of self-compacted lightweight concrete containing expanded polystyrene. Constr. Build. Mater. 2011, 25, 3721–3731. [Google Scholar] [CrossRef]
  38. Shannag, M.J. Characteristics of lightweight concrete containing mineral admixtures. Constr. Build. Mater. 2011, 25, 658–662. [Google Scholar] [CrossRef]
  39. Zhang, H. Building Materials in Civil Engineering; Woodhead Publishing: Cambridge, UK, 2011. [Google Scholar]
  40. El-Gamal, S.M.A.; Hashem, F.S.; Amin, M.S. Thermal resistance of hardened cement pastes containing vermiculite and expanded vermiculite. J. Therm. Anal. Calorim 2012, 109, 217–226. [Google Scholar] [CrossRef]
  41. Koksal, F.; Gencel, O.; Brostow, W.; Lobland Hagg, H.E. Effect of high temperature on mechanical and physical properties of lightweight cement based refractory including expanded vermiculite. Mater. Res. Innov. 2012, 16, 7–13. [Google Scholar] [CrossRef]
  42. Hossain, K.M.A.; Ahmed, S.; Lachemi, M. Lightweight concrete incorporating pumice based blended cement and aggregate: Mechanical and durability characteristics. Constr. Build. Mater. 2011, 25, 1186–1195. [Google Scholar] [CrossRef]
  43. Castro, J.; Keiser, L.; Golias, M.; Weiss, J. Absorption and desorption properties of fine lightweight aggregate for application to internally cured concrete mixtures. Cem. Concr. Compos. 2011, 33, 1001–1008. [Google Scholar] [CrossRef]
  44. Sengul, O.; Azizi, S.; Karaosmanoglu, F.; Tasdemir, M.A. Effect of expanded perlite on the mechanical properties and thermal conductivity of lightweight concrete. Energy Build. 2011, 43, 671–676. [Google Scholar] [CrossRef]
  45. Ismail, A.; Elmaghraby, M.; Mekky, H. Engineering properties, microstructure and strength development of lightweight concrete containing pumice aggregates. Int. J. Dordr. 2012, 31, 1465–1476. [Google Scholar] [CrossRef]
  46. Kim, H.K.; Jeon, J.H.; Lee, H.K. Workability, and mechanical, acoustic and thermal properties of lightweight aggregate concrete with a high volume of entrained air. Constr. Build. Mater. 2012, 29, 193–200. [Google Scholar] [CrossRef]
  47. Kismi, M.; Poullain, P.; Mounanga, P. Transient thermal response of lightweight cementitious composites made with polyurethane foam waste. Int. J. Thermophys. 2012, 33, 1239–1258. [Google Scholar] [CrossRef]
  48. Uzala, B.; Turanl, L.; Yücelc, H.; Göncüoğlu, M.C.; Çulfaz, A. Pozzolanic activity of clinoptilolite: A comparative study with silica fume, fly ash and a non-zeolitic natural pozzolan. Cem. Conr. Res. 2010, 40, 398–404. [Google Scholar] [CrossRef]
  49. Demirboga, R.; Kan, A. Thermal conductivity and shrinkage properties of modified waste polystyrene aggregate concretes. Constr. Build. Mater. 2012, 35, 730–734. [Google Scholar] [CrossRef]
  50. Pereira-de-Oliveira, L.A.; Castro-Gomes, J.P.; Santos, P.M.S. The potential pozzolanic activity of glass and red-clay ceramic waste as cement mortars components. Constr. Build. Mater. 2012, 31, 197–203. [Google Scholar] [CrossRef]
  51. Shi, C.; Wu, Y.; Riefler, C.; Wang, H. Characteristics and pozzolanic reactivity of glass powders. Cem. Concr. Res. 2005, 35, 987–993. [Google Scholar] [CrossRef]
  52. Dyer, T.D.; Dhir, R.K. Chemical reactions of glass cullet used as cement component. J. Mater. Civ. Eng. 2001, 13, 412–417. [Google Scholar] [CrossRef]
  53. Bajad, M.N.; Modhera, C.D.; Desai, A.K. Effect of glass on strength of concrete subjected to sulphate attack. Int. J. Civ. Eng. Res. Dev. 2011, 1, 1–13. [Google Scholar]
  54. Meena, A.; Singh, R. Comparative Study of Waste Glass Powder as Pozzolanic Material in Concrete. Bachelor’s Thesis, Department of Civil Engineering, National Institute of Technology, Rourkela, India, 2012; p. 46. [Google Scholar]
  55. Nassar, R.; Soroushian, P. Field investigation of concrete incorporating milled waste glass. J. Solid Waste Technol. Manag. 2011, 37, 307–319. [Google Scholar] [CrossRef] [Green Version]
  56. Federico, L. Waste Glass—A Supplementary Cementitious Material. Ph.D. Thesis, Department of Civil Engineering, McMaster University, Hamilton, ON, Canada, 2013; p. 99. [Google Scholar]
  57. ASTM Chemical Shrinkage of Hydraulic Cement Paste; ASTM C 1608; ASTM: Conshohocken, PA, USA, 2012; 5p.
  58. Sarkar, S.; Halder, A.; Bishnoi, S. Shrinkage in concretes containing fly ash. In Proceedings of the UKIERI Concrete Congress, Jalandhar, India, 2–5 March 2013. [Google Scholar]
  59. ASTM. Standard Test Method for Compressive Strength of Hydraulic Cement Mortars (Using 2-in. or [50-mm] Cube Specimens); ASTM C 109M; ASTM: Conshohocken, PA, USA, 2012; p. 10. [Google Scholar]
  60. ASTM. Measurement of Rate of Absorption of Water by Hydraulic Cement Concretes; ASTM C 1585; ASTM: Conshohocken, PA, USA, 2011. [Google Scholar]
  61. Habib, U.; Ramazan, D.; Remzi, S.; Rustem, G. The effects of different cement dosages, slumps, and pumice aggregate ratios on the thermal conductivity and density of concrete. Cem. Concr. Res. 2004, 34, 845–848. [Google Scholar]
  62. Ramazan, D.; Ibrahim, T.; Mehmet, B.K. Thermo-mechanical properties of concrete containing high-volume mineral admixtures. Build. Environ. 2007, 42, 349–354. [Google Scholar]
  63. Bederina, M.; Marmoret, L.; Mezreb, K.; Khenfer, M.M.; Bali, A. Que’neudec M. Effect of the addition of wood shavings on thermal conductivity of sand concretes: Experimental study and modeling. Constr. Build. Mater. 2007, 21, 662–668. [Google Scholar] [CrossRef]
  64. Ramazan, D. Thermal conductivity and compressive strength of concrete incorporation with mineral admixtures. Build. Environ. 2007, 42, 67–71. [Google Scholar]
  65. Kima, K.H.; Jeonb, S.E.; Kimb, J.K.; Sungchul, Y. An experimental study on thermal conductivity of concrete. Cem. Concr. Res. 2003, 33, 363–371. [Google Scholar] [CrossRef]
  66. Ahmad, S.; Aimin, X. Performance of glass powder as a pozzolanic material in concrete: A field trial on concrete slabs. Cem. Concr. Res. 2006, 36, 457–468. [Google Scholar]
  67. Hsu, T.H. Evolution of fly ash and bottom ash application and latest development technology. In Proceedings of the Taiwan Concrete Technology and Application Proseminar, Kaohsiung, Taiwan, 12 December 2006; pp. 165–184. [Google Scholar]
  68. Hwang, C.L. High Performance Concrete Theory and Practice; Chan’s Arch-Publishing Co: Bedford St, UK, 2017. [Google Scholar]
  69. Li, K.H.; Kao, P. Impact of Nano-silica powder SiO2 and CaCO3 on concrete property. J. China Railw. Soc. 2006, 28, 131–136. [Google Scholar]
  70. Lin, I.F. A Study on Fire Resistance of Concrete with Mix Lightweight Aggregates. Master’s Thesis, Department of Civil Engineering, Nation Chung Hsing University, Taichung, Taiwan, 2004. [Google Scholar]
  71. Shin, K.Y.; Kim, S.B.; Kim, J.H.; Chung, M.; Jung, P.S. Thermo-physical properties and transient heat transfer of concrete at elevated temperatures. Nuclear Eng. Des. 2002, 212, 223–241. [Google Scholar] [CrossRef] [Green Version]
  72. Weng, M.W. The Feasibility of Desulphurization/Granulated Slag Resources Recovery on the Controlled Low Strength Material without Portland Cement. Master’s Thesis, Department of Civil Engineering, National Kaohsiung University of Applied Sciences, Kaohsiung, Taiwan, 2007. [Google Scholar]
  73. Wu, J.Y. The Study on the Macro and Micro Property of the High-Silicon Powder Waste Glass Mortar. Master’s Thesis, Department of Civil Engineering, National Kaohsiung University of Applied Sciences, Kaohsiung, Taiwan, 2007. [Google Scholar]
  74. Ramazan, D.; Rustem, G. The effects of expanded perlite aggregate, silica fume and fly ash on the thermal conductivity of lightweight concrete. Cem. Concr. Res. 2003, 33, 723–727. [Google Scholar]
  75. Huang, S.L. Pozzolan Concrete Instruction Manual; Sinotech Engineering Consultants: Nanjing, China, 2007. [Google Scholar]
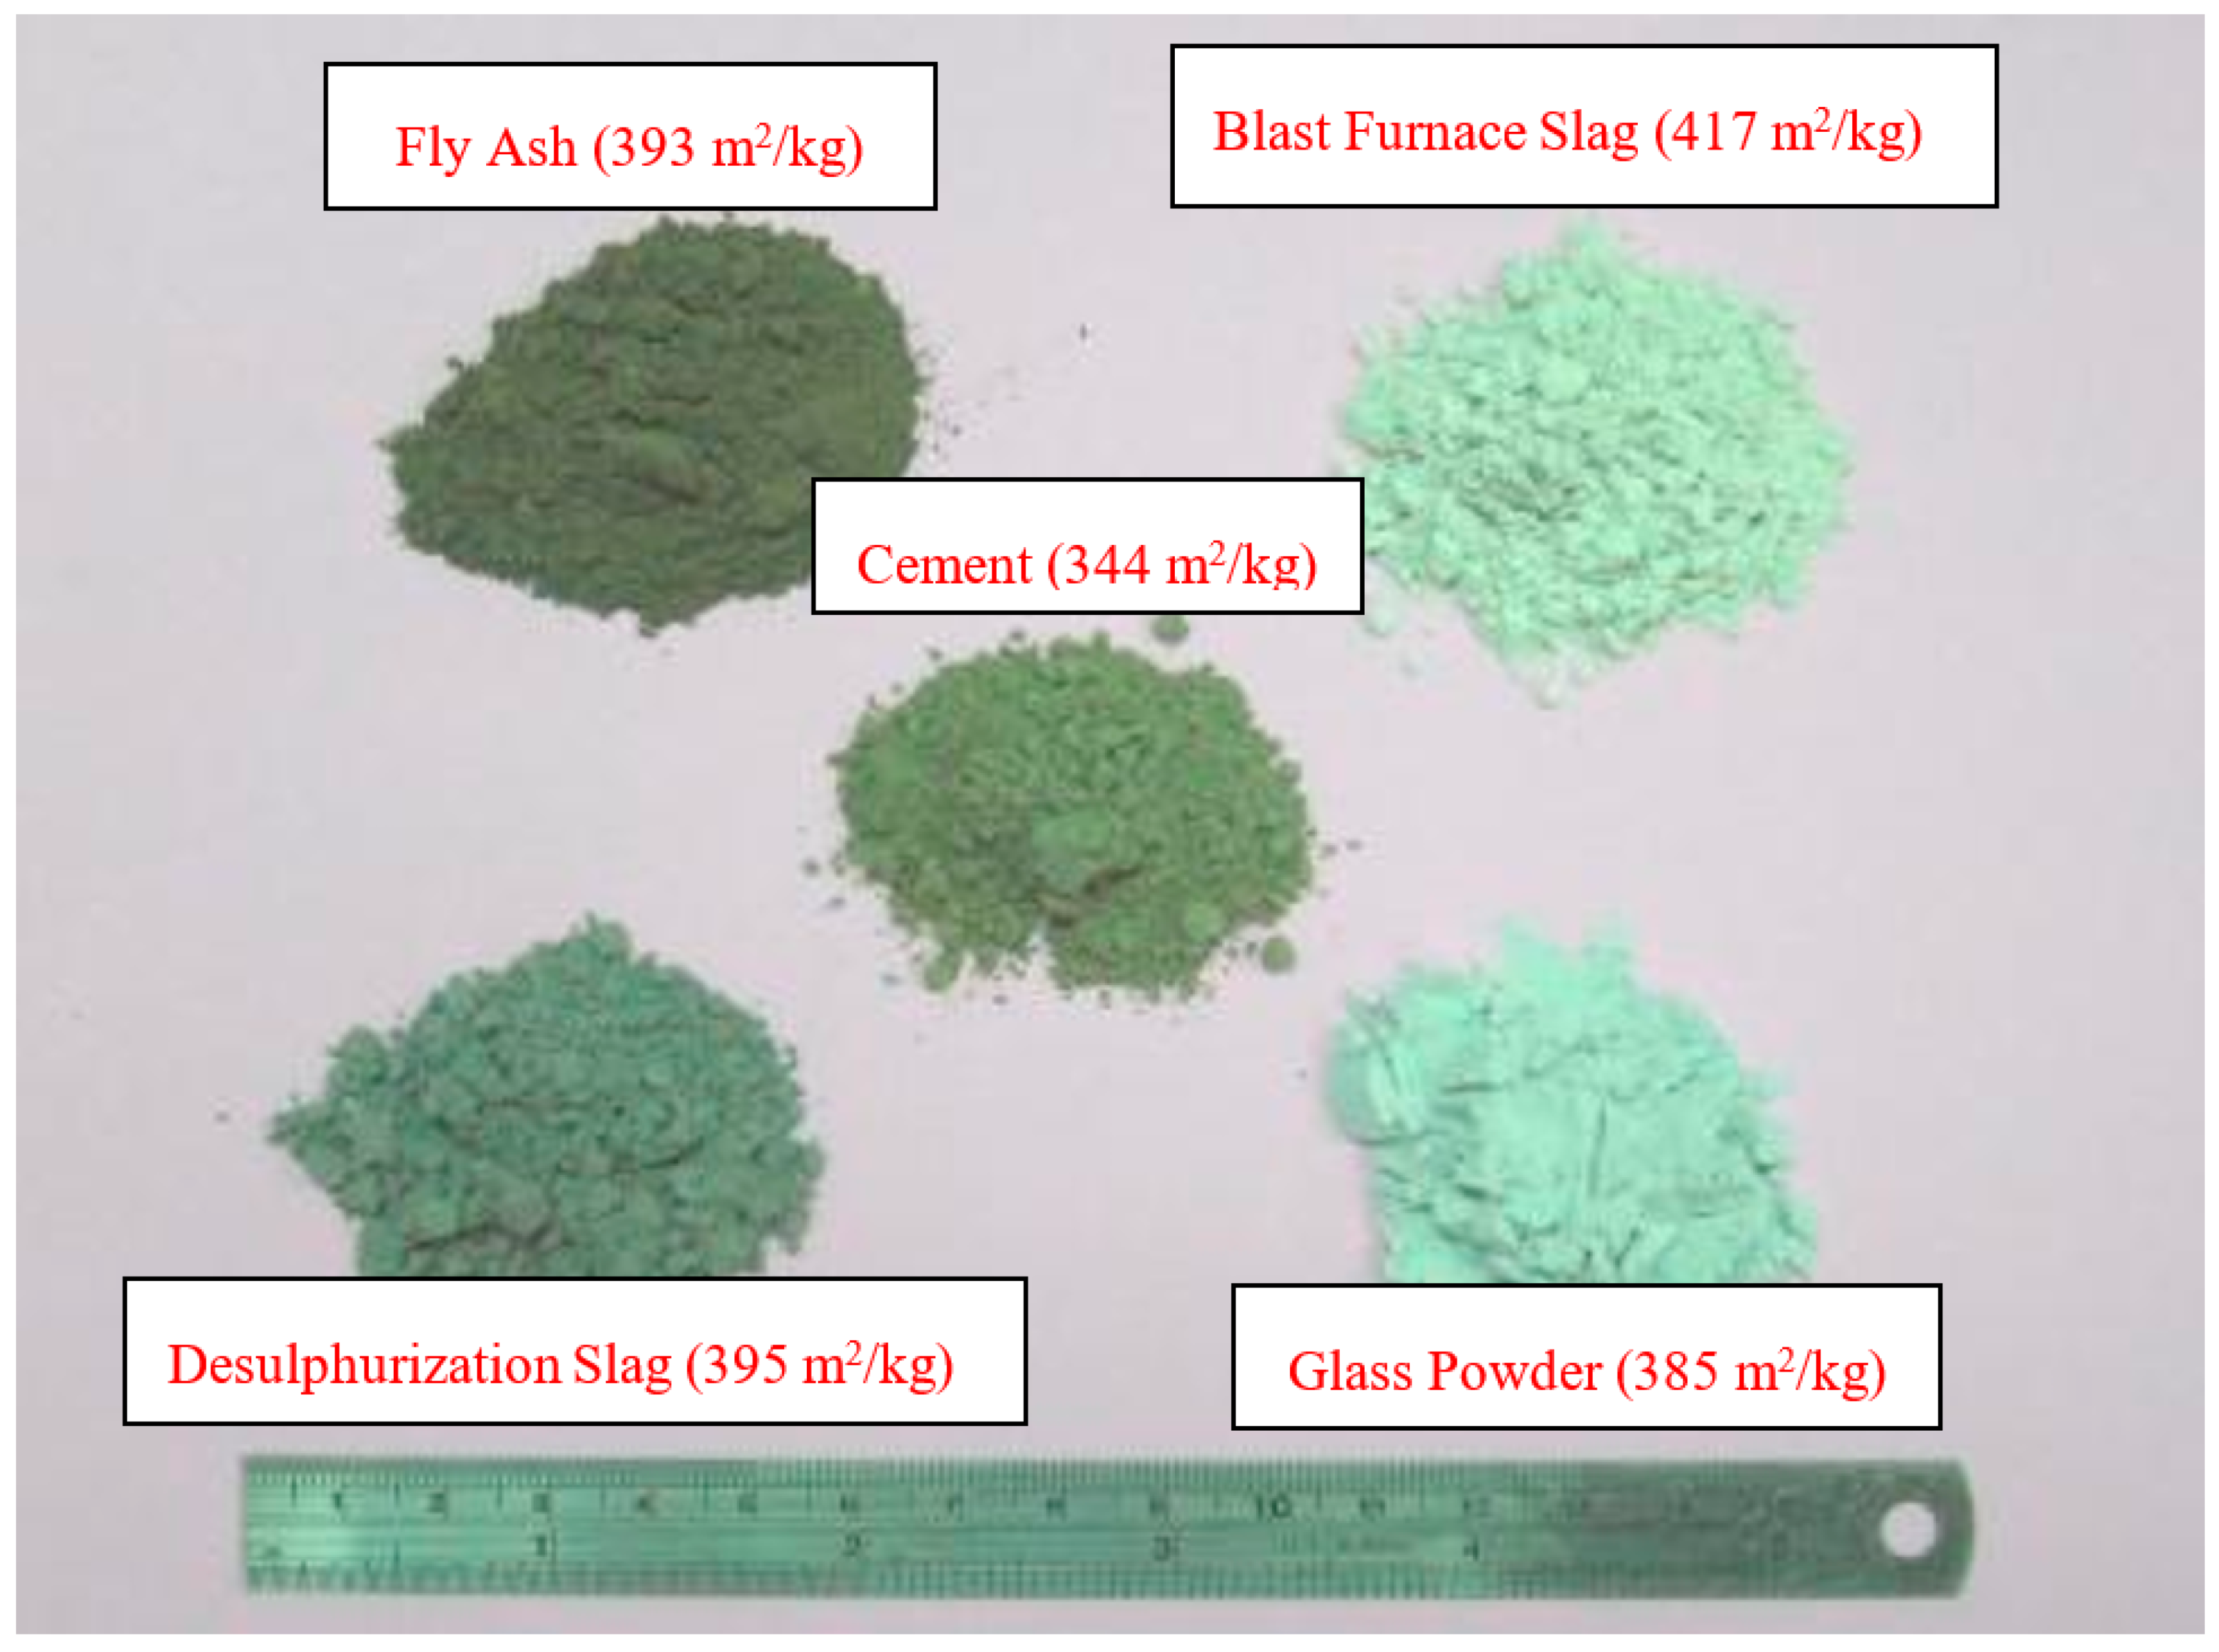
Figure 1. The exterior of cement and mineral admixtures.
Applsci 10 07871 g001
Figure 2. Lightweight aggregate particles.
Applsci 10 07871 g002
Figure 3. The compressive strength of MLAC.
Applsci 10 07871 g003
Figure 4. Relationship between resistivity and age of MLAC with fly ash.
Applsci 10 07871 g004
Figure 5. Relationship between resistivity and age of MLAC with slag.
Applsci 10 07871 g005
Figure 6. Relationship between resistivity and age of MLAC with desulfurization slag.
Applsci 10 07871 g006
Figure 7. Relationship between resistivity and age of MLAC with glass powder.
Applsci 10 07871 g007
Figure 8. The relationship between the resistivity and age of MLAC (a) 10% (b) 30% in lightweight aggregate.
Applsci 10 07871 g008
Figure 9. Regression curve of resistivity and compressive strength of MLAC.
Applsci 10 07871 g009
Figure 10. The relationship between thermal conductivity and the replacement of mineral admixtures.
Applsci 10 07871 g010
Figure 11. Thermal conductivity of MLAC with mineral admixtures 10% and 30%.
Applsci 10 07871 g011
Figure 12. The relationship between unit weight, water absorption, and thermal conductivity.
Applsci 10 07871 g012
Figure 13. The relationship between compressive strength and thermal conductivity.
Applsci 10 07871 g013
Figure 14. Thermal conductivity/compressive of MLAC with (a) 10% (b) 30% mineral admixtures.
Applsci 10 07871 g014
Figure 15. The application efficiency and the economic ratio of MLAC.
Applsci 10 07871 g015
Table 1. The physical and chemical properties of mineral admixtures.
ComponentSiO2Al2O3Fe2O3CaOMgOSO3LoISpecific Gravity (g/cm3)Fineness (m2/kg)
Cement (%)20.744.653.162.853.432.362.113.15344
FA (%)48.2638.234.582.842.920.755.382.2393
BFS (%)35.4713.710.33416.60.952.9417
DLS (%)12.163.136.2147.422.42395
GLP (%)62.4816.769.412.70.22.46385
Table 2. Properties of lightweight aggregates.
Specific GravityWater Absorption in 30 min (%)Water Absorption in 24 h (%)Maximum Size (in)Finess Modulus (FM)Drum Strength (MPa)Dry-Rodded Unit Weight (kg/m3)
Coarse Aggregates1.664.0219.23/87.4615.41104
Fine Aggregates1.066.413.43/54.33702
Table 3. Design of mixtures.
Unit: kg/m3
Content (%)CementMineral Admixtures *WaterLightweight Aggregate
Coarse AggregatesFine Aggregates
0540216586249
1048654216586249
30378162216586249
Table 4. The compressive strength and slumps of Mineral Lightweight Aggregate Concrete (MLAC).
Age (Days)MA0FA * (%)BFS * (%)DLS * (%)GLP * (%)
1030103010301030
732.5 29.0 26.3 32.5 31.1 32.6 23.4 34.5 28.5
2837.2 31.3 30.1 36.2 32.6 38.3 26.9 39.5 31.6
9138.2 34.8 38.6 38.0 35.4 39.4 30.7 42.4 35.3
12038.3 35.0 40.2 38.3 37.4 39.9 33.0 43.4 36.5
Slump (mm)95100110857580708575
Unit: MPa; Note: W/b = 0.40; * Mineral Admixtures are FA, BFS, DLS, and GLP.
Table 5. Pozzolan reaction analysis of MLAC in all ages.
SampleCement(%) (1)Compressive Strength (MPa) (2)Strength/Cement Ratio (3)Pozzolan Reaction (4)Coefficient of Strength/Cement Ratio (5)Offer of Pozzolan (6)Indicator of Pozzolan Activity (7)
7 dayMA010032.480.325 01 0
FA109028.960.322 −0.003 0.990 −1.0 −0.10
FA307026.260.375 0.050 1.154 13.4 0.45
BFS109032.510.361 0.036 1.111 10.0 1.00
BFS307031.110.444 0.119 1.367 26.9 0.90
DLS109032.590.362 0.037 1.114 10.2 1.02
DLS307023.430.335 0.010 1.030 2.9 0.10
GLP109034.530.384 0.059 1.181 15.3 1.53
GLP307028.530.408 0.083 1.254 20.3 0.68
28 dayMA010037.210.372 010
FA109031.310.348 0.023 1.070 6.6 0.66
FA307030.050.429 0.104 1.321 24.3 0.81
BFS109036.20.402 0.077 1.238 19.2 1.92
BFS307032.630.466 0.141 1.434 30.3 1.01
DLS109038.290.425 0.100 1.309 23.6 2.36
DLS307026.870.384 0.059 1.181 15.3 0.51
GLP109039.540.439 0.114 1.352 26.0 2.60
GLP307031.560.451 0.126 1.387 27.9 0.93
Note (2)/(1)(3)-0.325(3)/0.325(4)/(3)(6)/[100-(1)]
(3)-0.372(3)/0.372
SampleCement(%) (1)Compressive Strength (MPa) (2)Strength/Cement Ratio (3)Pozzolan Reaction (4)Coefficient of Strength/Cement Ratio (5)Offer of Pozzolan (6)Indicator of Pozzolan Activity (7)
91 dayMA010038.190.382 010
FA109034.840.387 0.005 1.013 1.3 0.13
FA307038.590.551 0.169 1.443 30.7 1.02
BFS1090380.422 0.040 1.105 9.5 0.95
BFS307035.350.505 0.123 1.322 24.4 0.81
DLS109039.380.438 0.056 1.145 12.7 1.27
DLS307030.740.439 0.057 1.150 13.0 0.43
GLP109042.410.471 0.089 1.234 18.9 1.89
GLP307035.340.505 0.123 1.322 24.3 0.81
120 dayMA010038.280.383 010
FA109034.960.388 0.005 1.014 1.4 0.14
FA307040.190.574 0.191 1.499 33.3 1.11
BFS109038.340.426 0.043 1.112 10.1 1.01
BFS307037.350.534 0.151 1.393 28.2 0.94
DLS109039.890.443 0.060 1.157 13.6 1.36
DLS307033.040.472 0.089 1.232 18.9 0.63
GLP109043.430.483 0.100 1.260 20.6 2.06
GLP307036.490.521 0.138 1.361 26.5 0.88
Note (2)/(1)(3)-0.382(3)/0.382(4)/(3)(6)/[100-(1)]
(3)-0.383(3)/0.383
Table 6. Thermal conductivity of MLAC.
SampleMA0FA (%)BFS (%)DLS (%)GLP (%)
1030103010301030
TC (kcal/m.h. °C)0.4840.4220.3850.4820.4240.3970.4130.3960.398
Unit Weight (kg/m3)140613751315139613501287130813971313
Absorption (%)4.415.617.854.625.616.138.936.077.22
Table 7. The strength application efficiency of MLAC.
NO.Cement (kg/m3)Mineral Admixtures (kg/m3)CSE (MPa/kg) (1) *Application Efficiency (%) (2) *
7 day28 day91 day120 day
MA054000.0600.0690.0710.071
FA10486540.0600.0640.0720.072−8.77
FA303781620.0690.0790.1020.106+1.05
BFS10486540.0670.0740.0780.079−0.50
BFS303781620.0820.0860.0940.099−7.44
DLS10486540.0670.0790.0810.082+3.12
DLS303781620.0620.0710.0810.087−19.51
GLP10486540.0710.0810.0870.089+11.05
GLP303781620.0750.0830.0930.097−7.46
1 * CSE = Compressive Strength (MPa) on 7 day, 28 day, 91 day and 120 day/Cement (kg/m3). 2 * Application Efficiency = [(Compressive Strength of Mineral Admixtures—Compressive Strength of MA0)/(Compressive Strength of MA0)] × 100%; 3 W/B = 0.40.
Table 8. Economic efficiency of MLAC.
No.Cement (kg/m3)Mineral Admixtures (kg/m3)Price of Cementitious Materials (NTD/m3) (1)Economy (NTD) (2)Economy Ratio (%) (3)
CementMineral Admixtures
MA0540013500
FA1048654121548.686.46.4
FA30378162945145.8259.219.2
BFS1048654121578.356.74.2
BFS30378162945234.9170.112.6
DLS104865412152.161339.8
DLS303781629456.48398.529.5
GLP1048654121521.6113.48.4
GLP3037816294564.8340.225.2
1 The prices of cementitious materials (NTD/m3) are counted according to the unit price which provided by suppliers; NTD: New Taiwan Dollar. 2 Economy = 1350-(1); 3 Economy Ratio (%) = Economy/1350.
Table 9. The benefit of MLAC to the reduction of CO2 emission.
W/CW/BThe Ratio of Mineral Admixtures Content (%)Cement Content (kg/m3)Mineral Admixtures Content (kg/m3)Reduced CO2 Emission (ton/m3)Reduced Ratio of CO2 (%/per m3 con.)
0.400.4005400
0.440.4010486540.045911.1
0.570.40303781620.137742.9
Publisher’s Note: MDPI stays neutral with regard to jurisdictional claims in published maps and institutional affiliations.