Article

The Onset Threshold of Cybersickness in Constant and Accelerating Optical Flow

Department of Industrial and Information Systems Engineering, Soongsil University, Seoul 06978, Korea
*
Author to whom correspondence should be addressed.
Appl. Sci. 2020, 10(21), 7808; https://doi.org/10.3390/app10217808
Submission received: 13 October 2020 / Revised: 27 October 2020 / Accepted: 30 October 2020 / Published: 4 November 2020
(This article belongs to the Special Issue User Experience for Advanced Human–Computer Interaction)

Abstract

:
This study investigated the principal translational or rotational axis that evokes the most severe cybersickness by detecting constant velocity and acceleration thresholds on the onset of cybersickness. This human subject experiment with 16 participants used a 3D particle field with movement directions (lateral, vertical, yaw, or pitch) and motion profiles (constant velocity or constant acceleration). The results showed that the threshold of pitch optical flow was suggestively lower than that of the yaw, and the vertical threshold was significantly lower than the lateral. Still, there was no effect of scene movement on the level of cybersickness. In four trials, the threshold increased from the first to the second trial, but the rest remained the same as the second one. However, the level of cybersickness increased significantly between the trials on the same day. The disorientation-related symptoms occurred on the first trial day diminished before the second trial day, but the oculomotor-related symptoms accumulated over the days. Although there were no correlations between the threshold and total cybersickness severity, participants with a lower threshold experienced severe nausea. The experimental findings can be applied in designing motion profiles to reduce cybersickness by controlling the optical flow in virtual reality.

1. Introduction

Among the various fields adopting virtual reality (VR), education, training, and entertainment found its usefulness and actively embraced them. However, in a virtual environment (VE), cybersickness (CS) often causes nausea, dizziness, and discomfort. It is a serious problem that hinders the acceptance of VR because those who experience CS are reluctant to use the VE again; thus, the effectiveness of VR may get discarded. Since the exposure to moving visual scene caused CS such as nausea [1,2,3], discovering the impact of various optical flow on CS is vital for developing countermeasures for CS [4].
Understanding the characteristics of optical flow can help to modify the dynamic field-of-view (FOV) [5], navigation speed [6,7,8], or VR locomotion techniques [9]. Previous studies suggested high velocity [10] and acceleration [11] of optical flow induce CS. Along with that, the rotational [12] and translational [13] motions in VR also increased the CS symptoms. However, no consensus has been yet reached regarding the relative importance of rotational (roll, pitch, or yaw) and translational (surge, lateral, or vertical) movements. Previous studies tried to find a dominant direction but failed to show a significant difference between those axes [12,14,15,16,17]. Since they measured the severity level of CS, there are chances that the symptom started in a different order, but the severity of symptoms was not different because the exposure time is either too long or too short.
In this sense, this study tried to measure the threshold instead of severity to capture which motion activates CS for the first time. Terenzi and Zaal (2020) found that rotation (roll and yaw) thresholds are lower than that of translation (forward and lateral) [18]. However, it is not decisive since they did not include vertical and pitch movements in the experiment. They expected that the vertical and pitch would follow a similar trend to the lateral and yaw movement, which is a fair assumption for the object moving on a surface, such as a ground vehicle. Nevertheless, we expected that the lateral and yaw threshold would differ from the vertical and pitch threshold for a flying object such as a quadcopter drone. Based on the rest frame theory [19], the more inconsistency between the perceived ‘vertical reference’ from VR and sensed one from actual gravity cause severe CS [14]. Thus the upward vertical flow may distort the feeling of gravity more than the lateral flow, which leads to an earlier onset of CS. The subjective vertical theory [20,21] explains that sensory conflict is related to the discrepancy between the sensed vertical from sensory systems and the subjective vertical expected from the past. The visual yaw rotation does not directly confound the perception of verticality [22], unlike pitch rotation. Therefore, we further examined the study for comparing lateral, vertical, yaw, and pitch movement as a continuing study of Terenzi and Zaal (2020).
This paper aims to find dominant movements causing the onset of CS by threshold detection. A human subject study investigated the difference in thresholds among rotational and translational optical flow moving in a constant velocity and with accelerations. The CS severity is also measured per each condition to detect a difference and compare it with the previous work. We used the same optical flow model developed by Terenzi and Zaal (2020) [18] to ensure a fair comparison. This paper’s organization is as follows: Section 2 presents the background of CS and related works about CS induced by scene movement along different axes. Section 3 details the method for the human subject experiment, followed by the experimental results about the detected threshold and severity level presented in Section 4. In Section 5, these results are further discussed. Finally, we conclude by summarizing the highlights of this study in Section 6.

2. Background and Related Work

The motion sickness (MS) is elicited by motion, such as abrupt, periodic, or unnatural accelerations [23], whereas CS may occur without any physical movement, so it is also called as visually induced MS [2]. The representative symptoms are similar for both cases, such as nausea, pale skin, cold sweats, vomiting, dizziness, headache, increased salivation, fatigue, eyestrain, and difficulty focusing [14]. For the measurement of MS-related symptoms, the Simulator Sickness Questionnaire (SSQ) [24] has been widely used, which inquires 16 sub-symptoms, including nausea, eyestrain, dizziness, etc. on a scale of 0 (none) to 3 (severe) [14]. The sub-symptoms are categorized into three representative MS-related symptoms for nausea, oculomotor, and disorientation.

2.1. Origin of Nauseogenic Stimuli

The features of nauseogenic stimuli related to MS or CS are described as followed [25]. Each human sensory system has a sensory-specific sensitivity optimized to perceive various aspects of motion stimuli [26,27]. The visual system cannot distinguish between the effect of self-motion and the actual motion, while the semicircular canals of the vestibular system can detect when the angular velocity changes (at least 0.1 deg/s2). If the constant velocity rotation lasts, it fails to detect the self-motion in 20 s [28]. The otolith organ detects a linear acceleration but cannot distinguish between gravity and inertia [29]. All sensory signals are merged in the brainstem and cerebellum. The weights are assigned according to each stimulus’s reliability to estimate natural self-propelled motion [25,30,31]. For example, the artificial movement generated from a motion platform, that is inconsistent with visual cues and expected vehicle movement, leads to a combination of sensory signals that our brain judges as impossible. This information mismatch is called sensory conflict [32].
People without labyrinthine vestibular function do not experience MS [33], indicating that the vestibular system always contributes to nausea. However, CS can occur only with illusory visual motion without labyrinth activity [34]. The vestibular system regularly reports almost no inertial cues when the participant is wearing a VR device in a stationary motion. The optical flow from VE, however, deceives the brain that there is physical motion [26]. This inconsistency between vestibular and visual signals leads to the sensory signal’s awkward configuration, called sensory conflict, which causes MS [35]. This paper focuses on the sensitivity of the visual system among the sensory-specific sensitivity mentioned above. We hypothesize that the threshold for the onset of sensory conflict would differ among the optical flow of the six degrees of freedom, and examine empirical evidence.

2.2. Cybersickness Induced by Scene Movements along Different Axes

Previous studies tried to find the most influencing rotational or translational movement causing CS-related symptoms, but most failed to find a significant difference in the severity of symptoms.
Rebenitsch and Owen (2016) summarized the characteristics of CS caused by each rotational axis [14]. Whereas pitch motion generates visual inputs similar to seasickness, roll motion is relatively uncommon in daily life and work. Humans may not fully develop the sensory system for managing roll motion, and thus may feel less severe motion sickness for roll axis than others. Yaw is the most natural rotation for a human turn, so that it may be most susceptible to visual-vestibular cue mismatch. Bonato et al. (2009) reported that there was no difference in the severity of CS between the pitch and roll (p = 0.69) in the VE [17]. Joseph and Griffin (2008) investigated the effect of the sinusoidal roll and pitch oscillation on the level of CS, but found no difference between the roll and pitch [15]. They discovered that roll and pitch increase CS proportional to the motion magnitude. Lo and So (2001) also reported that the oscillation in the VE significantly increased CS in roll, pitch, and yaw without significant differences among them [12]. Tiande and Jingshen (1991) reported that the pitch axis motion causes visually induced MS most seriously, followed by the roll and yaw motion [36]. Chen (2006) investigated the effect of translational motion on CS and found that navigation on all three axes increased the level of CS (p < 0.01) [13]. The CS level was lower in the surge condition (p < 0.05) than the lateral and vertical conditions. However, their following work failed to show the dominant axis inducing visually induced MS [16].
The result of previous studies made no consensus yet. They attempted to find differences in the severity level of CS measured by SSQ or similar ratings. However, there were chances that CS occurs in a different order, but the severity of symptoms was not different because the exposure time was too long or short. In this paper, we aim to find whether there is a dominant rotational or translational axis that causes the onset of CS in terms of threshold detection.

3. Method

3.1. Participants

The Institutional Review Board approved the experiment with human participants. A total of 16 university students (5 males and 11 females, Mean age = 23.13, SD = 1.41 yrs) participated. Only one participant had no VR experience; the other fifteen had some experiences (1–10 h). Participants provided signed informed consent and received instructions for the experiment, which includes that VR exposure may cause sickness symptoms, and they can quit the experiment at any time for any reason. Participants who volunteered for the experiment were randomly allocated to the predetermined time slots for a two-day session. No participants had color blindness or other serious visual disability. Those who wear prescribed glasses or contact lenses can participate in the experiment, as long as they can don a head mount display. Volunteers who had suffered from neuro-ophthalmology disorders or vestibular dysfunction cannot participate in the experiment. Moreover, those who experienced seizures or severe dizziness caused by MS were excluded.

3.2. Optical Flow Model

Optical flow is an apparent movement of the brightness pattern in the image [37]. To make participants experience the same amount of optical flow, Terenzi and Zaal (2020) derived a quantifying model for optical flow [18]. They set a virtual visual field, with bright particles moves in a dark background. The model assumed that the FOV is shaped in a cone emanating from the observer. We additionally formulated vertical translation and pitch rotation based on their model.
The optical flow model is formulated as follows:
O F = x = 0 , y = 0 N x , N y I ( x , y ) × v ( x , y ) = i = 0 N s p i × v s i = s r α p i = 0 N v s i d i ,  
where OF stands for optical flow in pixel/s, I(x,y) is the normalized brightness from 0 (black) to 1 (white) and v(x,y) is screen velocity, spi is a physical diameter of the particles in unit of pixels and vsi is ith particle velocity on the screen in pixels/s. The particle size in pixels spi is related to the angular size of a pixel. Therefore, the equation spi = rαp sα further refined the rightmost term in Equation (1), where rαp is the angular size of a pixels/rad of FOV, s stands for the size of particle in physical units, di is the distance from the observer to ith particle in 3D space.
First, the expression for the surge translation scene was derived as follows:
O F ¯ z = 2 π ρ z r α 2 s V z h 0 h 0 z tan α r 2 ( r 2 + z 2 ) 3 2 d r d z = 2 π ρ z r α 2 s V z I z ,
where ρ is particle density in 1/m3, V is the uniform absolute velocity of the scene in m/s, h is the length of the particle field, r is the radial distance from the observer, Iz stands for the numerical value of integral. The equation can be expressed into the mean as an integral over the conic volume r = z tan α, where α is half of the FOV, z is the height (h) of the cone. It is assumed that the particles are uniformly distributed in the field. The average OF for the lateral (x) and vertical (y) translation are derived from Equation (2):
O F ¯ x = 2 π ρ x r α 2 s V x ( h 0 h z ( 0 z tan α r ( r 2 + z 2 ) 3 2 d r ) d z ) = 2 π ρ x r α 2 s V x I x
O F ¯ y = 2 π ρ y r α 2 s V y ( h 0 h z ( 0 z tan α r ( r 2 + z 2 ) 3 2 d r ) d z ) = 2 π ρ y r α 2 s V y I y ,  
where Vx and Vy are lateral and vertical velocity in m/s, respectively.
For the rotational motion, the average optical flow for the roll, yaw, and pitch are as follows:
O F ¯ r o l l = 2 π ρ r o l l r α 2 s ω r o l l h 0 h 0 z tan α r 2 r 2 + z 2 d r d z = 2 π ρ r o l l r α 2 s ω r o l l I r o l l
O F ¯ y a w = 2 π ρ y a w r α 2 s ω y a w ( h 0 h z ( 0 z tan α r r 2 + z 2 d r ) d z ) = 2 π ρ y a w r α 2 s ω y a w I y a w
O F ¯ p i t c h = 2 π ρ p i t c h r α 2 s ω p i t c h ( h 0 h z ( 0 z tan α r r 2 + z 2 d r ) d z ) = 2 π ρ p i t c h r α 2 s ω p i t c h I p i t c h ,
where ωroll, ωyaw, and ωpitch stands for the roll, yaw, and pitch angular velocity of the scene in rad/s.
The initial velocity of each scene was set by 0.1, and then updated for each run by multiplying k obtained through the staircase procedure. For instance, in the vertical case, Vy = kyVy0, where the multiplier ky changes every run by the staircase procedure, and it will stand for the detected threshold at the last run of the scene. The staircase procedure is further described in Section 3.2.
Across different visual scenes, ‖OFx−0‖ = ‖OFy−0‖ = ‖OFz−0‖ = ‖OFroll−0‖ = ‖OFpitch−0‖ = ‖OFyaw−0‖ has been enforced to guarantee the same quantity of initial optical flow, which implies ‖ρxIx‖ = ‖ρyIy‖ = ‖ρzIz‖ = ‖ρrollIroll‖ = ‖ρptichIpitch‖ = ‖ρyawIyaw‖. Since the particle densities ρ are set to 10,000 for every optical flow type, the amounts of optical flow for other scenes were scaled regarding the forward translational case (Iz). The scale factors Iz/Ii matched scene density, where Ii is the numerical value of each scene’s viewing volume. Since the study used VIVE Pro Eye with a FOV of 110 deg, half of FOV α was 0.96 rad (55 deg). The scale factors for each optical flow are in Table 1.

3.3. Staircase Procedure

The staircase procedure [38,39] is used for finding the velocity and acceleration thresholds for each optical flow. In the first run, the optical flow moved with velocity (m/s) or acceleration (m/s2) of 0.1. If the participants reported uneasiness, the magnitude of the next run’s velocity or acceleration was reduced by the step size, otherwise increased. The step size was updated by half when the participant reversed the response. For example, the participants responded with no uneasiness over the past runs, but responded with uneasiness in this run; the step size reduced into half. The procedure terminated when the step size reached one-sixteenth of the initial value. Moreover, participants could stop the session when they did not feel any uneasiness, even after 15 steps.

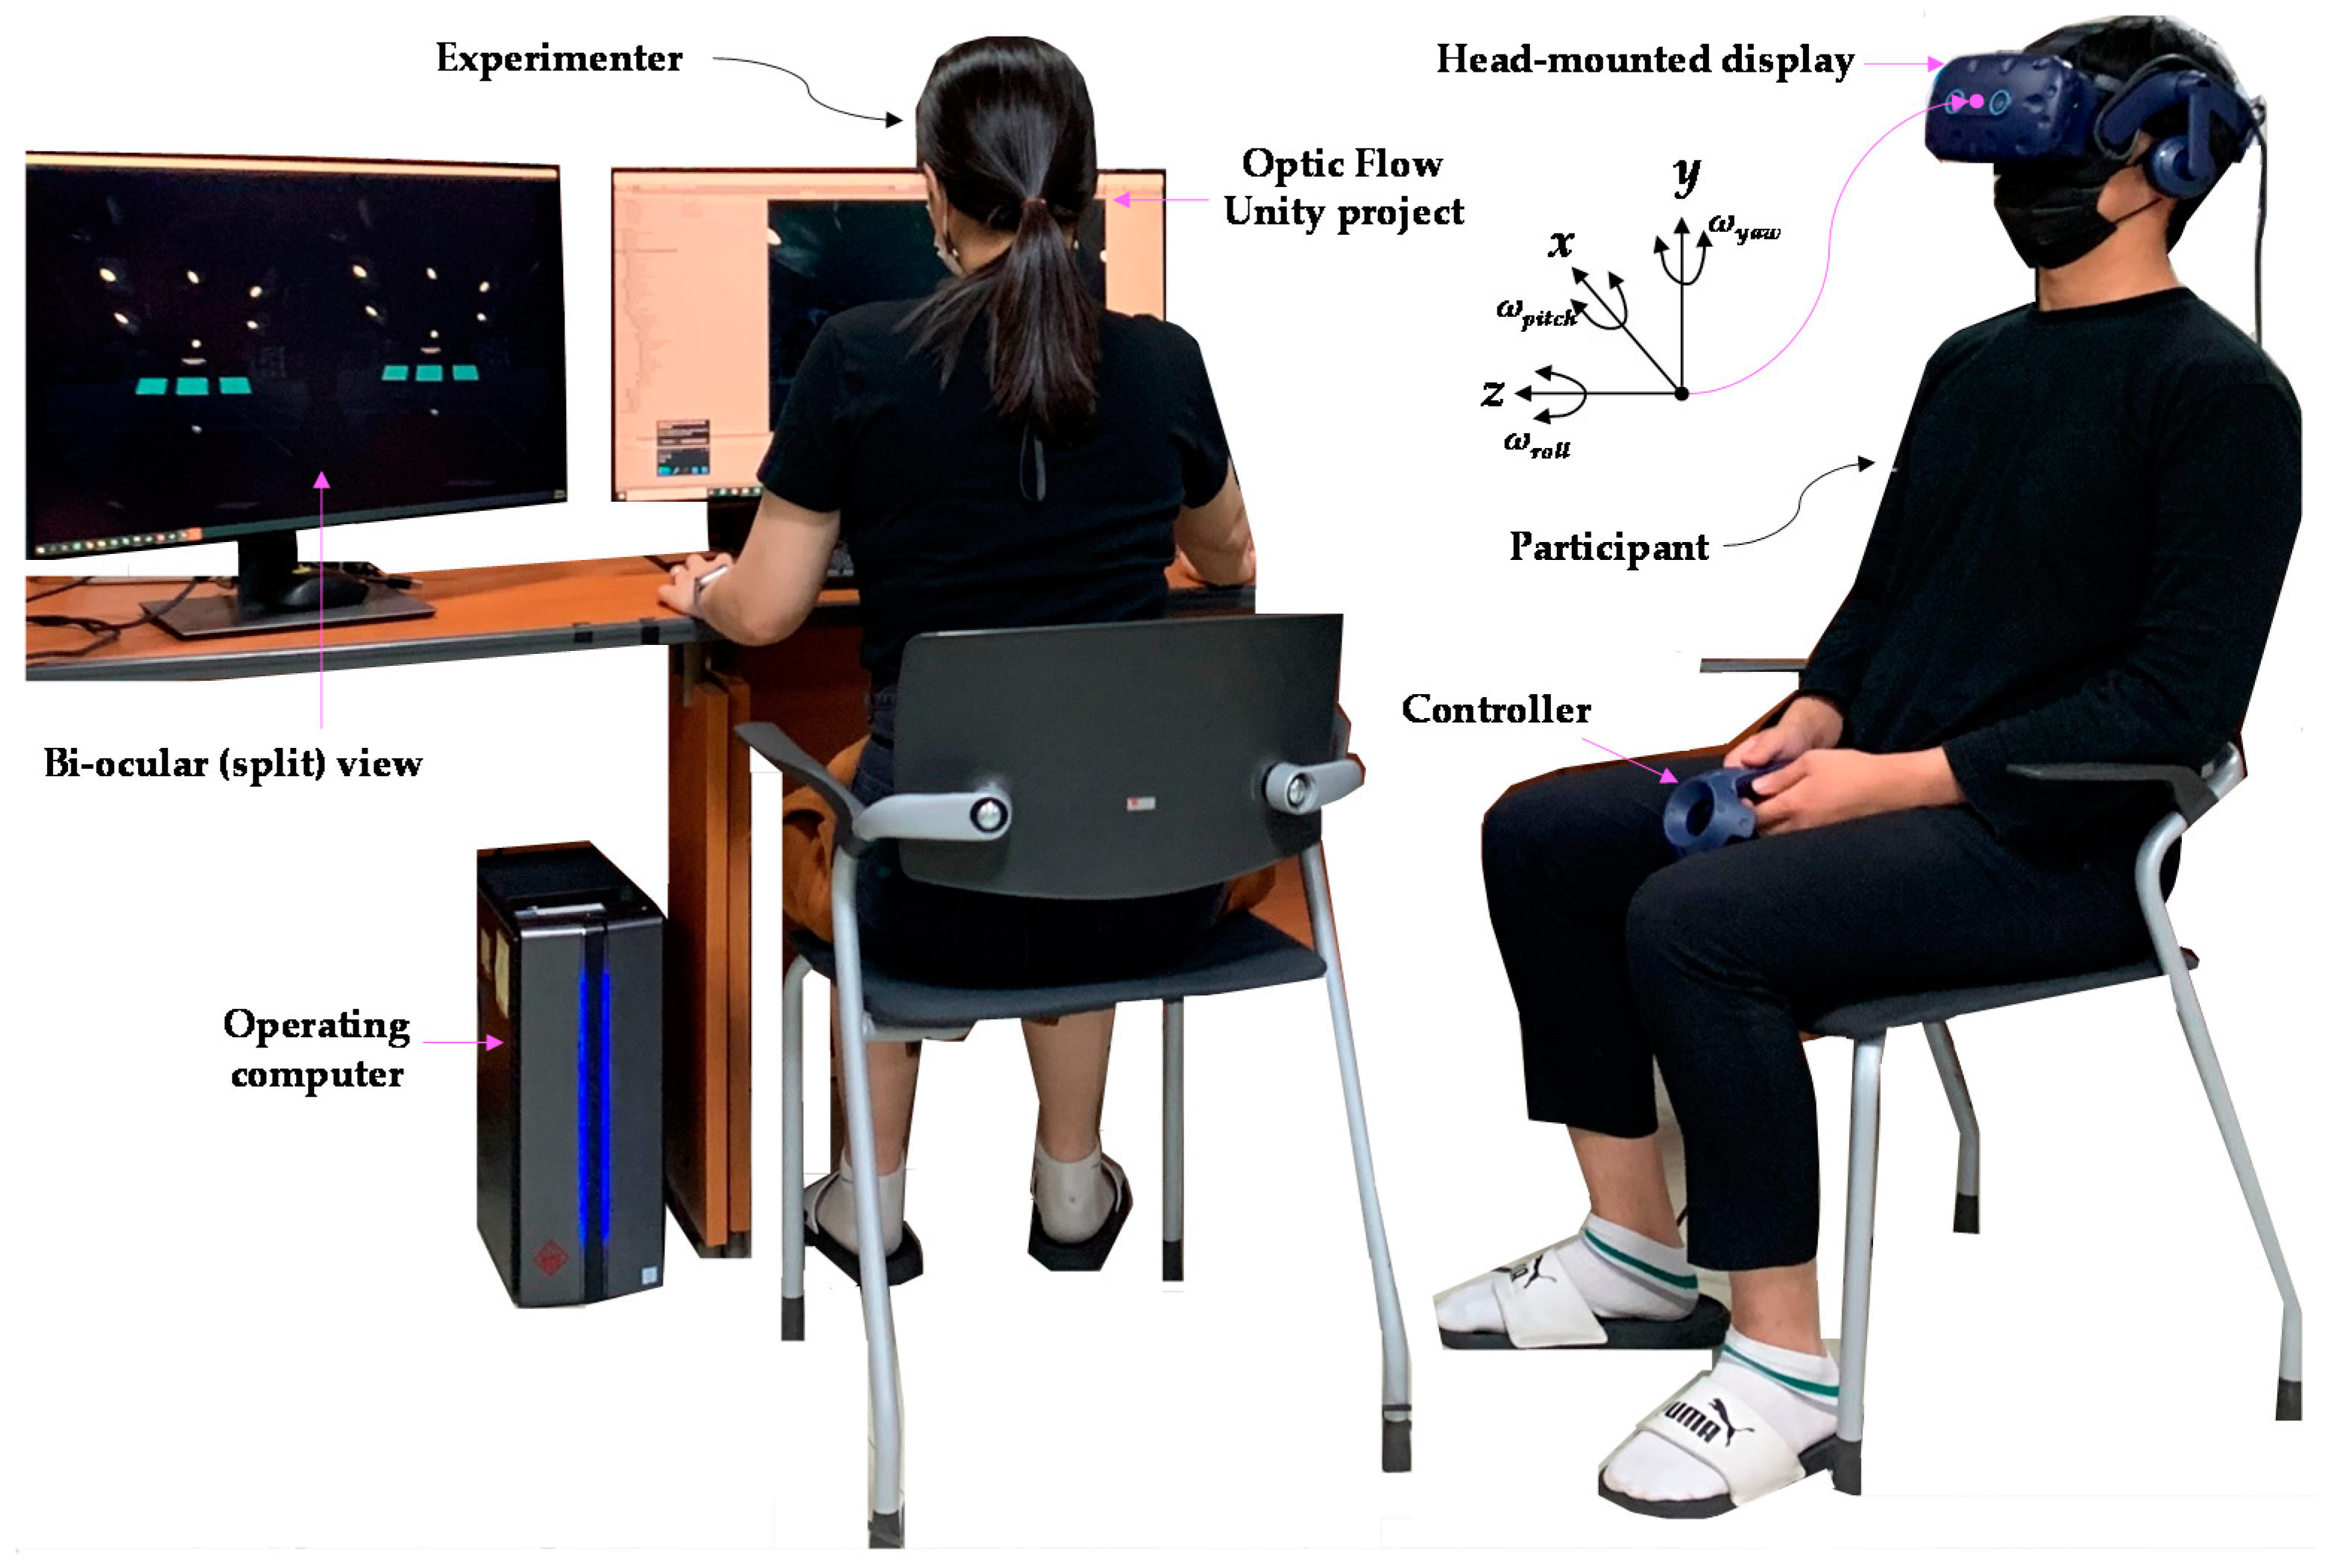
3.4. Virtual Environment and Apparatus

We modified the VE initially developed by [18] to add vertical and pitch optical flows while keeping the physical property. The optical flow scene consists of a 3D particle field that translates laterally or vertically, or rotates around the yaw or pitch axes. The particle field moves either at a constant velocity or with acceleration. We followed the previous study results that showed 5 and 3 s were sufficient to evoke symptoms for constant velocity and acceleration, respectively [18]. The particles have filled the FOV up to 2 m from the front of the observer. The rendering is designed to set over 60 Hz. The asking scene displayed the question, “Did you feel uneasy during the previous test run?”, and the participants can select their answer from yes, no, or quit using a bezier pointer by a controller. The VE is delivered through HTC VIVE Pro head-mounted display, with a resolution of 1440 × 1600 pixels per eye (2880 × 1600 pixels combined) and a FOV of 110 deg, as shown in Figure 1.

3.5. Experimental Conditions

Four movement direction (lateral, vertical, yaw, or pitch) and two motion profiles (constant velocity or constant acceleration) were independent variables. (see Table 2) Particles in lateral and yaw conditions move from left to right, and those in vertical and pith conditions move upward relative to the participant.
The design of the experiment is a 4 × 2 full factorial within-subject design. A balanced Latin-square scheme is used to balance out the order effects of the eight conditions. To investigate the adaptation effect by repetition, participants are exposed to all experimental conditions twice per two different days, which makes four observations in total. The interval between two experimental days was at least 24 h and up to 4 days. The detected velocity and acceleration thresholds for rotational and translational conditions are measured together with the severity of CS measured by SSQ.

3.6. Procedures

Before exposure to VR, they completed pre-exposure questionnaires, including a motion sickness susceptibility questionnaire (MSSQ) [40] and prior VR experience. Participants were informed that a red anchor dot-point would appear with a countdown of 3s before the particles appeared, and were required to fix their head and anchor their eyes to the point even after it disappeared [41]. After the exposure to optical flow, participants reported whether they felt an uneasiness as a form of vection, disorientation, general discomfort, and nausea. Participants rested for two minutes after reporting their conditions, then continued on the following condition. After finishing all sessions, they had 30 min of resting before starting the subsequent trial.

4. Results

Participants’ MS susceptibility measured by the MSSQ averaged 11.76 out of 54 (SD = 5.67), which is similar to what Golding [40] reported, an average of 12.9 (SD = 9.90). A two-sample t-test showed no significant difference between the two (t(21.196) = 0.737, p = 0.469).
Since the onset of CS symptoms is usually not salient, some participants missed detecting their thresholds for a few experimental conditions. The number of threshold detections per participant is in Table 3. Participant no. 6, 10, and 11 missed to detect on a single condition, and participant number 3 missed two. Participant no. 8 failed to detect LA and YA threshold for every trial and missed three for LS, one for VA.

4.1. Threshold

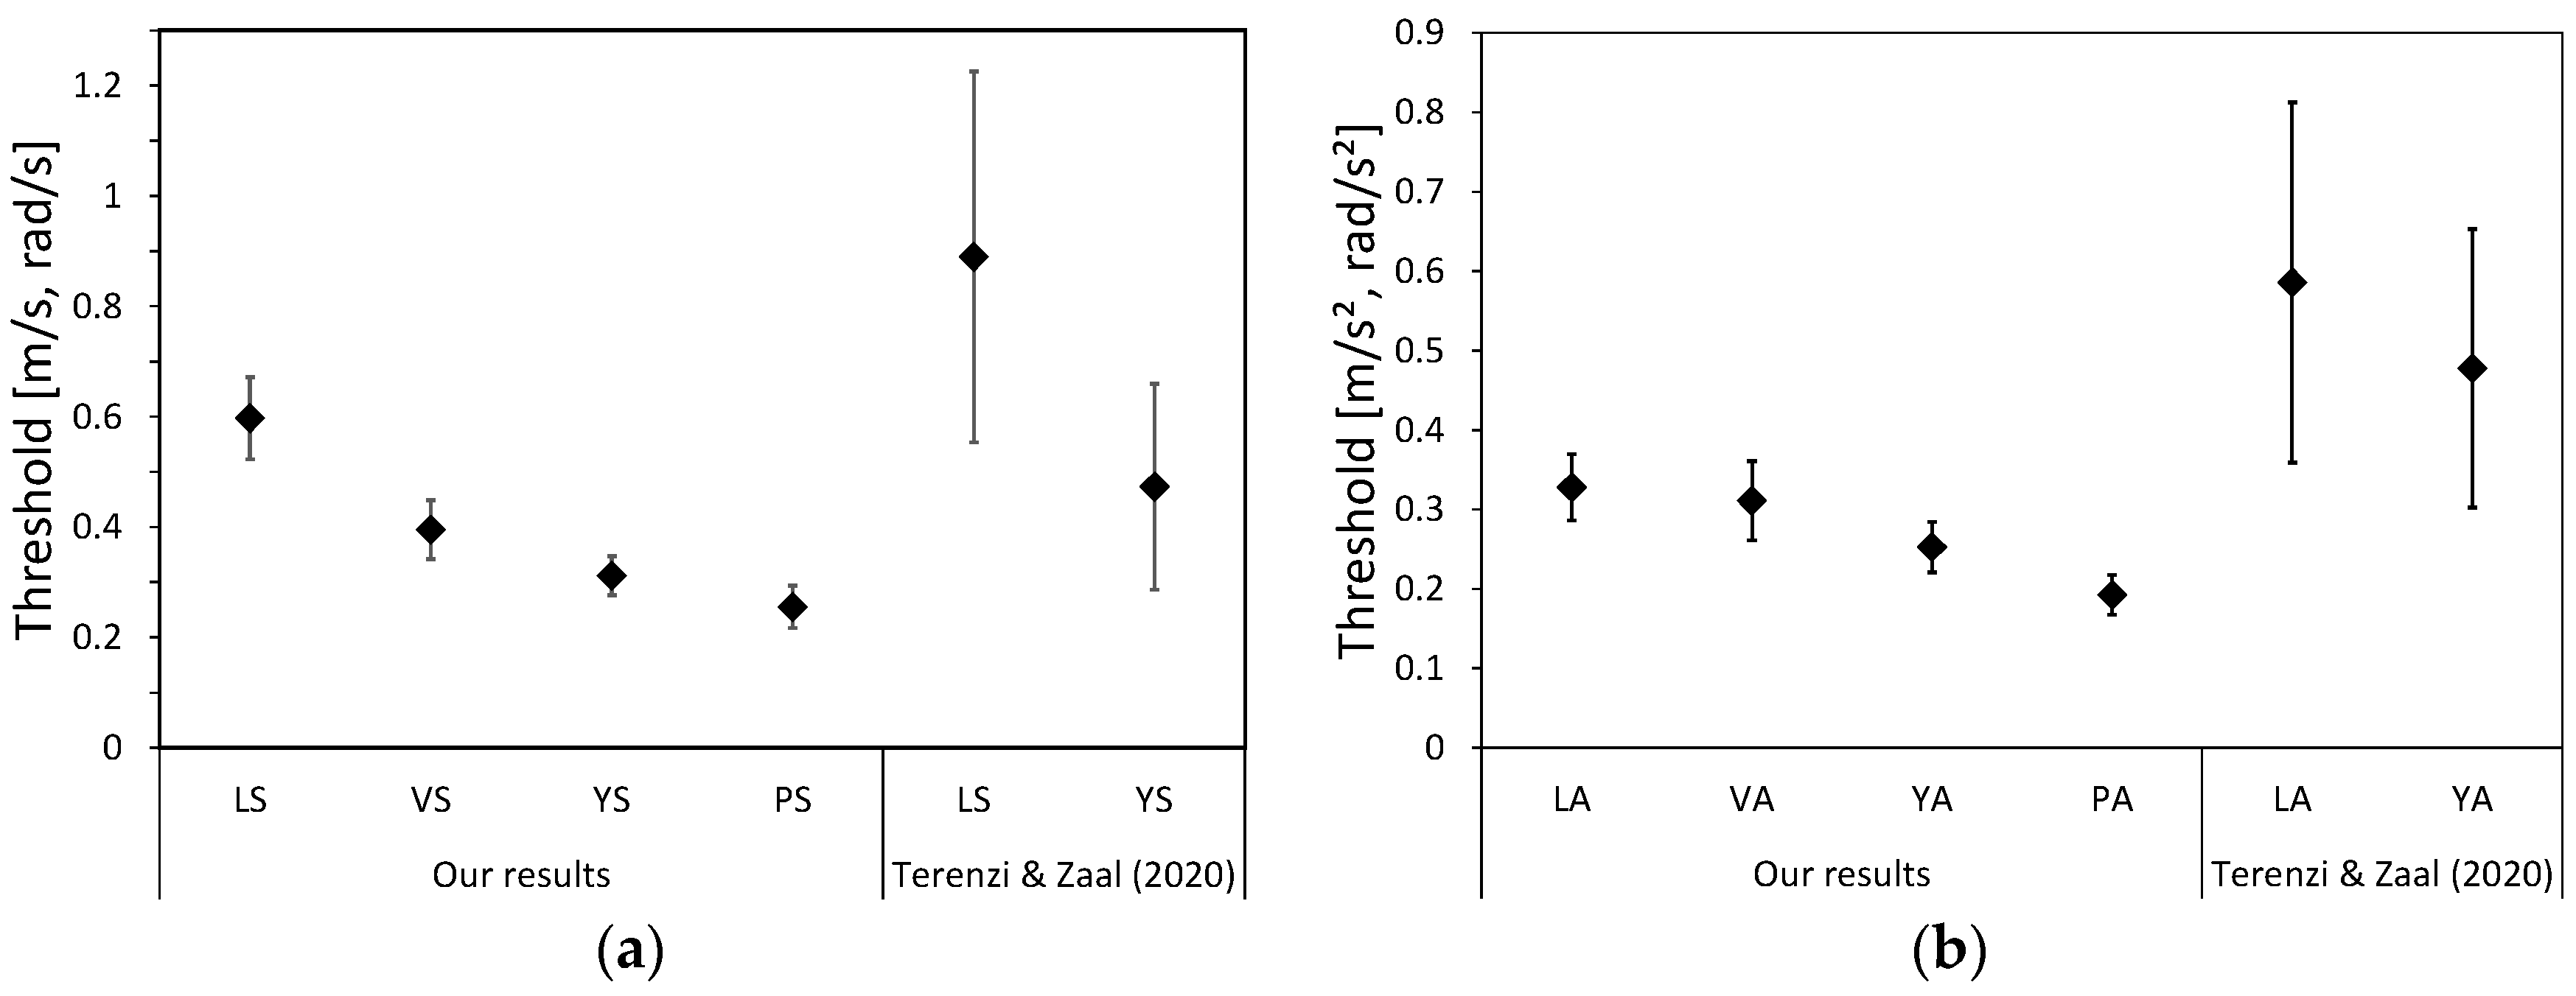
4.1.1. Detected Thresholds for Experimental Conditions

The constant velocity and acceleration threshold for lateral, vertical, yaw, and pitch scene movement are in Table 4. In the constant velocity conditions, the mean threshold of LS was highest, followed by VS, YS, and PS. For the acceleration conditions, the threshold of LA was highest, followed by VA, YA, and PA. The unit of steady (accelerating) condition for translation and rotation is m/s (m/s2) and rad/s (rad/s2), respectively.
To check the experimental results’ validity, we compared the result with the prior study [18] (see Figure 2). The comparison is only for the same conditions; LS, YS, LA, and YA. The result of Terenzi and Zaal (2020) is as follows: LS (Mean = 0.890, SD = 0.594), YS (Mean = 0.473, SD = 0.381), LA (Mean = 0.586, SD = 0.417), and YA (Mean = 0.478, SD = 0.334). An unequal variance two-sample t-test result showed no significant difference for LS (t(12.103) = 1.668, p = 0.121) and YS (t(16.089) = 1.661, p = 0.116). However, for the accelerating cases, LA (t(12.827) = 2.194, p = 0.049) and YA (t(13.863) = 2.480, p = 0.028) thresholds were significantly different, indicating that the thresholds of this study are a bit lower. Nevertheless, there are similar tendencies between ours and their results. First, the rotational and translational conditions’ trends were the same for both the steady and the accelerating cases as LS > YS and LA > YA. Second, the mean thresholds for accelerating conditions were lower than steady conditions. The transient dynamics of visual motion perception could explain this [18]. Third, the threshold of rotational conditions was lower than in translational conditions.

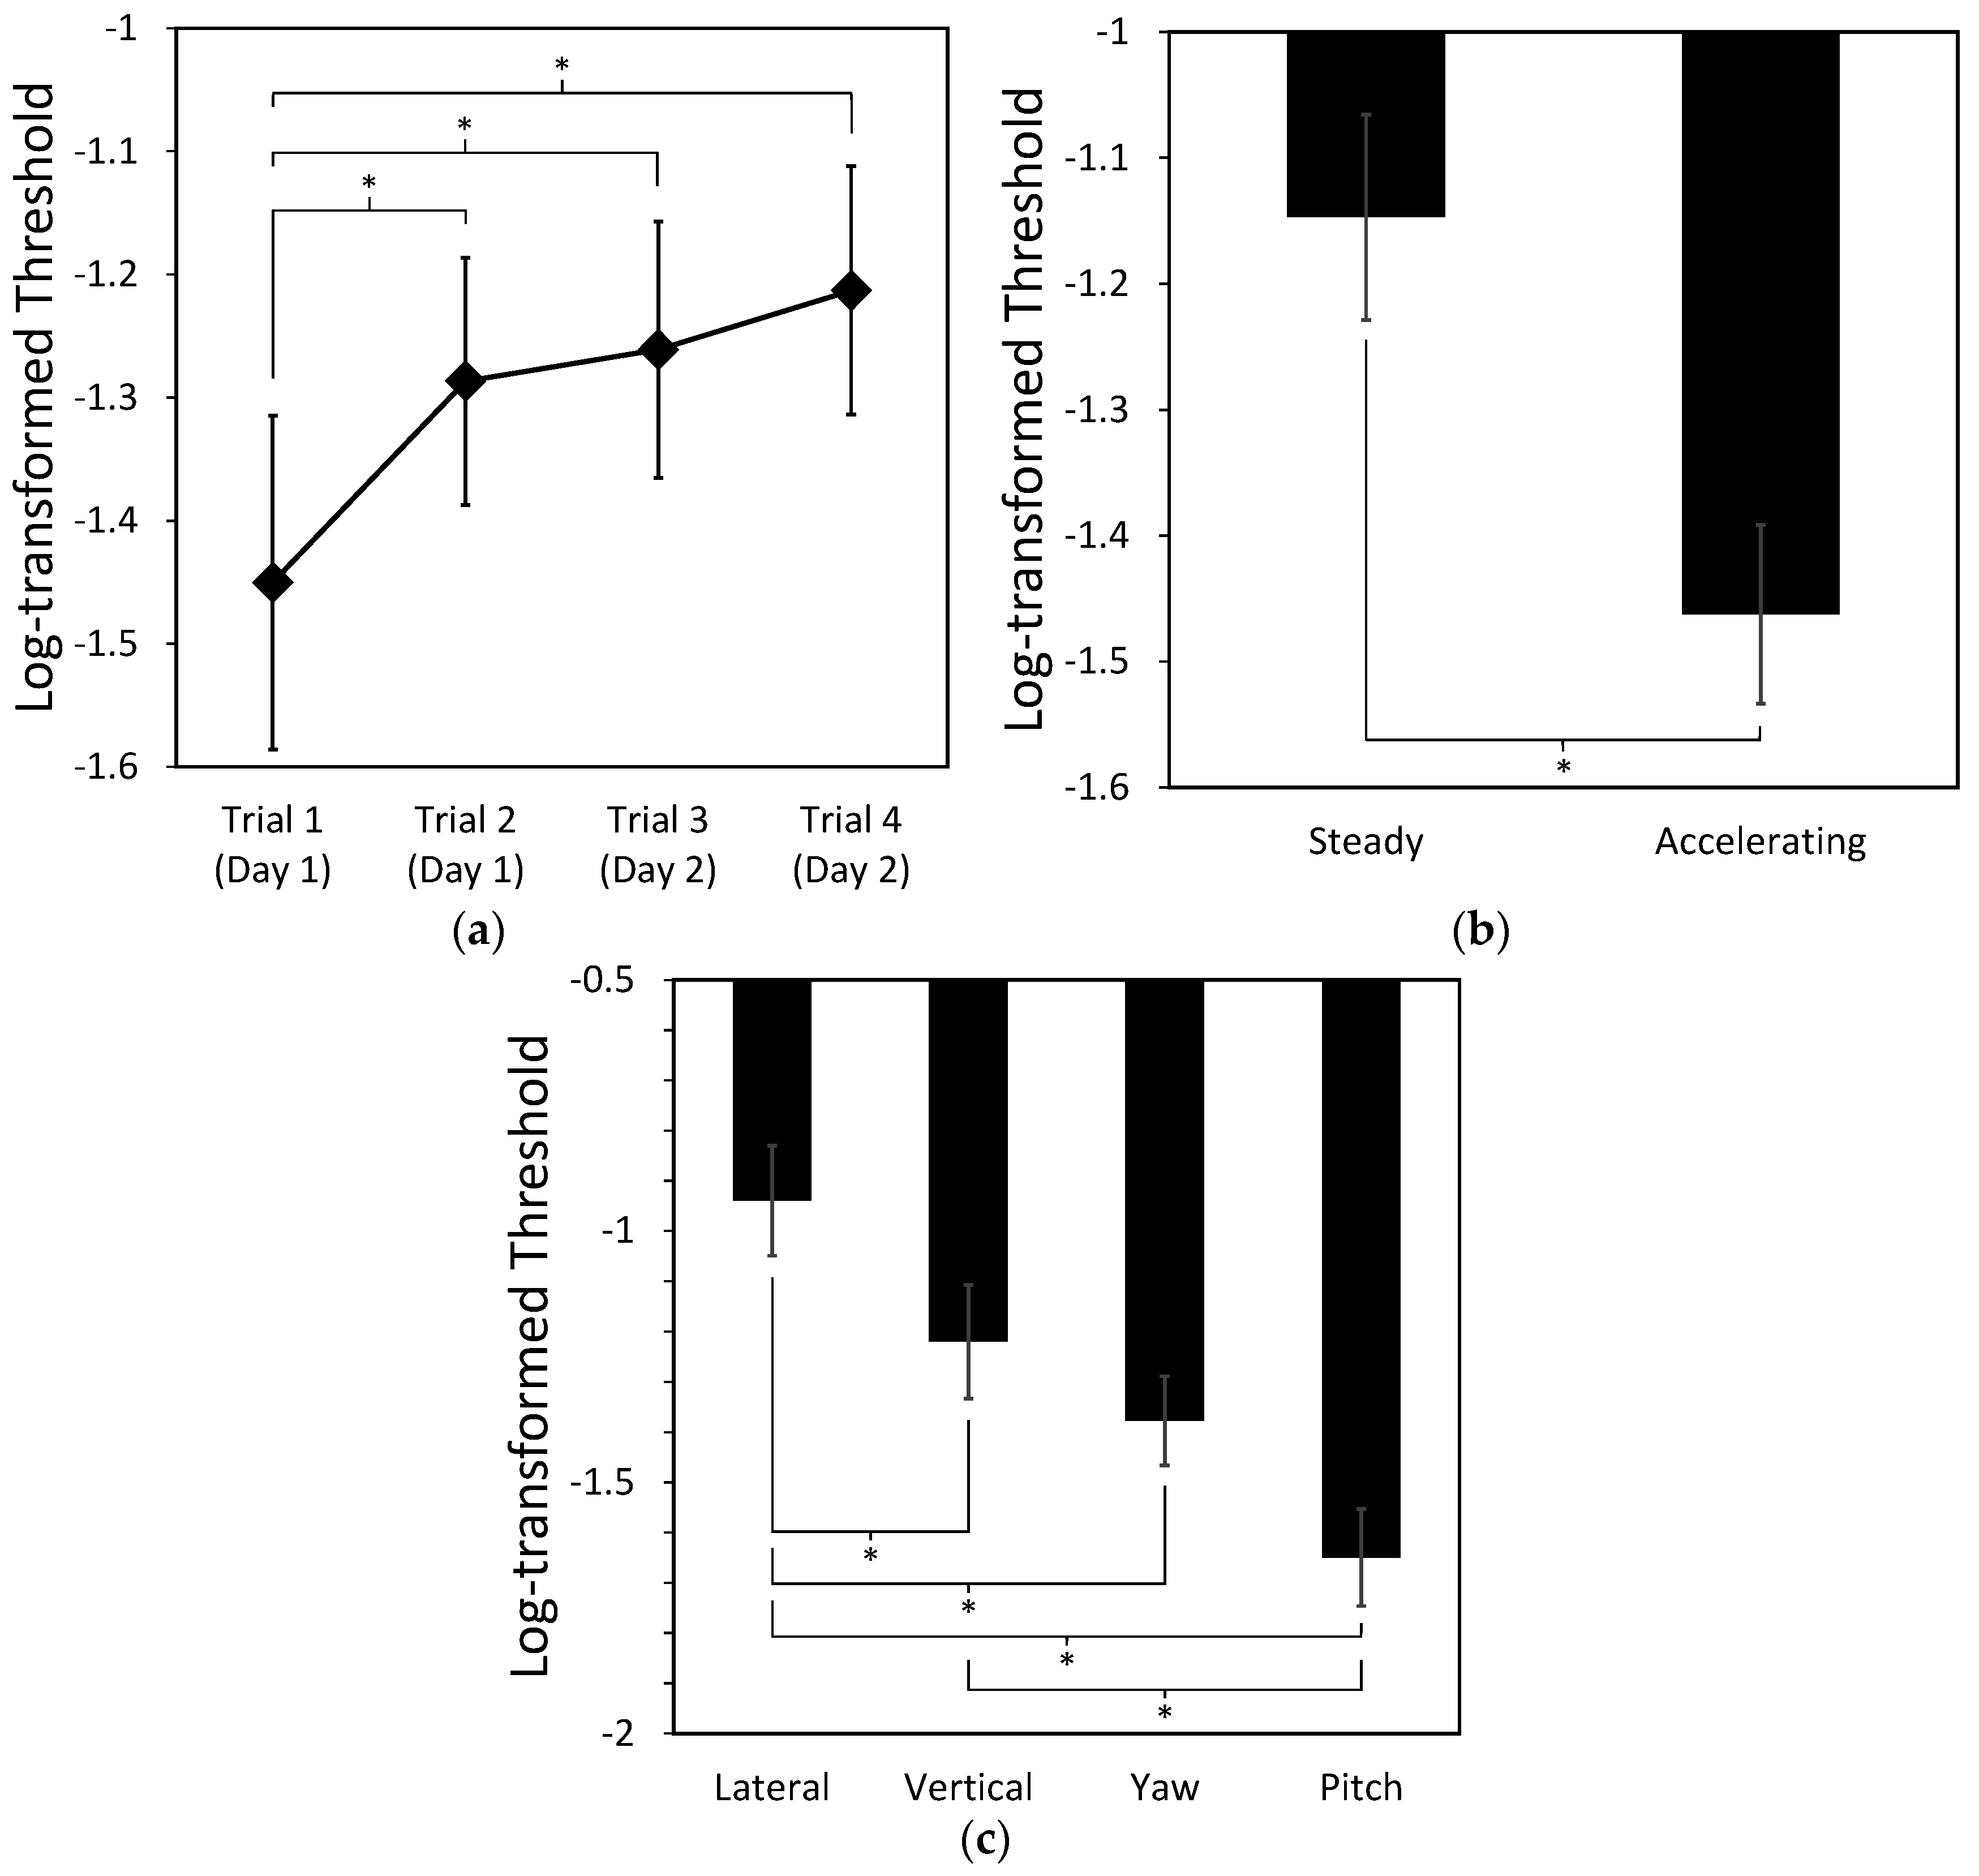
4.1.2. Effects of Repetition, Types of Motion, and Movement Direction on the Threshold

A repeated-measures ANOVA with a Greenhouse–Geisser correction confirmed that thresholds are significantly different between the trials, F(2.406, 267.059) = 7.771, p < 0.001. Post hoc tests with Bonferroni correction revealed that the threshold of the first trial was significantly lower than those of 2nd (p = 0.023), 3rd (p = 0.009), and 4th (p = 0.001) trials. It indicates that participants were most susceptive to the experimental condition in their first attempt (See Figure 3a).
An ANOVA also showed a main effect of motion, F(1, 111) = 17.009, p < 0.001. It implies that the threshold of constant acceleration is significantly lower than that of constant velocity (See Figure 3b). Moreover, there was a main effect of movement direction, F(3, 111) = 13.204, p < 0.001. Post hoc analysis with the Tukey HSD showed that the threshold of lateral optical flow was significantly higher than vertical (p = 0.032), yaw (p = 0.001), and pitch (p < 0.001). The threshold of vertical optical flow was significantly higher than the pitch (p = 0.005). However, the yaw flow was only suggestively higher than the pitch (p = 0.098) (see Figure 3c).

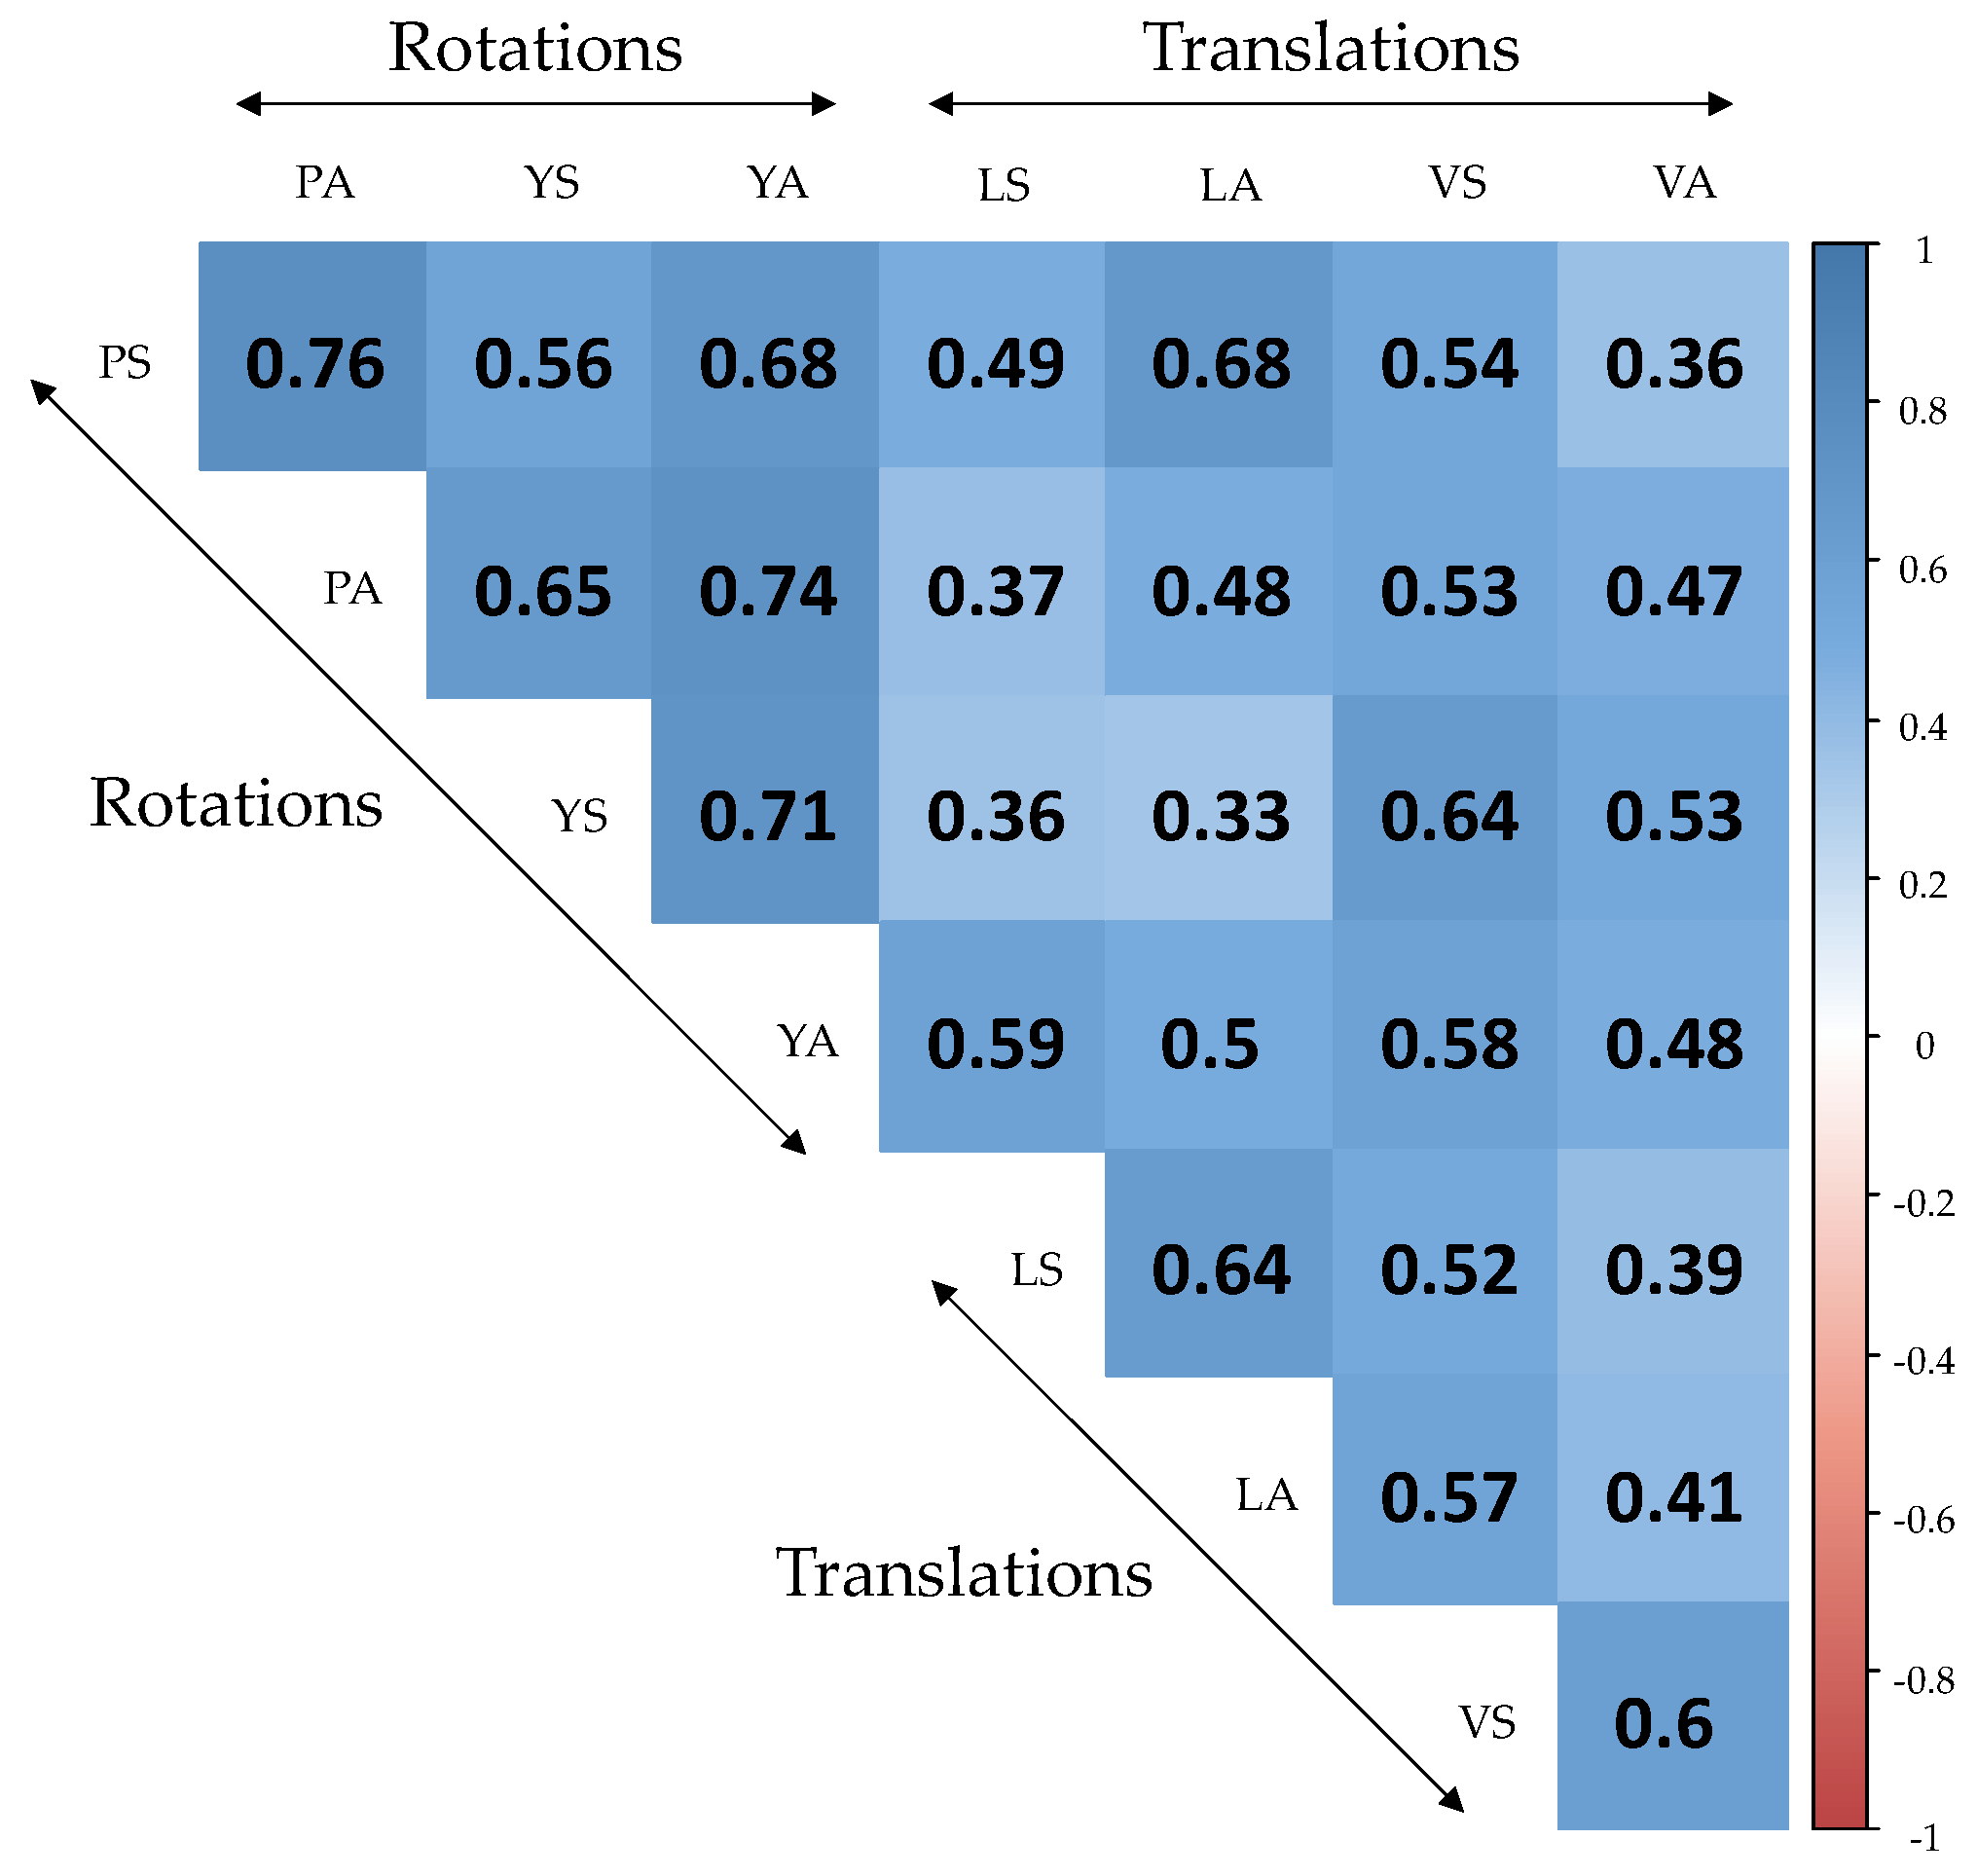
4.1.3. Correlation of Experimental Conditions

Correlation analysis reported the relationship among the thresholds of experimental conditions, and hierarchical cluster analysis [42] showed up the clusters in the correlation matrix. Pearson’s R coefficients in Figure 4 showed that all experimental conditions in this study significantly correlate with each other (p < 0.02). There are two correlation clusters; one for the rotational movement (YS, YA, PS, PA) and the other for the translational movement (LS, LA, VS, VA).

4.2. Severity Level of Cybersickness

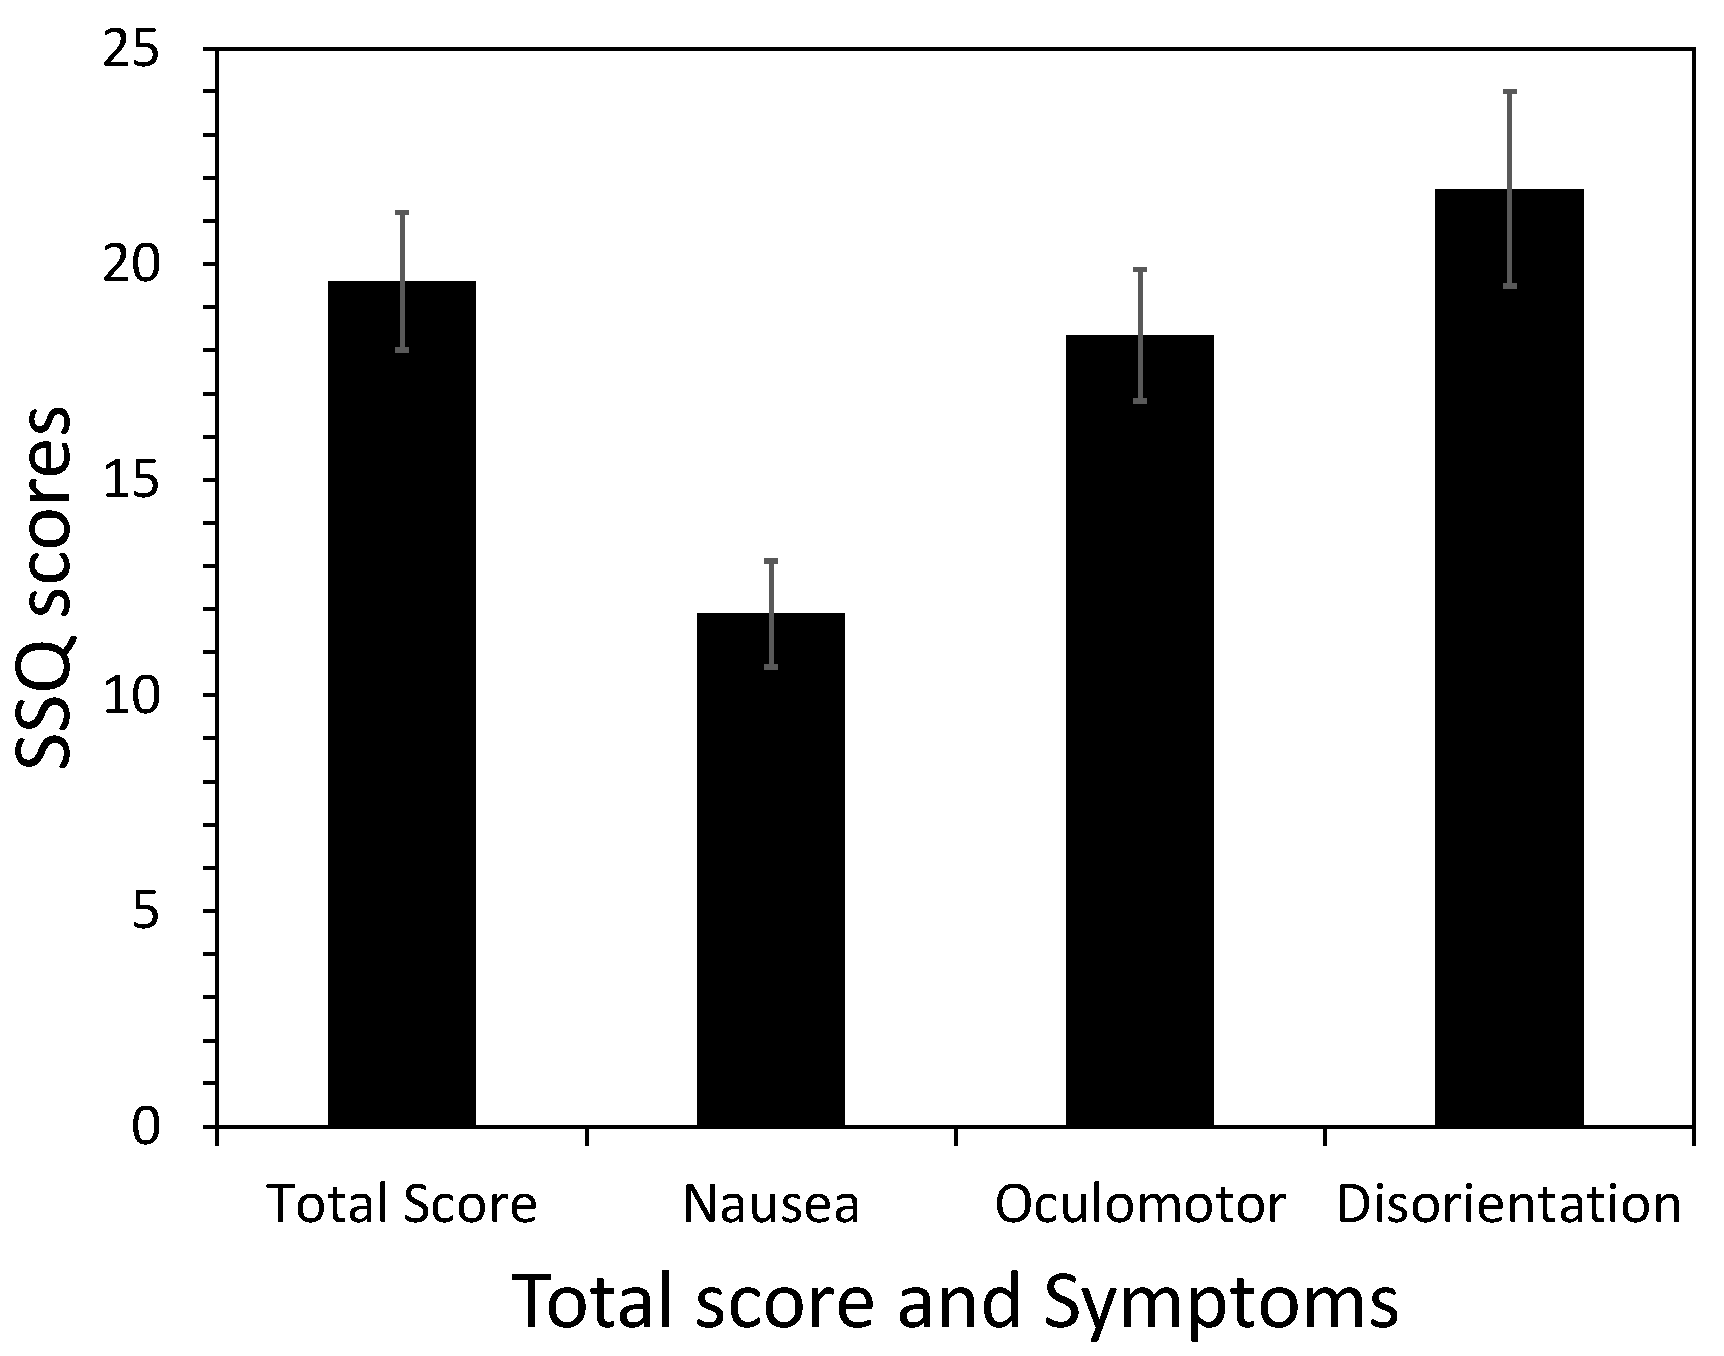
4.2.1. The Symptom Profile of SSQ Scores

Participants reported their state by SSQ before starting the first run and after the last run for each experimental condition. To maintain a refreshed state, the participants had at least 2 min or more rest between the trials. Since the total severity score ranges from 0 up to 235.62, the reported pre-exposure total severity score (Mean = 3.20, SD = 7.23, CI = 0.63) was considered very low. We took the difference between pre- and post-exposure SSQ scores for the analysis to control the individual variability (see Figure 5).

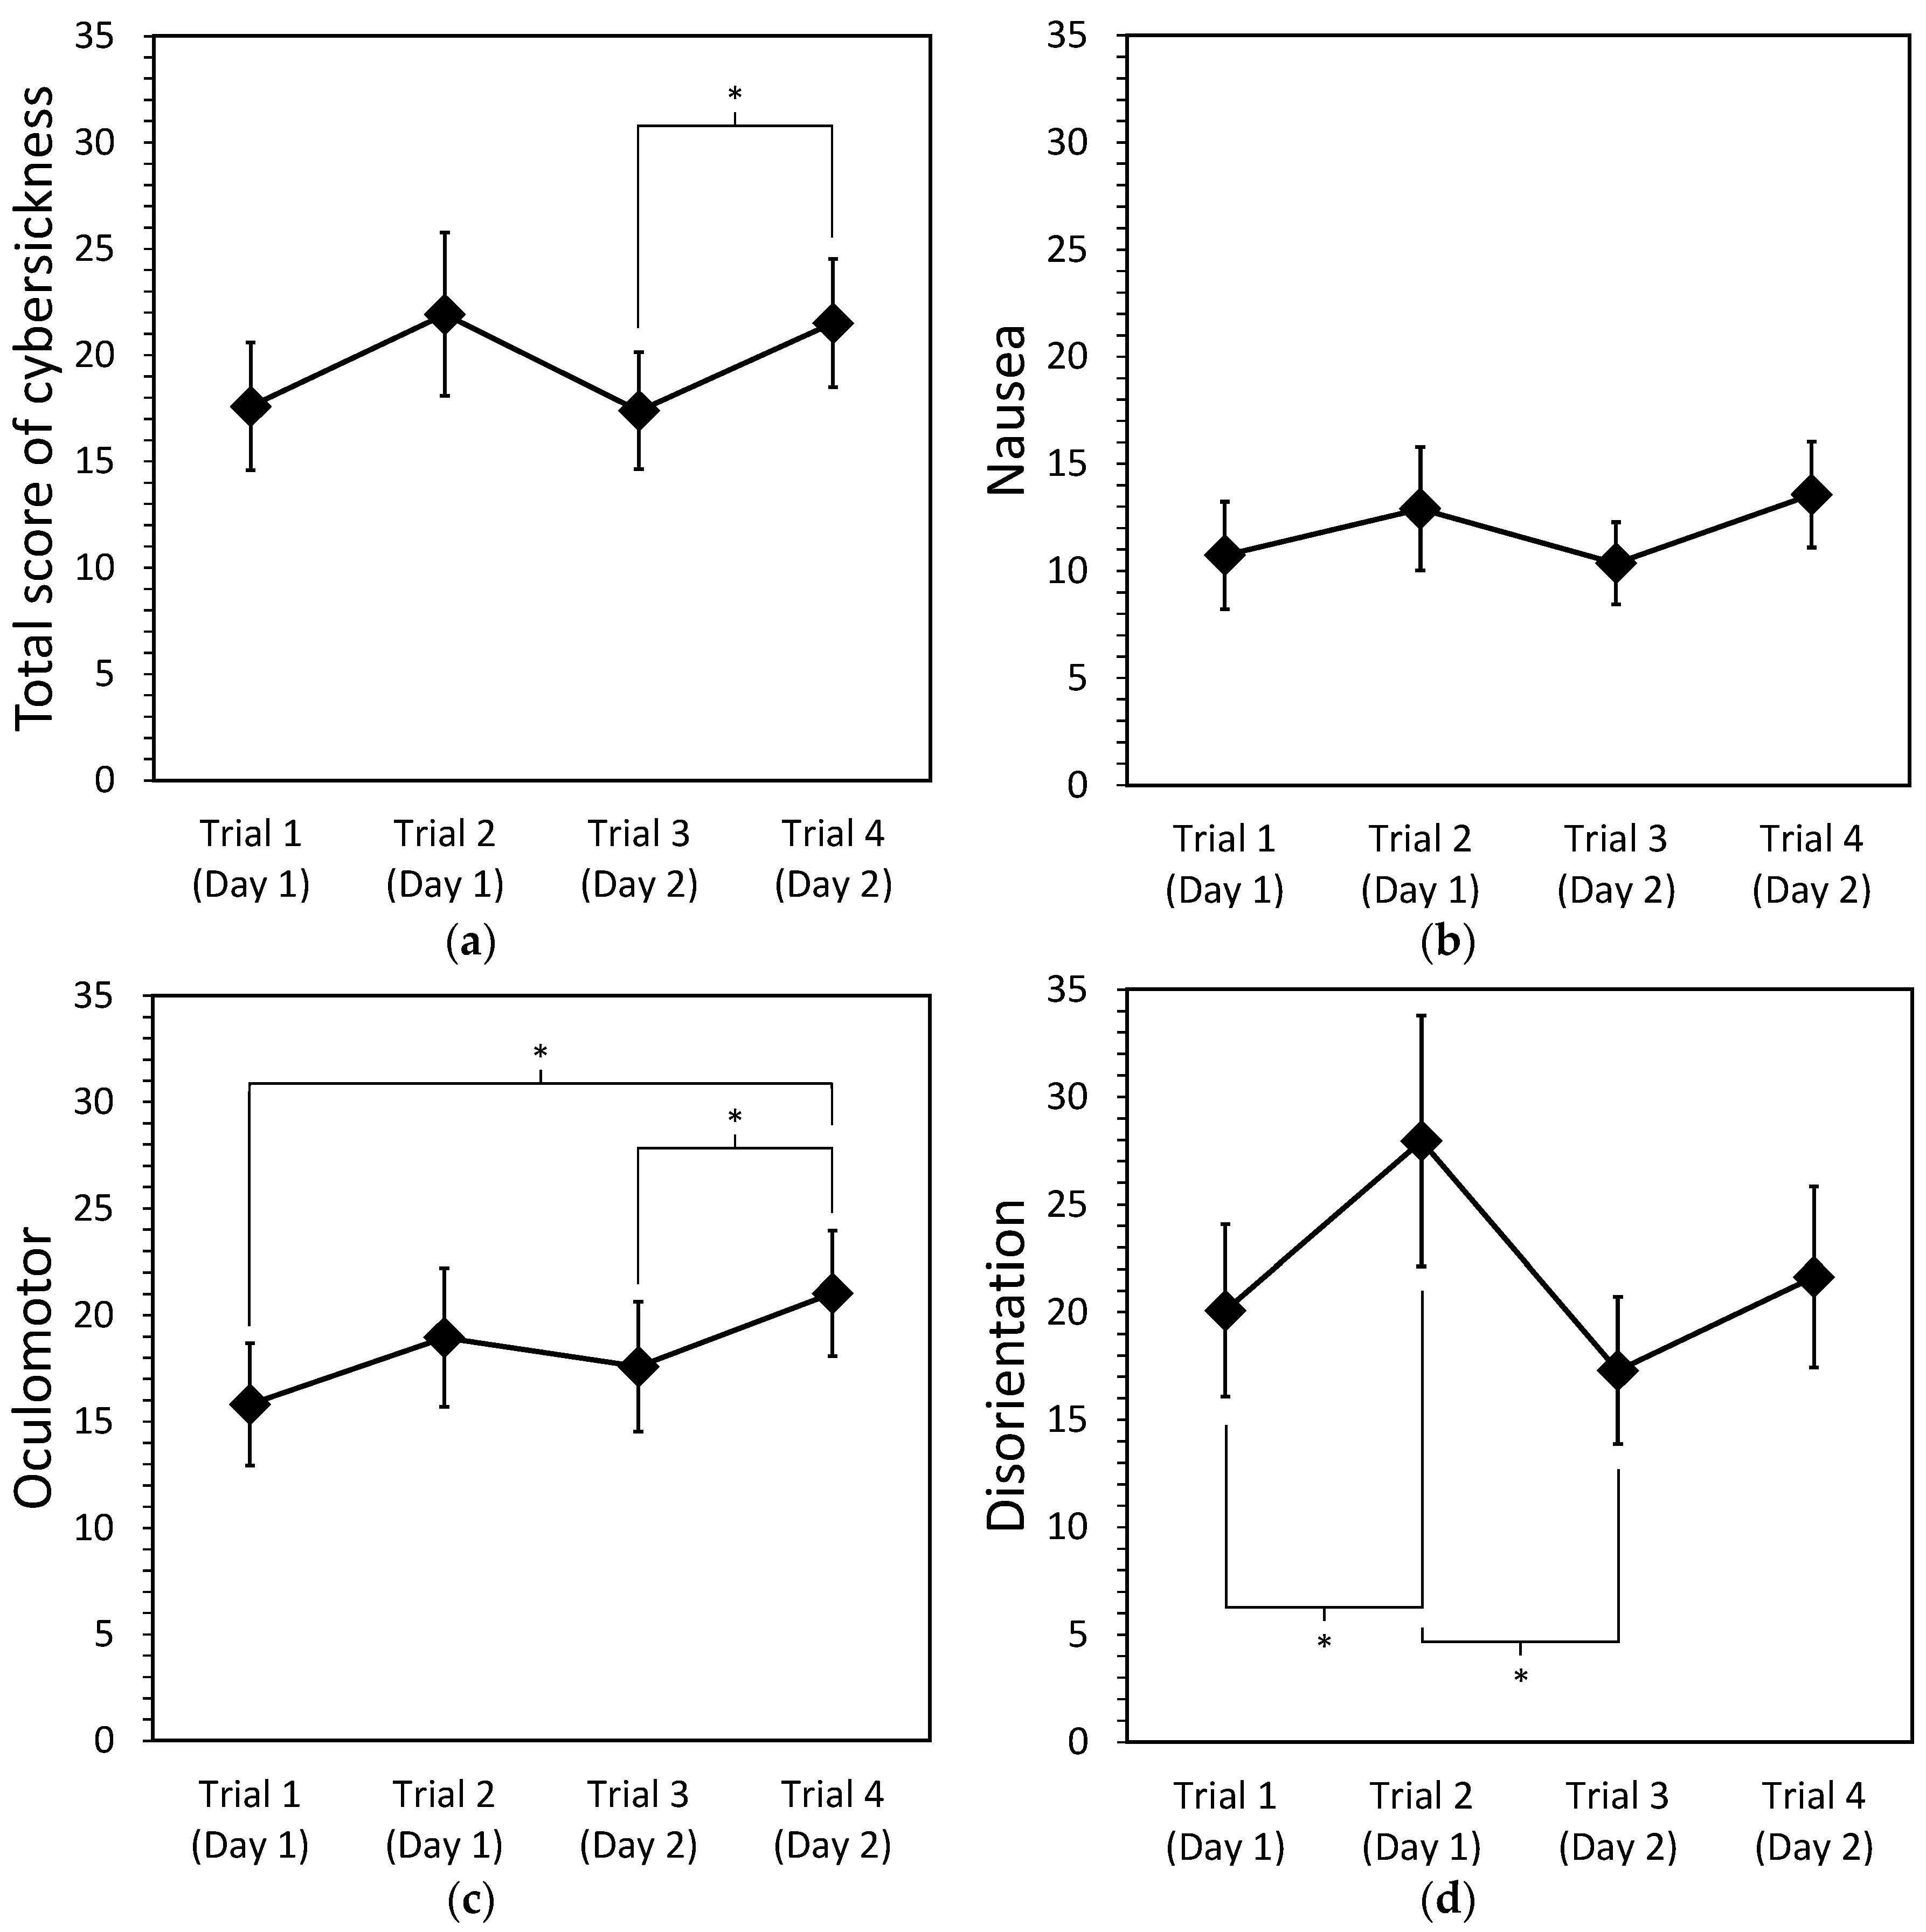
4.2.2. Effects of Repetition, Types of Motion, and Movement Direction on Cybersickness

A repeated-measures ANOVA with a Greenhouse–Geisser correction indicated that the SSQs are significantly different between trials, F(2.270, 272.424) = 3.237, p = 0.035. Post-hoc analysis with Bonferroni correction revealed that the total score of the first trial is lower than the second one, though the difference was marginal (p = 0.094). Similarly, the total score of the third trial is significantly lower than that of the 4th trial (p = 0.016). The result implies that the symptoms may accumulate within the same day, but it did not influence the second day (see Figure 6a). The main effects of motion and movement direction are not significant for the total score of CS (see Table 5).
We further explored the effects of repetition, motion, and movement direction on the sub-symptoms, namely nausea, oculomotor, and disorientation. The ANOVA results showed that oculomotor (F(2.268, 272.144) = 2.975, p = 0.046) and disorientation (F(2.516, 301.947) = 5.483, p = 0.002) were significantly different between trials. The post hoc analysis with Bonferroni correction for both sub-symptoms showed that the oculomotor score of the first (p = 0.025) and the third (p = 0.041) trials were significantly lower than the fourth trial. The first (p = 0.021) and the third (p = 0.005) trial’s disorientation scores were significantly lower than that of the second trial. Tests of within-subjects contrasts were conducted to reveal the trend of repeated-measures data and how it will change afterward. The results showed a significant linear trend between trial and oculomotor score, F(1, 120) = 4.614, p = 0.034. However, there was a significant cubic trend between trial and disorientation score, F(1, 120) = 13.975, p < 0.001. This implies that oculomotor-related symptoms accumulate over the other day (interval: 24 h–4 days) or repetition (see Figure 6c). Moreover, the disorientation-related symptoms are refreshed on the other day, while the severity of symptoms increases within a day in likewise the oculomotor-relate symptoms (see Figure 6d).

4.2.3. Correlation between the Detected Threshold and Severity Level of Cybersickness

A correlation analysis conducted as a further examination showed the relationship between the detected threshold and severity level of CS. There is a significant correlation only between threshold and nausea, r(493) = −0.143, p = 0.001. No correlation was found in the total score of CS, oculomotor, and disorientation. It implies that the participants who have a lower threshold felt severe nausea.

5. Discussion

This paper examined the feasibility of using a threshold for finding dominant rotational or translational axes evoking CS in VE. The experimental results confirmed that the type of scene movement influences the onset of CS. We first expected that if CS occurs, the severity level of symptoms could be similar across different movement types. Indeed, our results showed that there is no main effect of movement direction on CS severity. Moreover, we could not find a correlation between threshold, that is, the magnitude of the acceleration or velocity of the last run, and the total score of CS. These results yet confirm that the effect of movement direction was not significant for the severity of CS. The effect of the speed level of scene movement on CS is not known directly from our experiment, but experimental evidence [12,15,16,17] suggests that movement direction did not significantly affect CS severity.

5.1. Dominant Axis Evoking Cybersickness

For the translational optical flow, the threshold for vertical movement is significantly lower than the lateral one. LS (LA) had an average threshold of approximately 0.60 m/s (0.33 m/s2), whereas VS (VA) had a threshold of 0.40 m/s (0.31 m/s2). For rotational optical flow, the pitch threshold tended to be lower than the yaw, though the difference (p = 0.098) was just suggestive. It supports the previous study that the most annoying rotation axes follow the pitch, roll, and yaw axis order [36]. Our results proposed that YS (YA) had an average threshold of 17.88 deg/s (14.50 deg/s2) and PS (PA) had a threshold of 14.61 deg/s (11.06 deg/s2).
Optical flow induced the visual-vestibular conflict for stationary participants staring at the red anchor dot-point. Their nervous system picks the point as a rest frame to maintain their spatial representations; thus, the observer selects to be stationary with the anchor point. Soon after the exposure, the optical flow inconsistent with the rest frame stimulated peripheral vision, and the nervous system cannot keep the single rest frame [19]. In this case, the upward vertical flow causes a greater discrepancy than the lateral in orientation sensation due to the direction of actual gravity [14]. In the pitch movement, there is a mismatch between the sensed vertical integrated from all sensory systems and the subjective vertical expected from previous experience [21]. The visual system detects the pitch movement, but the vestibular system perceives uprights. However, for the yaw movement, both visual and vestibular sense an upright body position, while the visual scene is rotated for the on-vertical axis. If the participant could fix one’s head perfectly, there are no conflict stimuli based on subjective vertical theory. Moreover, the sickness severity for yaw rotation is typically slight, and occurs with a long delay [22]. These can be explanations for the suggestive difference for thresholds between pitch and yaw movement. Nevertheless, the participants reported symptoms for the yaw axis. As noted by Bos et al. (2008), CS might be caused by a minor confusion of the center of rotation or misrecognition that they are watching lateral movement [22].

5.2. Implications for Reducing Cybersickness

The effect of repetition was significant on the threshold and CS severity. For the threshold, the results suggested that the repetition increase the threshold at the 2nd trial and kept the same level afterward. On the other hand, the severity level of CS became higher as repetition in a day [43,44,45]. Therefore, the rest period appears to be necessary for 30 min [46] or more than one hour [14]. Repeating the VR exposure on different days did not reduce the total score of CS (the difference between first and third trial, p = 1.000; second and third trial, p = 0.292). Other studies reported that the level of sickness decreased significantly from day 2, 4, or more [44,47], but the adaptation to CS appears to not be observed in this experiment. The results showed the effect of the rehearsal (1st trial) increased in the threshold. The implication is that conducting a short rehearsal can increase the threshold of uneasiness and may delay the start of CS.

5.3. Limitations

A couple of cautions for interpreting the result of this study are high individual variability and applicability to actual VR activities. Although this study listed the uneasiness caused by CS, such as vection, disorientation, general discomfort, and nausea, participants might have different subjective criteria for determining whether they were experiencing symptoms of CS. More repetition with a clear discrimination standard could have reduce individual variances. There is a controversy over whether vection is a sufficient condition to cause MS [48,49]. There may be other visual characteristics causing CS in actual VR applications, which sometimes contradict in the same visual field. For instance, objects in the scene are moving in opposite directions with different velocity and accelerations. According to the usage context, these complex movements may result in different patterns in the threshold and severity of CS.
The number of participants in this study was 16, which is relatively small. Since a relatively small sample size may not represent the whole population effectively, we should prudently apply the experimental findings to VR content development. In future work, we recommend examining a larger cohort to provide more generalizable results.
However, finding the threshold at which people could feel uneasiness is still meaningful in the sense that delaying the onset of CS symptoms can provide a chance to recover over the rest period, and practical design of optical flow rate below the thresholds.

6. Conclusions

The experimental result showed that the pitch movement could cause CS symptoms faster than the yaw movement, and vertical movement induces CS faster than the lateral one. It supported the rest frame theory and the subjective vertical theory with an empirical experiment. A negative correlation was found in participants with lower uneasiness thresholds showed higher nausea symptoms. Therefore, it is necessary to develop design guidelines for people who are vulnerable to CS. This study presented explicit numeric values to refer to when designing scene movement motion profiles in VR. We suggest that it is more effective to minimize rotation scene movement than a translation one for preventing CS. When providing the translation scene movements in VR, it is recommended that the lateral and vertical velocity are limited up to 0.60 m/s and 0.40 m/s each.
Furthermore, we found the repetition effect on both threshold and severity level. In a total of the four trials, there was a significant increase in the threshold between the first and second trials. However, the severity of CS tended to increase significantly between trials within a day. The results also indicated that the disorientation-related symptoms are recovered in 2–4 days, whereas the oculomotor-related symptoms accumulate over the days. To reduce CS, we recommend conducting a brief rehearsal to raise the threshold of CS and giving rest-periods after exposure to VR.

Author Contributions

J.K. performed conceptualization, methodology, software, validation, formal analysis, investigation; T.P. performed verification, supervision, project administration, funding acquisition; J.K. contributed to writing the initial draft preparation and editing; T.P. contributed to review and editing of this paper. All authors have read and agreed to the published version of the manuscript.

Funding

This work is financially supported by the Institute of Civil Military Technology Cooperation funded by the Defense Acquisition Program Administration and Ministry of Trade, Industry and Energy of Korea government under the grant No. 17-CM-RB-27.

Acknowledgments

The authors are grateful to Lorenzo Terenzi and Peter M. T. Zaal for their technical assistance and sharing experimental results.

Conflicts of Interest

The authors declare no conflict of interest.

References

  1. Cobb, S.V.G.; Nichols, S.; Ramsey, A.; Wilson, J.R. Virtual Reality-Induced Symptoms and Effects (VRISE). Presence Teleoperators Virtual Environ. 1999, 8, 169–186. [Google Scholar] [CrossRef]
  2. McCauley, M.E.; Sharkey, T.J. Cybersickness: Perception of Self-Motion in Virtual Environments. Presence Teleoperators Virtual Environ. 1992, 1, 311–318. [Google Scholar] [CrossRef]
  3. So, R.H.Y.; Ho, A.; Lo, W.T. A Metric to Quantify Virtual Scene Movement for the Study of Cybersickness: Definition, Implementation, and Verification. Presence Teleoperators Virtual Environ. 2001, 10, 193–215. [Google Scholar] [CrossRef] [Green Version]
  4. Stanney, K.; Salvendy, G. Aftereffects and Sense of Presence in Virtual Environments: Formulation of a Research and Development Agenda. Int. J. Hum. Comput. Interact. 1998, 10, 135–187. [Google Scholar] [CrossRef] [PubMed]
  5. Fernandes, A.S.; Feiner, S.K. Combating VR sickness through subtle dynamic field-of-view modification. In Proceedings of the 2016 IEEE Symposium on 3D User Interfaces (3DUI), Greenville, SC, USA, 19–20 March 2016; pp. 201–210. [Google Scholar]
  6. Argelaguet, F. Adaptive navigation for virtual environments. In Proceedings of the 2014 IEEE Symposium on 3D User Interfaces (3DUI), Minneapolis, MN, USA, 29–30 March 2014; pp. 123–126. [Google Scholar]
  7. Argelaguet, F.; Maignant, M. GiAnt: Stereoscopic-compliant multi-scale navigation in VEs. In Proceedings of the 22nd ACM Conference on Virtual Reality Software and Technology, Munich, Germany, 2–4 November 2016; pp. 269–277. [Google Scholar]
  8. So, R.H.Y.; Lo, W.T.; Ho, A.T.K. Effects of Navigation Speed on Motion Sickness Caused by an Immersive Virtual Environment. Hum. Factors 2001, 43, 452–461. [Google Scholar] [CrossRef]
  9. Boletsis, C. The new era of virtual reality locomotion: A systematic literature review of techniques and a proposed typology. Multimodal Technol. Interact. 2017, 1, 24. [Google Scholar] [CrossRef] [Green Version]
  10. Davis, S.; Nesbitt, K.; Nalivaiko, E. Comparing the onset of cybersickness using the Oculus Rift and two virtual roller coasters. In Proceedings of the 11th Australasian Conference on Interactive Entertainment (IE 2015), Sydney, Australia, 27–30 January 2015; p. 30. [Google Scholar]
  11. Porcino, T.M.; Clua, E.; Trevisan, D.; Vasconcelos, C.N.; Valente, L. Minimizing cyber sickness in head mounted display systems: Design guidelines and applications. In Proceedings of the 2017 IEEE 5th International Conference on Serious Games and Applications for Health (SeGAH), Perth, Western Australia, 2–4 April 2017; pp. 1–6. [Google Scholar]
  12. Lo, W.T.; So, R.H.Y. Cybersickness in the presence of scene rotational movements along different axes. Appl. Ergon. 2001, 32, 1–14. [Google Scholar] [CrossRef] [Green Version]
  13. Chen, W. Effects of Navigation Velocities in Fore-And-Aft, Lateral, Yaw Axes on Cybersickness Caused by Exposure to a Virtual Environment. Master’s Thesis, The Hong Kong University of Science and Technology, Clear Water Bay, Hong Kong, China, 2006. [Google Scholar]
  14. Rebenitsch, L.; Owen, C. Review on cybersickness in applications and visual displays. Virtual Real. 2016, 20, 101–125. [Google Scholar] [CrossRef]
  15. Joseph, J.A.; Griffin, M.J. Motion Sickness: Effect of the Magnitude of Roll and Pitch Oscillation. Aviat. SpaceEnviron. Med. 2008, 79, 390–396. [Google Scholar] [CrossRef]
  16. Chen, W.; Chen, J.; So, R.H.Y. Visually induced motion sickness: Effects of translational visual motion along different axes. In Contemporary Ergonomics and Human Factors 2011, Proceedings of the International Conference on Ergonomics & Human Factors 2011, Stoke Rochford, Lincolnshire, 12–14 April 2011; Anderson, M., Ed.; CRC Press: Boca Raton, FL, USA, 2012; pp. 281–287. [Google Scholar] [CrossRef]
  17. Bonato, F.; Bubka, A.; Palmisano, S. Combined Pitch and Roll and Cybersickness in a Virtual Environment. Aviat. Space Environ. Med. 2009, 80, 941–945. [Google Scholar] [CrossRef] [Green Version]
  18. Terenzi, L.; Zaal, P. Rotational and Translational Velocity and Acceleration Thresholds for the Onset of Cybersickness in Virtual Reality. In Proceedings of the AIAA Scitech 2020 Forum, Orlando, FL, USA, 6–10 January 2020. [Google Scholar] [CrossRef]
  19. Prothero, J.D. The Role of Rest Frames in Vection, Presence and Motion Sickness. Ph.D. Thesis, University of Washington, Seattle, WA, USA, 1998. [Google Scholar]
  20. Bles, W. Coriolis effects and motion sickness modelling. Brain Res. Bull. 1998, 47, 543–549. [Google Scholar] [CrossRef]
  21. Bles, W.; Bos, J.E.; de Graaf, B.; Groen, E.; Wertheim, A.H. Motion sickness: Only one provocative conflict? Brain Res. Bull. 1998, 47, 481–487. [Google Scholar] [CrossRef]
  22. Bos, J.E.; Bles, W.; Groen, E.L. A theory on visually induced motion sickness. Displays 2008, 29, 47–57. [Google Scholar] [CrossRef]
  23. McCauley, M.E. Research Issues in Simulator Sickness: Proceedings of a Workshop; National Research Council Washington DC Committee on Human Factors: Washington, DC, USA, 1984.
  24. Kennedy, R.S.; Lane, N.E.; Berbaum, K.S.; Lilienthal, M.G. Simulator Sickness Questionnaire: An Enhanced Method for Quantifying Simulator Sickness. Int. J. Aviat. Psychol. 1993, 3, 203–220. [Google Scholar] [CrossRef]
  25. Bertolini, G.; Straumann, D. Moving in a Moving World: A Review on Vestibular Motion Sickness. Front. Neurol. 2016, 7. [Google Scholar] [CrossRef] [Green Version]
  26. Angelaki, D.E.; Cullen, K.E. Vestibular System: The Many Facets of a Multimodal Sense. Annu. Rev. Neurosci. 2008, 31, 125–150. [Google Scholar] [CrossRef] [Green Version]
  27. Leigh, R.J.; Zee, D.S. The Neurology of Eye Movements, 4th ed.; Oxford University Press: Oxford, UK, 2006. [Google Scholar]
  28. Ko, B.Y.; Kim, K.S.; Park, H.K. Understanding of VOR for the Beginner. Res. Vestib. Sci. 2012, 11, 73–79. [Google Scholar]
  29. Einstein, A. Über das Relativitätsprinzip und die aus Demselben Gezogenen Folgerungen; S. Hirzel: Leipzig, Germany, 1908. [Google Scholar]
  30. Fetsch, C.R.; Turner, A.H.; DeAngelis, G.C.; Angelaki, D.E. Dynamic Reweighting of Visual and Vestibular Cues during Self-Motion Perception. J. Neurosci. 2009, 29, 15601–15612. [Google Scholar] [CrossRef] [PubMed]
  31. Knill, D.C.; Pouget, A. The Bayesian brain: The role of uncertainty in neural coding and computation. Trends Neurosci. 2004, 27, 712–719. [Google Scholar] [CrossRef]
  32. Oman, C.M. Motion sickness: A synthesis and evaluation of the sensory conflict theory. Can. J. Physiol. Pharmacol. 1990, 68, 294–303. [Google Scholar] [CrossRef] [PubMed]
  33. Cheung, B.S.; Howard, I.P.; Money, K.E. Visually-induced sickness in normal and bilaterally labyrinthine-defective subjects. Aviat. Space Environ. Med. 1991, 62, 527–531. [Google Scholar]
  34. Diels, C.; Howarth, P.A. Frequency Characteristics of Visually Induced Motion Sickness. Hum. Factors 2013, 55, 595–604. [Google Scholar] [CrossRef] [PubMed] [Green Version]
  35. Reason, J.T.; Brand, J.J. Motion Sickness; Academic Press: Cambridge, MA, USA, 1975. [Google Scholar]
  36. Yang, T.; Pei, J. Motion sickness severity under interaction of vection and head movements. Aviat. Space Environ. Med. 1991, 62, 141–144. [Google Scholar]
  37. Horn, B.K.P.; Schunck, B.G. Determining optical flow. Artif. Intell. 1981, 17, 185–203. [Google Scholar] [CrossRef] [Green Version]
  38. Cornsweet, T.N. The Staircase-Method in Psychophysics. Am. J. Psychol. 1962, 75, 485–491. [Google Scholar] [CrossRef] [PubMed]
  39. Levitt, H. Transformed Up-Down Methods in Psychoacoustics. J. Acoust. Soc. Am. 1971, 49, 467–477. [Google Scholar] [CrossRef]
  40. Golding, J.F. Predicting individual differences in motion sickness susceptibility by questionnaire. Personal. Individ. Differ. 2006, 41, 237–248. [Google Scholar] [CrossRef]
  41. Warren, W.H.; Hannon, D.J. Eye movements and optical flow. J. Opt. Soc. Am. A 1990, 7, 160–169. [Google Scholar] [CrossRef] [PubMed]
  42. Rokach, L.; Maimon, O. Clustering Methods. In Data Mining and Knowledge Discovery Handbook; Maimon, O., Rokach, L., Eds.; Springer: Boston, MA, USA, 2005; pp. 321–352. [Google Scholar] [CrossRef]
  43. Kennedy, R.S.; Stanney, K.M.; Dunlap, W.P. Duration and Exposure to Virtual Environments: Sickness Curves During and Across Sessions. Presence Teleoperators Virtual Environ. 2000, 9, 463–472. [Google Scholar] [CrossRef] [Green Version]
  44. Jarchow, T.; Young, L.R. Adaptation to head movements during short radius centrifugation. Acta Astronaut. 2007, 61, 881–888. [Google Scholar] [CrossRef]
  45. Moss, J.; Scisco, J.; Muth, E. Simulator Sickness during Head Mounted Display (HMD) of Real World Video Captured Scenes. Proc. Hum. Factors Ergon. Soc. Annu. Meet. 2008, 52, 1631–1634. [Google Scholar] [CrossRef]
  46. Singer, M.J.; Ehrlich, J.A.; Allen, R.C. Virtual Environment Sickness: Adaptation to and Recovery from a Search Task. Proc. Hum. Factors Ergon. Soc. Annu. Meet. 1998, 42, 1506–1510. [Google Scholar] [CrossRef]
  47. Newman, M.C.; McCarthy, G.W.; Glaser, S.T.; Bonato, F.; Bubka, A. Motion Sickness Adaptation to Coriolis-Inducing Head Movements in a Sustained G Flight Simulator. Aviat. Space Environ. Med. 2013, 84, 104–109. [Google Scholar] [CrossRef] [Green Version]
  48. Keshavarz, B.; Riecke, B.E.; Hettinger, L.J.; Campos, J.L. Vection and visually induced motion sickness: How are they related? Front. Psychol. 2015, 6. [Google Scholar] [CrossRef] [Green Version]
  49. Koohestani, A.; Nahavandi, D.; Asadi, H.; Kebria, P.M.; Khosravi, A.; Alizadehsani, R.; Nahavandi, S. A Knowledge Discovery in Motion Sickness: A Comprehensive Literature Review. IEEE Access 2019, 7, 85755–85770. [Google Scholar] [CrossRef]
Figure 1. Experimental setup.
Applsci 10 07808 g001
Figure 2. Averages of threshold for this study and Terenzi and Zaal [18]: (a) the constant velocity; (b) the constant acceleration. The error bars represent 95% confidence intervals for each condition.
Applsci 10 07808 g002
Figure 3. Plot of ANOVA results for log-transformed thresholds: (a) between repetitions; (b) between types of motion; (c) between scene movements. The error bars represent 95% confidence intervals for each condition. The * represents p < 0.05 for the statistical significance.
Applsci 10 07808 g003
Figure 4. Correlation matrix between the experimental conditions. The numbers in each square represent Pearson’s R coefficient. Each square was clustered and ordered by hierarchical cluster analysis.
Applsci 10 07808 g004
Figure 5. Mean of the SSQ scores for the difference between pre- and post-exposure. The error bar represents a 95% confidence interval.
Applsci 10 07808 g005
Figure 6. Plot of mean SSQ scores for cybersickness and its symptoms per trial: (a) total score of cybersickness; (b) nausea; (c) oculomotor; (d) disorientation. The error bars represent 95% confidence intervals for each condition. The * represents p < 0.05 for the statistical significance.
Applsci 10 07808 g006
Table 1. Calculated viewing volume and scale factors for each movement direction.
Scene MovementOFzOFxOFyOFrollOFpitchOFyaw
Viewing Volume (Ii)0.5030.6400.6400.8781.0421.042
Scale factor (Iz/Ii)1.0000.7860.7860.5720.4820.482
Table 2. Experimental conditions with labels.
Independent VariableCondition Label
LSLAVSVAYSYAPSPA
MovementLateralLateralVerticalVerticalYawYawPitchPitch
MotionSteadyAcc.SteadyAcc.SteadyAcc.SteadyAcc.
Note. The abbreviation Acc. indicates accelerating.
Table 3. The number of threshold detections out of 32 and missed scene.
Participant ID0123456789101112131415
Number of Runs32323230323231322032313132323232
Missed Scene---LA
YA
--VS-LS
LA
YA
-VAYA----
Table 4. Descriptive statistics of the thresholds.
LabelMotionThreshold MeanThreshold SD
LSSteady0.5970.297
VSSteady0.3950.217
YSSteady0.3120.144
PSSteady0.2550.157
LAAccelerating0.3280.164
VAAccelerating0.3110.200
YAAccelerating0.2530.123
PAAccelerating0.1930.102
Table 5. Mean (standard deviation) of the SSQ scores for the severity level of cybersickness.
LateralVerticalYawPitch
Total scoreSteady19.52 (18.21)22.21 (19.97)20.10 (19.77)24.43 (19.45)
Accelerating18.88 (19.21)14.90 (13.18)17.82 (20.21)18.93 (15.68)
NauseaSteady10.43 (13.78)14.16 (14.52)11.93 (15.30)17.44 (16.26)
Accelerating10.88 (15.75)7.45 (10.12)9.84 (13.49)12.97 (12.18)
OculomotorSteady20.73 (17.93)20.25 (18.62)18.36 (17.60)20.37 (17.02)
Accelerating18.00 (18.84)15.87 (14.72)16.94 (19.65)16.23 (15.97)
DisorientationSteady19.45 (25.22)24.44 (30.76)23.49 (29.23)27.84 (28.28)
Accelerating21.71 (24.70)15.01 (17.42)20.45 (27.28)21.53 (21.61)
Publisher’s Note: MDPI stays neutral with regard to jurisdictional claims in published maps and institutional affiliations.

