Abstract
Taking a variety of edible oils as the research object, including soybean oil, peanut oil, rapeseed oil, a method based on Near-Infrared Spectroscopy (NIRS) to identify the frying times is proposed to evaluate the quality of frying oil. Ten rounds of frying experiments are carried out for each of the three oils. The spectra of the first eight rounds are used to build the model, and the last two are used for model testing. First, all the original spectra are preprocessed using the first derivative (1D). Then, the correlation coefficient between the sequence of frying times and absorbance is calculated, and the characteristic wavelengths with a high correlation coefficient are extracted. Finally, a differential prediction model is established based on the characteristic wavelengths. The results show that the differential prediction model accurately predicts the frying times of various edible oils and provides a new method for quality inspection of frying oil, and the predicted accuracy of the frying times of three frying oils is 100% within the allowable range of error.
1. Introduction
Frying is one of the most common ways of cooking, which gives food excellent flavor and crisp texture. Typically, 10%–40% oil of cooking oil is absorbed and digested along with foods [1]. Thus, the health of eaters is related to the quality of frying oil. Due to the moisture in the food and the oxygen in the air, there are complex reactions such as hydrolysis, oxidation, and thermal polymerization in the frying oil at high temperatures [2]. Then, the physical and chemical properties of the oil will be significantly changed. The features of oil, such as flavor, viscosity, color, ester content, peroxide value, and polar compounds, vary with the extent of frying [3,4]. Besides, decomposition products, which are harmful to the health of people(eaters), are also generated during frying [5]. Therefore, it is of great significance to investigate the changes in oil quality in the frying process.
Currently, various detection methods have been developed to get the physical and chemical parameters of different frying oil, and the quality of frying oils can be assessed with these parameters. For instance, Gil et al. [6] evaluated the quality of frying oil using standard column chromatography and a novel image analysis method, and Yang et al. [7] assessed the quality of frying oil by determining the dielectric property with dielectric spectroscopy. Although reliable results have been obtained, those methods suffer from complex operations and the length of time taken, which makes them difficult for wide use in field testing. Total polar compounds (TPC) consist of dimeric and higher polymeric triglycerides are formed through thermal polymerization of triglycerides, monomeric oxidized products, as well as mono and diglycerides and free fatty acids formed through hydrolytic cleavage of triglycerides [8]. The TPC content is widely used to evaluate the quality of frying oil [9,10,11]. Uriarte et al. [12] considered that frying oil could not be used when the TPC content is more than 25%~27%. Hassanien et al. [13] found that the TPC content in frying oil was positively correlated with frying time. Additionally, Li et al. [14] proved that the polar component content would increase with frying time, and the TPC content of different oil or different frying medium is similar. Although TPC content can be used to effectively demonstrate the quality of frying oil, it is not appropriate for quick assessment of frying oil quality due to the complex content detection process of TPC. With flash chromatography-high performance volume exclusion chromatography, Feng et al. [15] studied the effect of frying times on the TPC content in soybean oil and French fries and the composition of TPC. They found that TPC content in soybean oil and French fries both increased with frying times. Sanchez-Muniz et al. [16] believed that TPC content in sunflower oil was linearly correlated with frying times. After fried peanut oil intermittently, Liu et al. [17] found that the polar component content in the oil sample continuously increased with frying times, and the growth rate was relatively stable. After frying 15 times, the polar component content was close to 27%, which was the limit stipulated in Hygienic Standard for Edible Vegetable Oils Used in Frying Food (GB7102.1-2003) [18]. Jiang et al. [19] investigated the quality change of soybean oil during the frying process, and they found that the acid value, polar compounds, and carbonyl group value were positively and linearly correlated with frying times. All the above studies indicated that TPC content is linearly correlated with frying times, which could be used for indirect evaluation of frying oil.
Near-Infrared Spectroscopy (NIRS) technique is a non-destructive, environmentally friendly, and fast detection method that can be utilized in on-line detection [20]. NIRS has been recently applied in the quality assessment of frying oil [21]. Picouet et al. [22] proved that NIRS could be used to conduct a quick online quality detection of sunflower oil doped with mineral oil. Pereira et al. [23] built a PCA-PLS model based on mid-infrared spectroscopy and NIRS to evaluate the quality of butter oil, and the R-squared is greater than 99%. Liu et al. [24] established a relational model between the NIR spectra of soybean oil and frying times, which could be used to effectively predict frying times, to evaluate the quality of soybean oil, and to achieve good results. Nevertheless, these studies focused on a certain kind of frying oil, making the universality of the method to be improved. Besides, the practicability of the detection methods also needs to be improved. In this study, spectral data of various edible oil samples were collected to build the relational model between the sample spectra and frying times, where experimental samples were prepared during the designed standard experimental processes. The relationship between different frying oil and frying times was investigated to provide a theoretical basis and technical reference for the effective evaluation of frying oil quality and safety.
2. Materials and Methods
2.1. Materials and Instruments
In this experiment, the soybean oil, peanut oil, rapeseed oil, and French fries were purchased at a local supermarket in Harbin, Heilongjiang Province. Frozen French fries, 500 g per bag, were provided by Heilongjiang Fu Zeng food co. LTD. The oil used in the experiment was sealed and stored at low temperatures, and the French fries were sealed and stored in a constant temperature refrigerator at −20 °C. The equipment used in the experiment included an induction cooker, a frying pan, an infrared thermometer, a stainless-steel round bowl, a disposable rubber dropper, a measuring cylinder, and a 25 mL tube. The spectral data acquisition instrument uses the NIRS DS 2500 multi-function near-infrared analyzer (produced by FOSS, Seattle, WA, USA).
2.2. Experimental Method
2.2.1. Frying Process
For each kind of oil, 2 L oil was measured out using a graduated cylinder and poured into the frying pan according to the standard experimental procedure. Firstly, we heat the oil to (180 ± 5) °C with an induction cooker; put 500 g of French fries into the pan and start frying; fry for 14 min and 20 s [24], then removed the French fries from the pan and turn off the induction cooker. Waiting for the oil to cool naturally to 30 °C, we took a 15 mL oil sample. At this point, we can complete a standard frying experiment. The same pot of oil was continuously fried 15 times in accordance with the above procedure to get 15 frying oil samples. At this point, we can complete one round of the frying experiments. It should be noted that there was not any new oil added to the pan during the whole frying process. Totally 450 frying oil samples were obtained after ten rounds of frying experiments had been separately carried out for soybean oil, peanut oil, and rapeseed oil.
2.2.2. Spectral Acquisition
The spectra of each frying oil sample were taken immediately at room temperature. A NIRS DS 2500 multi-function near-infrared analyzer with a spectral scanning range of 400 to 2500 nm, a scanning interval of 2 nm, and a collection mode of diffuse reflection was used. Each sample was scanned five times to get five spectra in succession. Then, the average spectrum of the sample was obtained after calculating the average value. In this way, a total of 450 average spectra were obtained for the three oils. Noted that the DS2500 needs to be warmed up for more than 30 min before spectral acquisition to ensure the stability of the acquired spectrum. Once the oil sample was scanned each time, the sample box containing the oil sample of the spectrometer should be thoroughly cleaned to prevent the spectra from interfering with each other and affect the reliability and accuracy of the spectra. The original spectra of soybean oil, peanut oil, and rapeseed oil collected in the experiment are shown in Figure 1. It can be seen from Figure 1 that the three oils have similar absorption peaks, which is helpful for the observation and comparison of these three oils.
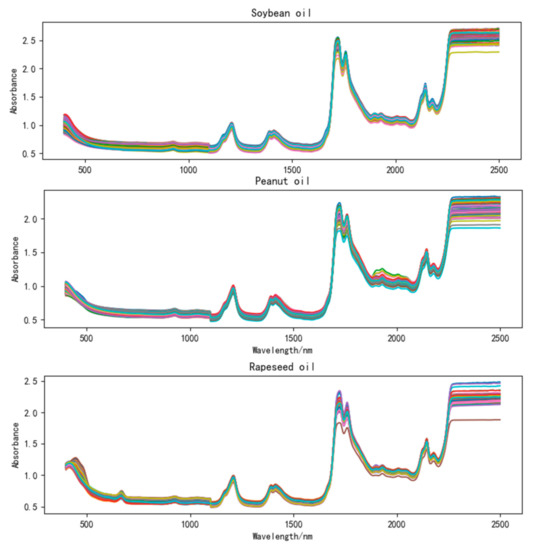
Figure 1.
Original spectra of soybean oil, peanut oil, and rapeseed oil.
2.3. Data Processing and Analysis
Spectral data contains not only useful chemical information, but also various other interference information, affecting the accuracy and reliability of models. Therefore, the spectra need to be pre-processed before modeling to reduce the influence of irrelevant information and improve prediction accuracy. In this study, the first eight rounds of each oil samples were used as training samples to calculate the correlation between the absorbance of each wavelength and the corresponding frying times, and the corresponding wavelength of the maximum correlation coefficient was selected as the characteristic wavelength. The absorbance corresponding to the characteristic wavelength was subjected to differential and normalization processing, and a quantitative analysis model was established based on it. The final two rounds of each oil sample were used as verification samples to test the accuracy of the model.
2.3.1. Preprocessing Method
In the process of spectra analysis, the different spectra of the same experimental sample are slightly different due to the shift and drift caused by light scattering, refraction, and experimental conditions. To fully extract sample information from the spectrum and reduce noise interference, the original spectra need to be preprocessed. The first derivative (1D), the multiplicative scatter correction (MSC) and the standard normal variate (SNV) were used to preprocess the original spectral data. These preprocessing methods can effectively reduce noise interference, improve the signal to noise ratio, and enhance useful spectral information characteristics.
The application of 1D can not only eliminate the baseline shift and drift in the spectra, but also effectively remove the interference from the other backgrounds to resolve the overlapped spectra peaks and improve the resolution and sensitivity. The adoption of the MSC method can eliminate the influence of the scattering caused by the uneven distribution of the particles in the sample and the different particle sizes on the spectra. SNV and MSC have a similar effect in the spectral correction. Both of them are used to correct the spectral error caused by the scattering of the particles in the sample. The only difference is that the SNV method corrects each spectrum separately.
2.3.2. Extraction of Spectral Characteristic Wavelength
Due to a large number of spectral wavelengths of samples and data, it is hard to analyze the differences between the spectra. The large amount of redundant information contained therein will reduce the prediction accuracy of subsequent models. On the other hand, if the analysis is built based on single data or a little amount of spectral data, such information will be deleted, which will also lead to a high accidental probability to affect the prediction accuracy of the model. Therefore, the selection of the best wavelength number is of significant importance to improve the prediction accuracy and the generalization ability of the model. For the wavelength points in the spectra of each oil sample, total wavebands were obtained when the adjacent wavelength points were grouped into a band. All these bands had separately corresponded to Seg1, Seg2, Seg3, …, Seg(n-m+1) after the numbering. The cumulative sum of the absorbances of m wavelengths in each segment is taken as the absorbance of the band.
According to Equation (1), the correlation coefficient was calculated between the absorbance of each band of the sample and the frying times. The waveband with a high correlation was chosen, and the waveband in the intersection set was used as the characteristic waveband, which was used to build a model.
where is the cumulative sum of wavelengths absorbances in the Seg(i) band, . is the average of . The sequence of frying times . An increase in the value of indicates the higher correlation between and , which also means the higher sensitivity to the frying times by the spectral band.
2.3.3. Prediction of Frying Times
Select two characteristic wavelengths and calculate the difference between their corresponding absorbances, and divide by the interval between the two wavelengths. As shown in Equation (2).
where is the difference value, is the wavelength interval.
Z-score is the standardization of the data based on the mean and the standard deviation of the raw data. Using this method, the outlier data beyond the value range can be removed to reduce data fluctuation. The calculation formula can be written as Equation (3).
where .
Mean and standard deviation obtained by Z-score are averaged and recorded as and . and are used as the mean and standard deviation of the prediction model. The absorbance of the test sample wavelength is preprocessed and, then, substituted into the model to calculate the predicted value, as shown in Equation (4). The predicted value is compared with the threshold value, and the number of frying times corresponding to the absorbance is determined.
where is the predicted value and is used to compare with the model threshold. is the pre-processed value. is a fixed mean and is a fixed standard deviation, where represents soybean oil, peanut oil, and rapeseed oil, respectively.
3. Results and Discussion
3.1. Spectral Pretreatment
The full-band original spectra of the three frying oils are difficult to distinguish the frying times effectively. In this study, the spectra were preprocessed using 1D, MSC, and SNV, respectively, and the subsequent processing was determined according to the effect of pretreatment. It can be found from the analysis that the data waveforms of the three frying oils after 1D treatment can find the value corresponding to the wavelength increases or decreases monotonically as the frying times increases. Figure 2 is spectra diagrams of three kinds of frying oils after 1D, and the numbers in the figure represent the number of frying times. Compared with Liu et al. [24], this study added additional experiments related to peanut oil and rapeseed oil. Figure 3 gives an example to show the distribution of frying times of peanut oil and rapeseed oil treated with MSC and SNV at certain bands and finally reached similar conclusions that the spectra after MSC and SNV treatment cannot effectively distinguish frying times. Therefore, this study uses 1D as the pretreatment method to further analyze the spectra.
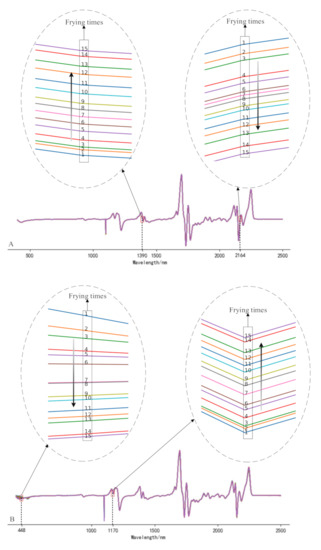

Figure 2.
Spectrogram of soybean oil (A), peanut oil (B), rapeseed oil, (C) after first derivative (1D) treatment.
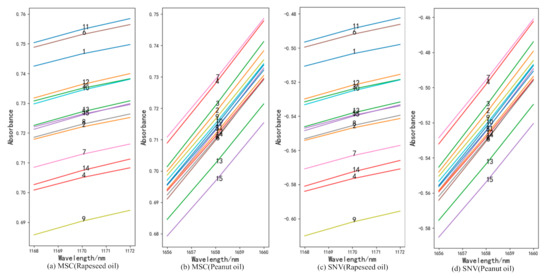
Figure 3.
The frying times of peanut oil and rapeseed oil after multiplicative scatter correction (MSC) (a,b) and standard normal variant (SNV) (c,d) treatment.
3.2. Selection of Characteristic Wavelength
In this study, the characteristic wavelengths of the spectra after 1D pre-processing were extracted by the correlation coefficient method. After 1D treatment, the five adjacent wavelengths were divided into one segment, and a total of 1045 segments were obtained, namely, 400 nm–408 nm, 402 nm–410 nm, 404 nm–412 nm, … 2490 nm–2498 nm. Number these wavebands by wavelength front to back, in order of Seg1, Seg2, Seg3..., Seg1045. The correlation between each band and the frying sequence was analyzed. Taking the data from the first round of frying experiments as an example, the correlation coefficient of each band is shown in Figure 4. Set the correlation coefficient threshold to ensure that the correlation coefficient of at least one band of each of the three oils is greater than the threshold. By comparison, the correlation coefficient thresholds of soybean oil, peanut oil, and rapeseed oil are determined to be 0.99, 0.96, and 0.99, respectively. At the same time, the correlation coefficient of the Seg384 band of all experiments is found to be greater than the threshold. The Seg384 band includes five wavelengths of 1166 nm, 1168 nm, 1170 nm, 1172 nm, and 1174 nm. Therefore, these wavelengths will be analyzed in-depth later.
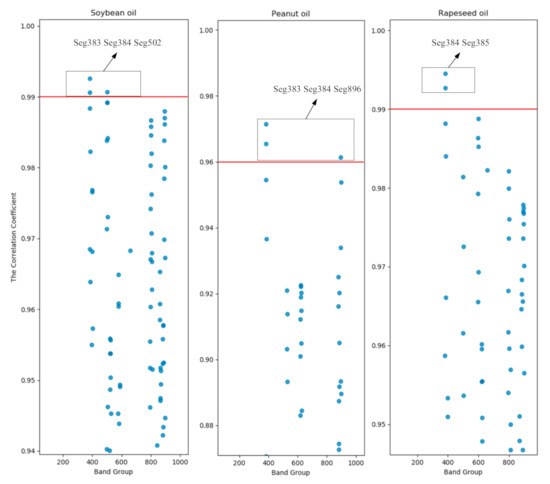
Figure 4.
Scatter plot of correlation coefficients for the first round of frying of three oils.
The average values of the data of the first eight rounds of three oils were taken to analyze the relationship between the absorbance of the corresponding wavelength of the Seg384 with frying times, as shown in Figure 5.
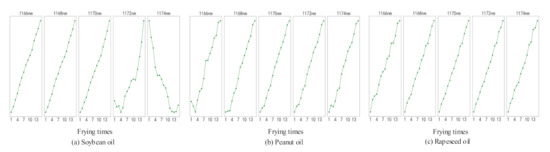
Figure 5.
The relation between the Seg384 band with frying times of three kinds of oils.
By analyzing Figure 5, it is found that the wavelength at 1174 nm in soybean oil is decreasing, and the other wavelengths are with a growing trend. The wavelengths at 1168 nm and 1170 nm in the three kinds of oils increase monotonically with the increase of frying times. In the NIRS, an absorption peak at 1170 nm identifies the presence of an olefin functional C-H bond [25]. Besides, the diglyceride contained in the TPC undergoes a series of oxidation reactions during the frying process, and olefins are formed during the intermediate reaction [26]. Therefore, 1170 nm is closely related to the TPC content in frying oil. Moreover, the starch in the French fries has no effect on the absorbance at a wavelength of 1170 nm [25], which can eliminate the influence on the analysis caused by the continuous addition of French fries. In summary, 1170 nm can be used as the characteristic wavelength for predictive analysis of frying times.
3.3. Model Establishment and Evaluation
Centering on 1170 nm, 2 nm, 4 nm, and 6 nm are left and right intervals and absorbances of two wavelengths are respectively obtained, and differential processing is performed, that is, and , and , and . The mean values of the variances of the three kinds of oils at intervals of 2 nm, 4 nm, and 6 nm are shown in Table 1. The smaller the mean value of variance is, the tidier the data is, that is, the better the linear correlation between the differential value and frying times is.

Table 1.
Mean values of variance of the three kinds of oils at intervals of 2 nm, 4 nm, and 6 nm.
It can be seen from the data in the table that the mean value of the variance of the three frying oils increases with the increase of the interval. When the interval is 2 nm, that is, the wavelengths are 1168 nm and 1172 nm, the mean value of variance is the smallest. To eliminate the effect of discrete data on the overall data, Z-score was used to process the difference curves at wavelengths of 1168 nm and 1172 nm. At the same time, to determine the value range of the model, the data after the Z-score of three kinds of oils were averaged, as shown in Figure 6.
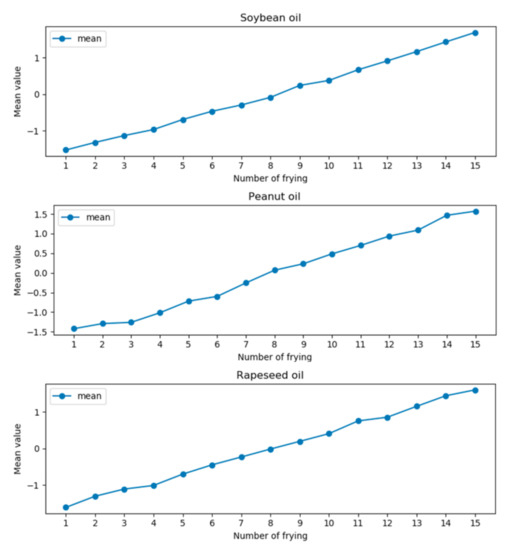
Figure 6.
The mean curves of the three types of oils are calculated by the Z-score.
It can be seen from Figure 6 that the mean curves of the three types of frying oils gradually increase. Therefore, the value range of the model can be determined according to the mean value after Z-score and, then, the frying times can be predicted. The value range and the corresponding number of frying times are shown in Table 2. When the predicted value is within a certain numerical range of the table, the current value is predicted as the number of frying times corresponding to the interval.
Table 2.
The relationship between the size of the threshold and frying times.
The last two rounds of the experimental samples of the three kinds of frying oils were used as verification samples. To ensure the consistency of the experimental operation, the original spectral data of two characteristic wavelengths of 1168 nm and 1172 nm were selected for differential and Z-score processing. The mean and standard deviation need to be determined when z-score processing is carried out on the difference values of verification samples. The mean value and standard deviation of the original absorbance at 1168 nm and 1172 nm selected from the first eight rounds of experimental samples of each oil were taken as the fixed mean value and standard deviation of the model, as shown in Table 3. Among them, the mean and standard deviation obtained from soybean oil are approximately equal to the mean and standard deviation determined by Liu [24].
Table 3.
The fixed mean and fixed standard deviation obtained by the training sets of three frying oils.
To verify the accuracy of the model, the original spectral absorbance corresponding to the two characteristic wavelengths of the sample spectrum 1168 nm and 1172 nm are selected for differential processing, and the result is subjected to Z-score processing based on the mean and standard values in Table 3. Finally, the value calculated by Z-score is compared with the range of the model to determine the number of frying of each frying oil.
Comparing the predicted values with the data in Table 2, frying times corresponding to each data of the two verification samples of each frying oil can be obtained and compared with the actual frying times to determine the accuracy of the model. The predicted curve of frying times is shown in Figure 7. If the allowable error is ± 1, the prediction accuracy will be 100%. Based on the threshold and the differential prediction model, the frying times of soybean oil, peanut oil, and rapeseed oil are directly obtained within the allowable error range by detecting 1170 nm. This method simplifies the experimental operation and data processing and realizes the fast detection of frying times.
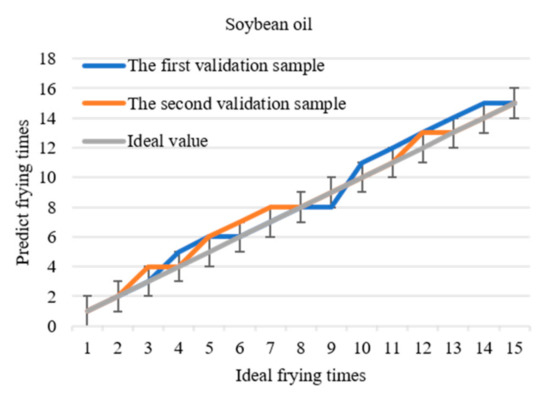
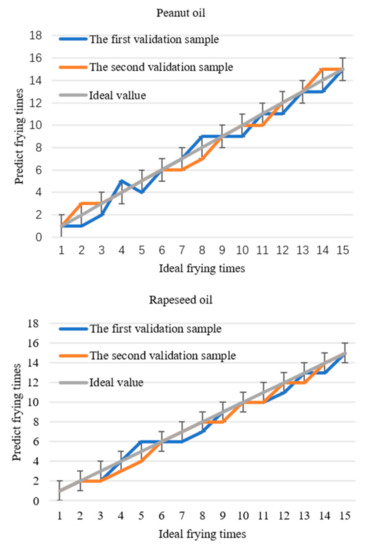
Figure 7.
The relationship between the predicted frying times of the three frying oils and the actual frying times.
4. Conclusions
In this paper, the frying times of soybean oil, peanut oil, and rapeseed oil were detected by near-infrared spectroscopy, and the quality of the frying oil was evaluated. Firstly, the spectral data of the three frying oils were pretreated by several pretreatment methods, such as 1D, MSC, and SNV. Then, 1D was determined as a pretreatment method by comparison. Based on pretreatment, the characteristic spectral wavelengths of the three frying oils were extracted. It can be found that the spectral data of the three frying oils in the vicinity of 1170 nm increased with the frying times. According to the experiment, the upper and lower limits of the different intervals of the data corresponding to each frying are determined, and frying times were predicted by this method. The experimental results show that the established differential prediction method has a prediction accuracy of 100% for the frying times within the tolerance of ± 1. We hope that our proposed differential prediction model can effectively detect the frying times of the three kinds of frying oils, and then better evaluate the quality of frying oil.
Author Contributions
The contributions of the authors are provided below. Formal analysis, Y.L. and Z.R.; funding acquisition, L.S.; investigation, Y.L.; resources, L.S.; writing—original draft, Y.L.; writing—review and editing, Y.L., L.S., and H.B. All authors have read and agreed to the published version of the manuscript.
Funding
This research was funded by the HLJU Heilongjiang University, grant number YJSCX2019-168HLJU.
Acknowledgments
The authors acknowledge the support of Heilongjiang University.
Conflicts of Interest
The authors declare no conflict of interest.
References
- Moreira, R.G.; Castell-Perez, M.E.; Barrufet, M.A. Fried Product Processing and Characteristics. In Deep-Fat Frying: Fundamentals and Applications; Aspen Publishers Inc.: Frederick, MD, USA, 1999; pp. 11–31. [Google Scholar]
- Sun, Y.; Zhang, M.; Fan, D. Effect of ultrasonic on deterioration of oil in microwave vacuum frying and prediction of frying oil quality based on low field nuclear magnetic resonance (LF-NMR). Ultrason. Sonochem. 2019, 51, 77–89. [Google Scholar] [CrossRef]
- Castejón, D.; Herrera, A.; Heras, A.; Cambero, I.; Mateos-Aparicio, I. Oil quality control of culinary oils subjected to deep-fat frying based on NMR and EPR Spectroscopy. Food Anal. Methods 2017, 10, 2467–2480. [Google Scholar] [CrossRef]
- Debnath, S.; Rastogi, N.; Krishna, A.G.; Lokesh, B.R. Effect of frying cycles on physical, chemical and heat transfer quality of rice bran oil during deep-fat frying of poori: An Indian traditional fried food. Food Bioprod. Process. 2012, 90, 249–256. [Google Scholar] [CrossRef]
- Gertz, C.; Behmer, D. Application of FT-NIR spectroscopy in assessment of used frying fats and oils*. Eur. J. Lipid Sci. Technol. 2014, 116, 756–762. [Google Scholar] [CrossRef]
- Gil, B.; Cho, Y.J.; Yoon, S.H. Rapid determination of polar compounds in frying fats and oils using image analysis. LWT 2004, 37, 657–661. [Google Scholar] [CrossRef]
- Yang, J.; Zhao, K.; He, Y. Quality evaluation of frying oil deterioration by dielectric spectroscopy. J. Food Eng. 2016, 180, 69–76. [Google Scholar] [CrossRef]
- Farhoosh, R.; Tavassoli-Kafrani, M.H. Simultaneous monitoring of the conventional qualitative indicators during frying of sunflower oil. Food Chem. 2011, 125, 209–213. [Google Scholar] [CrossRef]
- Aniołowska, M.; Kita, A. The effect of type of oil and degree of degradation on glycidyl esters content during the frying of french fries. J. Am. Oil Chem. Soc. 2015, 92, 1621–1631. [Google Scholar] [CrossRef]
- Aniołowska, M.; Kita, A. The effect of frying on glycidyl esters content in palm oil. Food Chem. 2016, 203, 95–103. [Google Scholar] [CrossRef]
- Srivastava, Y.; Semwal, A.D. A study on monitoring of frying performance and oxidative stability of virgin coconut oil (VCO) during continuous/prolonged deep fat frying process using chemical and FTIR spectroscopy. J. Food Sci. Technol. 2013, 52, 984–991. [Google Scholar] [CrossRef]
- Uriarte, P.; Guillén, M.D. Formation of toxic alkylbenzenes in edible oils submitted to frying temperature. Food Res. Int. 2010, 43, 2161–2170. [Google Scholar] [CrossRef]
- Ramadan, M.F.; Sharoba, A.M. Rheological characteristics of vegetable oils as affected by deep frying of French fries. J. Food Meas. Charact. 2014, 8, 171–179. [Google Scholar] [CrossRef]
- Li, X.; Li, J.; Wang, Y.; Cao, P.; Liu, Y. Effects of frying oils’ fatty acids profile on the formation of polar lipids components and their retention in French fries over deep-frying process. Food Chem. 2017, 237, 98–105. [Google Scholar] [CrossRef]
- Feng, H.; Li, Y.; Sui, X.; Qi, B.; Wang, Z.; Jiang, L.; Cao, W. Effect of frying cycles on polar components in soybean oil and absorbed lipids of fried potatoes. Trans. Chin. Soc. Agric. Eng. 2016, 32, 309–314. [Google Scholar] [CrossRef]
- Sánchez-Muniz, F.J.; Cuesta, C.; Garrido-Polonio, C. Sunflower oil used for frying: Combination of column, gas and high-performance size-exclusion chromatography for its evaluation. J. Am. Oil Chem. Soc. 1993, 70, 235–240. [Google Scholar] [CrossRef]
- Liu, H. Study on 3-Chloropropanol Esters and Glycidyl Esters during Frying Process. Master’s Thesis, Henan University of Technology, Henan, China, 2018. [Google Scholar]
- Wang, R.; Sun, W.; Pang, W.; Cai, X.; Gao, B. Hygienic Standard for Edible Vegetable Oils Used in Frying Foods. In State Standard of the People’s Republic of China, 3rd ed.; Ministry of Health, People’s Republic of China: Beijing, China, 2003; GB7102.1. [Google Scholar]
- Jiang, T.; Wei, W. Research on the change of soybean oil quality during the frying process. J. Anhui Agri 2015, 43, 279–281. [Google Scholar] [CrossRef]
- Porep, J.U.; Kammerer, D.R.; Carle, R. On-line application of near infrared (NIR) spectroscopy in food production. Trends Food Sci. Technol. 2015, 46, 211–230. [Google Scholar] [CrossRef]
- Yan, L.; Zhang, Q.; Miao, W.; Shen, X. Research progress on analysis of edible vegetable oils using near-infrared spectroscopy. J. Food Saf. Qual. 2017, 8, 1521–1526. [Google Scholar] [CrossRef]
- Picouet, P.A.; Gou, P.; Hyypiö, R.; Castellari, M. Implementation of NIR technology for at-line rapid detection of sunflower oil adulterated with mineral oil. J. Food Eng. 2018, 230, 18–27. [Google Scholar] [CrossRef]
- Pereira, C.G.; Leite, A.I.N.; Andrade, J.; Bell, M.J.V.; Anjos, V. Evaluation of butter oil adulteration with soybean oil by FT-MIR and FT-NIR spectroscopies and multivariate analyses. LWT 2019, 107, 1–8. [Google Scholar] [CrossRef]
- Liu, Y.; Li, J.; Li, Y.; Zhang, D.; Song, Z.; Zhang, C.; Pan, X.; Li, J.; Wang, Z. Quality evaluation of fried soybean oil base on near infrared spectroscopy. J. Food Process. Eng. 2018, 41, e12887. [Google Scholar] [CrossRef]
- Weyer, L.; Workman, J., Jr. Practical Guide to Interpretive Near-Infrared Spectroscopy; CRC Press: Boca Raton, FL, USA, 2007. [Google Scholar]
- Mu, Z.; Liu, Y.; Wang, X. Study on polar components of heated frying oil using liquid chromatography. Sci. Technol. Food Ind. 2008, 9, 32. [Google Scholar] [CrossRef]


Publisher’s Note: MDPI stays neutral with regard to jurisdictional claims in published maps and institutional affiliations. |
© 2020 by the authors. Licensee MDPI, Basel, Switzerland. This article is an open access article distributed under the terms and conditions of the Creative Commons Attribution (CC BY) license (http://creativecommons.org/licenses/by/4.0/).