Abstract
The crystal plasticity finite element method, modeled on a realistic microstructure image, was developed to investigate the evolution of slip systems in grains of α/β titanium alloys during quasi-static tensile testing. By analyzing the data of slip evolution of simulation during the overall plastic deformation process, it was found that the prismatic slip systems in the α phase and the {112} <111> slip systems in the β phase played a leading role. By calculating the Schmid factors, it was found that the values calculated from the local stress, which was represented by major principal stress, were larger than the values calculated from the primary uniaxial tensile direction, which was due to the deviation of the local stress direction from the primary uniaxial tensile direction. Furthermore, the deviation of local stress of α phase was different from that of β phase, which was related to the deformation mechanism. During the deformation, the stress and strain were concentrated in the grains of the α phase, producing a driving effect on the neighboring grains of the β phase. Subsequently, the incompatible deformation produced the concentration of strain at the grain/interphase boundary, thus strengthening the grain interactions and leading to the deviation.
1. Introduction
It has been reported that the mechanical properties of titanium and titanium alloys are greatly influenced by their microstructure [1,2,3]. In particular, the effect of the phase ratio, size and morphology of the α and β phases makes it more difficult to accurately regulate their mechanical properties. By reviewing the literature, it was found that the plastic deformation of titanium alloys at room temperature included both dislocation slip and twinning [4,5,6,7,8,9]. However, the twinning mode of duplex titanium alloys is nearly completely suppressed because of the fine microstructure and high solute contents. Therefore, dislocation slip is the dominant factor that determines the plastic deformation of duplex titanium alloys at room temperature. Dislocation slip causes slip lines and it results in a height difference on the crystal surface, with a number of slip lines constituting a slip band. Extensive studies have been devoted to slip bands in crystalline materials. For example, some studies analyzed the activation of slip systems and the slip transfer of titanium alloys at different deformation amounts based on the Electron Backscatter Diffraction (EBSD) [10,11] method. Some works have been devoted to the understanding of the interaction between slip bands and grain boundaries in commercial pure titanium at different strain values by using high-resolution EBSD (HR-EBSD) [12]. In addition, investigations have indicated a correlation between the size of slip bands and the dislocation structure by using Atomic Force Microscope (AFM) and Transmission Electron Microscope (TEM) [13], or have identified the main slip system during plastic deformation by using AFM and Scanning Electron Microscope (SEM) [14]. However, the majority of the literature studies dealt with the slip process analysis, making only limited attempts to characterize the morphology of the slip bands, and in many cases, no clear explanations were made, such as the evolution of slip systems, the variation of stress and strain field, and the influence of grain interactions on the evolution of slip systems during the plastic deformation process. Along with the rapid development of computer software and hardware technology, the crystal plasticity finite element simulation method (CPFEM) provides the possibility of solving the above problems. It describes the mechanical behavior of different crystal orientations by adopting different constitutive parameters, and fully considers the crystal structure type, the slip system activation, the density of geometrically necessary dislocations, the hardening effect and the orientation change, which greatly increase the reliability of the analysis [15,16,17]. In recent years, many studies have been devoted to simulating the evolution of slip bands. Zhang et al. [18] proposed an approach for modeling slip bands, which qualitatively captures the experimentally observed slip band behavior of the α phase in Ti-6Al-4V by using the CPFEM to explain the slip softening due to breakdown of the short-range order between Ti and Al atoms. A local approach coupling AFM observations and polycrystal finite element calculations was proposed by Aubert et al. [19], which was able to determine, at the local discrete scale, the mean slip band spacing and the number of dislocations, which were helpful to further predict the environment sensitive fracture of alloys. Du et al. [20] studied slip system activation by uniaxial micro-tensile tests on single crystal ferrite samples with different orientations and demonstrated that the boundary constraints acting on the primary slip direction triggered an increase of the Schmid factors (SFs) of the activated secondary slip systems. Zhang et al. [21] studied micro slip activation and localization in Ti-6Al-4V quantitatively using high-resolution digital image correlation (HR-DIC), HR- EBSD and crystal plasticity finite element modeling, finding the texture beneath the characterized free-surface can affect the local slip, stress distribution, lattice curvature, and GND density.
Progress has also been made in the numerical simulation of complex interactions of polyphase systems. Jason et al. [22] developed a duplex phase bimetal CPFEM model of Cu-Nb multilayer composites, which was compared with a multicrystal model. The results showed that co-deformation constraints imposed by the bimetal interfaces are strong, while those by neighboring grain boundaries are relatively weak. Some researchers have adopted a method of representative volume element (RVE). For instance, Woo et al. [23] studied the stress–strain relationship between the ferrite and martensite phases in the commercial duplex DP980 steel and determined the microscopic hardening parameters for each phase by the CPFEM based on the RVE. The parameters successfully captured the influence of the crystallographic orientation of the ferrite phase on the localization of shear strain during uniaxial tension. Vajragupta et al. [24] employed a 2D RVE of duplex DP600 steel on the basis of a real microstructure. The authors successfully simulated the failure behavior of the steel and quantitatively described the interrelation between ductile damage in ferrite and the cleavage fracture of martensite under multi-axial loading conditions. In addition, the method of cellular automata (CA) was adopted. For example, Sommitsch et al. [25] developed a CA model with which both virtual and real microstructures can be generated or imported into, and successfully simulated the grain growth of a single phase material (austenitic stainless steel 304L) and a dual phase-material (Ti-6Al-4V). Wu et al. [26] presented a CA model to predict the morphological evolution, average grain size, topological characteristics and the coarsening kinetics of the TA15 alloy during static coarsening and found that the predicted coarsening kinetic constant increased with the volume fraction of the α phase and that a larger initial grain size led to slower coarsening.
Although some research on the modeling of polyphase materials and the interphase interactions has made progress, some deficiencies still exist. For example, in view of the simulation of slip band evolution, Zhang et al. [18,21] adopted a duplex titanium model; however, the authors analyzed the slip evolution of the α phase while the analysis of the β phase was lacking. Furthermore, for the relationship between slip system activation and the SFs, they reported a phenomenon where the basal slip system activation occurs preferentially with lower SFs [10]. However, their work lacked further discussion and quantitative analysis. In addition, for the grain interactions, Zhang et al. [21] found the initial inter-granular misorientations greater than about 5° can influence the subsequent micromechanical grain behavior including slip, lattice rotation and GND density. However, in this study, the initial misorientation was measured by EBSD and the data during the deformation process was lacked. In addition, the author proposed a single-phase model, which resulted in the impossibility of analyzing the grain interactions of different phases.
In this study, which was based on in-situ tensile testing of duplex titanium (Ti- 5Al-2.5Cr-0.5Fe-4.5Mo-1Sn-2Zr-3Zn), a CPFEM model, which was based on a realistic microstructure image, has been developed to investigate the activation of slip systems in the α and β phases, as well as the correlation between the grain interactions and slip system evolution during the plastic deformation at room temperature. In addition, we addressed the problem of slip system evolution in duplex titanium alloys. The influence of the local stress state of grains was explained by calculating the SFs. The related work was helpful to further understand the quasi-static process of duplex titanium alloys at room temperature.
2. Experimental Methods and Simulations
2.1. Material and Characterization Techniques
The material used in this study with the nominal composition Ti5Al2.5Cr 0.5Fe4.5Mo1Sn2Zr3Zn was cut into dog-bone-shaped specimens, which were produced with a gauge length of 15 mm and a width of 4 mm (see Figure 1b). According to quantitative statistics of grain information, the ratio of volume fraction of the α and β phases in the region of interest (ROI) was ~6:4. The quasi-static tensile experiment was performed on an INSTRON 5565 with a constant strain rate of ~10−3/s. The tensile test was stopped at strains of 2.4%, 4%, 7.8%, and 15.5% in order to image with SEM before the final fracture.
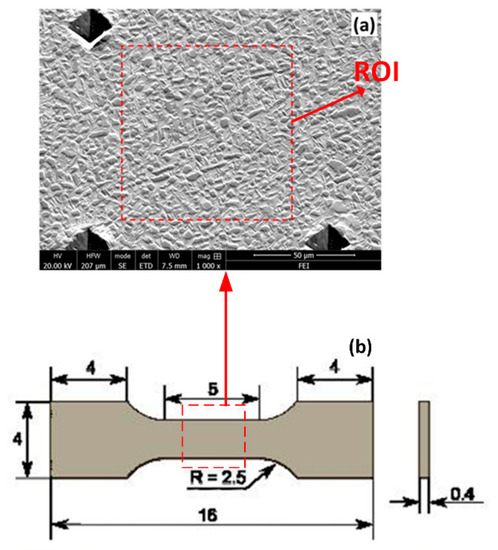
Figure 1.
(a) SEM image of the duplex titanium alloys at room temperature. (b) Sample and its dimensions.
The EBSD test had strict requirements on the surface of the sample and it needed to be polished before the test. In this study, the sample was polished to #1500 by SiC abrasive paper and etched in a solution of 2% HF, 10% HNO3, and 88% H2O. In addition, the sample was electropolished at a voltage of 25 V for 30 s at room temperature in an electrolyte of 6% HClO4, 34% CH3(CH2)3OH, and 60% CH3OH to remove the residual stress and improve the surface quality.
The ROI was 90 μm × 90 μm (see Figure 1a), which was marked by micro indentation at the center of the gauge area for the convenience of subsequent observation. Detailed microstructures were analyzed by using a FEI Nanosem 430 field emission scanning electron microscope (SEM, HITACHI S-4800N, Tokyo, Japan) operating at 20 kV and the results were analyzed by using Oxford HKL Channel 5 software.
2.2. Simulation Methods
2.2.1. Crystal Plasticity Models
The deformation of crystalline materials is a complicated process, which is not only related to macro factors, such as loading direction, rates, deformation amount, etc., but also to some micro factors, such as crystal orientations, microstructure and deformation mechanism. The mechanical behaviors of materials are closely related to the loading direction due to the anisotropy of elastic tensor of the material. Besides, the microstructure of materials has crystallographic orientation, which results in the different properties of polycrystalline materials under different loading direction during the elastoplastic transformation process. In the numerical simulation research based on the phase structure of alloy materials, the mechanical constitutive phase of each constituent phase can be simplified into an isotropic constitutive model. In the CPFEM, the anisotropic constitutive parameters used for different crystal orientations and the factors such as the crystal structure type, slip deformation, hardening effect, and the change of crystal orientation are considered, which make the simulation calculations more accurate.
The model was developed from an EBSD image. The local area selected was 16.5 μm × 10.1 μm (see Figure 2a). The area consisted of 12 grains, including seven α-phase grains and five β-phase grains. The grains were numbered (i.e., ①, ②, ③, and so on) and the excel file including crystal structure, centroid position, Euler angles (φ1, ϕ, φ2) was output by channel5 software. Based on the RGB values of the image pixels, a 2D finite element model was developed. However, the 2D model used the plane strain or plane stress assumption, which may affect the accuracy of the simulation. Therefore, a unit thickness finite element model was established with 8-node 3D hexahedron solid elements, using the microstructure-based finite element model construction software developed by our group [27] (see Figure 2b), so it is called a 2.5D finite element model [19,28], which can reduce the calculation time and well reflect the actual situation. Each grain was considered as a single crystal, with a uniform crystallographic orientation, and its Euler angle was determined by centroid result. The model was meshed into 165 × 101 × 1 elements, with each element having dimensions of 0.1 μm × 0.1 μm × 0.1 μm. To simulate the quasi-static tensile experiment, boundary conditions were defined to obtain a uniaxial average stress state while upside and downside were a traction-free surface. Then, homogeneous normal displacement, i.e., in the loading direction X, was prescribed on left side in order to correspond to strains imposed during the experiments described in Figure 2d, which produced a displacement of 2.56 μm at 1.55 × 10⁵ ms. Constraints on right side are defined in order to keep the face in stationary state. Finally, a total of 155 steps of loading were performed while the total deformation was 15.5%, and the commercial software Ansys/LS-Dyna was used to simulate the deformation process. Besides, we expanded the functions of Ansys/LS-Dyna [29] and the specific process is as follow:
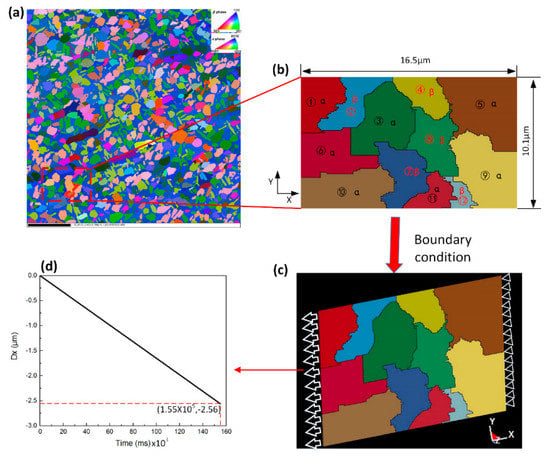
Figure 2.
Process of developing the crystal plasticity finite element simulation method (CPFEM): (a) the Electron Backscatter Diffraction (EBSD) inverse pole figure (IPF) mapping, (b) 2.5D finite element model, (c) boundary condition, (d) displacement-time curve.
(1) Read the parameter file containing the slip systems, elastic constants, critical resolved shear stress (CRSS), hardening coefficient, crystal orientation information, and stress–strain information in the sample coordinate system.
(2) Through the rotation matrix g, the mapping relationship between the sample coordinate system and the crystal coordinate system is established, so that the input constitutive parameters can be converted during the calculation.
(3) Start the simulation under the current loading step and the mechanical response behavior of the model is obtained. Based on the projection relationship of the strain increment of the grain, the change of the Euler angle is calculated, which is added to the original Euler angle to represent the rotation of the grain.
(4) In the crystal coordinate system, the total stress Σσc,ij is obtained by accumulating the stress increments calculated from the previous steps. The τRSS is defined as:
where φ1 and φ2 are respectively the angles between the normal direction and the tangential direction of the slip surface and the Σσc,ij direction, c is the crystal coordinate system. The activation of slip systems is determined by comparing with the CRSS, τ0. If τRSS > τ0, the slip system is activated and the grain enters the plastic deformation stage. With the activation of slip systems, the CRSS changed because of the strain hardening:
where τi is the increment of CRSS, γj is the shear strain rate of the slip system j, Γ is the accumulating increment of shear strain of the slip system, hij is the hardening coefficient.
(5) In this simulation, it is considered that plastic deformation is caused by slip and the plastic strain is the cumulative value of resolved shear strain of all slip systems. According to the state of the grain, it is determined that the grain is in the elastic stage or plastic stage. After that, the instantaneous stiffness matrix is obtained, and the total stiffness coefficient matrix can be calculated:
where L is the stiffness coefficient matrix, p and e represent respectively in the plastic stage and elastic stage.
(6) Use the updated constitutive parameters to continue the next step of the finite element calculation until the last step.
2.2.2. Constitutive Parameters of Single Phase
The constitutive parameters of the titanium in this study were determined by synchrotron radiation carried out at the Advanced Photon Source 11-ID-C station in the Argonne National Laboratory in the US [30]. The X-ray energy (E) and its wavelength (λ) function are derived from De Broglie relation and the formula for the calculation is as follows:
E [keV] = 12.393/λ [Å]
The Fit2D software was used to analyze the data, mainly regarding the crystal plane spacing of each phase during the tensile process by Bragg’s law (2d sinθ = Nλ). Subsequently, calculating the lattice strain ε:
and fitting to determine the constitutive parameters of each phase. Furthermore, dhkl is the crystal plane spacing of (h k l) at different deformations and d0,hkl is the initial crystal plane spacing before loading.
In order to determine the constitutive parameters of single phase, the first step was to obtain the elastic constants of the single crystal [30]. Comparing the elastic stiffness Ehkl of experiment and self-consistent fitting by:
the fitted single-crystal elastic constants Cij (GPa) of the α and β phases was shown in Table 1.

Table 1.
Single-crystal elastic constants Cij (GPa).
Furthermore, the modified Vocé equation [30] is used to calculate the strain hardening effect of the slip system, i, in a single crystal:
where Γ is the accumulating increment of shear strain of all slip systems during deformation, τ is the transient flow stress. The deformation at early stage is characterized by CRSS (τ0) and hardening coefficient θ0. The deformation at later stage is characterized by (τ0 + τ1) and θ1. The values of CRSS and hardening coefficient used in this study were shown in Table 2.
Table 2.
The critical resolved shear stress (CRSS) and hardening coefficient of slip systems [30].
2.2.3. Misorientation Angle
The misorientation angle between two objects is defined as the smallest rotation angles among equivalent rotations relating two given orientations of the objects, which is generally used to characterize the rotation of the grains. For duplex titanium alloys, because the α phase has a hexagonal lattice structure, it is necessary to convert the three-axis coordinate system (hkil)[uvtw] to the four-axis coordinate system (HKL) [UVW]:
The misorientation matrix M is defined as:
where g1 is the orientation matrix before deformation and g2 is the orientation matrix after deformation. Furthermore, the real misorientation matrix M’ is calculated by M and the symmetry operator T:
There are 12 symmetry operator matrices for the α phase and 24 symmetry operator matrices for the β phase. Therefore, the M’ has a number of equivalent solutions and the smallest one was chosen in this study. Finally, the misorientation angle θ was calculated:
For the misorientation angles between the α and β phases, the (0001) plane of hexagonal crystal structure is parallel to the (011) plane of the cubic crystal structure and the crystal direction of the hexagonal crystal structure is parallel to the crystal direction of the cubic crystal structure. As a result, the (0001) plane of the α phase and the (011) plane of the β phase were determined in this study to calculate the misorientation angles.
2.2.4. Resolved Shear Strain
Based on the crystal plasticity theory [31,32] and the Schmid’s law [33], it is considered that when the shear stress of the slip system reaches the critical resolved shear stress (CRSS), the slip system becomes active:
where m is the SF, and are the shear stress and the shear strain, respectively, σ and ε are the axial stress and the axial strain in the crystal coordinate system, respectively. In this simulation, a total of 155 steps of loading were performed and each step provided strain increment, (the rotations were disregarded):
where is the resolved shear strain increment. Therefore, the shear strain of slip systems at step i, , can be calculated by accumulating (see Figure 3):
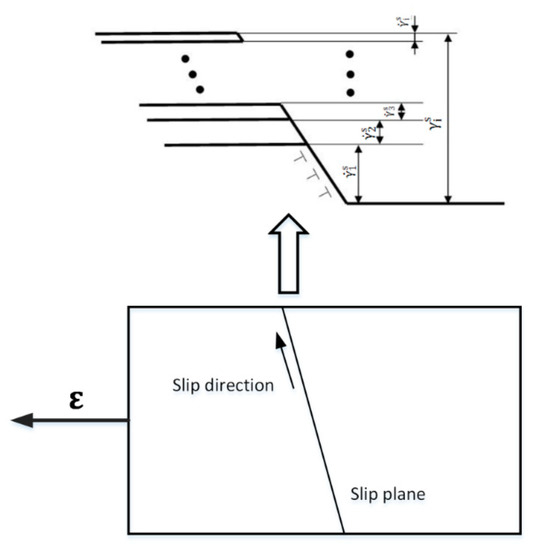
Figure 3.
Schematic diagram of the shear strain increment in every step and the shear strain at the step i, .
2.2.5. Determination of Slip Trace
The slip trace was the intersecting line between the slip plane and the grain surface (the X-Y plane in this study), as shown in Figure 4. Fitting the slip systems and the rotation matrix g can transfer the slip plane from the crystal coordinate system to the sample coordinate system. A slip trace can be determined when the slip plane intersects with the grain surface and the angle between the simulation slip trace and X-axis is calculated, which should be compared with the experiment result.
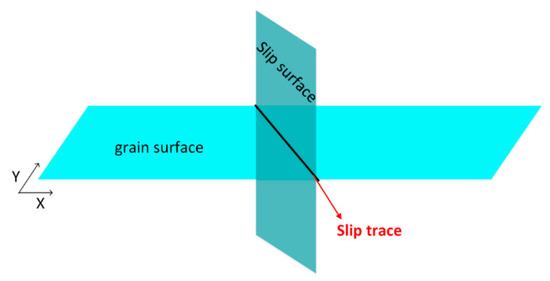
Figure 4.
Schematic diagram of slip trace.
3. Discussion
3.1. Reliability Verification
To confirm the reliability of the quasi-static tensile simulation of duplex titanium alloys, the true stress–strain curves obtained by simulation and experiment are shown in Figure 5. The values of relative error are calculated by (Sim. − Exp.)/Exp. × 100%. When the macro strain was 2.4%, 4%, 7.8%, and 15.5%, the values of relative error are −2.63%, 0.25%, 1.39%, and 4.92%, respectively. It was found that the results of the CPFEM were in good agreement with the experimental results.
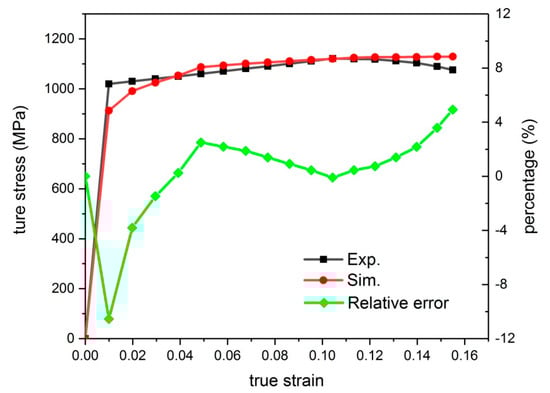
Figure 5.
Comparison of true stress–strain curves and the relative error of experiment and the CPFEM simulation.
The grains of No.2, No.5, No.6, and No.9 (see Figure 2b) with obvious slip traces were selected and the activation of slip systems was analyzed statistically at the deformation of 15.5%. The gray figures were SEM images, and the color figures are simulation results. The information provided on sample surface by slip traces may be misleading if the “visibility coefficient”, that is the inclination of the Burgers vectors on that surface, is not carefully examined. Therefore, errors may exist in the Figure 6. In spite of that, we believe that the results are still acceptable, because the slip traces of experiment and simulation agree very well with each other. Subsequently, the angles of slip traces were calculated by the method described in Section 2.2.5, which were compared with experiment (see Figure 6). It was found that the maximum error was 9.825°, as determined by of grain No. 6, while its simulation angle was 30.175° and the experimental value was 40°. In addition, the minimum error was 0.446°, which was determined by of grain No. 9, while the simulation angle was 109.654° and the experiment was 110°. Furthermore, by calculating statistically, the average error was only 4.667°. In conclusion, the simulation results were in good agreement with the experimental results.
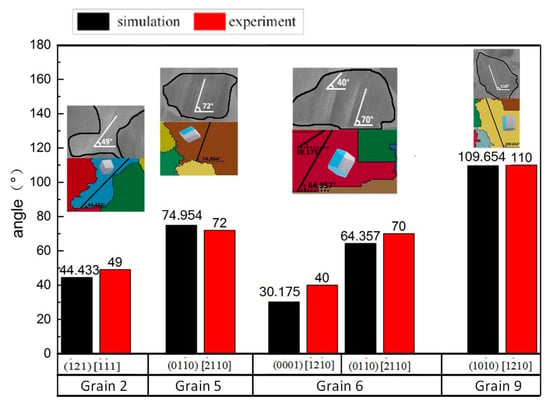
Figure 6.
Comparison of slip traces between simulation and experiment of the slip systems activated in different grains (the gray figures were SEM images, and the color figures are simulation results).
3.2. Evolution of Stress and Strain
To further analyze the evolution of stress and strain, the Von Mises effective stress and effective strain field at macro strains of 0.1%, 0.7%, 1.2%, 4%, 7.8%, and 15.5% are shown in Figure 7. Considering the needs of comparison and analysis, the figures were scaled to the same size. It can be found that the tendencies of Von Mises effective stress and effective strain are somewhat different. At the beginning, the initial stress and strain were relatively small. As the strain increases, the stress also increases. When entering the plastic stage, the stress value increases to a certain value and remains unchanged, while the accumulated strain continues to increase.
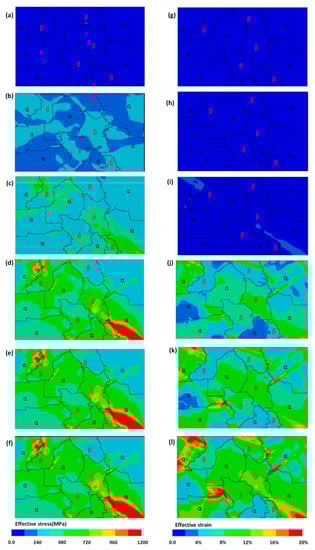
Figure 7.
Stress and strain fields at macro strain = 0.1%, 0.7%, 1.2%, 4%, 7.8%, and 15.5%: (a–f) Von Mises effective stress field; (g–l) effective strain field.
As can be seen from Figure 7a–d, the inhomogeneous distribution of stress became more evident with the development of deformation. It was found that the maximum stress was 333 MPa and the minimum was 162 MPa at a macro strain of 0.7%. However, at the macro strain of 4%, there were some grains whose internal stress was higher than 1000 MPa and some grains whose internal stress was lower than 300 MPa. Furthermore, a high stress concentration was observed at the grain/interphase boundary, which may be related to the incompatible deformation of grains. As can be seen from Figure 7e,f, the grains at low stress maintained the same status.
According to the statistics, when the macro strain was less than 0.7%, the average stress of the α phase increased by ~120 MPa for every 0.1% macro-strain increment, while the average stress of the β phase increased by ~104 MPa. When the macro strain was 0.7%, the average stress of the α phase was 720 MPa and the average stress of the β phase was 624 MPa. When the macro strain was 1.2%, the average stress of the α phase was 1035 MPa and the average stress of the β phase was 1055 MPa, which meant the β phase became the main stress carrier. This was mainly due to the fact that when the macro strain was over 0.7%, the slip systems of the α phase were activated and the simulation entered the stage of plastic deformation. As a result, the ability of the α phase to bear stress decreased and the stress transferred from the α phase into the β phase gradually.
After reaching the macro strain of 0.7%, as shown in Figure 7g,h, the simulation was in the stage of elastic deformation, where the strain within the grains is a constant of 0.7%. After reaching the macro strain of 1.2%, as shown in Figure 7i, the material began to deform by slip and the strain is locally concentrated. In addition, as shown in Figure 7j–l, it can be seen that the localized strain concentration developed with increasing macro strain. Firstly, after reaching the macro strain of 4%, the maximum strain is 11% and the minimum is 2%. At the macro strain of 7.8%, there are regions where the strain is less than 4% and regions where the strain is more than 16%. Finally, when the macro strain was 15.5%, there was no region where the strain was less than 4% and the region where the strain was greater than 16% increases further. The localized concentration mainly related to the grain orientation changes and the grain interactions, which will be specifically analyzed in Section 3.3.2 and Section 3.3.3.
3.3. Evolution of Slip Systems
3.3.1. Activation of Slip Systems
In order to further study the grain interactions of different phases during the plastic deformation, it was necessary to analyze the evolution of slip systems. In this simulation, a total of 155 load steps (macro strain = 15.5%) were carried out to analyze the data of the slip systems, as shown in Figure 8, where the relative frequency meant the ratio of the number of the activated slip systems to the total number activated. In this figure, the relative frequencies showed a tendency of saturation after the macro strain of 2.4%, but their absolute quantity increased, which was similar to the experimental results reported by Liu et al. [34]. On the basis of the data of the α phase, it is found that the deformation was mainly determined by basal and prismatic slip systems, which was because of the low critical resolved shear stress. With the development of deformation, the pyramidal slip systems activated and the number of pyramidal <c + a> slip systems significantly increased. According to the statistics, after reaching the macro strains of 2.4%, 4%, 7.8%, and 15.5%, the relative frequencies of pyramidal <c + a> slip systems were 31%, 32%, 32%, and 32%, respectively, which was the highest proportion of the corresponding deformation of the α phase.
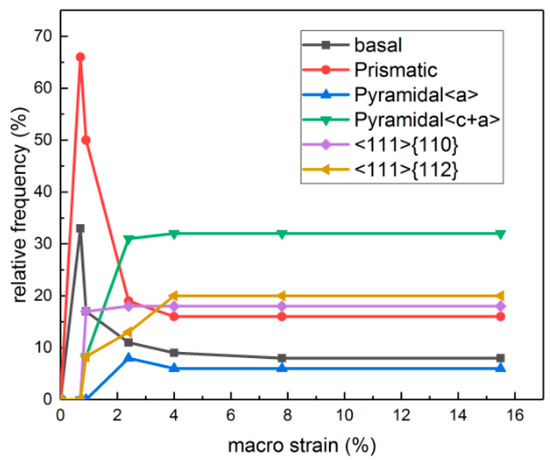
Figure 8.
Activation of slip systems at different macro strains.
By analyzing the slip systems of the β phase, it was found that the slip systems became activated when the step was nine (macro strain = 0.9%), where the relative frequency of {110} <111> was 17% and that of {110} <111> was 8%. With the development of deformation, the relative frequency of {112} <111> gradually increased. When the macro strain was 15.5%, the relative frequency of {110} <111> was 18% and that of {112} <111> was 15%. Therefore, the {110} <111> was the highest proportion during plastic deformation of the β phase. In addition, the proportion of the relative frequency of the β phase increased with increasing macro strain, and it was concluded that the grains of the β phase distorted themselves to adapt to the overall plastic deformation.
In order to determine the slip systems that played a leading role during the plastic deformation of this simulation, the contribution of each slip system to the plastic deformation was further analyzed. When the macro strain was 15.5%, the of the α phase is shown in the bar chart of Figure 9.
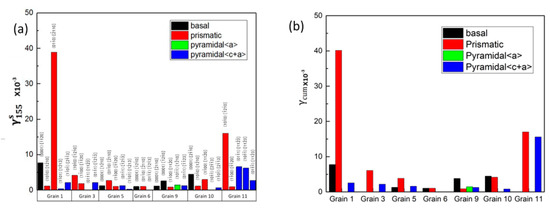
Figure 9.
The (a) and (b) of slip systems of different grains in α phase at macro strain = 15.5%.
According to the data in Figure 9, when the macro strain was 15.5%, the prismatic and basal slip systems accounted for 86% and 14%, respectively, of the slip systems with the highest of each grain in the α phase. In addition, the of the slip system was 38.97 × 10⁻³, which was much higher than others in grain No. 1. This suggested that the slip system was suitable for slip for grain No. 1. For pyramidal<c + a> slip systems, they had lower , while the relative frequency in Figure 8 was 32%, which was more than others. In order to determine the leading role of slip systems during the plastic deformation, the relative frequency and were combined to analyze the contribution of slip systems:
where is the sum of the of the slip system, s.
According to the line chart of Figure 9, the values of the prismatic slip systems were higher than others, especially the that was 40.15 × 10⁻³ in grain No. 1, which means the prismatic slip systems play a leading role during the plastic deformation. Furthermore, the highest of the pyramidal <a> slip system was 1.466 × 10⁻³ in grain No. 9, which was significantly lower than other slip systems. Meanwhile, it was found that the number of activated slip systems was also less than others. Therefore, the contribution of pyramidal<a> to the plastic deformation was the least.
When the macro strain was 15.5%, the and of the β phase are shown in Figure 10. As we can see, some individual{112} <111> slip systems, such as and in grain No. 2, the values were 12.523 × 10⁻³ and 13.271 × 10⁻³, respectively, which were significantly higher than others in the same grain. According to the diagram, it was found that all values of the {112} <111> slip systems were higher than the of {110} <111>, which meant the contribution of {112} <111> to the plastic deformation was much larger than {110} <111>. Therefore, we can draw the conclusion that the {110} <111> slip systems were easily activated because of the lower critical resolved shear stress, while the contribution of them to the plastic deformation is lower than {112} <111>. On the basis that some of the {112} <111> slip systems are much higher than of {110} <111> slip systems, it was considered that the orientation of some of {112} <111> slip systems was conducive to the plastic deformation, as also reported in the literature [14].
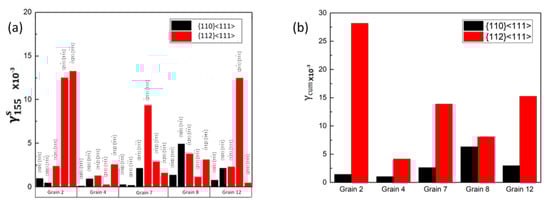
Figure 10.
The (a) and (b) of slip systems of different grains in β phase at macro strain = 15.5%.
3.3.2. Analysis of Schmid Factors
According to the Schmid’s law [35,36], it was believed that when the CRSS was reached, some specific crystal planes would slip along a specific direction, that is, when the shear stress on the slip system reached a critical value, the plastic deformation began. In this study, we adopted the uniaxial tensile simulation, and the SFs were analyzed. For grains with different orientations, the SFs were calculated in the crystal coordinate system and the primary uniaxial tensile direction should be transferred from sample coordinate system to the crystal coordinate system by rotation matrix g (see Equation (1)). After that, the SFs were calculated by the slip system and the transferred loading direction. Therefore, the activation of slip systems in different grains was determined by the SFs.
The distribution of SFs, corresponding to the macro strains of 0.7%, 0.9%, 2.4%, 4%, 7.8%, and 15.5%, is shown in Figure 11. According to the data of α phase, it was shown that the prismatic slip systems with the SFs in a range of 0.1–0.2 activated when the macro strain = 0.7% and 0.9%. When the macro strain reached 2.4%, the SFs lower than 0.1 of pyramidal<a> slip systems activated. In comparison, the SFs of β phase were much larger, especially at the macro strain = 0.9% and 2.4%, it was shown that all the SFs were in the range of 0.4–0.5 when the slip systems activated. When the macro strain reached 4%, there existed SFs lower than 0.1 of {110} <111> and SFs in the range of 0.1–0.2 of {112} <111>.
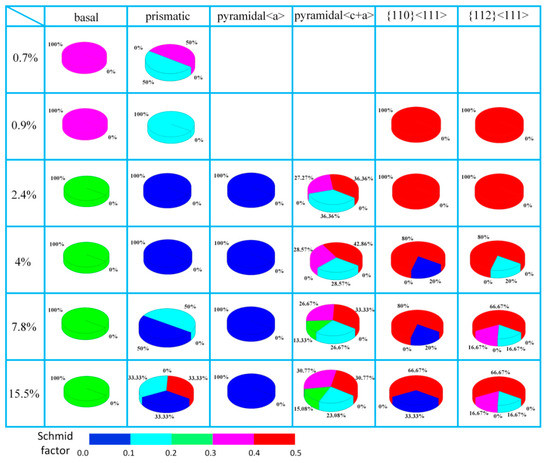
Figure 11.
Distribution of Schmid factors (SFs) at macro strains = 0.7%, 0.9%, 2.4%, 4.0%, 7.8%, 15.5%.
By comparing the difference of the SFs of the α and β phases, it was found that the SFs of the α phase were lower than the SFs of the β phase on the whole, and there was a situation that the slip systems, with lower SFs in the range of 0.1–0.2, became activated preferentially, which was also described in the literature [10]. However, according to the Schmid’s law, the slip system with the higher SF can be activated easily, contrary to the result above. On this basis, an assumption was proposed: the grains of α phase were deviated from uniaxial stress due to grain interactions, which meant the local realistic loading direction of grains of α phase, deviated from the predominant loading direction.
Generally, a resolved shear stress is determined from the full Schmid tensors unless the stress state is uniaxial, what is unlikely for a local stress state. In this study, we analyze the major principal stress to verify the assumption and prove the influence of grain interactions on the SFs quantitatively. For example, when the macro strain reached 0.7%, the prismatic slip systems of grain No. 3 and 11 were activated, while the SF of in grain No. 3 was 0.136 and the SF of in grain No. 11 was 0.321. It was found that the in grain No. 3 should not be the primary slip system. Therefore, as shown in Figure 12a, the macro deformation direction was parallel to X axis, and the direction of major principal stress δ1 deviated from the X-axis and the deviation angle was θ (ignoring the deviation angle between the direction of δ1 and Z-axis), which was used to fit with the Euler angle and recalculate the SFs. As shown in Figure 12b, the θ of grain No. 3 was 30° and the θ of grain No. 11 was close to 0°. After recalculation, the SF of in grain No. 3 was 0.333, which meant that the slip system was easily activated.
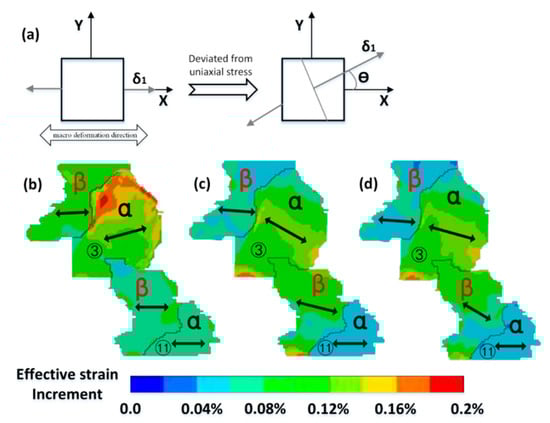
Figure 12.
(a) Schematic diagram of major principal stress; (b) ε = 0.7%; (c) ε = 2.4%; (d) ε = 7.8% effective strain increment fields in the local and the direction of major principal stress.
Therefore, the recalculated SFs were shown in Figure 13. By comparing Figure 11 and Figure 13, it was found that SFs overall were higher in Figure 13 than that in Figure 11, especially for the values of prismatic slip systems and pyramidal<a> slip systems.
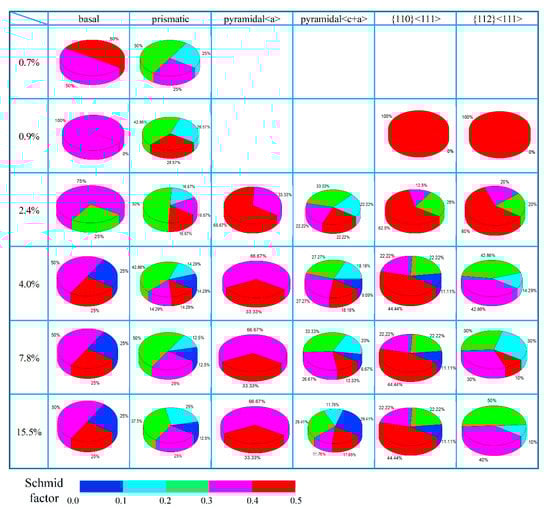
Figure 13.
Distribution of recalculated SFs at macro strains = 0.7%, 0.9%, 2.4%, 4.0%, 7.8%, 15.5%.
The results proved the assumption that some grains of the α phase were deviated from uniaxial stress at the early stage of deformation, which resulted in the deviation of the local stress from the primary uniaxial tensile direction.
Figure 12b–d shows the direction of major principal stress and the effective strain increment fields at macro strains of 0.7%, 2.4%, and 7.8% (the effective strain increment was defined as the increment of effective strain of elements for every increase of 0.1% of macro strain and to show the effect of current step). As shown in Figure 12b, when the macro strain reached 0.7%, the grains of the α phase deviated from uniaxial stress, while the grains of the β phase kept the uniaxial stress. This was mainly due to the fact that the effective strain increment was concentrated on the grains of the α phase, resulting in the inconsistent deformation and the grain interactions, which forced the grains to deviate from the uniaxial stress. Then, as shown in Figure 12c, the effective strain increment of the β phase increased and the direction of major principal stress slightly changed, while it was found that the SFs of the activated slip systems in the β phase were in the range of 0.4–0.5 (see Figure 11). As shown in Figure 12d, the deviation of the β phase further increased, while SFs smaller than 0.1 appeared (see Figure 11), which meant the deviation influenced the activation of slip systems in the β phase.
3.3.3. Analysis of Grain Interactions
In order to study the grain interactions during deformation, the average grain misorientation angles were statistically analyzed (the calculation method is described in Section 2.2.3. As shown in Figure 14a,b, the curves were divided into three stages: macro strain less than 2.4% is stage I; macro strain between 2.4% and 4% is stage II; macro strain more than 4% is stage III. In stage I, the average misorientation angles of the α/α phase decreased, while those of the β/β and α/β phases remain invariant. In stage II, the average misorientation angles of the α/α and α/β phases decreased, while those of the β/β phase remain invariant. In stage III, the average misorientation angles of the α/α and α/β phases decreased, while those of the β/β phase began to increase. Therefore, we can draw the conclusion that the α phase produced plastic deformation first in stage I. When the deformation reached a certain degree (entering stage II), the grains of the α phase forced the neighboring grains of the β phase to deform and rotate. After that, when the deformation caused by “the driving effect” reached a certain degree (entering stage III), the average misorientation angles of the β/β phase began to increase to adapt to the overall deformation.
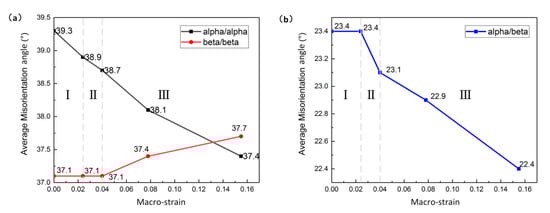
Figure 14.
Average misorientation angle-macro strain curve for (a) α/α and β /β and (b) α/β phases.
4. Conclusions
In this study, the crystal plasticity finite element method (CPFEM), modeled on a α/β realistic microstructure image, was proposed to simulate the quasi-static tensile process to investigate the evolution of slip systems. The following conclusions can be drawn:
(1) A method of slip trace determination based on the CPFEM was proposed. By comparing the angles between the slip trace and the X-axis of the simulation and experiment, the average error was only 4.667°, indicating good reliability of the method.
(2) The mechanism of the slip deformation of an α/β duplex titanium alloy was revealed by analyzing the evolution of slip systems. In the α phase, the prismatic slip systems were activated preferentially with the highest contribution to the plastic deformation. In the β phase, by comparing the sum of contribution to the deformation, it was found that the values of {112} <111> slip systems were much larger than the values of {110} <111> slip systems.
(3) By calculating the Schmid factors, it was found that the values calculated from local stress were larger than the values calculated from primary uniaxial tensile direction, which was due to the deviation of the local stress from the primary uniaxial tensile direction, while the local stress of the α phase more easily deviated than that of the β phase.
Author Contributions
Conceptualization, Q.F.; methodology, Y.Q. and D.W.; software, Y.Z.; validation, X.L. and Y.Q.; writing—original draft preparation, Y.Q.; writing—review and editing, Q.F.; project administration, Q.F.; funding acquisition, Q.F. All authors have read and agreed to the published version of the manuscript.
Funding
This research was funded by the National Natural Science Foundation of China (Grant No. 51571031), and the Chongqing Nature Science Foundation (Grant No. cstc2020jcyj-msxmX0094), and the Joint Research Programs between Belarusian Republican Foundation for Fundamental Research and Beijing Institute of Technology “BRFFR-BIT-2020” (Grant No. BITBLR2020004).
Conflicts of Interest
The authors declare no conflict of interest.
References
- Li, H.; Zhao, Z.L.; Ning, Y.Q.; Guo, H.Z.; Yao, Z.K. Characterization of Microstructural Evolution for a Near-α Titanium Alloy with Different Initial Lamellar Microstructures. Metals 2018, 8, 1045. [Google Scholar] [CrossRef]
- Gao, X.X.; Zeng, W.D.; Li, X.; Zhou, D.D.; Xu, J.W.; Wang, Q.J. Effect of boundary on the alpha phase precipitation in a near-alpha titanium alloy. Mater. Lett. 2018, 233, 298–301. [Google Scholar] [CrossRef]
- Vajpai, S.K.; Sharma, B.; Ota, M.; Ameyama, K. Effect of cold rolling and heat-treatment on the microstructure and mechanical properties of β-titanium Ti-25Nb-25Zr alloy. Mater. Sci. Eng. A 2018, 736, 323–328. [Google Scholar] [CrossRef]
- Wronski, M.; Arul Kumar, M.; Capolungo, L.; McCabe, R.J.; Wierzbanowski, K.; Tomé, C.N. Deformation behavior of CP-titanium: Experiment and crystal plasticity modeling. Mater. Sci. Eng. A 2018, 724, 289–297. [Google Scholar] [CrossRef]
- Joseph, S.; Lindley, T.C.; Dye, D. Dislocation interactions and crack nucleation in fatigued near-alpha titanium alloy. Int. J. Plast. 2018, 110, 38–56. [Google Scholar] [CrossRef]
- Hémery, S.; Villechaise, P. Investigation of Size Effects in Slip Strength of Titanium Alloys: α Nodule Size Dependence of the Critical Resolved Shear Stress. Metall. Mater. Trans. A 2018, 49, 4394–4397. [Google Scholar] [CrossRef]
- Shao, H.; Zhao, Y.; Ge, P.; Zeng, W.D. In-situ SEM observations of tensile deformation of the lamellar microstructure in TC21 titanium alloy. Mater. Sci. Eng. A 2013, 559, 515–519. [Google Scholar] [CrossRef]
- Arul Kumar, M.; Wroński, M.; McCabe, R.J.; Capolungo, L.; Wierzbanowski, K.; Tomé, C.N. Role of microstructure on twin nucleation and growth in HCP titanium: A statistical study. Acta Mater. 2018, 148, 123–132. [Google Scholar] [CrossRef]
- Castany, P.; Besse, M.; Gloriant, T. In situ TEM study of dislocation slip in a metastable β titanium alloy. Scr. Mater. 2012, 66, 371–373. [Google Scholar] [CrossRef]
- Zhang, S.; Zen, W.D.; Zhao, Q.Y.; Ge, L.L.; Zhang, M. In situ SEM study of tensile deformation of a near-β titanium alloy. Mater. Sci. Eng. A 2017, 708, 574–581. [Google Scholar] [CrossRef]
- Tan, C.; Sun, C.; Xiao, L.; Zhang, Y.Q.; Sun, J. Characterization of deformation in primary α phase and crack initiation and propagation of TC21 alloy using in-situ SEM experiments. Mater. Sci. Eng. A 2018, 725, 33–42. [Google Scholar] [CrossRef]
- Guo, Y.; Britton, T.B.; Wilkinson, A.J. Slip band–grain boundary interactions in commercial-purity titanium. Acta Mater. 2014, 76, 1–12. [Google Scholar] [CrossRef]
- Girardin, G.; Huvier, C.; Delafosse, D.; Feaugas, X. Correlation between dislocation organization and slip bands: TEM and AFM investigations in hydrogen-containingnickel and nickel-chromium. Acta Mater. 2015, 91, 141–151. [Google Scholar] [CrossRef]
- Franciosi, P.; Le, L.T.; Monnet, G.; Kahloun, C.; Chavanne, M.-H. Investigation of slip system activity in iron at room temperature by SEM and AFM in-situ tensile and compression tests of iron single crystals. Int. J. Plast. 2015, 65, 226–249. [Google Scholar] [CrossRef]
- Asim, U.B.; Siddiq, A.; Demiral, M. Void growth in high strength aluminium alloy single crystals: A CPFEM based study. Model. Simul. Mater. Sci. Eng. 2017, 25, 035010. [Google Scholar] [CrossRef]
- Landon, T.H.; David, T.F.; Eric, R.H.; Robert, H.W.; Lim, H.J.; Jay, D.C.; Zhou, G.W.; Bong, H.J. An investigation of geometrically necessary dislocations and back stress in large grained tantalum via EBSD and CPFEM. Mater. Sci. Eng. A 2020, 772, 138704. [Google Scholar]
- Asim, U.B.; Siddiq, A.; Kartal, M.E. A CPFEM based study to understand the void growth in high strength dual-phase Titanium alloy (Ti-10V-2Fe-3Al). Int. J. Plast. 2019, 122, 188–211. [Google Scholar] [CrossRef]
- Zhang, M.; Bridier, F.; Villechaise, P.; Mendez, J.; McDowell, D.L. Simulation of slip band evolution in duplex Ti–6Al–4V. Acta Mater. 2010, 58, 1087–1096. [Google Scholar] [CrossRef]
- Aubert, I.; Saintier, N.; Olive, J.M.; Plessier, F. A methodology to obtain data at the slip band scale from atomic force microscopy observations and crystal plasticity simulations. Application to hydrogen-induced slip localization on AISI 316L stainless steel. Acta Mater. 2016, 104, 9–17. [Google Scholar] [CrossRef]
- Du, C.; Maresca, F.; Geers, M.G.D.; Hoefnagels, J.P.M. Ferrite slip system activation investigated by uniaxial micro-tensile tests and simulations. Acta Mater. 2018, 146, 314–327. [Google Scholar] [CrossRef]
- Zhang, Z.; Lunt, D.; Abdolvand, H.; Angus, J.W.; Michael, P.; Fionn, P.E.D. Quantitative investigation of micro slip and localization in polycrystalline materials under uniaxial tension. Int. J. Plast. 2018, 108, 88–106. [Google Scholar] [CrossRef]
- Jason, R.M.; Irene, J.B.; Curt, A.B.; Hashem, M. The Influence of Grain Interactions on the Plastic Stability of Heterophase Interfaces. Materials 2014, 7, 302–322. [Google Scholar]
- Woo, W.; Em, V.T.; Kim, E.Y.; Han, S.H.; Han, Y.S.; Choi, S.-H. Stress–strain relationship between ferrite and martensite in a dual-phase steel studied by in situ neutron diffraction and crystal plasticity theories. Acta Mater. 2012, 60, 6972–6981. [Google Scholar] [CrossRef]
- Vajragupta, N.; Uthaisangsuk, V.; Schmaling, B.; Münstermann, S.; Hartmaier, A.; Bleck, W. A micromechanical damage simulation of dual phase steels using XFEM. Comput. Mater. Sci. 2012, 54, 271–279. [Google Scholar] [CrossRef]
- Sommitsch, C.; Krumphals, A.; Candic, M.; Tian, B.H.; Stockinger, M. Modeling of Grain Growth in One and Two Phase Materials by 2D Cellular Automata. In Proceedings of the 6th International Conference on Physical and Numerical Simulation of Materials Processing, Guilin, China, 16–19 November 2010. [Google Scholar]
- Wu, C.; Yang, H.; Li, H.W. Modeling of static coarsening of two-phase titanium alloy in the α+β two-phase region at different temperature by a cellular automata method. Chin. Sci. Bull. 2013, 24, 3023–3032. [Google Scholar] [CrossRef][Green Version]
- Li, G.J.; Shi, R.; Fan, Q.B.; Xia, Y.M.; Zhang, H.M. Three-dimensional microstructure-based micromechanical modeling for TC6 titanium alloy. Mater. Sci. Eng. A 2017, 685, 327–331. [Google Scholar] [CrossRef]
- Prakash, A.; Weygand, S.M.; Riedel, H. Modeling the evolution of texture and grain shape in Mg alloy AZ31 using the crystal plasticity finite element method. Comput. Mater. Sci. 2009, 45, 744–750. [Google Scholar] [CrossRef]
- Zhou, Y.; Fan, Q.B.; Liu, X.; Wang, D.D.; Zhu, X.J. Experimental study and crystal plasticity finite element simulations of nano-indentation-induced lattice rotation and the underlying mechanism in TC6 single α-grain. Mater. Des. 2020, 188, 108423. [Google Scholar] [CrossRef]
- Shi, R.; Nie, Z.H.; Fan, Q.B.; Li, G.J. Elastic plastic deformation of TC6 titanium alloy analyzed by in-situ synchrotron based X-ray diffraction and microstructure based finite element modeling. J. Alloys Compd. 2016, 688, 787–795. [Google Scholar] [CrossRef]
- Kalidindi, S.R.; Bronkhorst, C.A.; Anand, L. Crystallographic texture evolution in bulk deformation processing of FCC metals. J. Mech. Phys. Solids 1992, 40, 537–569. [Google Scholar] [CrossRef]
- Kalidindi, S.R.; Bhattacharyya, A.; Doherty, R.D. Detailed analyses of grain–scale plastic deformation in columnar polycrystalline aluminium using orientation image mapping and crystal plasticity models. Proc. R. Soc. A Math. Phys. Eng. Sci. 2004, 460, 1935–1956. [Google Scholar] [CrossRef]
- Mittemeijer, E.J. Fundamentals of Materials Science; Springer: Berlin/Heidelberg, Germany, 2011; Chapter 11. [Google Scholar]
- Liu, X.; Qian, Y.; Fan, Q.B.; Zhou, Y.; Zhu, X.J.; Wang, D.D. Plastic deformation mode and α/β slip transfer of Ti-5Al-2.5Cr-0.5Fe-4.5Mo-1Sn-2Zr-3Zn titanium alloy at room temperature. J. Alloys Compd. 2020, 826, 154209. [Google Scholar] [CrossRef]
- Basseville, S.; Cailletaud, G.; Ghidossic, T.; Guilhem, Y.; Lacoste, E.; Proudhon, H.; Signor, L.; Villechaise, P. Numerical analysis on the local mechanical fields in polycrystalline 316LN stainless steel under cyclic fatigue loading: Comparison with experimental results. Mater. Sci. Eng. A 2017, 696, 122–136. [Google Scholar] [CrossRef]
- Li, J.G.; Li, Y.L.; Suo, T.; Wei, Q.M. Numerical simulations of adiabatic shear localization in textured FCC metal based on crystal plasticity finite element method. Mater. Sci. Eng. A 2018, 737, 348–363. [Google Scholar] [CrossRef]


Publisher’s Note: MDPI stays neutral with regard to jurisdictional claims in published maps and institutional affiliations. |
© 2020 by the authors. Licensee MDPI, Basel, Switzerland. This article is an open access article distributed under the terms and conditions of the Creative Commons Attribution (CC BY) license (http://creativecommons.org/licenses/by/4.0/).