Featured Application
Surgeons performing total hip replacements should know that they have a direct influence on leg alignment and knee adduction moments by implanting a new joint.
Abstract
The present study considered the entire leg alignment and links static parameters to the external joint moments during gait in patients with hip osteoarthritis. Eighteen patients with unilateral hip osteoarthritis were measured using the EOS® system. Clinical leg alignment and femoral parameters were extracted from the 3D reconstruction of the EOS images. A 3D gait analysis was performed and external knee and hip adduction moments were computed and compared to 18 healthy controls in the same age group. The knee adduction moments of the involved leg were strongly correlated to the femoral offset and the varus/valgus alignment. These parameters alone explained over 50% of the variance in the knee adduction moments. Adding the pelvic drop of the contralateral side increased the model of femoral offset and varus/valgus alignment and explained 78% of the knee adduction moment during the first half of the stance phase. The hip adduction moments were best associated with the hip kinematics and not the leg alignment.
1. Introduction
Hip osteoarthritis (OA) is a frequent musculoskeletal degenerative disease [1], initially causing pain during movement, which then progresses on to also include pain at rest. While the mechanism of the development of hip OA is not fully understood, some studies claim that anatomical deviations, especially of the acetabulum and the geometric relation between the head and the shaft, may play a role in the initiation and the course of hip OA [2,3]. In hip OA patients, Bendaya et al. [4] reported changes in leg alignment with a significantly higher sacral slope and a higher femoral mechanical angle. More studies have already reported on the causal relationship between leg alignment and knee OA. A varus alignment of the knee seems to worsen OA in the medial compartment, whereas a valgus alignment contributes to the development of lateral knee OA [5,6]. Furthermore, a smaller femoral offset (FO) and a larger neck–shaft angle (NSA) have been correlated to the incidence of OA in the lateral knee compartment [7].
Measurements of clinical leg parameters from radiographic images can be affected by how the leg is positioned, i.e., horizontal dimensional parameters, such as the femoral offset, are highly influenced by the rotation of the femur [8]. These measurement errors can be minimized by using 3D EOS® technology [9]. An important benefit of EOS is that images are captured with patients in an upright standing position, unlike in conventional hip X-rays, where patients are supine. This upright standing position allows for a more accurate recording of the patient’s functional weight-bearing leg alignment [10]. Furthermore, EOS images provide information on the whole leg, not just a pelvic overview, and the patient is exposed to a lower radiation dose than with a conventional X-ray [11,12]. Hence, it is possible to extract clinical leg parameters that have not been previously studied in relation to gait.
Hip OA patients usually adjust their gait pattern in order to reduce pain, which leads to altered joint kinematics and kinetics [13,14,15]. It has been shown that hip OA patients show a significantly lower knee adduction moment (KAM) on the involved side compared to healthy subjects [14] and compared to their non-involved side [14,15]. It is suggested that a reduced KAM shifts the knee joint load from the medial to the lateral compartment [14,16], which supports the finding that lateral knee OA is often associated with hip OA [17]. Beyond the lower frontal knee moments, lower hip adduction moments (HAMs) on the involved side were also shown in unilateral hip OA patients [14,18].
Joint kinematics have a direct influence on the joint load. This has not only been shown in various simulation studies [19,20] but also in multiple studies in hip OA patients [14,21]. Patients walking with less hip adduction showed a reduced HAM [21]. Regarding the KAM, it was found that patients walking with a reduced knee flexion–extension and a greater foot progression angle (FPA) had a smaller KAM [14]. Schmidt et al. [14] found that the knee range of motion (RoM) in the sagittal plane and the FPA explained 39% of the KAM alterations of the involved limb during the second half of the stance phase.
Another aspect that can directly influence the external joint moments during gait is leg morphology. Leg alignment has previously been presented as a key factor in the load distribution of the knee. Hurwitz et al. [22] pointed out that the mechanical axis (varus/valgus configuration, calculated via the hip, knee, and ankle joints) is the best single predictor for alterations in the KAM. The abovementioned results point toward an influence of leg alignment on the joint load distribution of the knee and likely also of the hip. The question of whether leg alignment and femoral parameters explain the pathological joint adduction moments in unilateral hip OA patients has not been answered yet.
How clinical leg parameters (leg alignment and femoral parameters) impact the external knee and hip adduction moments in patients with unilateral hip OA was the subject of this research. The goal of this study was (1) to test whether there were differences in clinical leg parameters measured with the EOS system between the involved and non-involved side of unilateral hip OA patients and a healthy control group, (2) to confirm that patients with unilateral hip OA showed a deviating gait pattern to healthy controls walking at a similar walking speed, (3) to test whether the clinical leg parameters measured using the EOS system correlated with external joint moment alterations during gait in unilateral hip OA patients, and finally, (4) to test whether the external joint moment alterations were best associated to a combination of clinical leg parameters and gait kinematics.
2. Materials and Methods
This study was registered under the number DRKS00015053 with the German Clinical Trials Register (DRKS).
2.1. Patients
Eighteen patients (9 male, 9 female) with unilateral hip OA and planned for total hip replacement (THR) entered the study (Table 1). The standard exclusion criteria for measuring preoperative hip OA patients, published previously [14,23], were applied.

Table 1.
Anthropometric data and walking speed.
Reference gait data were collected from 18 healthy subjects (11 male, 7 female) with a comparable age distribution to the patients (Table 1) [14]. All participants gave written informed consent prior to participation. The protocol was approved by the medical ethics committee of the Department of Medicine of the Goethe University Frankfurt (reference number 497/15).
Since radiographic measurements of healthy controls are not permitted in our clinic, the clinical leg parameters were compared to data of 53 asymptomatic healthy adults, collected as part of a large study in Lebanon [24].
2.2. Radiographic Measurements
Preoperatively, biplane radiographic images were captured in a standing position with the EOS® system (EOS imaging, SA, Paris, France) for all patients [11,12]. An accurate 3D model of the lower extremities was reconstructed for each patient from the lateral and anterior images, as described and validated in previous studies [25]. The 3D model was made using sterEOS® (EOS imaging, SA, Paris, France) and was then used for planning the prosthesis (hipEOS®, EOS imaging, SA, Paris, France). From the 3D reconstruction, five clinical leg parameters, which were described in detail elsewhere [25,26], were considered to assess the leg alignment (Figure 1).
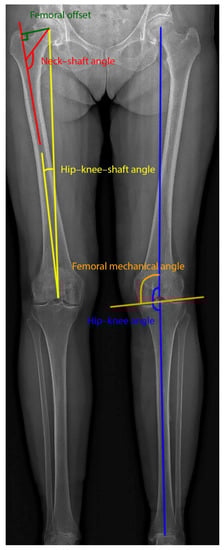
Figure 1.
Clinical leg parameters overlaid on the frontal EOS image.
- Hip–knee–shaft angle (HKS): This was measured on the frontal plane, considering the femoral mechanical axis (which connects the centers of the femoral head and the trochlea) and the femoral anatomical axis (axis from the center of the trochlea to the center of the distal diaphysis of the femur).
- Femoral offset (FO): The distance defined by the center of the femoral head and the orthogonal projection of this point on the femoral anatomical axis.
- Neck–shaft angle (NSA): The angle measured between the axis going from the center of the femoral head through the femoral neck and the line drawn down the center of the femur’s diaphysis.
- Hip–knee angle (HKA): The angle in the frontal femoral plane between the mechanical axes of the femur and the tibia (the line from the center of the tibial plateau to the center of the distal articular surface of the tibia). Valgus > 180°, varus < 180°.
- Femoral mechanical angle (FMA): The angle that is defined in the frontal plane between the femoral mechanical axis and the line through the medial and lateral condyles (the two most distal points).
2.3. Gait Analysis
Patients walked barefoot at a self-selected speed in the gait laboratory. Kinematic data (8 MX T10 cameras, VICON Motion Systems, Oxford, UK) were collected synchronously to kinetic data (two OR-6-7-2000 force plates, Advanced Mechanical Technology, Inc., Watertown, MA, USA). Markers were placed on anatomical landmarks according to a modified version of the Plug-in-Gait model to improve the reliability and accuracy of the gait data in the frontal plane [27]. Of all the obtained trials, those in which one foot was completely on the force plate and no markers were missing were classified as good. Five good trials for each subject were selected for further processing. Control subjects walked at their own speed and at a slow walking speed (≈1.0 m/s) which was similar to patients’ walking speed shortly before surgery [14]. Since no significant differences were detected between the left and right sides in the control subjects, the left side was chosen for further analysis and for comparison with the involved and non-involved sides of the patient group.
Kinematic and kinetic gait variables were calculated using the inverse dynamics equations [28] in Vicon Nexus (version 2.5, VICON Motion Systems, Oxford, UK). In these equations, the hip joint center was obtained according to a geometrical prediction method [28] and the external joint moments are calculated from the force plate data and the mathematically derived joint centers. Kinematic and kinetic data were exported to Matlab (version R2018b, The Mathworks Inc., Natick, MA, USA) to normalize the data over the gait cycle. The peak external knee and hip adduction moment during the first (KAM1 and HAM1) and second (KAM2 and HAM2) half of the stance phase were computed for each trial (normalized to body weight and expressed in newton meters per kilogram) and averaged over the trials. As has been published previously [26], kinematic parameters during the stance phase of gait were also extracted (a) for the hip: the maximum adduction angle in the frontal plane, the maximum flexion and extension angle, and the hip RoM in the sagittal plane; (b) for the knee: the maximum flexion and extension angle, as well as the RoM in the sagittal plane (the difference between the maximum flexion in the first half and the maximum extension during the second half of the stance phase); (c) for the trunk: maximum sideward displacement (LTD—lateral displacement of the trunk relative to the supporting limb); (d) for the foot: mean progression angle in the transverse plane (FPA—the angle of the long axis of the foot segment relative to the direction of walking). Furthermore, the pelvic drop of the contralateral leg during the swing phase was determined. The gait speed was defined as the average value over the included trials.
2.4. Statistical Analysis
Statistical analyses were performed using SPSS Statistics (IBM SPSS Statistics for Windows, version 26, IBM Corp., Armonk, NY, USA). Anthropometrics were normally distributed, as confirmed by Shapiro–Wilk tests; therefore, differences in anthropometrics between patients and healthy controls were investigated with independent sample Students’ t-tests. The comparison of the gender distribution over the two groups was studied using a chi-squared test.
The clinical leg alignment parameters of the patients were normally distributed; however, the FO, FMA, and HKS of the healthy controls were not normally distributed, and as such, Wilcoxon signed ranks test (involved vs. non-involved leg) and Mann–Whitney tests (involved/non-involved leg vs. healthy controls) were used to test for differences.
All kinetic and kinematic gait parameters, except the FPA of the involved side, were normally distributed; therefore, paired sample Students’ t-tests were used to test for differences between the involved and non-involved sides for all parameters, except for the FPA, which was analyzed using Wilcoxon signed-rank tests. The involved/non-involved legs were tested against the healthy controls using Mann–Whitney tests for the FPA and using independent sample Students’ t-tests for all other parameters.
For the involved and non-involved legs, Pearson’s correlation coefficients were calculated between the external knee and hip moments in the frontal plane (adduction moments) and the calculated leg parameters/gait kinematics, as well as among the clinical leg parameters themselves. Multiple regression analysis was performed afterward with the parameters, which correlated significantly with the external joint adduction moments. Leg alignment parameters that showed too strong of a correlation (R > 0.7) between each other were excluded from the stepwise regression.
The effect size Cohen’s d [29] was calculated (G*Power, version 3.1.9.2, Faul et al., University Kiel, Germany) [30] and p-values ≤ 0.05 were considered significant for all analyses.
3. Results
The data of 17 patients were included in the analysis as one patient had trouble walking without walking aids and walked at half the speed of the other patients. The subject characteristics and gait speed of all participants are displayed in Table 1. The patients had a significantly higher body mass and body mass index (BMI) in comparison to the healthy controls. The individuals of the healthy control group regarding the leg alignment were significantly younger and had a lower body mass and BMI than the patients. All patients had hip osteoarthritis of at least 2 on the Kellgren–Lawrence scale [31] and all patients expressed pain.
As shown in Table 2, no differences could be found between the involved and non-involved sides for all clinical leg alignment parameters. Only the FMA was significantly larger in the healthy control group compared to the patients’ involved side (p = 0.046).
Table 2.
Clinical leg parameters for the involved and non-involved sides, as well as for healthy controls.
For KAM1, no significant differences between the involved side/non-involved side and healthy control data could be observed. KAM2 of the involved side was significantly smaller compared to the non-involved side (0.30 vs. 0.40 Nm/kg, p = 0.011, d = 0.68) and compared to the healthy controls (0.30 vs. 0.45 Nm/kg, p = 0.004, d = 1.07), as can be seen in Table 3. For the hip, only differences between the non-involved side and healthy controls were found: HAM1 (0.99 vs. 0.80 Nm/kg, p = 0.014, d = 0.90) and HAM2 (0.94 vs. 0.75 Nm/kg, p = 0.017, d = 0.95) of the non-involved leg were significantly higher.
Table 3.
Kinetics and kinematics during the stance phase of gait for both the involved and non-involved sides and for healthy controls.
For the kinematics, significant differences were found between the involved and non-involved legs for the maximum knee flexion, maximum knee extension, knee RoM, LTD, maximum hip flexion, maximum hip extension, and hip RoM (Table 3). Differences in the maximum knee extension, knee RoM, LTD, hip extension, hip RoM, and the pelvic drop in the swing phase were found between the involved leg and the healthy control group (Table 3). The comparison between the non-involved leg and the healthy controls only showed significant differences in the knee RoM, hip flexion, and hip RoM.
For the involved side, significant correlations between leg alignment parameters were found (Table 4). A very strong (inverse) correlation was detected between the FO and the NSA (R = −0.895, p < 0.001), where a larger FO resulted in a narrower NSA. The HKA showed a positive correlation with both the NSA and the FMA, meaning that when the HKA appeared to be larger (more valgus alignment), the NSA and the FMA were larger as well, and vice versa. Furthermore, the HKA showed an inverse correlation to the FO, which means that with a smaller HKA (more varus alignment), the FO was larger, and vice versa. For the non-involved side, similar correlations were found for the involved side (Table 5).
Table 4.
Correlations between the joint adduction moments, joint kinematics, and the clinical leg parameters for the involved leg.
Table 5.
Correlations between the joint adduction moments, joint kinematics, and the clinical leg parameters for the non-involved leg.
The correlations between the clinical leg parameters, the kinematics, and the external joint adduction moments for the involved and non-involved legs are also shown in Table 4 and Table 5. For the involved side, the parameters FO, HKA, and NSA showed a significant correlation with KAM1, whereas only the FO and the NSA showed a correlation with KAM2. The FMA and the HKA showed a trend toward a significant correlation with KAM1 and KAM2, respectively (p < 0.053). For the non-involved leg, the HKS and the FMA showed significant correlations with KAM1. The FMA also showed a significant correlation with KAM2 of the non-involved leg. The HKS and the FO showed a positive correlation to the KAM, which means that with a larger FO and a larger HKS angle, the knee adduction moment was higher. The NSA, the HKA, and the FMA showed a negative correlation such that with a smaller NSA, HKA (more varus), and FMA, the knee adduction moment increased, and vice versa. No correlations between the clinical leg parameters and the HAM were found for the involved or for the non-involved side.
Furthermore, moderate-to-strong correlations between the hip adduction moments and the maximum hip adduction angles were found for both the involved and non-involved legs (R values between 0.686 and 0.790). For the involved leg, moderate correlations were found between KAM1 and HAM1 and the pelvic drop of the contralateral leg, as well as between the knee extension and HAM2. For the non-involved leg, no other correlations were found between the kinematics and the kinetics; however, more significant correlations were found between the kinematic gait parameters and the leg alignment parameters (Table 5).
For the involved leg, a multiple regression analysis revealed that the FO explained 47% of KAM1 (R2 = 0.471; F = 13.370; p = 0.002; Table 6). Including the HKA significantly improved the model to 61% (ΔR2 = 0.143, ΔF = 5.194, p = 0.039), whereas the NSA was excluded due to a strong correlation with the FO. Adding the pelvic drop of the contralateral side improved the model of the FO and the HKA even more and explained 78% of KAM1 (ΔR2 = 0.162, ΔF = 9.368, p = 0.009; Table 6).
Table 6.
Coefficients of determination (R2 values (%)) for the external joint moments of the involved side as a function of the single correlating leg alignment or kinematic gait analysis parameters and coefficients of determination (Rm2 values (%)) fitted as a function of all the significantly contributing parameters.
The FO explained 50% of KAM2 (R2 = 0.499, F = 14.927, p = 0.002). No other parameters were included as the NSA was again excluded due to a too strong correlation with the FO.
The hip joint moments HAM1 and HAM2 were explained by the maximum hip adduction in the corresponding phases of the stance phase (HAM1: 58%, R2 = 0.579, F = 20.592, p < 0.001; HAM2: 54%, R2 = 0.536, F = 17.359, p = 0.001; Table 6). The pelvic drop on the contralateral side did not increase the model for HAM1 any further (p = 0.498), whereas the knee extension did not increase the model for HAM2 (p = 0.069).
For the non-involved leg, multiple regression analyses could not be performed because for KAM1, the HKS (the second parameter with a significant correlation) showed too strong of a correlation with the FMA (the parameter with the strongest significant correlation).
4. Discussion
In the present study, the aim was to determine whether clinical leg parameters (leg alignment and femoral parameters) were different in patients with unilateral hip OA and could be correlated to the altered hip and knee adduction moments. These results could help to better understand the initiation and progression of hip OA and the initiation of knee OA in hip OA patients.
In the last decade, the EOS system has been proven to be a reliable system for the determination of lower limb length and angle measurements [25], with lower radiation exposure in a weight-bearing position. In the present study, except for FMA, no differences were found in leg parameters between the involved and non-involved legs of hip OA patients and healthy controls. As in the present study, Bendaya et al. [4] found significant differences in the FMA and other pelvic parameters in OA patients; however, they could not conclude whether these differences were degenerative over time or were inherent differences between the individuals, or whether they contributed to the progression of OA. The orientation of the axis of the femur (FMA) might become important when planning a knee replacement. Although the risk for contralateral knee OA is higher in patients with a unilateral hip replacement for end-stage OA, the ipsilateral knee is not spared [32,33]. Than et al. [34] found a reduced NSA in their hip OA patients compared to the healthy controls and suggested that it might be due to the younger age of the healthy controls, as the NSA decreased over time. However, our patients showed a similar NSA to the healthy controls and to the controls of the study of Than, despite the significant age differences. Another study found similar values for the femoral offset and the HKA, but a significantly higher NSA in hip OA patients [35]. However, these patients were measured with standard radiography, whereas the present study used EOS images.
The present study confirmed that patients with unilateral hip OA showed a deviating gait pattern compared to healthy controls walking at a similar walking speed. Regarding joint loading, only KAM2 of the involved side was found to be significantly smaller compared to healthy controls (approximately 33%) and the non-involved side (25%), as was found by Shakoor et al [36]. A significantly lower KAM2 indicates a medial-to-lateral shift in the knee load [14,16] and might lead to increased degenerative cartilage wear. The load in the non-involved hip joint was slightly higher compared to the involved hip joint, as was found in preoperative hip OA patients [13,14]. Although these differences were not significant, they might be due to a learned gait pattern to reduce the load on the OA side. The significant differences compared to the healthy control group confirmed the extra load on the non-involved side.
The question of whether leg alignment and femoral parameters explain the pathological joint adduction moments in unilateral hip OA patients has not been answered before. The clinical leg parameters FO, HKA, NSA, and FMA showed a significant correlation (or a trend toward significance) with the knee adduction moments. The positive correlation between the KAM and the FO means that a larger FO implicated a larger KAM, and vice versa. The negative correlation of the KAM with the NSA, the HKA, and the FMA means that a varus leg (a smaller HKA) led to higher knee adduction moments. A larger NSA, and therefore a more valgus leg, was associated with a decreased KAM. Indeed, varus malalignment has been known to be a predictor for the peak knee adduction moments in patients with knee OA [22], and leg malalignment is thought to be one of the main risk factors contributing to the progression of knee OA [5]. Weidow et al. [17] showed that the hip and pelvic anatomy had an influence on the occurrence of medial and lateral knee OA. A decreased NSA, which leads to a more varus leg, was associated with medial knee OA. These results were supported by the present results, as a smaller NSA increased the knee adduction moments during gait. The clinical leg parameters explained 61% of the variance in KAM1 and 50% of the variance of KAM2. For the hip adduction moments, no correlations were found with the clinical leg parameters. In the previous literature, the effect of the FO on gait was discussed. A lower FO led to an asymmetrical gait pattern with a reduction in the knee RoM [37]. Rüdiger et al. [38] showed that with a smaller FO, the abductor muscle force must increase to preserve a normal gait pattern. These results agree with Mahmood et al. [37], who reported that a reduction in the offset was related to a reduction in the abductor muscle strength (moment-generating capacity) of the operated hip. As was found in clinical studies [39,40], the gait pattern is more influenced by a decrease than by an increase in the FO. The effect of the NSA on the hip moments has recently been shown in patients after a THR [41].
In this research, we also studied whether the clinical leg parameters in combination with the gait kinematics were better associated with the pathological hip and knee adduction moments. Till now, only the gait kinematics have been related to the pathological adduction moments in unilateral hip OA patients: Schmidt et al. [14] found a significantly more outward rotation of the foot in their patients, where the FPA, together with the knee RoM, explained 39% of the KAM2 alterations. In the present study, no correlation between KAM2 and the FPA was found. The severity of OA might explain the lack of correlation between KAM2 and the FPA. Rutherford et al. [42] found that only for asymptomatic and mild-to-moderate knee OA patients, the FPA was associated with alterations in the knee adduction moments. In the present study, all patients were symptomatic and severely affected. In the present study, a significant reduced knee RoM during gait was found in the involved limb compared to the non-involved limb and healthy controls. It might be that hip OA patients stiffen the knee on the involved side and flex the knee more on the non-involved side to compensate for leg length differences [14,43]; however, an accurate determination of leg length difference was not part of this study and thus this hypothesis cannot be confirmed.
The gait kinematics showed only a few correlations to the joint adduction moments: the peak hip adduction corresponded strongly to the HAM in the corresponding part of the stance phase and explained 58% and 54% of HAM1 and HAM2, respectively. These correlations were shown previously by Wesseling et al. [20], who showed in a simulation study that increased hip adduction increases the hip adduction moments, as well as the hip contact forces. An increased contralateral pelvic drop had a negative impact (it leads to increased adduction moments) on both KAM1 [44] and HAM1 [45]. The contralateral pelvic drop increased the model for KAM1, and in combination with the FO and the HKA, it explained 78% of the KAM1 alteration. Although a significant correlation was found between the contralateral drop and the external knee joint moments, no differences were found between the patients and healthy controls. Our patients showed a gait pattern with an increased ipsilateral trunk lean that was associated with a reduced pelvic drop. A gait compensation pattern of a stable or elevated pelvis, in combination with an increased trunk lean toward the involved side, was shown by Thurston [46] in individuals with hip OA and by Westhoff et al. [47] in children with Legg Calvé Perthes disease as a compensating strategy to reduce the hip load. However, an increased contralateral trunk lean associated with an increased pelvic drop was also shown in individuals with hip OA [46,48]; hence, the presence of these different combined movements may have confounded the correlation between the single movements and the external hip joint moments. Furthermore, Linley et al. [49] found that only a thorough biomechanical analysis using a principal component analysis could reveal differences in the trunk and pelvic leans.
This study represents the first step in a detailed analysis of the influence of leg alignment on joint adduction moments in unilateral hip OA patients. Nevertheless, our results should be read in light of some limitations. The small sample size used might have restricted the ability to detect significant differences between our groups. Due to the low number of cases, we were not able to take gender into account in our study, as was done by Than et al. [34], who found differences between the sexes in terms of leg alignment. Furthermore, Foucher et al. [50] and Allison et al. [48] were able to report higher hip adduction moments in women compared to men with hip OA. The hip and knee adduction moments are still the gold standards for assessing the load in the frontal plane; however, the joint contact force, calculated using musculoskeletal modeling, is likely a better indicator of joint load compared to joint moments. In the present study, only the effects morphology and kinematics have on joint adduction moments in hip OA patients are discussed. A joint load expressed by joint moments can also be influenced by the abductor muscle force [50] and leg length differences [51] (due to the destructive effect of OA on the hip joint); however, including leg length and abductor function were beyond the scope of the present study. The descriptive models are only valid for the included cohort of patients. In recognizing our limitations to conclusively discuss causality, we recommend that future longitudinal studies be designed to test the development of the leg alignment in patients with hip OA and its effects on hip and knee adduction moments.
5. Conclusions
No differences in the clinical leg parameters between the involved and non-involved legs of hip OA patients could be detected using the EOS system. This could suggest that in our study collective, the leg alignment per se was not the crucial factor for the development of hip OA or that the progression of hip OA did not depend on leg alignment. The last was supported by the present results, as no correlations between the hip adduction moments and leg alignment were found. The present study confirmed that patients with unilateral hip OA walked with a deviating gait pattern and showed lower adduction moments at the involved knee and higher adduction moments at the non-involved hip joint. The current results also confirmed that the varus alignment of the knee (HKA), as well as the femoral parameters (especially the FO), had an influence on the knee adduction moments in unilateral hip OA patients. These two clinical leg parameters explained 61% of the variance in KAM1, and the FO alone explained 50% of the variance of KAM2. A combination of static alignment and gait kinematics explained the knee adduction moments during gait even better in unilateral hip OA patients: adding the pelvic drop of the contralateral side increased the model with the FO and the HKA and explained 78% of KAM1. The hip adduction moments were best explained by the hip kinematics and not by the leg alignment.
Author Contributions
Conceptualization, S.v.D., F.S., and A.M.; methodology, S.v.D. and F.S.; validation, S.v.D. and F.S.; formal analysis, S.v.D., H.K., B.F., T.T., and A.A.; investigation, S.v.D., H.K., A.A., and F.S.; resources, B.F. and T.T.; data curation, S.v.D. and H.K.; writing—original draft preparation, S.v.D. and H.K.; writing—review and editing, S.v.D., H.K., B.F., T.T., A.A., F.S., and A.M.; visualization, S.v.D.; supervision, A.M.; project administration, S.v.D. and H.K. All authors have read and agreed to the published version of the manuscript.
Funding
This research received no external funding.
Conflicts of Interest
The authors declare no conflict of interest. EOS Imaging (Paris, France) provided support for this study. EOS Imaging had no role in the design, execution, interpretation, or writing of the study.
References
- Fuchs, J.; Rabenberg, M.; Scheidt-Nave, C. Prevalence of selected musculoskeletal conditions in Germany—Results of the German Health Interview and Examination Survey for Adults (DEGS1). Bundesgesundheitsblatt 2013, 56, 723–732. [Google Scholar] [CrossRef]
- Sharma, L.; Song, J.; Felson, D.T.; Cahue, S.; Shamiyeh, E.; Dunlop, D.D. The role of knee alignment in disease progression and functional decline in knee osteoarthritis. JAMA 2001, 286, 188–195. [Google Scholar] [CrossRef]
- Zeng, W.N.; Wang, F.Y.; Chen, C.; Zhang, Y.; Gong, X.Y.; Zhou, K.; Chen, Z.; Wang, D.; Zhou, Z.K.; Yang, L. Investigation of association between hip morphology and prevalence of osteoarthritis. Sci. Rep. 2016, 6, 23477. [Google Scholar] [CrossRef]
- Bendaya, S.; Lazennec, J.Y.; Anglin, C.; Allena, R.; Sellam, N.; Thoumie, P.; Skalli, W. Healthy vs. osteoarthritic hips: A comparison of hip, pelvis and femoral parameters and relationships using the EOS® system. Clin. Biomech. (Bristol, Avon) 2015, 30, 195–204. [Google Scholar] [CrossRef]
- Felson, D.T.; Niu, J.; Gross, K.D.; Englund, M.; Sharma, L.; Cooke, T.D.V.; Guermazi, A.; Roemer, F.W.; Segal, N.; Goggins, J.M.; et al. Valgus malalignment is a risk factor for lateral knee osteoarthritis incidence and progression: Findings from MOST and the Osteoarthritis Initiative. Arthritis Rheum. 2013, 65, 355–362. [Google Scholar] [CrossRef] [PubMed]
- Sharma, L.; Song, J.; Dunlop, D.; Felson, D.; Lewis, C.E.; Segal, N.; Torner, J.; Cooke, T.D.V.; Hietpas, J.; Lynch, J.; et al. Varus and valgus alignment and incident and progressive knee osteoarthritis. Ann. Rheum. Dis. 2010, 69, 1940–1945. [Google Scholar] [CrossRef]
- Boissonneault, A.; Lynch, J.A.; Wise, B.L.; Segal, N.A.; Gross, K.D.; Murray, D.W.; Nevitt, M.C.; Pandit, H.G. Association of hip and pelvic geometry with tibiofemoral osteoarthritis: Multicenter osteoarthritis study (MOST). Osteoarthr. Cartil. 2014, 22, 1129–1135. [Google Scholar] [CrossRef]
- Lecerf, G.; Fessy, M.H.; Philippot, R.; Massin, P.; Giraud, F.; Flecher, X.; Girard, J.; Mertl, P.; Marchetti, E.; Stindel, E. Femoral offset: Anatomical concept, definition, assessment, implications for preoperative templating and hip arthroplasty. Orthop. Traumatol. Surg. Res. 2009, 95, 210–219. [Google Scholar] [CrossRef]
- Wybier, M.; Bossard, P. Musculoskeletal imaging in progress: The EOS imaging system. Jt. Bone Spine 2013, 80, 238–243. [Google Scholar] [CrossRef] [PubMed]
- McKenna, C.; Wade, R.; Faria, R.; Yang, H.; Stirk, L.; Gummerson, N.; Sculpher, M.; Woolacott, N. EOS 2D/3D X-ray imaging system: A systematic review and economic evaluation. Health Technol. Assess. 2012, 16. [Google Scholar] [CrossRef]
- Charpak, G. Electronic imaging of ionizing radiation with limited avalanches in gases. Rev. Mod. Phys. 1993, 65, 591–598. [Google Scholar] [CrossRef]
- Escott, B.G.; Ravi, B.; Weathermon, A.C.; Acharya, J.; Gordon, C.L.; Babyn, P.S.; Kelley, S.P.; Narayanan, U.G. EOS low-dose radiography: A reliable and accurate upright assessment of lower-limb lengths. J. Bone Joint Surg. Am. 2013, 95, e1831–e1837. [Google Scholar] [CrossRef] [PubMed]
- Foucher, K.C.; Wimmer, M.A. Contralateral hip and knee gait biomechanics are unchanged by total hip replacement for unilateral hip osteoarthritis. Gait. Posture 2012, 35, 61–65. [Google Scholar] [CrossRef]
- Schmidt, A.; Meurer, A.; Lenarz, K.; Vogt, L.; Froemel, D.; Lutz, F.; Barker, J.; Stief, F. Unilateral hip osteoarthritis: The effect of compensation strategies and anatomic measurements on frontal plane joint loading. J. Orthop. Res. 2017, 35, 1764–1773. [Google Scholar] [CrossRef]
- Shakoor, N.; Dua, A.; Thorp, L.E.; Mikolaitis, R.A.; Wimmer, M.A.; Foucher, K.C.; Fogg, L.F.; Block, J.A. Asymmetric loading and bone mineral density at the asymptomatic knees of patients with unilateral hip osteoarthritis. Arthritis Rheum. 2011, 63, 3853–3858. [Google Scholar] [CrossRef]
- Andriacchi, T.P. Valgus alignment and lateral compartment knee osteoarthritis: A biomechanical paradox or new insight into knee osteoarthritis? Arthritis Rheum. 2013, 65, 310–313. [Google Scholar] [CrossRef]
- Weidow, J.; Mars, I.; Karrholm, J. Medial and lateral osteoarthritis of the knee is related to variations of hip and pelvic anatomy. Osteoarthr. Cartil. 2005, 13, 471–477. [Google Scholar] [CrossRef] [PubMed]
- Hurwitz, D.E.; Hulet, C.H.; Andriacchi, T.P.; Rosenberg, A.G.; Galante, J.O. Gait compensations in patients with osteoarthritis of the hip and their relationship to pain and passive hip motion. J. Orthop. Res. 1997, 15, 629–635. [Google Scholar] [CrossRef]
- Ardestani, M.M.; Moazen, M.; Jin, Z. Sensitivity analysis of human lower extremity joint moments due to changes in joint kinematics. Med. Eng. Phys. 2015, 37, 165–174. [Google Scholar] [CrossRef]
- Wesseling, M.; de Groote, F.; Meyer, C.; Corten, K.; Simon, J.P.; Desloovere, K.; Jonkers, I. Gait alterations to effectively reduce hip contact forces. J. Orthop. Res. 2015, 33, 1094–1102. [Google Scholar] [CrossRef]
- Meyer, C.A.G.; Wesseling, M.; Corten, K.; Nieuwenhuys, A.; Monari, D.; Simon, J.P.; Jonkers, I.; Desloovere, K. Hip movement pathomechanics of patients with hip osteoarthritis aim at reducing hip joint loading on the osteoarthritic side. Gait. Posture 2018, 59, 11–17. [Google Scholar] [CrossRef]
- Hurwitz, D.E.; Ryals, A.B.; Case, J.P.; Block, J.A.; Andriacchi, T.P. The knee adduction moment during gait in subjects with knee osteoarthritis is more closely correlated with static alignment than radiographic disease severity, toe out angle and pain. J. Orthop. Res. 2002, 20, 101–107. [Google Scholar] [CrossRef]
- Van Drongelen, S.; Wesseling, M.; Holder, J.; Meurer, A.; Stief, F. Knee load distribution in hip osteoarthritis patients after total hip replacement. Front. Bioeng. Biotechnol. 2020, 8. [Google Scholar] [CrossRef]
- Bakouny, Z.; Assi, A.; Yared, F.; Bizdikian, A.J.; Otayek, J.; Nacouzi, R.; Lafage, V.; Lafage, R.; Ghanem, I.; Kreichati, G. Normative spino-pelvic sagittal alignment of Lebanese asymptomatic adults: Comparisons with different ethnicities. Orthop. Traumatol. Surg. Res. 2018, 104, 557–564. [Google Scholar] [CrossRef]
- Guenoun, B.; Zadegan, F.; Aim, F.; Hannouche, D.; Nizard, R. Reliability of a new method for lower-extremity measurements based on stereoradiographic three-dimensional reconstruction. Orthop. Traumatol. Surg. Res. 2012, 98, 506–513. [Google Scholar] [CrossRef]
- Van Drongelen, S.; Kaldowski, H.; Tarhan, T.; Assi, A.; Meurer, A.; Stief, F. Are changes in radiological leg alignment and femoral parameters after total hip replacement responsible for joint loading during gait? BMC Musculoskelet. Disord. 2019, 20, 526. [Google Scholar] [CrossRef]
- Stief, F.; Böhm, H.; Michel, K.; Schwirtz, A.; Döderlein, L. Reliability and accuracy in three-dimensional gait analysis: A comparison of two lower body protocols. J. Appl. Biomech. 2013, 29, 105–111. [Google Scholar] [CrossRef]
- Davis, R.B.; Õunpuu, S.; Tyburski, D.; Gage, J.R. A gait analysis data collection and reduction technique. Hum. Mov. Sci. 1991, 10, 575–587. [Google Scholar] [CrossRef]
- Cohen, J. Statistical Power Analysis for the Behavioral Sciences, 2nd ed.; Routledge: New York, NY, USA, 2013; p. 567. [Google Scholar]
- Faul, F.; Erdfelder, E.; Lang, A.G.; Buchner, A. G*power 3: A flexible statistical power analysis program for the social, behavioral, and biomedical sciences. Behav. Res. Methods. 2007, 39, 175–191. [Google Scholar] [CrossRef]
- Kellgren, J.H.; Lawrence, J.S. Radiological assessment of osteo-arthrosis. Ann. Rheum. Dis. 1957, 16, 494–502. [Google Scholar] [CrossRef] [PubMed]
- Shakoor, N.; Block, J.A.; Shott, S.; Case, J.P. Nonrandom evolution of end-stage osteoarthritis of the lower limbs. Arthritis Rheum. 2002, 46, 3185–3189. [Google Scholar] [CrossRef] [PubMed]
- Gillam, M.H.; Lie, S.A.; Salter, A.; Furnes, O.; Graves, S.E.; Havelin, L.I.; Ryan, P. The progression of end-stage osteoarthritis: Analysis of data from the Australian and Norwegian joint replacement registries using a multi-state model. Osteoarthr. Cartil. 2013, 21, 405–412. [Google Scholar] [CrossRef]
- Than, P.; Szuper, K.; Somoskeoy, S.; Warta, V.; Illes, T. Geometrical values of the normal and arthritic hip and knee detected with the EOS imaging system. Int. Orthop. 2012, 36, 1291–1297. [Google Scholar] [CrossRef]
- Ollivier, M.; Parratte, S.; Lecoz, L.; Flecher, X.; Argenson, J.N. Relation between lower extremity alignment and proximal femur anatomy. Parameters during total hip arthroplasty. Orthop. Traumatol. Surg. Res. 2013, 99, 493–500. [Google Scholar] [CrossRef] [PubMed]
- Shakoor, N.; Hurwitz, D.E.; Block, J.A.; Shott, S.; Case, J.P. Asymmetric knee loading in advanced unilateral hip osteoarthritis. Arthritis Rheum. 2003, 48, 1556–1561. [Google Scholar] [CrossRef]
- Sariali, E.; Klouche, S.; Mouttet, A.; Pascal-Moussellard, H. The effect of femoral offset modification on gait after total hip arthroplasty. Acta Orthop. 2014, 85, 123–127. [Google Scholar] [CrossRef]
- Rüdiger, H.A.; Guillemin, M.; Latypova, A.; Terrier, A. Effect of changes of femoral offset on abductor and joint reaction forces in total hip arthroplasty. Arch. Orthop. Trauma Surg. 2017, 137, 1579–1585. [Google Scholar] [CrossRef]
- Cassidy, K.A.; Noticewala, M.S.; Macaulay, W.; Lee, J.H.; Geller, J.A. Effect of femoral offset on pain and function after total hip arthroplasty. J. Arthroplasty 2012, 27, 1863–1869. [Google Scholar] [CrossRef] [PubMed]
- Mahmood, S.S.; Mukka, S.S.; Crnalic, S.; Wretenberg, P.; Sayed-Noor, A.S. Association between changes in global femoral offset after total hip arthroplasty and function, quality of life, and abductor muscle strength. A prospective cohort study of 222 patients. Acta Orthop. 2016, 87, 36–41. [Google Scholar] [CrossRef] [PubMed]
- Stief, F.; van Drongelen, S.; Brenneis, M.; Tarhan, T.; Fey, B.; Meurer, A. Influence of hip geometry reconstruction on frontal plane hip and knee joint moments during walking following primary total hip replacement. J. Arthroplasty 2019, 34, 3106–3113. [Google Scholar] [CrossRef]
- Rutherford, D.J.; Hubley-Kozey, C.L.; Deluzio, K.J.; Stanish, W.D.; Dunbar, M. Foot progression angle and the knee adduction moment: A cross-sectional investigation in knee osteoarthritis. Osteoarthr. Cartil. 2008, 16, 883–889. [Google Scholar] [CrossRef] [PubMed]
- Walsh, M.; Connolly, P.; Jenkinson, A.; O’Brien, T. Leg length discrepancy—An experimental study of compensatory changes in three dimensions using gait analysis. Gait Posture 2000, 12, 156–161. [Google Scholar] [CrossRef]
- Dunphy, C.; Casey, S.; Lomond, A.; Rutherford, D. Contralateral pelvic drop during gait increases knee adduction moments of asymptomatic individuals. Hum. Mov. Sci. 2016, 49, 27–35. [Google Scholar] [CrossRef]
- Tateuchi, H.; Akiyama, H.; Goto, K.; So, K.; Kuroda, Y.; Ichihashi, N. Gait kinematics of the hip, pelvis, and trunk associated with external hip adduction moment in patients with secondary hip osteoarthritis: Toward determination of the key point in gait modification. BMC Musculoskelet. Disord. 2020, 21, 8. [Google Scholar] [CrossRef] [PubMed]
- Thurston, A.J. Spinal and pelvic kinematics in osteoarthrosis of the hip joint. Spine 1985, 10, 467–471. [Google Scholar] [CrossRef]
- Westhoff, B.; Petermann, A.; Hirsch, M.A.; Willers, R.; Krauspe, R. Computerized gait analysis in Legg Calvé Perthes disease—Analysis of the frontal plane. Gait Posture 2006, 24, 196–202. [Google Scholar] [CrossRef]
- Allison, K.; Hall, M.; Wrigley, T.V.; Pua, Y.H.; Metcalf, B.; Bennell, K.L. Sex-specific walking kinematics and kinetics in individuals with unilateral, symptomatic hip osteoarthritis: A cross sectional study. Gait Posture 2018, 65, 234–239. [Google Scholar] [CrossRef]
- Linley, H.S.; Sled, E.A.; Culham, E.G.; Deluzio, K.J. A biomechanical analysis of trunk and pelvis motion during gait in subjects with knee osteoarthritis compared to control subjects. Clin. Biomech. (Bristol, Avon) 2010, 25, 1003–1010. [Google Scholar] [CrossRef] [PubMed]
- Foucher, K.C. Sex-specific hip osteoarthritis-associated gait abnormalities: Alterations in dynamic hip abductor function differ in men and women. Clin. Biomech. (Bristol, Avon) 2017, 48, 24–29. [Google Scholar] [CrossRef]
- Khamis, S.; Carmeli, E. The effect of simulated leg length discrepancy on lower limb biomechanics during gait. Gait Posture 2018, 61, 73–80. [Google Scholar] [CrossRef]

Publisher’s Note: MDPI stays neutral with regard to jurisdictional claims in published maps and institutional affiliations. |
© 2020 by the authors. Licensee MDPI, Basel, Switzerland. This article is an open access article distributed under the terms and conditions of the Creative Commons Attribution (CC BY) license (http://creativecommons.org/licenses/by/4.0/).