Abstract
Metabolic syndrome (MS) is an aggregation of coexisting conditions that can indicate an individual’s high risk of major diseases, including cardiovascular disease, stroke, cancer, and type 2 diabetes. We conducted a cross-sectional survey to evaluate potential risk factor indicators by identifying relationships between MS and anthropometric and spirometric factors along with blood parameters among Korean adults. A total of 13,978 subjects were enrolled from the Korea National Health and Nutrition Examination Survey. Statistical analysis was performed using a complex sampling design to represent the entire Korean population. We conducted binary logistic regression analysis to evaluate and compare potential associations of all included factors. We constructed prediction models based on Naïve Bayes and logistic regression algorithms. The performance evaluation of the prediction model improved the accuracy with area under the curve (AUC) and calibration curve. Among all factors, triglyceride exhibited a strong association with MS in both men (odds ratio (OR) = 2.711, 95% confidence interval (CI) [2.328–3.158]) and women (OR = 3.515 [3.042–4.062]). Regarding anthropometric factors, the waist-to-height ratio demonstrated a strong association in men (OR = 1.511 [1.311–1.742]), whereas waist circumference was the strongest indicator in women (OR = 2.847 [2.447–3.313]). Forced expiratory volume in 6s and forced expiratory flow 25–75% strongly associated with MS in both men (OR = 0.822 [0.749–0.903]) and women (OR = 1.150 [1.060–1.246]). Wrapper-based logistic regression prediction model showed the highest predictive power in both men and women (AUC = 0.868 and 0.932, respectively). Our findings revealed that several factors were associated with MS and suggested the potential of employing machine learning models to support the diagnosis of MS.
1. Introduction
Metabolic syndrome (MS) is a collection of at least three of the five risk factors that increase health problems (e.g., cardiovascular disease [CVD], stroke, cancer, and type 2 diabetes [T2D]) [1,2,3,4]. In the presence of MS, the risk of CVD is more than twofold, and the risk of T2D increases more than tenfold [5]. Thus, MS is a major cause of death and a high-risk disease in many people. Favorably, identifying the conditions and associated risk factors of comorbid severe illnesses is easy and inexpensive. Further, these routine checkups are more likely to keep the perturbed physiology in check as compared to the efforts necessary for overcoming a severe disease [6]. The incidence of MS is increasing worldwide. In the United States, it increases by 1–2% every year [7]. The incidence is also steadily increasing in Asia-Pacific countries, such as China, Korea, and Taiwan [8]. MS is related to several factors, and lung disease, in particular, is related to various diseases that can cause MS [9,10,11].
Numerous studies have supported the association between anthropometric factors and MS [12,13,14,15,16,17]. For instance, forearm circumference and bioelectric-impedance-measured visceral fat are associated with MS. However, waist circumference (WC) is not. [12]. Some studies have shown several anthropometric factors to be predictors of components of MS. As a result, no single index was consistently the strongest predictor [13]. Waist-to-hip ratio (WHtR) is the most commonly associated risk factor for MS in Japan, whereas WC and body mass index (BMI) had the strongest associations with MS among other ethnicities [14,15]. Furthermore, WHtR was more strongly associated with MS than WC and BMI, in the identification of metabolic risk factors [16].
The associations of blood parameters and spirometric factors with MS have also been examined [18,19,20,21,22,23,24], wherein it was established that dietary patterns were associated with glucose (GLU) intolerance and MS [18]. Additionally, abnormal white blood cell (WBC) count was a vascular risk factor for MS [19]. Further, the incidence of MS was higher in subjects with chronic obstructive lung disease than in those with normal lung function, as determined by the Global Initiative for Chronic Obstructive Lung Disease (GOLD II–IV) guidelines. WC and blood pressure (BP) were also associated with the disease [20]. Low pulmonary function was associated with restrictive lung disease and MS risk factors [22]. Some studies have investigated the association between chronic obstructive pulmonary disease (COPD) and MS in men and women [23]. Lin et al. [24] studied the association between restrictive lung impairment and an increased risk of MS.
In medicine and genomics, numerous studies are conducted using machine learning models [25,26,27,28,29,30,31,32,33,34,35,36,37]. However, research that compares and analyzes anthropometric factors, blood parameters, urinary parameters, and spirometric factor anomalies for diagnosis of MS is lacking. Such evaluation is critical because in Asian countries, particularly, MS has become a concern due to rapid and constant changes in diet and lifestyle. Moreover, the study of MS has progressed through the use of machine learning [38].
We analyzed the association between various indicators and MS. Further, we aimed to compare and evaluate data sets for machine learning models to provide an algorithm for predicting MS. Measurements of variables are presented with their respective p-values and odds ratios (ORs), calculated using binary logistic regression analysis to identify the factors associated with MS. For evaluation of the machine learning models, Naïve Bayes (NB) and logistic regression algorithm predictive models were created for estimating predictive power. The results of this study provide basic knowledge on the association between MS and anthropometric and spirometric factors that can be used to predict and facilitate the prevention and management of MS. Moreover, the application of machine learning in medicine is expected to support the diagnosis of MS.
2. Materials and Methods
2.1. Subjects and Dataset
We obtained the data for this study from the Korea National Health and Nutrition Examination Survey (KNHANES V and VI) from 2010 to 2015. The KNHANES is a cross-sectional survey conducted initially by the Korea Centers for Disease Control and Prevention [39,40,41]. Datasets from the survey were approved by the Korea Ministry of Health and Welfare (2010-02CON-21-C, 2011-02CON-06-C, 2012-01EXP-01-2C, and 2013-07CON-03-4C). National Health and Nutrition Examination was conducted without deliberation by the Research Ethics Review Committee, as it corresponds to research conducted by the state for public welfare, according to Article 2 (1) of the Bioethics Law and Article 2 (2) 1 of the Enforcement Regulations of the same law. The research was conducted in accordance with principles of the Helsinki Declaration update of 2008. This study was approved by the Institutional Review Board of the Korea Research Institute of Standards and Science, and included approval for the access and analysis of open-source data from the KNHANES V and VI with a waiver for the documentation of informed consent (IRB No. KRISS-IRB-2019-14).
MS was defined by the presence of three or more of the five conditions mentioned below [42]. The conditions are as follows (Table 1):

Table 1.
Conditions of metabolic syndrome.
We conducted an experimental study in three stages. First, we performed data integration based on the measured data (spirometric factors) from 2010 to 2015. Second, we extracted data according to the participants’ demographic and clinical characteristics, including age, sex, alcohol consumption, smoking, income, anthropometric factors, blood parameters, and spirometric factors. MS was defined relative to five conditions, and we performed data translation and clarification (addressing missing, uncalculated, and unconverted values).
Finally, we performed data standardization for comparison and analysis. In the statistical analysis, we implemented three methods to analyze the associations of various indices with MS. A t-test was conducted to evaluate significant differences between men and women. We conducted a binary logistic regression analysis to identify significant associations with the measured variables (anthropometric and spirometric factors and blood parameters) and determined differences between normal subjects and those with MS. We used an area under the curve (AUC) from the receiver operating characteristic (ROC) curve to assess whether significant improvement in the identification of MS was achieved based on anthropometric factors, blood parameters, and spirometric factors. Since no method exists to calculate the AUC in a complex sampling analysis, we analyzed the recognized performance by the general AUC analysis. Finally, we constructed a prediction model using machine learning algorithms based on the feature selection method for predictive power by sensitivity, 1-specificity, precision, and AUC [43]. Figure 1 shows the design of this study for preprocessing and statistical analysis.
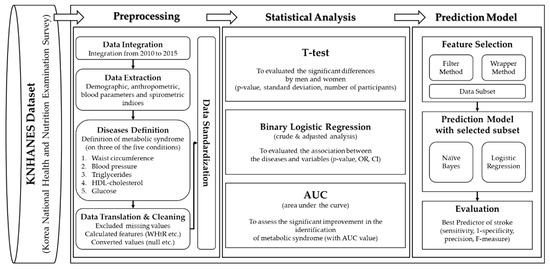
Figure 1.
The metabolic syndrome prediction study was designed for preprocessing and statistical analysis. WHtR, waist-to-height ratio; OR, odds ratio; CI, confidence interval.
We focused on participants aged ≥ 40 years in this study because the prevalence of MS increases rapidly in this age group [44]. This yielded a sample size of 26,499 subjects. We excluded subjects with the following measurements: demographics (n = 3409), anthropometric factors (n = 85), blood parameters (n = 4930), uric test results (n = 394), and spirometric factors (n = 3703). Thus, the study comprised 13,978 subjects, and the final dataset consisted of 9893 normal subjects (4489 men and 5404 women) and 4085 subjects with MS (1749 men and 2340 women). Figure 2 presents a flow chart showing details of the sample selection procedure.
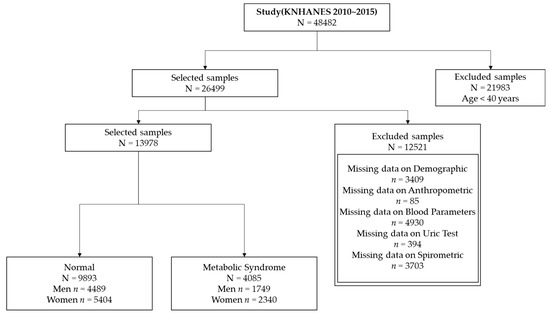
Figure 2.
Sample selection procedure for association analysis.
Table 2 shows the demographic and clinical characteristics of each group and detailed descriptions of all experimental factors in the t-test.
Table 2.
Primary characteristics of all factors analyzed for metabolic syndrome.
2.2. Measurements
All factors were measured according to established guidelines, as described previously [40,41]. Height measurements were quantified to the nearest 1 mm using a Seca 225 portable stadiometer (Seca, Hamburg, Germany). Weight measurements were quantified to the nearest 0.1 kg using an electronic scale (GL-6000-20; Caskorea, Seoul, Korea). WC measurements (between the sternum and the hips) were quantified to the nearest 1 mm using Seca 200. BMI was calculated as weight/height2. The WHtR (a new indicator in this study) was calculated as WC/height. Blood parameters were measured using Hitachi Automatic Analyzer 7600-210 (Hitachi, Tokyo, Japan) with Pureauto SCHO-N (Sekisui, Tokyo, Japan) and S TG-N, S AST, S ALT, S GLU, and Cholestest N HDL, LDL (Sekisui, Tokyo, Japan). Glycated hemoglobin was measured using HLC-723G7 (Tosoh, Tokyo, Japan). White and red blood cell counts were measured using XE-2100D (Sysmex, Tokyo, Japan). Spirometric factors were measured using the Vmax series 2130 (SensorMedics, Yorba Linda, CA, USA). Spirometric factors measured included forced vital capacity, forced expiratory volume in 1s, ratio of forced expiratory volume in 1 s to forced vital capacity, forced expiratory volume in 6s, forced expiratory flow 25–75% (FEF25-75), and peak expiratory flow by pulmonary function test.
2.3. Statistical Analysis
We used a complex sampling design to examine associations between MS and related factors. Stratified two-stage sampling was performed with the primary sampling unit (PSU), cluster, and weight values that are taken into consideration. The results could be biased due to the estimated factors, variance in the means, and prevalence rate from simple random sampling. Thus, we performed a complex sampling data analysis that utilized weighting, as described previously [40,41,45].
Statistical analyses were performed using SPSS 22 software for Windows (SPSS, Inc., Armonk, NY, USA). Binary logistic regression was used to predict or classify machine learning and data mining fields, but this algorithm is primarily used to analyze and examine the associations between diseases and various factors in medicine, public health, and epidemiology studies. It can provide p-values, OR values, and confidence intervals (CIs) for association analyses. Thus, it was suitable for this algorithm and both crude and adjusted analyses of our data and objectives. In the adjusted analyses, we used age, BMI, frequency of alcohol consumption, smoking, income, recognized stress rate, and education level as the value adjustment factors. We analyzed and evaluated the association between normal subjects and those with MS. We used the data mining tool of the Waikato Environment for Knowledge Analysis (WEKA), constructed the prediction models, and evaluated the prediction performance. We used 10-fold cross validation to efficiently distribute training, test data sets and evaluate prediction models [46].
3. Results
3.1. Associations of MS with Anthropometric Factors, Blood Parameters, Urinary Parameters, and Spirometric Factors
Shown in Table 3 and Table 4 are the associations of MS with the anthropometric and spirometric factors, and blood and urinary parameters in Korean men and women. Overall, 29.2% (N = 4085) of the 13,978 participants exhibited MS. The prevalence of MS was higher in women than in men (30.2% and 28.0%, respectively).
Table 3.
Associations of anthropometric factors, blood parameters, urinary parameters, and spirometric factors with metabolic syndrome in men.
Table 4.
Associations of anthropometric factors, blood parameters, urinary parameters, and spirometric factors with metabolic syndrome in women.
In men, among all factors, triglycerides (TG) (p < 0.0001, OR = 2.719, 95% CI [2.350–3.146]) presented the strongest association with MS during crude analysis. Additionally, TG (adjusted p < 0.0001, adjusted OR = 2.711 [2.328–3.158]) exhibited the strongest association after adjusting for age, BMI, alcohol consumption, smoking, income, recognized stress rate, and education level. Among anthropometric factors, WHtR demonstrated the strongest association with MS in crude (p < 0.0001, OR = 2.164 [2.006–2.334]) and adjusted (adjusted p < 0.0001, adjusted OR = 2.069 [1.922–2.228]) analyses. In the second, WC had the next strongest association in the crude (p < 0.0001, OR = 2.164 [2.006–2.334]) and adjusted (adjusted p < 0.0001, adjusted OR = 1.468 [1.287–1.674]) analyses. Among blood parameters, TG (adjusted p < 0.0001, adjusted OR = 2.711 [2.328–3.158]) was the strongest negative indicator of MS in both crude and adjusted analyses. GLU (p < 0.0001, OR = 2.348 [2.048–2.691]) was associated with MS in crude analysis. However, HDL (adjusted p < 0.0001, adjusted OR = 0.384 [0.342–0.431]) showed a negative association with MS in the adjusted analysis. Among urinary parameters, uric acid pH (UPH) showed the highest negative association with MS in crude (p < 0.0001, OR = 0.823 [0.767–0.883]) and adjusted (adjusted p < 0.0001, adjusted OR = 0.852 [0.791–0.918]) analyses. Among spirometric factors, forced expiratory volume in 6s (FEV6) was negatively associated with MS in crude (p < 0.0001, OR = 0.733 [0.685–0.784]) and adjusted (adjusted p < 0.0001, adjusted OR = 0.822 [0.749–0.903]) analyses, followed by forced vital capacity (FVC) in both crude (p < 0.0001, OR = 0.755 [0.706–0.807]) and adjusted (adjusted p < 0.0001, adjusted OR = 0.839 [0.769–0.915]) analyses.
Among all the factors analyzed in women, GLU (p < 0.0001, OR = 4.593 [3.818–5.524]) showed the strongest association with MS. Moreover, TG (adjusted p < 0.0001, adjusted OR = 3.515 [3.042–4.062]) was associated with MS in adjusted analysis. Among anthropometric factors, WHtR (p < 0.0001, OR = 4.166 [3.795–4.572]) was strongly associated with MS in crude analysis. WC (adjusted p < 0.0001, adjusted OR = 2.847 [2.447–3.313]) was strongly associated in adjusted analysis. Among blood parameters, GLU exhibited the highest association with MS in crude analysis. And TG was strongly associated in the adjusted analysis. UPH (p < 0.0001, OR = 0.862 [0.812–0.915]) showed the strongest negative association with MS among the urinary parameters in crude analysis. The association with UPH (adjusted p < 0.0001, adjusted OR = 0.834 [0.781–0.891]) was maintained following adjusted analysis. Urine creatinine (p < 0.05, OR = 0.903 [0.852–0.957]) was strongly associated with crude analysis; however, this association disappeared following adjustment for confounders. FEV6 (p < 0.0001, OR = 0.583 [0.544–0.624]) showed highest negative association with MS among the spirometric factors in crude analysis. Furthermore, FEF25-75 (adjusted p < 0.05, adjusted OR = 1.150 [1.060–1.246]) showed MS association in adjusted analysis.
In the overall crude analysis, TG presented the strongest association with MS in men, whereas GLU exhibited the strongest association in women. WHtR was associated with both men and women, but WC was associated with adjusted analysis. FEV6 was also associated with both men and women. In the adjusted analysis, FEV6 and FEF25–75 associated with MS. These results suggested sex-based differences in blood parameters; however, other risk factors showed similar results in both sexes.
From the AUC analysis, Figure 3 and Figure 4 show the predictive power of anthropometric and spirometric factors, blood and urinary parameters for MS in Korean men and women. Among all factors, TG (AUC = 0.787 [0.775–0.799]) showed strong predictive power in men, whereas WHtR (AUC = 0.813 [0.802–0.823]) demonstrated the highest AUC value in women. GUL and HBA1C exhibited strong predictive powers among the blood parameters in men (AUC = 0.776 [0.764–0.789] and AUC = 0.712 [0.697–0.726], respectively) and women (AUC = 0.810 [0.799–0.821] and AUC = 0.776 [0.765–0.788], respectively). Among the spirometric factors, FEV6 and FVC showed strongest negative predictive power for men (AUC = 0.413 [0.398–0.429] and AUC = 0.423 [0.407–0.438], respectively) and women (AUC = 0.460 [0.447–0.474] and AUC = 0.465 [0.452–0.479], respectively).
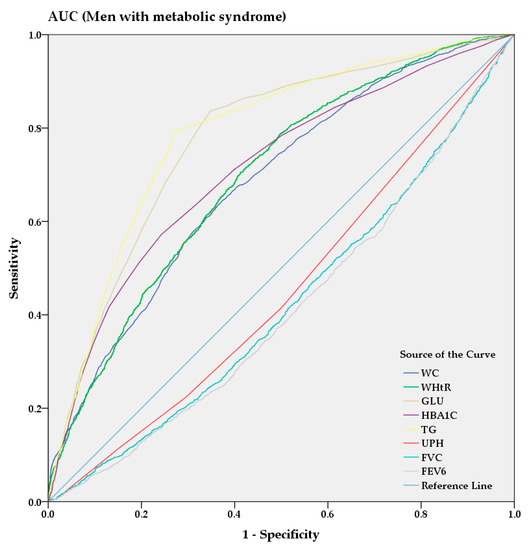
Figure 3.
AUC analysis of metabolic syndrome in men.
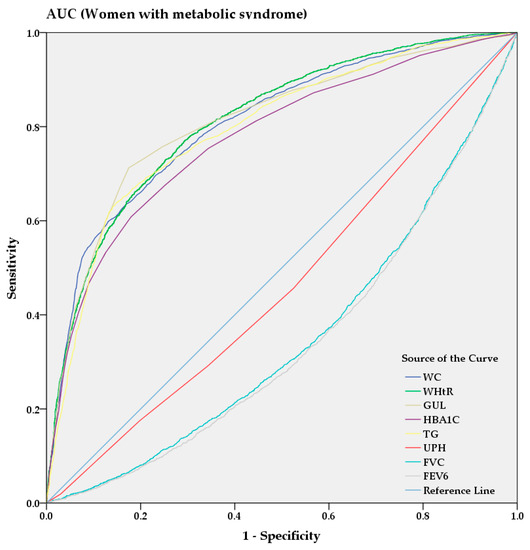
Figure 4.
AUC analysis of metabolic syndrome in women.
3.2. Comparison of the Predictive Power of MS with Anthropometric Factors, Blood Parameters, Urinary Parameters, and Spirometric Factors
Each prediction model was constructed using NB and logistic regression algorithms by a subset of features using the wrapper and filter feature selection method for performance evaluation of the MS prediction model for both men and women. Table 5 shows detailed results of feature selection by the wrapper and filter method. The model built by Wrapper NB in men included 13 features: age, WT, WC, SBP, GLU, HDL, TG, ALT, WBC, USG, UCREA, FVC, and FEV6. Our results revealed a higher predictive power in women than in men for NB and logistic regression predictions.
Table 5.
Feature selection using the wrapper and filter method for each model.
The performance of models was compared and evaluated based on sensitivity, 1-specificity, F-measure, AUC, area under the precision-recall curve (AUPRC), and root mean square error (RMSE) [47]. As shown in Table 6, for men, the sensitivity, 1-specificity, and F-measure of the prediction model (Wrapper LR [Logistic Regression]) were 0.926, 0.449, and 0.882 in the normal group and 0.551, 0.074, and 0.633 in the MS group, respectively. Among women, the sensitivity, 1-specificity, and F-measure were 0.930, 0.261, and 0.911 in the normal group and 0.739, 0.070, and 0.778 in the MS group, respectively.
Table 6.
Predictive power analysis of the four models in men and women.
As shown in Table 7, among the men MS prediction models, Wrapper_LR’s AUC [95% CI], AUPRC [95% CI], R2 [95% CI], and RMSE [95% CI] were the predictive power with 0.868 [0.860–0.876], 0.712 [0.701–0.723], 0.960 [0.955–0.965], and 0.358 [0.346–0.370], respectively. Among the women, Wrapper_LR’s AUC, AUPRC, R2, and RMSE were the predictive power with 0.932 [0.926–0.938], 0.851 [0.843–0.859], 0.986 [0.983–0.988], and 0.308 [0.298–0.318], respectively. The wrapper_LR showed the best performance among other prediction models in both men and women. For men, the MS prediction model (the wrapper-based logistic regression) showed the strongest predictive power (AUC = 0.868), as detailed in Figure 5. In women, the wrapper based logistic regression model showed the highest predictive power (AUC = 0.932).
Table 7.
Performance analysis results of the four models in men and women.
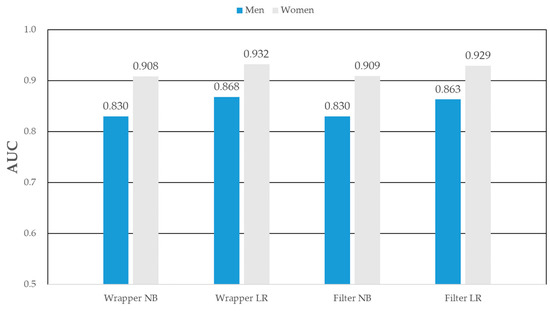
Figure 5.
AUC of metabolic syndrome prediction models in men and women.
Figure 6 shows the calibration curve for each prediction model. The x-axis of the calibration plot is a predicted class, and the y-axis is plotted as the true class. In men, Wrapper_LR suggests a better calibration plot than Wrapper_NB. In women, Wrapper_LR suggests a better calibration plot than Wrapper_NB. In the feature selection method, the wrapper showed better results for prediction model development than CFS.
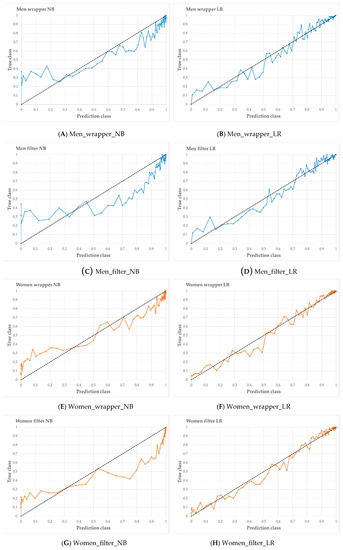
Figure 6.
Calibration curve of four models in men (A–D) and women (E–H). When the line of the calibration plot is straight, the prediction model was presented the best performance.
4. Discussion
In this study, anthropometric and spirometric factors and blood parameters were examined as potential risk factors for MS. In a previous report on anthropometric factors and MS, Sagun et al. [12] conducted a study involving 387 subjects admitted to the obesity outpatient department of Istanbul Medeniyet University Goztepe Training and Research Hospital in Turkey. The purpose of their study was to evaluate associations of WC, hip circumference, WHtR, waist-to-hip ratio (WHR), mid-upper arm circumference, forearm circumference, calf circumference, and body composition with MS. The OR of visceral fat, hip circumference, forearm circumference, and WHR were 2.19 [95% CI, 1.30–3.71], 1.89 [1.07–3.35], 2.47 [1.24–4.95], and 2.11 [1.26–3.53], respectively. WC was not related to MS. However, forearm circumference and bioelectric-impedance-measured visceral fat were associated with the disease.
Mooney et al. [13] determined that other anthropometric factors, such as WC, WHtR, percent body fat, fat mass index (FMI), and fat-free mass index (FFMI), were consistently better predictors as MS-associated factors than BMI. They obtained their data from 12,294 adults who took part in annual physical examinations provided by EHE International, Inc., New York, NY, USA. They showed that each anthropometric factor was related to metabolic risk factors using Pearson correlation analyses, linear regression analyses, and ROC curves, and no single index exhibited the strongest prediction consistently. BMI was identified as the strongest predictor of BP.
Hsieh et al. [14] investigated the association of anthropometric factors, such as BMI, WC, and WHtR, with MS in 8278 Japanese subjects (6141 men and 2137 women). The AUC values for BMI, WC, and WHtR were 0.677 [95% CI, 0.644–0.691], 0.687 [0.673–0.700], and 0.696 [0.682–0.710] respectively. WHtR was the most commonly associated risk factor in screening Japanese individuals for MS.
Shen et al. [15] evaluated whether WC correlated more strongly with MS components than percent fat and other related anthropometric factors, such as BMI, in 1010 healthy white and African-American men and women. Their results demonstrated that WC was most strongly associated with MS, followed by BMI.
Rodea-Montero et al. [16] identified the associations between anthropometric factors and MS in 110 Mexican obese adolescents. BMI, WC, and WHtR were evaluated as anthropometric factors. The investigators used ROC curves to identify significant predictors. The AUC values of BMI, WC, and WHtR were 0.651 [95% CI, 0.547–0.755], 0.704 [0.604–0.804], and 0.652 [0.544–0.759], respectively. They found that WHtR was associated more strongly than WC and BMI for identifying metabolic risk.
Williams et al. [18] demonstrated the association between GLU and MS. Their study enrolled 802 subjects aged 40–65 years who were randomly selected from a population-based sampling frame. Their study identified four dietary patterns using principal component analysis. These dietary patterns were related to other lifestyle factors, such as the socioeconomic group, smoking, alcohol intake, and physical activity. In component 1, there was a negative association with diabetes as one of the causes of MS. According to the results, dietary patterns were associated with GLU intolerance and MS.
Lao et al. [19] investigated the association between white blood cell (WBC) count and MS in old Chinese patients. The analyzed dataset (obtained from a medical checkup record) consisted of 3020 men and 7256 women aged 50–85 years. Vascular risk factors (e.g., WC, BMI, TG, TC, LDL, C-reactive protein, SBP, and DBP) were associated with WBCs both in men and women. The risk of MS increased significantly with higher WBC counts (OR = 1.86 [1.43–2.42]). There was a strong association between WBC count and vascular risk factors of MS.
Funakoshi et al. [20] investigated the association of airflow obstruction with MS in Japanese men. Their dataset consisted of 7189 subjects aged 45–88 years from spirometric lung function tests at medical checkups. The airflow obstruction was divided into two parts (GOLD I and GOLD II–IV) according to GOLD guidelines. The incidence rate of MS was higher in subjects with GOLD II–IV than in those with normal lung function (OR = 1.33 [1.01–1.76]). Additionally, the MS component WC was associated with MS (OR = 1.76 [1.24–2.50]) and BP (OR = 1.37 [1.08–1.74]).
Paek et al. [22] evaluated the association between impaired lung function and metabolic risk factors, enrolling 4001 subjects aged > 18 years in 2001 from the KNHANES dataset. Using multiple linear regression, they analyzed the association of low pulmonary function with MS. They also examined the associations of restrictive lung disease and obstructive lung disease with MS using multiple logistic regression adjusting for WHtR, sex, age, smoking, physical activity, alcohol consumption, and socioeconomic status. WC, SBP, and TG were associated with FVC. They showed that the association of low pulmonary function with MS risk factors and restrictive lung disease (OR = 1.40 [1.01–1.98]) was also related to MS.
Park et al. [23] investigated the association between chronic obstructive pulmonary disease (COPD) and MS. Their dataset comprised 1215 subjects aged > 40 years from the KNHANES in 2001. The prevalence of MS was significantly high among COPD patients in both men and women (33.0% and 48.5% higher, respectively). In men, the risk of COPD (OR = 2.03 [1.08–3.80]) was associated with MS and abdominal obesity (OR = 1.95 [0.93–4.11]).
Lin et al. [24] studied the relationship between impaired lung function and MS in adults. Their study assessed 46,514 patients (21,669 men and 24,845 women) aged > 20 years, recruited from four nationwide MJ Health Screening Centers in Taiwan. The investigators examined associations between lung function test results and MS using multivariate logistic regression. They demonstrated the association between restrictive lung impairment and an increased risk of MS (p < 0.01, OR = 1.221), adjusting for age, sex, BMI, smoking, alcohol consumption, and physical activity.
This study showed results similar to those of previous studies [12,13,14,15,16,17,18,19,20,21,22,23,24] regarding the association of MS with anthropometric, blood, urinary, and spirometric factors. Specifically, TG exhibited the strongest association among all parameters in both men and women. With regard to anthropometric factors, WHtR showed the strongest association in both men and women. Concerning blood parameters, GLU showed a strong positive association. With respect to urinary parameters, UPH showed a negative association with MS. Regarding spirometric factors, FEV6 and FVC exhibited negative associations with MS.
Choe et al. [38] constructed and analyzed the five MS prediction models including the MLP (multilayer perceptron), NB, RF (random forest classification), CT (decision tree), and SVM (support vector machine). As for the AUC, the NB model showed the highest predictive power at 0.690. Kopitar et al. [47] evaluated and validated T2DM (type 2 diabetes mellitus) prediction model including lm (linear regression model), Glmnet (regularized generalized linear model), RF, XGBoot (extreme gradient boosting), and LightGBM (light gradient boosting machine) by RMSE, AUC, AUPRC, R2, and calibration plot. RF showed the best performance according to RMSE. In our study, as for the results of performance analysis and calibration plot, the wrapper_LR model showed the best performance in both men (AUC = 0.868) and women AUC = 0.932), respectively.
Overall, our current findings show that anthropometric, blood, urinary, and spirometric factors might be involved in the induction of MS. Specifically, there was increased association of WC and WHtR, and decreased association of TG, UPH, FEV6, and FVC with MS. The wrapper based logistic regression model showed a high predictive power for both men and women.
Collectively, all the studies, including ours, identified different potent indicators of MS, demonstrating that no single factor could serve as an effective marker for the identifying MS. This confirms the concept that co-occurring conditions contribute to development of the disease. Thus, a subgroup of individuals with shared pathophysiology, and hence a common strong indicator, might be at high risk of a specific comorbid disease. Therefore, subgroup stratification of MS might be necessary for partitioning risk factor clusters involved, which should provide insight into personalizing pharmacological and lifestyle modifications as treatment approaches for managing the condition.
This study had several limitations: First, it was difficult to determine cause-and-effect associations due to the cross-sectional design of the study. Second, our results were limited to Korean adults because of the KNHANES dataset employed. Nonetheless, despite the identification of specific indicators of MS, which confirmed the findings of previous reports utilizing machine learning, our results indicated sex-based differences in MS risk factors.
5. Conclusions
MS is closely related to well-known major diseases, such as CVD, stroke, cancer, and T2D. Thus, it is increasingly attracting attention as an objective health indicator worldwide. In this study, we investigated the associations between MS and anthropometric factors, blood parameters, and spirometric factors, and evaluated their predictive performance using prediction models. Binary logistic regression analysis was used for statistical analysis, and the wrapper and filter methods were used for feature selection. Based on the selected factors, prediction models were constructed using NB and logistic regression algorithms. The results showed that WHtR, WC, TG, GLU, UPH, FEV6, and FVC were associated with MS. In particular, TG in men and GLU in women were both highly significant risk factors in participants with MS. According to AUC analysis, TG in men and WHtR in women showed strongest predictive powers for the disease among all factors. FEV6 and FVC represented high predictive power among the spirometric factors. The wrapper-based logistic regression prediction model showed highest predictive performance in both men and women. In the calibration curve for verification of the predictive model, the wrapper_LR showed the highest performance in men and women. Thus, our results provide fundamental clinical information supporting the prevention and management of MS, and our model shows potential as a large-scale screening tool.
Author Contributions
Conceptualization, S.Y.K., B.M.H.; formal analysis, S.Y.K., G.H.N.; investigation, S.Y.K.; validation, S.Y.K.; writing—original draft preparation, S.Y.K., B.M.H.; writing—review and editing, S.Y.K., G.H.N., B.M.H. All authors have reviewed and agreed to the publication of the final version of this manuscript.
Funding
This research was supported by the Technology Innovation Program (20003641, Development and Dissemination on National Standard Reference Data) funded by the Ministry of Trade, Industry & Energy (MOTIE, Korea) and National Measurement Standard Services and Technical Services for SME funded by Korea Research Institute of Standards and Science (KRISS–2020–GP2020-0012).
Acknowledgments
We are thankful to the CDC, Division of Health and Nutrition Survey for, providing data for this study. We would also like to thank our colleagues for research consultation.
Conflicts of Interest
The authors declare no conflict of interest.
Abbreviations
MS, metabolic syndrome; AUC, area under the curve; AUPRC, area under the precision-recall curve; RMSE, root mean square error; HT, height; WT, weight; WC, waist circumference; WHtR, waist-to-height ratio; GLU, glucose; HBA1C, hemoglobin A1c; TC, total cholesterol; HDL, high-density lipid cholesterol, TG, triglyceride; AST, aspartate aminotransferase; ALT, alanine aminotransferase; HB, hemoglobin; HCT, hematocrit; BUN, blood urea nitrogen; CRT, creatinine; WBC, white blood cell; RBC, red blood cell; UPH, uric acid pH; USG, uric specific gravity; UCRT, uric creatinine; FVC, forced vital capacity; FEV1, forced expiratory volume in 1s; FEV1FVC, ratio of forced expiratory volume in 1s to forced vital capacity; FEV6, forced expiratory volume in 6s; FEF25-75, forced expiratory flow 25–75%; PEF, peak expiratory flow.
References
- Cameron, A.J.; Shaw, J.E.; Zimmet, P.Z. The metabolic syndrome: Prevalence in worldwide populations. Endocrinol. Metab. Clin. N. Am. 2004, 33, 351–375. [Google Scholar] [CrossRef] [PubMed]
- Wilson, P.W.F.; Meigs, J.B. Cardiometabolic risk: A Framingham perspective. Int. J. Obes. 2008, 32, S17–S20. [Google Scholar] [CrossRef] [PubMed]
- Stocks, T.; Hemelrijck, M.V.; Manjer, J.; Bjørge, T.; Ulmer, H.; Hallmans, G.; Lindkvist, B.; Selmer, R.; Nagel, G.; Tretli, S.; et al. Blood pressure and risk of cancer incidence and mortality in the Metabolic Syndrome and Cancer Project. Hypertension 2012, 59, 802–810. [Google Scholar] [CrossRef] [PubMed]
- Boden-Albala, B.; Sacco, R.L.; Lee, H.-S.; Grahame-Clarke, C.; Rundek, T.; Elkind, M.V.; Wright, C.; Giardina, E.-G.V.; DiTullio, M.R.; Homma, S.; et al. Metabolic syndrome and ischemic stroke risk. Stroke 2008, 39, 30–35. [Google Scholar] [CrossRef]
- Korea Center for Disease Control and Prevention. Available online: http://www.cdc.go.kr/ (accessed on 21 August 2020).
- Statistics Research Institute. Available online: http://kostat.go.kr/sri/srikor/index.action (accessed on 21 August 2020).
- Beltrán-Sánchez, H.; Harhay, M.O.; Harhay, M.M.; McElligott, S. Prevalence and trends of metabolic syndrome in the adult U.S. population, 1999–2010. J. Am. Coll. Cardiol. 2013, 62, 697–703. [Google Scholar] [CrossRef]
- Ranasinghe, P.; Mathangasinghe, Y.; Jayawardena, R.; Hills, A.P.; Misra, A. Prevalence and trends of metabolic syndrome among adults in the Asia-Pacific region: A systematic review. BMC Public Health 2017, 17, 101. [Google Scholar] [CrossRef]
- Mannino, D.M.; Thorn, D.; Swensen, A.; Holguin, F. Prevalence and outcomes of diabetes, hypertension and cardiovascular disease in COPD. Eur. Respir. J. 2008, 32, 962–969. [Google Scholar] [CrossRef]
- Schroeder, E.B.; Welch, V.L.; Couper, D.; Nieto, F.J.; Liao, D.; Rosamond, W.D.; Heiss, G. Lung function and incident coronary heart disease: The Atherosclerosis Risk in Communities Study. Am. J. Epidemiol. 2003, 158, 1171–1181. [Google Scholar] [CrossRef]
- Engström, G.; Hedblad, B.; Valind, S.; Janzon, L. Increased incidence of myocardial infarction and stroke in hypertensive men with reduced lung function. J. Hypertens. 2001, 19, 295–301. [Google Scholar] [CrossRef]
- Sagun, G.; Oguz, A.; Karagoz, E.; Filizer, A.T.l.; Tamer, G.; Mesci, B. Application of alternative anthropometric measurements to predict metabolic syndrome. Clinics 2014, 69, 347–353. [Google Scholar] [CrossRef]
- Mooney, S.J.; Baecker, A.; Rundle, A.G. Comparison of anthropometric and body composition measures as predictors of components of the metabolic syndrome in a clinical setting. Obes. Res. Clin. Pract. 2013, 7, e55–e66. [Google Scholar] [CrossRef] [PubMed]
- Hsieh, S.D.; Muto, T. Metabolic syndrome in Japanese men and women with special reference to the anthropometric criteria for the assessment of obesity: Proposal to use the waist-to-height ratio. Prev. Med. 2006, 42, 135–139. [Google Scholar] [CrossRef]
- Shen, W.; Punyanitya, M.; Chen, J.; Gallagher, D.; Albu, J.; Pi-Sunyer, X.; Lewis, C.E.; Grunfeld, C.; Heshka, S.; Heymsfield, S.B. Waist circumference correlates with metabolic syndrome indicators better than percentage fat. Obesity 2006, 14, 727–736. [Google Scholar] [CrossRef] [PubMed]
- Rodea-Montero, E.R.; Evia-Viscarra, M.L.; Apolinar-Jiménez, E. Waist-to-height ratio is a better anthropometric index than waist circumference and BMI in predicting metabolic syndrome among obese Mexican adolescents. Int. J. Endocrinol. 2014, 2014, 1–9. [Google Scholar] [CrossRef]
- Katzmarzyk, P.T.; Church, T.S.; Janssen, I.; Ross, R.; Blair, S.N. Metabolic syndrome, obesity, and mortality: Impact of cardiorespiratory fitness. Diabetes Care 2005, 28, 391–397. [Google Scholar] [CrossRef] [PubMed]
- Williams, D.E.M.; Prevost, A.T.; Whichelow, M.J.; Cox, B.D.; Day, N.E.; Wareham, N.J. A cross-sectional study of dietary patterns with glucose intolerance and other features of the metabolic syndrome. Br. J. Nutr. 2000, 83, 257–266. [Google Scholar] [CrossRef]
- Lao, X.Q.; Neil Thomas, G.; Jiang, C.; Zhang, W.; Adab, P.; Lam, T.H.; Cheng, K.K. White blood cell count and the metabolic syndrome in older Chinese: The Guangzhou Biobank Cohort Study. Atherosclerosis 2008, 201, 418–424. [Google Scholar] [CrossRef]
- Funakoshi, Y.; Omori, H.; Mihara, S.; Marubayashi, T.; Katoh, T. Association between airflow obstruction and the metabolic syndrome or its components in Japanese men. Intern. Med. 2010, 49, 2093–2099. [Google Scholar] [CrossRef]
- McDevitt, R.M.; Poppitt, S.D.; Murgatroyd, P.R.; Prentice, A.M. Macronutrient disposal during controlled overfeeding with glucose, fructose, sucrose, or fat in lean and obese women. Am. J. Clin. Nutr. 2000, 72, 369–377. [Google Scholar] [CrossRef]
- Paek, Y.J.; Jung, K.S.; Hwang, Y.I.; Lee, K.S.; Lee, D.R.; Lee, J.U. Association between low pulmonary function and metabolic risk factors in Korean adults: The Korean National Health and Nutrition Survey. Metabolism 2010, 59, 1300–1306. [Google Scholar] [CrossRef]
- Park, B.H.; Park, M.S.; Chang, J.; Kim, S.K.; Kang, Y.A.; Jung, J.Y.; Kim, Y.S.; Kim, C. Chronic obstructive pulmonary disease and metabolic syndrome: A nationwide survey in Korea. Int. J. Tuberc. Lung Dis. 2012, 16, 694–700. [Google Scholar] [CrossRef] [PubMed]
- Lin, W.Y.; Yao, C.A.; Wang, H.C.; Huang, K.C. Impaired lung function is associated with obesity and metabolic syndrome in adults. Obesity 2006, 14, 1654–1661. [Google Scholar] [CrossRef] [PubMed]
- Wulczyn, E.; Steiner, D.F.; Xu, Z.; Sadhwani, A.; Wang, H.; Flament-Auvigne, I.; Mermel, C.H.; Chen, P.-H.C.; Liu, Y.; Stumpe, M.C. Deep learning-based survival prediction for multiple cancer types using histopathology images. PLoS ONE 2020, 15, e0233678. [Google Scholar] [CrossRef]
- Kopp, W.; Monti, R.; Tamburrini, A.; Ohler, U.; Akalin, A. Deep learning for genomics using Janggu. Nat. Commun. 2020, 11, 1–7. [Google Scholar] [CrossRef] [PubMed]
- Sonogashira, M.; Shonai, M.; Iiyama, M. High-resolution bathymetry by deep-learning-based image superresolution. PLoS ONE 2020, 15, e0235487. [Google Scholar] [CrossRef]
- Davagdorj, K.; Pham, V.H.; Theera-Umpon, N.; Ryu, K.H. XGBoost-based framework for smoking-induced noncommunicable disease prediction. Int. J. Environ. Res. Public Health 2020, 17, 6513. [Google Scholar] [CrossRef]
- Munkhdalai, L.; Munkhdalai, T.; Ryu, K.H. GEV-NN: A deep neural network architecture for class imbalance problem in binary classification. Knowl. Based Syst. 2020, 105534. [Google Scholar] [CrossRef]
- Davagdorj, K.; Lee, J.S.; Pham, V.H.; Ryu, K.H. A comparative analysis of machine learning methods for class imbalance in a smoking cessation intervention. Appl. Sci. 2020, 10, 3307. [Google Scholar] [CrossRef]
- Amarbayasgalan, T.; Park, K.H.; Lee, J.Y.; Ryu, K.H. Reconstruction error based deep neural networks for coronary heart disease risk prediction. PLoS ONE 2019, 14, e0225991. [Google Scholar] [CrossRef]
- Batbaatar, E.; Ryu, K.H. Ontology-based healthcare named entity recognition from Twitter messages using a recurrent neural network approach. Int. J. Environ. Res. Public Health 2019, 16, 3628. [Google Scholar] [CrossRef]
- Ryu, K.S.; Bae, J.-W.; Jeong, M.H.; Cho, M.-C.; Ryu, K.-H.; Investigators, K.A.M.I.R. Risk scoring system for prognosis estimation of multivessel disease among patients with ST-segment elevation myocardial infarction. Int. Hear. J. 2019, 60, 708–714. [Google Scholar] [CrossRef] [PubMed]
- Heo, B.M.; Ryu, K.H. Prediction of prehypertension and hypertension based on anthropometry, blood parameters, and spirometry. Int. J. Environ. Res. Public Health 2018, 15, 2571. [Google Scholar] [CrossRef] [PubMed]
- Piao, Y.; Piao, M.; Ryu, K.H. Multiclass cancer classification using a feature subset-based ensemble from microRNA expression profiles. Comput. Biol. Med. 2017, 80, 39–44. [Google Scholar] [CrossRef]
- Kim, H.; Ishag, M.I.M.; Piao, M.; Kwon, T.; Ryu, K.H. A data mining approach for cardiovascular disease diagnosis using heart rate variability and images of carotid arteries. Symmetry 2016, 8, 47. [Google Scholar] [CrossRef]
- Ryu, K.S.; Park, H.W.; Park, S.H.; Shon, H.S.; Ryu, K.H.; Lee, D.G.; Bashir, M.E.; Lee, J.H.; Kim, S.M.; Lee, S.Y. Comparison of clinical outcomes between culprit vessel only and multivessel percutaneous coronary intervention for ST-segment elevation myocardial infarction patients with multivessel coronary diseases. J. Geriatr. Cardiol. 2015, 12, 208. [Google Scholar]
- Choe, E.K.; Rhee, H.; Lee, S.; Shin, E.; Oh, S.W.; Lee, J.E.; Choi, S.H. Metabolic Syndrome Prediction Using Machine Learning Models with Genetic and Clinical Information from a Nonobese Healthy Population. Genom. Inform. 2018, 16, e31. [Google Scholar] [CrossRef] [PubMed]
- Korea Centers for Disease Control and Prevention: Korea National Health and Nutrition Examination Survey. Available online: https://knhanes.cdc.go.kr/knhanes/eng/index.do (accessed on 20 January 2020).
- Ministry of Health and Welfare of Korea; Korea Centers for Disease Control and Prevention. The Fifth Korea National Health and Nutrition Examination Survey Data User Guide (KNHANES V) 2010–2012; Korea Centers for Disease Control and Prevention Press: Cheongju, Korea, 2012. [Google Scholar]
- Ministry of Health and Welfare of Korea; Korea Centers for Disease Control and Prevention. The Sixth Korea National Health and Nutrition Examination Survey Data User Guide (KNHANES VI) 2013–2015; Korea Centers for Disease Control and Prevention Press: Cheongju, Korea, 2015. [Google Scholar]
- Grundy, S.M.; Cleeman, J.I.; Daniels, S.R.; Donato, K.A.; Eckel, R.H.; Franklin, B.A.; Gordon, D.J.; Krauss, R.M.; Savage, P.J.; Smith, S.C.; et al. Diagnosis and Management of the Metabolic Syndrome. Circulation 2005, 112, 2735–2752. [Google Scholar] [CrossRef]
- Saeys, Y.; Inza, I.; Larrañaga, P. A review of feature selection techniques in bioinformatics. Bioinformatics 2007, 23, 2507–2517. [Google Scholar] [CrossRef]
- Statistics Korea Web Sites. Available online: http://kostat.go.kr (accessed on 1 September 2020).
- Kim, S.Y.; Nam, G.H. Assessment of Anthropometric and Body Composition Risk Factors in Patients with both Hypertension and Stroke in the Korean Population. Appl. Sci. 2020, 10, 3046. [Google Scholar] [CrossRef]
- Kohavi, R. A study of cross-validation and bootstrap for accuracy estimation and model selection. In Proceedings of the 14th International Joint Conference on Artificial Intelligence (IJCAI), Montreal, QC, Canada, 20–25 August 1995; Volume 2, pp. 1137–1145. [Google Scholar]
- Kopitar, L.; Kocbek, P.; Cilar, L.; Sheikh, A.; Stiglic, G. Early detection of type 2 diabetes mellitus using machine learning-based prediction models. Sci. Rep. 2020, 10, 11981. [Google Scholar] [CrossRef]


Publisher’s Note: MDPI stays neutral with regard to jurisdictional claims in published maps and institutional affiliations. |
© 2020 by the authors. Licensee MDPI, Basel, Switzerland. This article is an open access article distributed under the terms and conditions of the Creative Commons Attribution (CC BY) license (http://creativecommons.org/licenses/by/4.0/).