Physical Movement Demands of Training and Matches across a Full Competition Cycle in Elite Netball


Abstract
1. Introduction
2. Materials and Methods
2.1. Participants
2.2. Data Collection
2.3. Key Season Events
2.4. Data Analysis
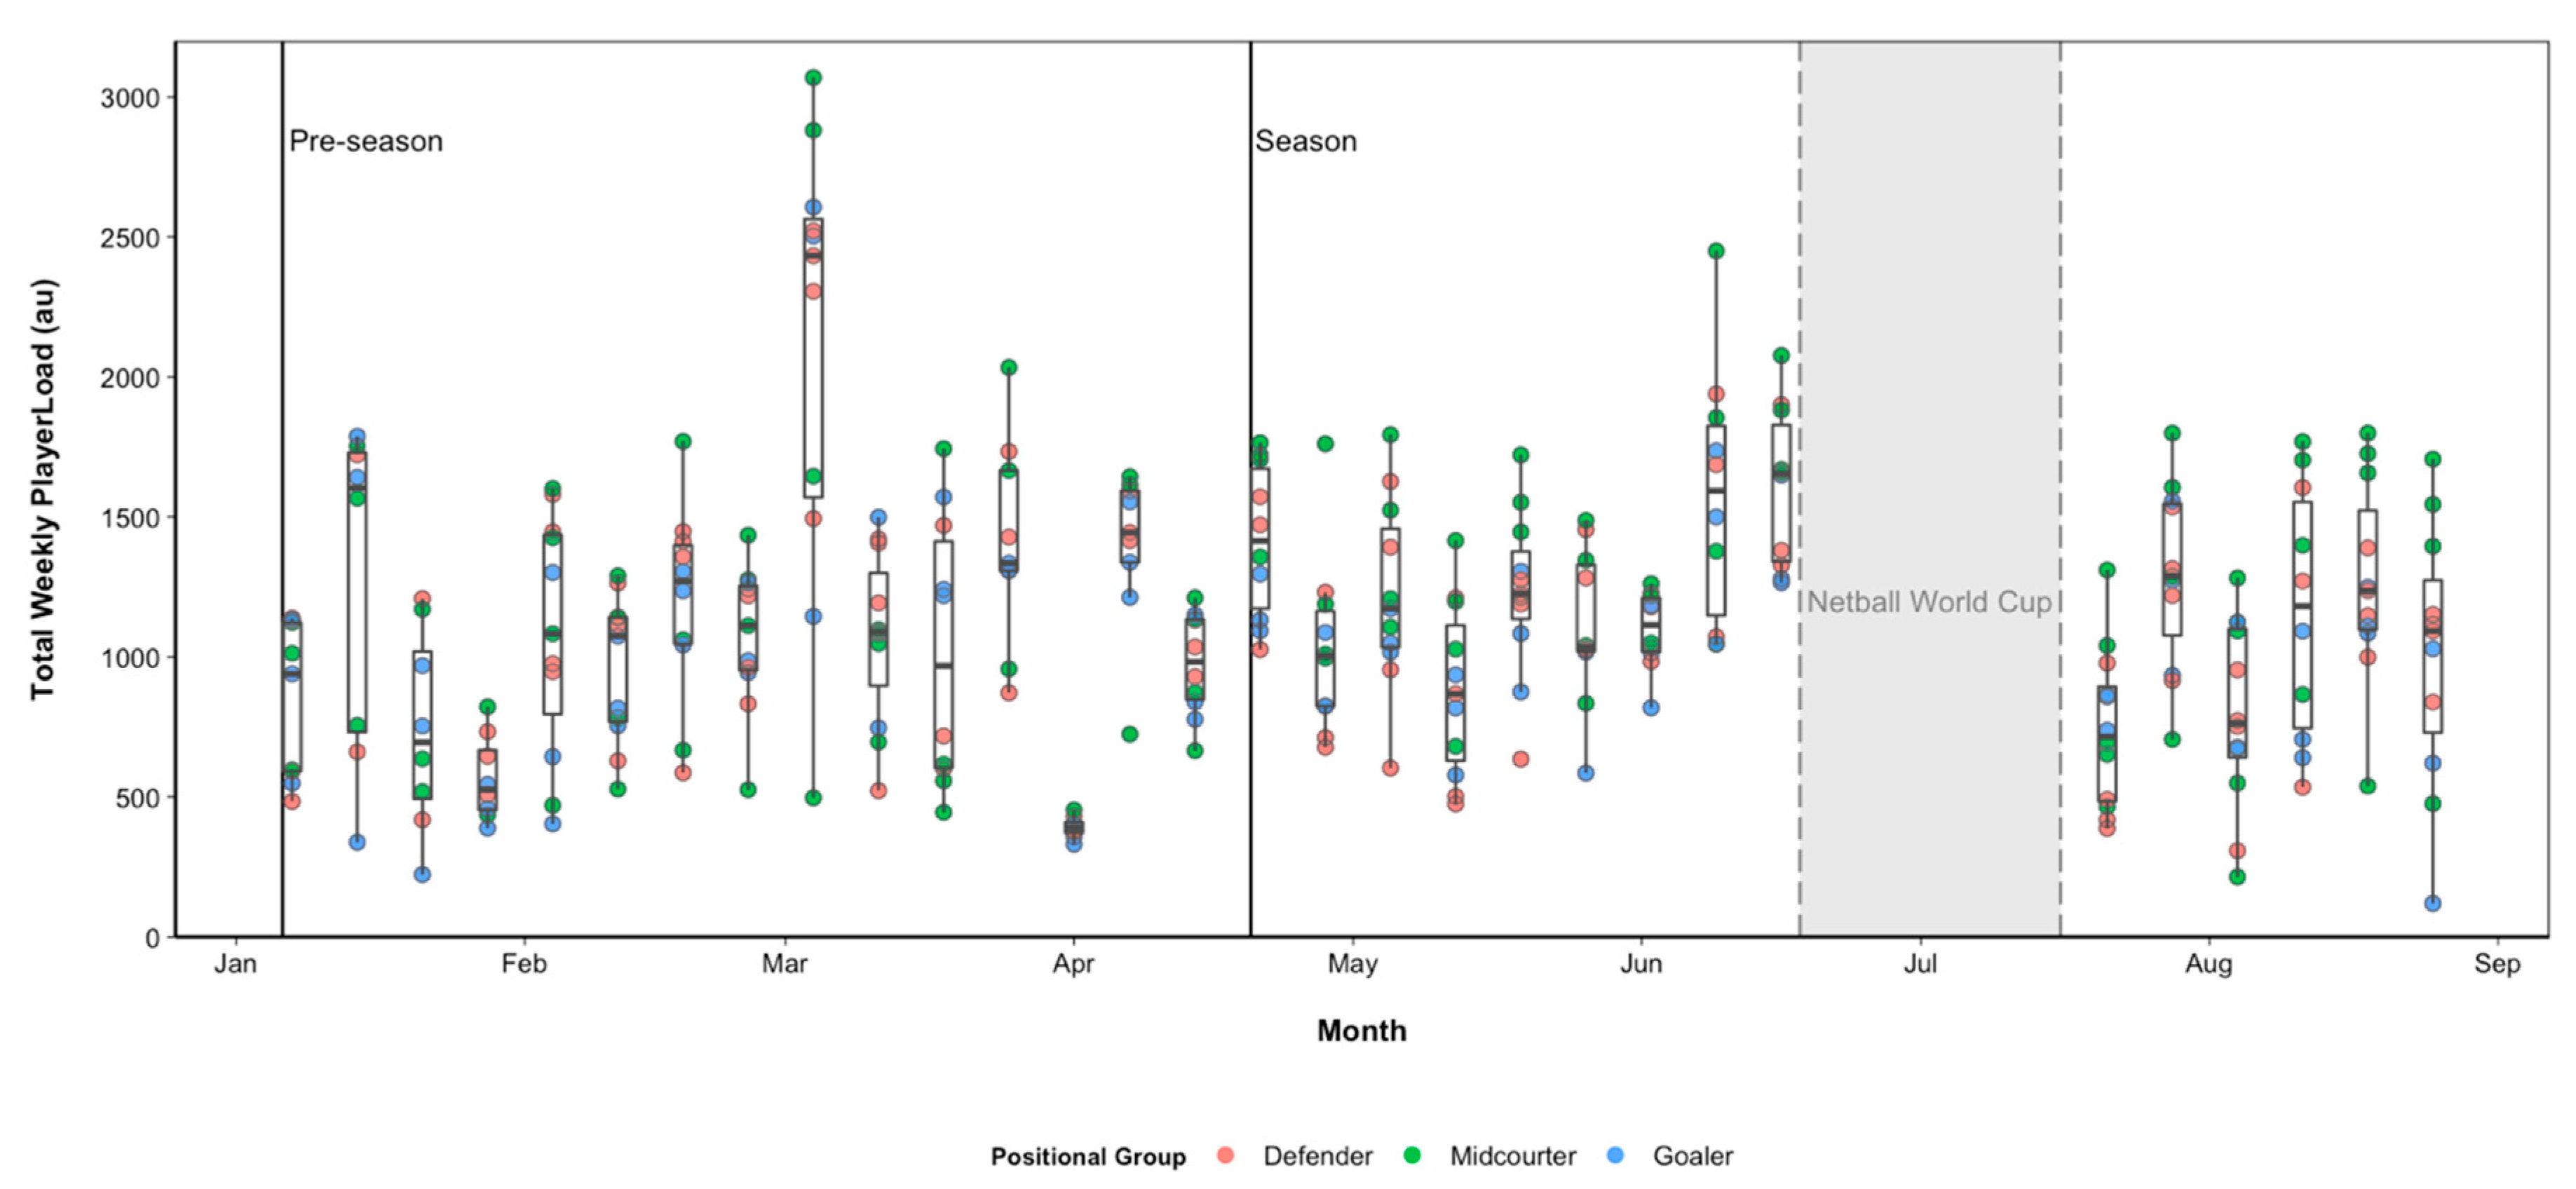
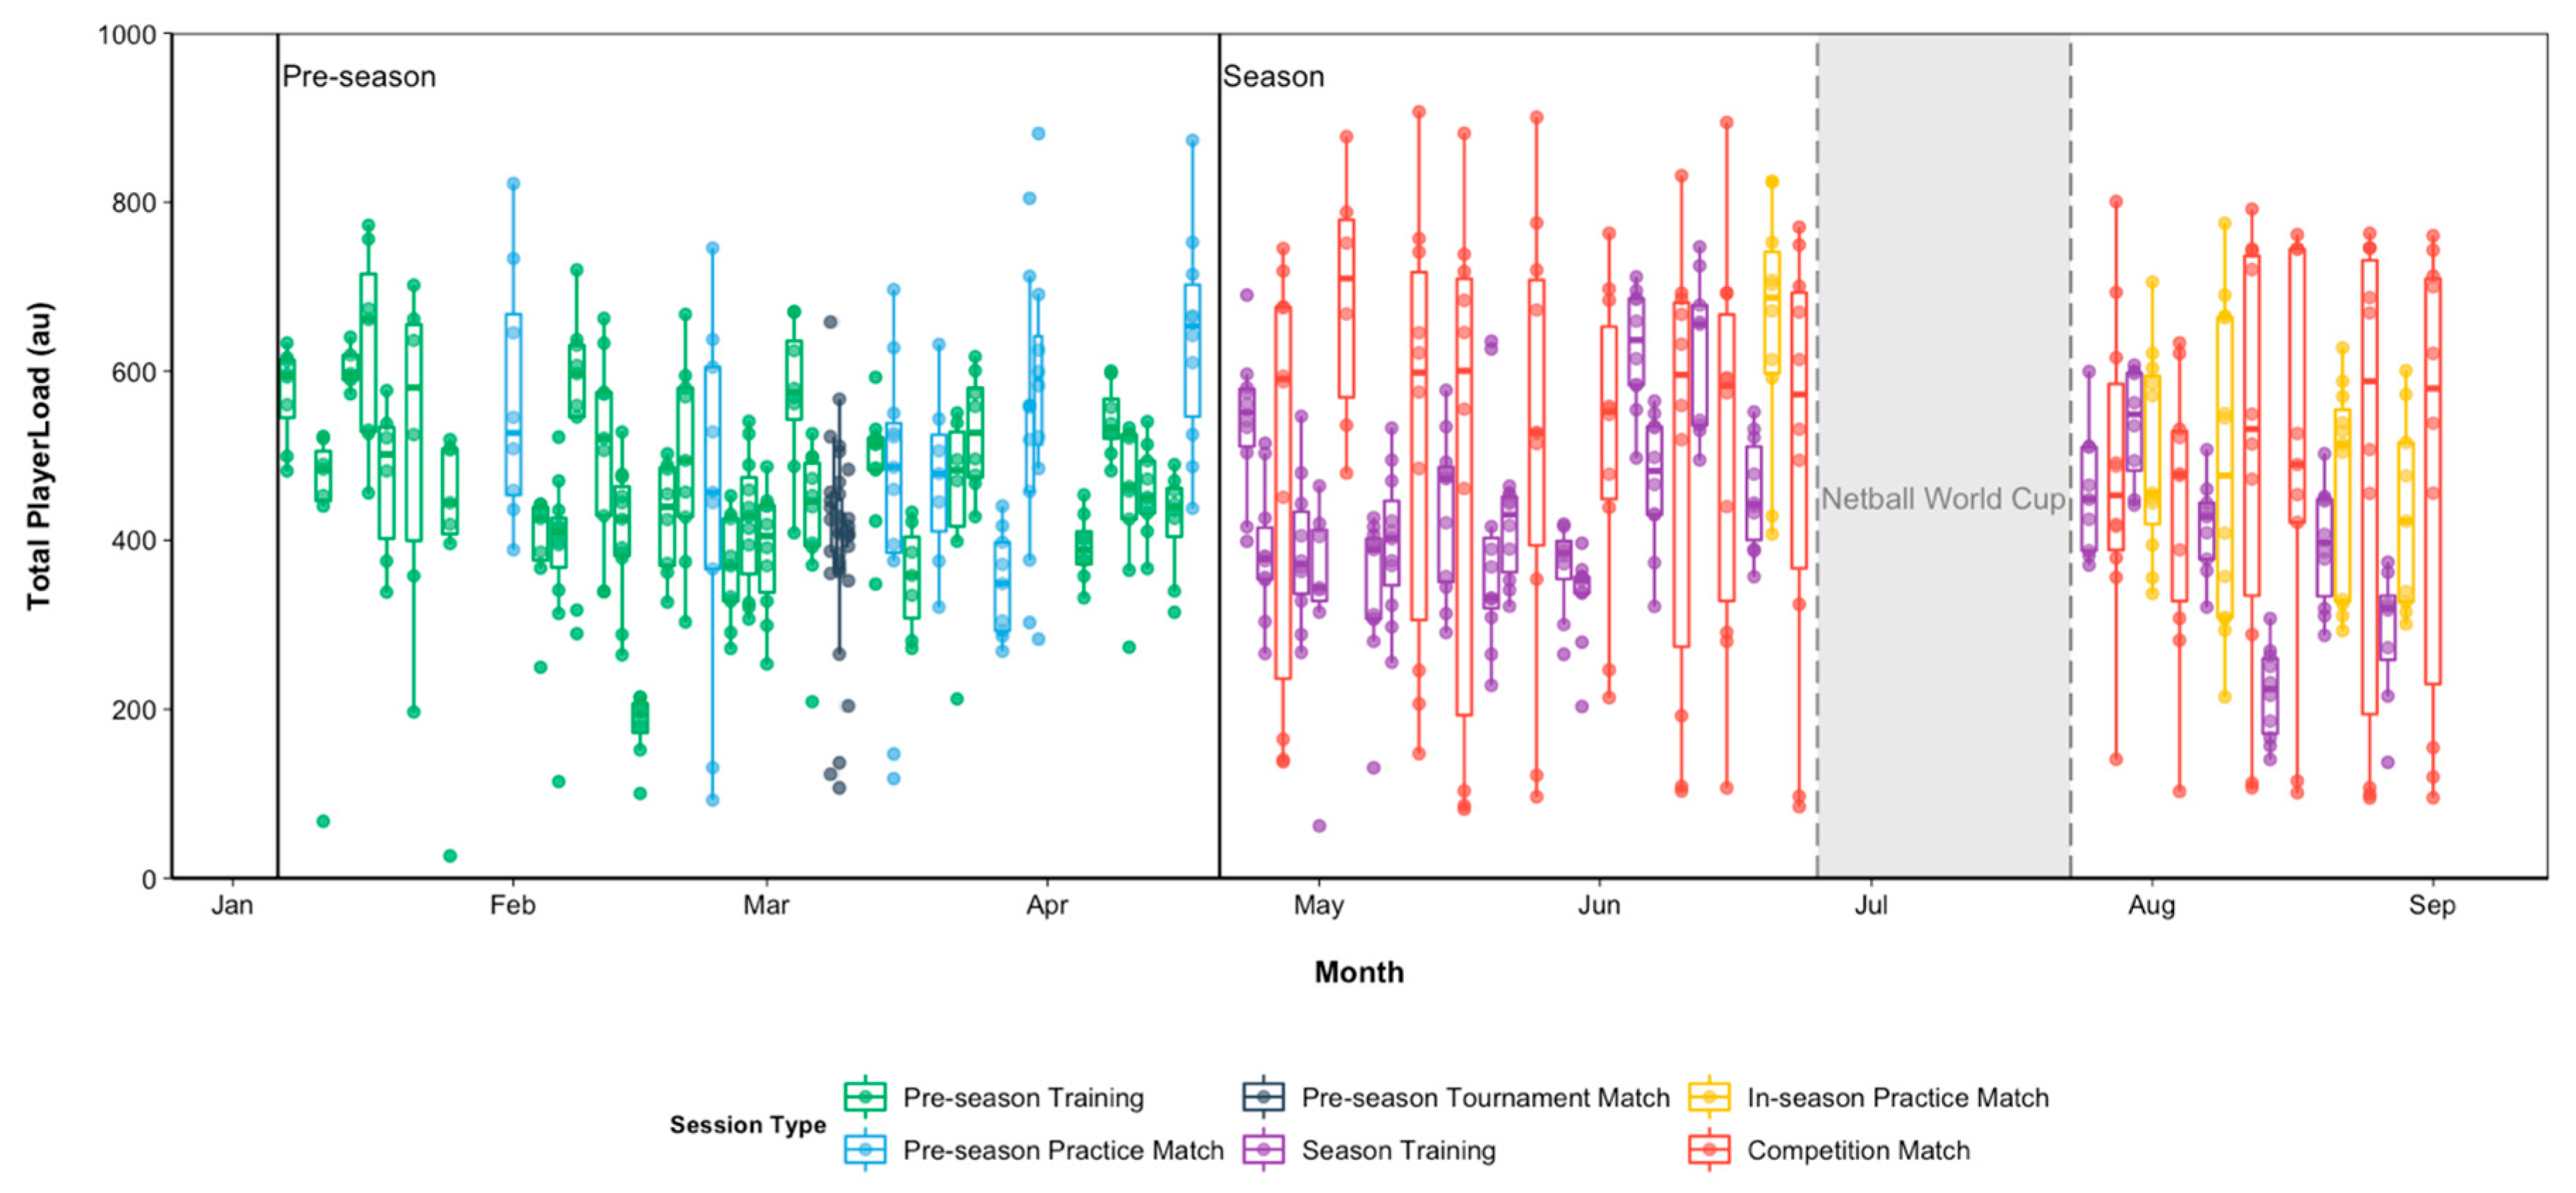
3. Results
3.1. Absolute Session Demands
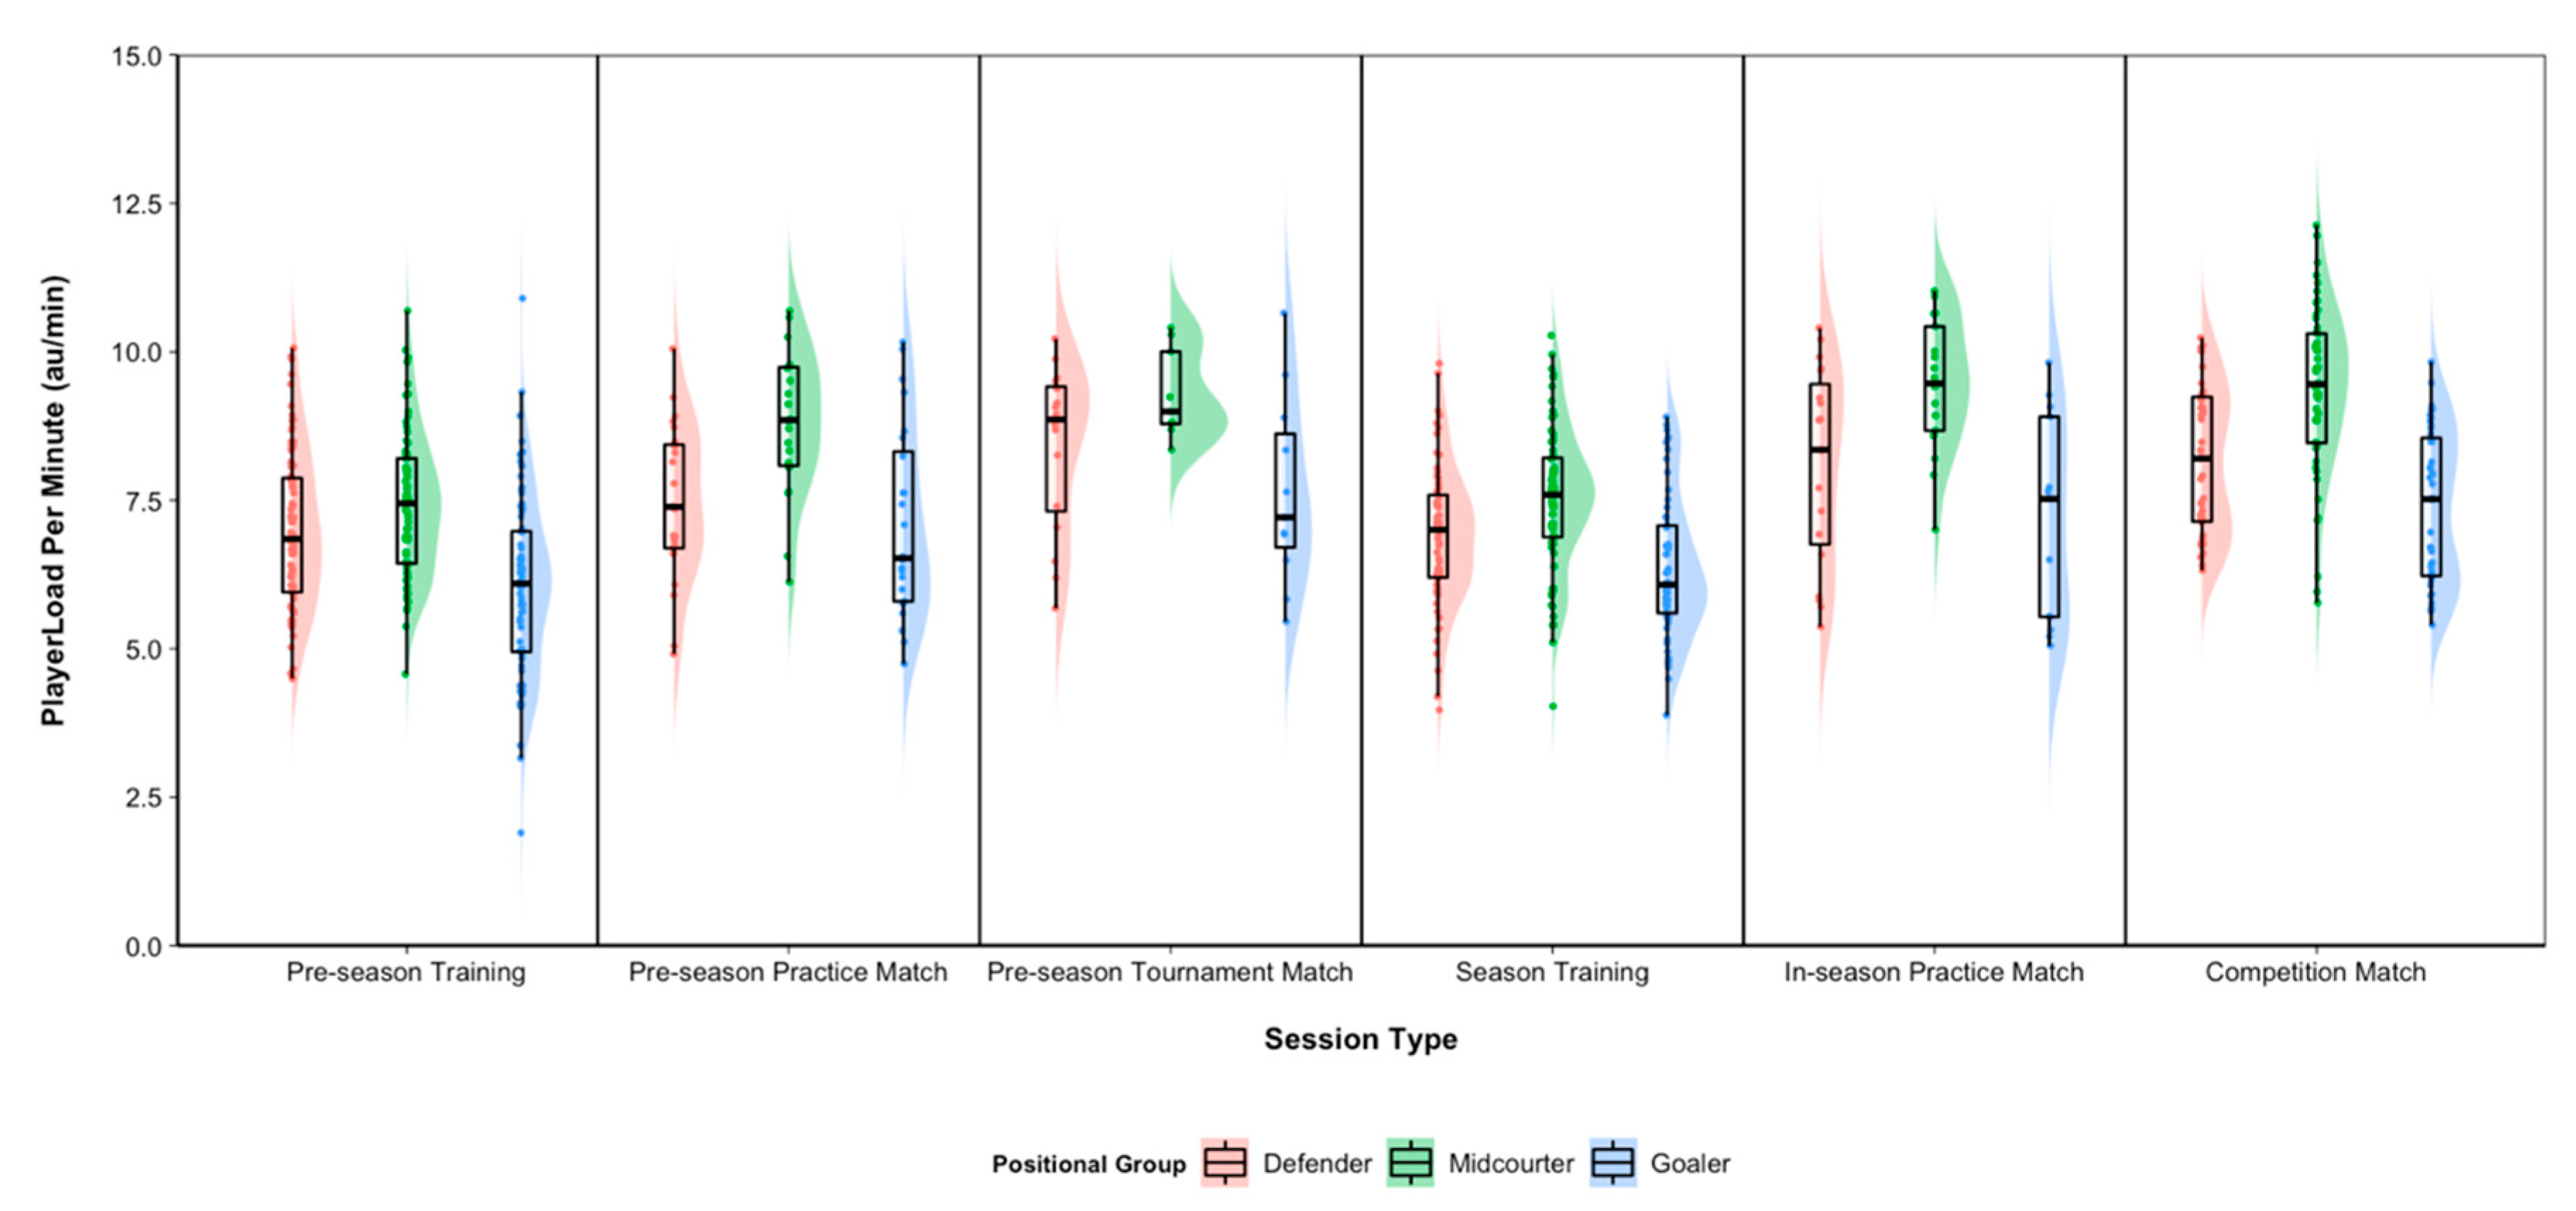
3.2. Relative Session Demands
4. Discussion
5. Conclusions
Author Contributions
Funding
Acknowledgments
Conflicts of Interest
References
- Campbell, B.I.; Bove, D.; Ward, P.; Vargas, A.; Dolan, J. Quantification of Training Load and Training Response for Improving Athletic Performance. Strength Cond. J. 2017, 39, 3–13. [Google Scholar] [CrossRef]
- Gamble, P. Periodization of training for team sports athletes. Strength Cond. J. 2006, 28, 56–66. [Google Scholar] [CrossRef]
- Black, C.J.; Till, K.; O’Hara, J.P.; Davidson, J.; Jones, B. Top secret training data? External training loads of a cup winning English Super League rugby league team. Int. J. Sports Sci. Coach. 2017, 13, 236–242. [Google Scholar] [CrossRef]
- Paulauskas, H.; Kreivyte, R.; Scanlan, A.T.; Moreira, A.; Siupsinskas, L.; Conte, D. Monitoring Workload in Elite Female Basketball Players During the In-Season Phase: Weekly Fluctuations and Effect of Playing Time. Int. J. Sports Physiol. Perform. 2019, 14, 941–948. [Google Scholar] [CrossRef]
- Ritchie, D.; Hopkins, W.G.; Buchheit, M.; Cordy, J.; Bartlett, J.D. Quantification of Training and Competition Load Across a Season in an Elite Australian Football Club. Int. J. Sports Physiol. Perform. 2016, 11, 474–479. [Google Scholar] [CrossRef] [PubMed]
- Young, C.M.; Gastin, P.B.; Sanders, N.; Mackey, L.; Dwyer, D.B. Player Load in Elite Netball: Match, Training, and Positional Comparisons. Int. J. Sports Physiol. Perform. 2016, 11, 1074–1079. [Google Scholar] [CrossRef]
- Brooks, E.R.; Benson, A.C.; Fox, A.S.; Bruce, L.M. Physical movement demands of elite-level netball match-play as measured by an indoor positioning system. J. Sports Sci. 2020, 38, 1488–1495. [Google Scholar] [CrossRef]
- Chandler, P.T.; Pinder, S.J.; Curran, J.D.; Gabbett, T.J. Physical Demands of Training and Competition in Collegiate Netball Players. J. Strength Cond. Res. 2014, 28, 2732–2737. [Google Scholar] [CrossRef]
- Cormack, S.J.; Smith, R.L.; Mooney, M.M.; Young, W.B.; O’Brien, B.J. Accelerometer Load as a Measure of Activity Profile in Different Standards of Netball Match Play. Int. J. Sports Physiol. Perform. 2014, 9, 283–291. [Google Scholar] [CrossRef]
- Simpson, M.J.; Jenkins, D.G.; Scanlan, A.T.; Kelly, V.G. Relationships Between External- and Internal-Workload Variables in an Elite Female Netball Team and Between Playing Positions. Int. J. Sports Physiol. Perform. 2020, 15, 841–846. [Google Scholar] [CrossRef] [PubMed]
- Bredt, S.D.G.T.; Chagas, M.H.; Peixoto, G.H.; Menzel, H.J.; De Andrade, A.G.P. Understanding Player Load: Meanings and Limitations. J. Hum. Kinet. 2020, 71, 5–9. [Google Scholar] [CrossRef] [PubMed]
- Sweeting, A.J.; Aughey, R.J.; Cormack, S.J.; Morgan, S. Discovering frequently recurring movement sequences in team-sport athlete spatiotemporal data. J. Sports Sci. 2017, 35, 2439–2445. [Google Scholar] [CrossRef]
- Serpiello, F.R.; Hopkins, W.G.; Barnes, S.; Tavrou, J.; Duthie, G.; Aughey, R.J.; Ball, K. Validity of an ultra-wideband local positioning system to measure locomotion in indoor sports. J. Sports Sci. 2017, 36, 1727–1733. [Google Scholar] [CrossRef]
- Alarifi, A.; Al-Salman, A.; Alsaleh, M.; Alnafessah, A.; Al-Hadhrami, S.; Al-Ammar, M.A.; Al-Khalifa, H.S. Ultra Wideband Indoor Positioning Technologies: Analysis and Recent Advances. Sensors 2016, 16, 707. [Google Scholar] [CrossRef] [PubMed]
- Thomas, C.; Ismail, K.T.; Simpson, R.; Comfort, P.; Jones, P.A.; Dos’santos, T. Physical Profiles of Female Academy Netball Players by Position. J. Strength Cond. Res. 2019, 33, 1601–1608. [Google Scholar] [CrossRef]
- Bruce, L.M.; Farrow, D.; Raynor, A.J.; Mann, D.L. But I can’t pass that far! The influence of motor skill on decision making. Psychol. Sport Exerc. 2012, 13, 152–161. [Google Scholar] [CrossRef]
- Luteberget, L.S.; Spencer, M.; Gilgien, M. Validity of the Catapult ClearSky T6 Local Positioning System for Team Sports Specific Drills, in Indoor Conditions. Front. Physiol. 2018, 9, 115. [Google Scholar] [CrossRef] [PubMed]
- R Core Team. R: A Language and Environment for Statistical Computing. 2018. Available online: https://www.r-project.org/ (accessed on 14 April 2020).
- Wickham, H.R.; François, R.; Henry, L.; Müller, K.; Henry, L.; RStudio. Dplyr: A Grammar of Data Manipulation. 2019. Available online: https://CRAN.R-project.org/package=dplyr (accessed on 14 April 2020).
- Wickham, H. Ggplot2: Elegant Graphics for Data Analysis; Springer: New York, NY, USA, 2016; Available online: https://ggplot2.tidyverse.org (accessed on 14 April 2020).
- Fox, A.S.; Spittle, M.; Otago, L.; Saunders, N. An investigation of in-game landings in elite netball: Implications for injury risk. J. Sci. Med. Sport 2012, 15, S229. [Google Scholar] [CrossRef]
- Allen, M.; Poggiali, D.; Whitaker, K.; Marshall, T.R.; Kievit, R.A. Raincloud plots: A multi-platform tool for robust data visualization. Wellcome Open Res. 2019, 4, 63. [Google Scholar] [CrossRef]
- International Netball Federation. International Rules of Netball. England. 2018. Available online: http://netball.org/wp-content/uploads/2017/12/INF-Rules-of-Netball-2018-Edition-text.pdf (accessed on 1 May 2020).
- Graham, S.; Zois, J.; Aughey, R.; Duthie, G. The peak player load™ of state-level netball matches. J. Sci. Med. Sport 2019, 23, 189–193. [Google Scholar] [CrossRef]
- Dawson, B.; Hopkinson, R.; Appleby, B.; Stewart, G.; Roberts, C. Player movement patterns and game activities in the Australian Football League. J. Sci. Med. Sport 2004, 7, 278–291. [Google Scholar] [CrossRef]
- Farrow, D.; Pyne, D.B.; Gabbett, T. Skill and Physiological Demands of Open and Closed Training Drills in Australian Football. Int. J. Sports Sci. Coach. 2008, 3, 489–499. [Google Scholar] [CrossRef]
- Kelly, V.G.; Coutts, A.J. Planning and monitoring training loads during the competition phase in team sports. Strength Cond. J. 2007, 29, 32–37. [Google Scholar] [CrossRef]


| Positional Group | Session Type | Duration (min) | Total Distance (m) | Total Acceleration Load (total acc/dec; m∙s−2) | Total PlayerLoad (au) | PlayerLoad (2D) (au) | Total Jumps (count) | Metreage Per Minute (m∙min−1) | PlayerLoad Per Minute (au∙min−1) | Acceleration Density Index (avg acc/dec per 10 m; m∙s−2) | Acceleration Density (avg acc/dec; m∙s−2) |
|---|---|---|---|---|---|---|---|---|---|---|---|
| Defender | Competition Match | 55.4 ± 26.8 | 3150.3 ± 1765.3 | 1876.3 ± 1009.2 | 451.9 ± 226.6 | 286.5 ± 145.4 | 44.2 ± 23.7 | 59.67 ± 12.37 | 8.15 ± 1.23 | 6.04 ± 0.68 | 0.57 ± 0.10 |
| In-season Practice Match | 56.8 ± 12.9 | 3739.2 ± 1070.3 | 2303.5 ± 589.7 | 458.2 ± 144.1 | 287.8 ± 84.4 | 44.3 ± 16.9 | 67.01 ± 13.21 | 8.10 ± 1.66 | 6.22 ± 0.55 | 0.68 ± 0.10 | |
| Pre-season Practice Match | 64.9 ± 21.9 | 3230.1 ± 866.1 | 2050.8 ± 464.0 | 477.3 ± 159.0 | 256.7 ± 136.1 | 54.0 ± 16.4 | 58.76 ± 10.11 | 7.47 ± 1.29 | 6.42 ± 0.49 | 0.62 ± 0.07 | |
| Pre-season Cup Match | 43.4 ± 11.3 | - | - | 365.1 ± 96.2 | 232.7 ± 63.2 | 38.2 ± 15.1 | - | 8.39 ± 1.40 | - | - | |
| Pre-season Training | 67.3 ± 15.2 | 3228.5 ± 784.8 | 2281.9 ± 540.7 | 461.3 ± 110.8 | 295.5 ± 70.3 | 40.4 ± 13.2 | 48.27 ± 9.58 | 7.00 ± 1.35 | 7.10 ± 0.79 | 0.56 ± 0.07 | |
| In-Season Training | 60.6 ± 13.3 | 3099.0 ± 813.5 | 2109.5 ± 505.1 | 418.8 ± 116.4 | 265.1 ± 71.3 | 42.9 ± 17.0 | 51.46 ± 7.91 | 6.89 ± 1.20 | 6.88 ± 0.63 | 0.59 ± 0.07 | |
| Midcourter | Competition Match | 64.4 ± 23.4 | 4478.2 ± 1907.9 | 2653.2 ± 1109.5 | 614.5 ± 239.0 | 383.2 ± 148.9 | 43.6 ± 22.9 | 76.30 ± 9.74 | 9.38 ± 1.39 | 6.01 ± 0.38 | 0.71 ± 0.09 |
| In-season Practice Match | 61.2 ± 13.9 | 4740.2 ± 1090.2 | 2866.9 ± 701.1 | 580.8 ± 148.0 | 365.8 ± 91.7 | 49.4 ± 19.5 | 78.21 ± 6.17 | 9.49 ± 1.09 | 6.03 ± 0.36 | 0.78 ± 0.05 | |
| Pre-season Practice Match | 69.6 ± 20.9 | 3801.6 ± 1359.0 | 2240.5 ± 748.9 | 602.4 ± 176.7 | 347.5 ± 155.6 | 49.1 ± 21.8 | 75.01 ± 4.27 | 8.81 ± 1.20 | 5.96 ± 0.26 | 0.74 ± 0.04 | |
| Pre-season Cup Matches | 51.9 ± 7.8 | - | - | 478.2 ± 52.4 | 298.1 ± 29.6 | 36.4 ± 12.5 | - | 9.29 ± 0.75 | - | - | |
| Pre-season Training | 68.0 ± 14.2 | 3524.6 ± 843.2 | 2416.0 ± 584.9 | 497.0 ± 110.8 | 317.4 ± 71.7 | 39.4 ± 14.6 | 51.94 ± 9.60 | 7.40 ± 1.21 | 6.87 ± 0.69 | 0.59 ± 0.08 | |
| In-Season Training | 60.3 ± 13.9 | 3383.7 ± 902.1 | 2296.3 ± 598.1 | 453.8 ± 126.8 | 290.3 ± 79.5 | 39.7 ± 19.8 | 56.67 ± 8.18 | 7.53 ± 1.21 | 6.80 ± 0.58 | 0.64 ± 0.08 | |
| Goaler | Competition Match | 57.4 ± 25.7 | 3143.4 ± 1939.5 | 1846.5 ± 1016.9 | 417.9 ± 188.8 | 259.8 ± 114.9 | 58.1 ± 33.1 | 58.22 ± 21.35 | 7.38 ± 1.29 | 6.04 ± 0.96 | 0.54 ± 0.15 |
| In-season Practice Match | 63.0 ± 10.9 | 3725.2 ± 1535.5 | 2350.5 ± 713.7 | 455.4 ± 152.5 | 283.2 ± 94.7 | 62.4 ± 24.9 | 59.56 ± 21.02 | 7.16 ± 1.74 | 6.67 ± 1.21 | 0.62 ± 0.14 | |
| Pre-season Practice Match | 64.3 ± 22.8 | 2792.7 ± 1127.5 | 1735.0 ± 592.4 | 441.0 ± 147.8 | 243.2 ± 131.8 | 61.8 ± 29.0 | 58.75 ± 18.52 | 7.10 ± 1.61 | 6.36 ± 1.00 | 0.60 ± 0.11 | |
| Pre-season Cup Matches | 48.9 ± 15.7 | - | - | 375.8 ± 146.1 | 237.2 ± 94.3 | 60.0 ± 24.2 | - | 7.64 ± 1.60 | - | - | |
| Pre-season Training | 66.8 ± 18.0 | 2713.1 ± 854.0 | 1957.1 ± 561.3 | 399.1 ± 132.2 | 257.6 ± 87.4 | 40.1 ± 22.6 | 40.51 ± 11.11 | 6.05 ± 1.53 | 7.36 ± 1.19 | 0.48 ± 0.09 | |
| In-Season Training | 58.3 ± 12.2 | 2798.9 ± 859.7 | 1915.1 ± 555.0 | 373.9 ± 117.0 | 233.1 ± 74.9 | 47.6 ± 22.9 | 47.66 ± 9.16 | 6.36 ± 1.21 | 6.91 ± 0.64 | 0.54 ± 0.08 |
Publisher’s Note: MDPI stays neutral with regard to jurisdictional claims in published maps and institutional affiliations. |
© 2020 by the authors. Licensee MDPI, Basel, Switzerland. This article is an open access article distributed under the terms and conditions of the Creative Commons Attribution (CC BY) license (http://creativecommons.org/licenses/by/4.0/).
Share and Cite
Brooks, E.R.; Benson, A.C.; Fox, A.S.; Bruce, L.M. Physical Movement Demands of Training and Matches across a Full Competition Cycle in Elite Netball. Appl. Sci. 2020, 10, 7689. https://doi.org/10.3390/app10217689
Brooks ER, Benson AC, Fox AS, Bruce LM. Physical Movement Demands of Training and Matches across a Full Competition Cycle in Elite Netball. Applied Sciences. 2020; 10(21):7689. https://doi.org/10.3390/app10217689
Chicago/Turabian StyleBrooks, Edward R., Amanda C. Benson, Aaron S. Fox, and Lyndell M. Bruce. 2020. "Physical Movement Demands of Training and Matches across a Full Competition Cycle in Elite Netball" Applied Sciences 10, no. 21: 7689. https://doi.org/10.3390/app10217689
APA StyleBrooks, E. R., Benson, A. C., Fox, A. S., & Bruce, L. M. (2020). Physical Movement Demands of Training and Matches across a Full Competition Cycle in Elite Netball. Applied Sciences, 10(21), 7689. https://doi.org/10.3390/app10217689