Article

Burnup Credit Evaluation for BWR Spent Fuel from Full Core Calculations

1
School of Engineering, University of Liverpool, Liverpool L69 3GH, UK
2
National Nuclear Laboratory, Chadwick House, Warrington WA3 6AE, UK
*
Author to whom correspondence should be addressed.
Appl. Sci. 2020, 10(21), 7549; https://doi.org/10.3390/app10217549
Submission received: 18 September 2020 / Revised: 12 October 2020 / Accepted: 23 October 2020 / Published: 27 October 2020
(This article belongs to the Special Issue Nuclear Wastes Management)

Abstract

:
Due to the challenges of spent fuel accumulation, the nuclear industry is exploring more cost-effective solutions for spent fuel management. The burnup-credit method, in application for storage and transport of the spent fuel, gained traction over recent decades since it can remove the over-conservatism of the “fresh-fuel” approach. The presented research is focused on creating an innovative, best estimate approach of the burnup-credit method for boiling water reactor (BWR) spent fuel based on the results of neutronic/thermal-hydraulic coupled full core simulations. The analysis is performed using a Polaris/DYN3D sequence. Four different shuffling procedures were used to estimate the possible range of the BWR fuel discharged burnup variation. The results showed a strong influence of the shuffling procedure on the final burnup distribution. Moreover, a comparison of the 2D lattice and 3D coupled nodal approaches was conducted for the criticality estimation of single fuel assemblies. The analysis revealed substantial improvement in criticality curves obtained with the full-core model. Finally, it was shown that the benefit from the burnup-credit method is larger in the case of more optimal fuel utilisation-based shuffling procedures. The new approach developed here delivers a promising basis for future industrial optimisation procedures and thus cost optimisation.

1. Introduction

The amount of discharged spent nuclear fuel (SF) has been steadily growing over recent decades [1]. In 2019, the International Atomic Energy Agency (IAEA) estimated that around 10,000 MtHM/year of spent fuel (SF) is being discharged from nuclear power plants (NPPs), from which approximately 4000 MtHM/year goes to reprocessing and the rest remains in the storage facilities [2]. The data from [3] shows that light water reactors (LWRs) contributed to 89.2% of energy production from the NPPs worldwide at the end of 2018, with boiling water reactors (BWRs) producing approximately 20% of energy obtained with LWRs. The IAEA estimates that in the high case, nuclear power capacity may increase up to 25% by the year 2030 from current levels and up to 80% by 2050 [4]. According to the low estimate, the capacity may drop by 7% in 2050. Under both scenarios, the need for the spent fuel storage will remain for several decades.
In the case with LWRs, spent fuel is removed from the reactor core to wet storage at the plant, such as spent fuel storage pools, for cooling for approximately 5–10 years [1]. After that, the fuel is moved, in most cases, to dry storage for interim storage. The demand for dry storage emerged at the beginning of the 1980s when it became clear that the existing storage pools capacities were insufficient to keep all fuel assemblies for long-term storage while the development, construction and commissioning of the final disposal capacities had not been accomplished. Since then, many spent fuel storage systems have been developed, such as concrete containers lined by steel or metal casks. The current spent fuel management strategies suggest that at the end, the SF can be disposed as a high-level waste or can be reprocessed with the separated fission product stream disposed as radioactive waste [2]. The Generation IV reactor design targets mostly a closed fuel cycle conception when the spent fuel can be reused in the reactor core [5]. One of the potential candidates is the sodium-cooled fast reactor (SFR) due to efficient utilisation of plutonium and minor actinides [6]. Recent works [7,8] showed that another opportunity for the SF management could be spent fuel utilisation in molten salt reactors, which significantly reduces fuel cycle facility demands. Considering that final SF disposal is a complex problem which remains unsolved for most countries, the need for a cost-effective solution for SF storage will grow in the foreseeable future.
LWRs’ average fuel discharged burnups have been steadily increasing since the beginning of their industrial operation, as the data from Germany show [9]. According to the data published by the U.S. Energy Information Administration in 2015 [10], the average burnup of BWR fuel assemblies (FAs) has reached 45 GWd/tU. In general, there is a clear economic driver for targeting higher burnup since an increased fuel utilisation results in a decrease in the fuel cycle cost as well as spent fuel volume [11]. Furthermore, the higher burnt fuel contains less fissile material which may help to either reduce expenses on SF storage or expand the storage facilities’ capacity [1].
For most spent fuel types, the criticality safety analysis is performed under the so-called “fresh fuel” approach. It implies that the SF system contains unirradiated (fresh) fuel without burnable poison. The approach results in a substantial overestimation of the calculated system’s criticality, especially for the fuel with increased enrichment and high discharged burnup [1]. The reduction in the system’s reactivity associated with the fuel burnup can be taken into account using the burnup credit (BUC) method [1]. During fuel irradiation, the total amount of fissile material present significantly decreases, which leads to a noticeable reduction in reactor core criticality. At the same time, transuranic elements are accumulating and fission products content is rising. If the fuel contains burnable absorber, such as gadolinium in case of BWRs [12], its concentration is declining, leading to an increase in criticality until all burnable poison has been depleted. The IAEA defines four frequently used levels of the burnup credit [13]:
  • “Credit for the net decrease of the fuel fissile content, taking into account both burnup and build-up of the different fissile nuclides (net fissile content level).
  • Credit for the net fissile content and for the absorption effect of actinides (actinide only level).
  • Credit for the actinides and the neutron absorption in fission products (actinide plus fission product level).
  • Credit for the presence of integral burnable absorbers in the fuel design (integral burnable absorber level). This credit uses the maximum reactivity of the fuel, which is often not the initial reactivity.”
According to the data published in [14], the BUC on the actinide-only and actinide plus fission product level is widely applied to pressurised water reactors (PWR) fuel at the various stages of SF management. For BWR spent fuel, the BUC on the integral burnable absorber level is mainly applied to wet storage. However, the method is still under development or consideration in some countries for the dry storage and transport of BWR spent fuel [14].
Oak Ridge National Laboratory has recently finished their five-year program regarding the burnup credit development for the transport and storage of BWR spent fuel [15]. The project aimed to analyse the specific points of BWR operation and estimate their impact on BUC. The research was focused on the influence of various operating parameters, such as axial moderator density distribution, control blades movements and operating conditions, on the validation of the isotopic predictions and effective neutron multiplication factor (keff) calculations. The series of newly published studies [16,17] was focused on the development and benchmarking of an advanced BWR lattice model with further application to the criticality analysis of the BWR storage cask, along with burnup credit, sensitivity and uncertainty studies. The research was conducted for BWR spent fuel discharged at the peak reactivity burnup where the burnable absorber gadolinia does not affect fuel assembly criticality anymore [17]. The current study aimed to create the best estimate for BUC in application to BWR spent fuel discharged at realistic final burnups. For this purpose, the FA behaviour in the reactor core was evaluated by performing full core nodal simulations with different fuel reloading patterns, which provided the comprehensive data for each assembly in the core. The project is divided into two parts. The first part, which is presented in this paper, is focused on the simulation of the BWR reactor operation and optimisation of the burnup distribution of the discharged FAs. In addition, the paper evaluates the benefit of burnup credit application for the realistic BWR assembly model at the estimated discharged burnups. Overall, the study aims to answer the following two research questions: “How strong is the influence of different core loading strategies on the discharge burnup distribution?” and “How much credit can we gain for the best estimate analysis of the BWR spent fuel at the discharged burnups in comparison to the fresh fuel standard and the peak reactivity approach?”. In the second part of the project, the criticality analysis of the different SF storage cask loadings will be conducted using the realistic BWR spent fuel composition obtained in the full core simulations. The result will be compared against the traditional fresh fuel approach to define the possible gain from the BUC.

2. Codes Description

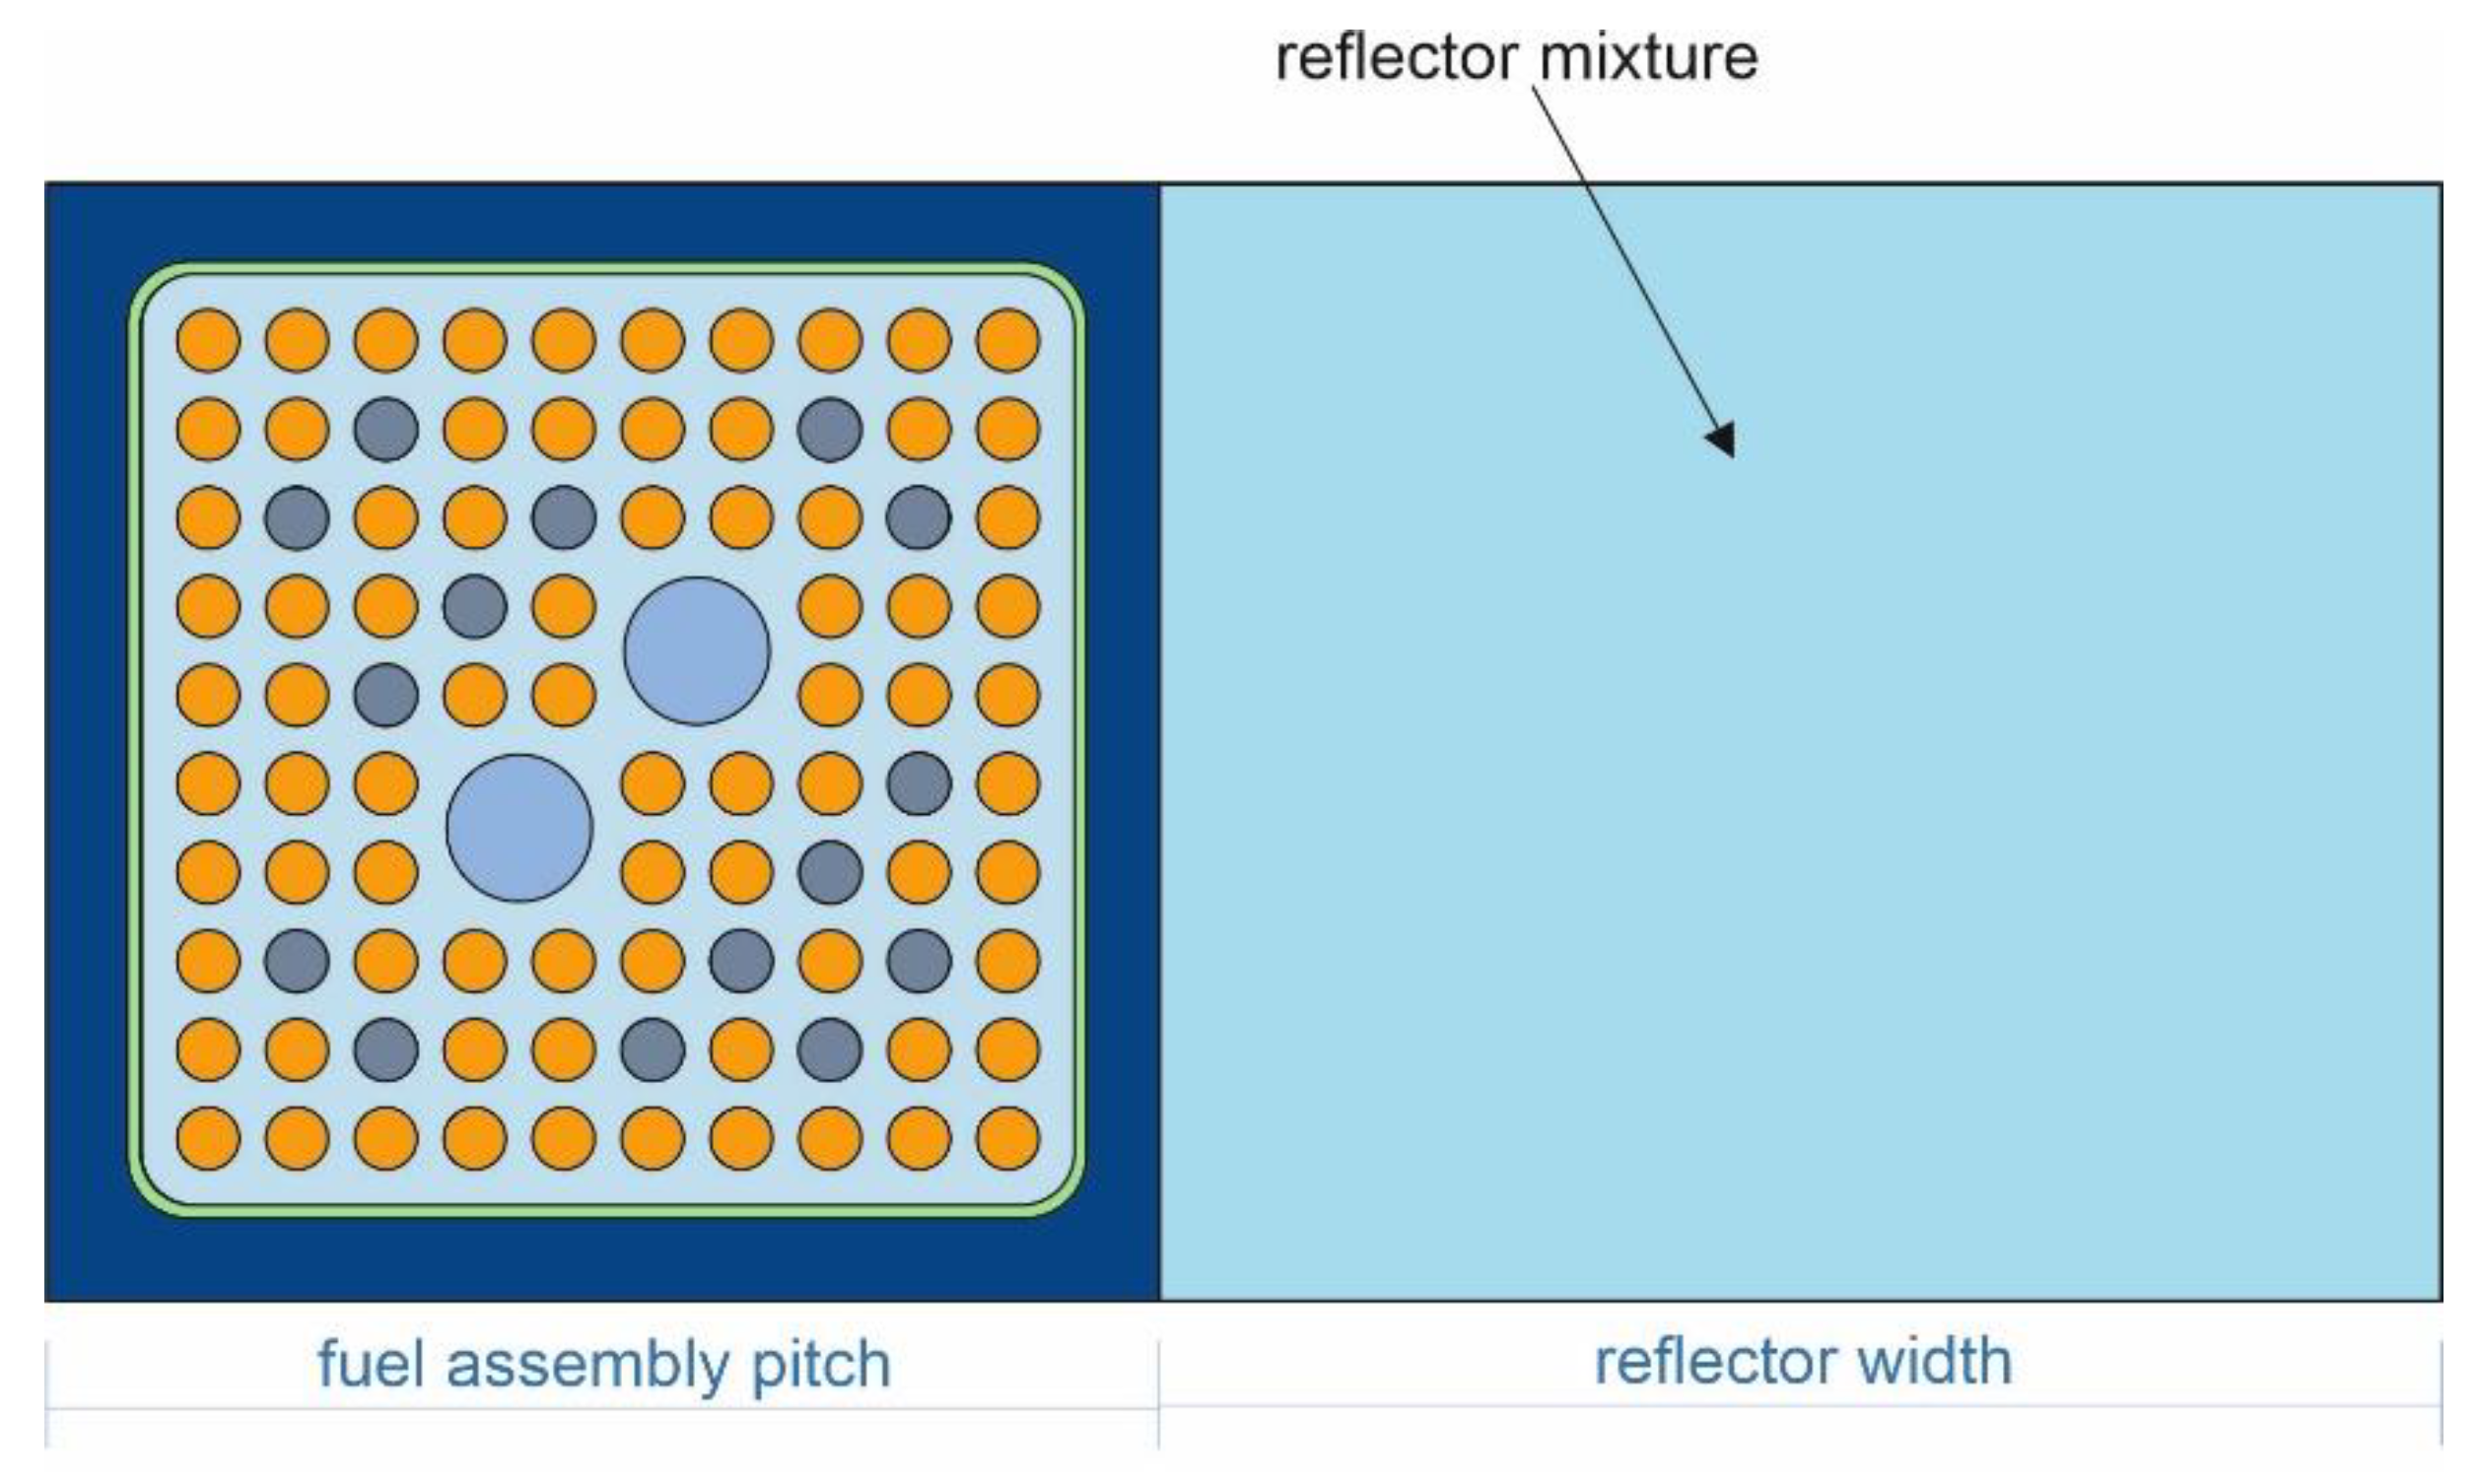
In the current study, a BWR full core analysis was performed using the Polaris/DYN3D sequence. Polaris is a newly introduced module of SCALE 6.2 code system for the 2D lattice physics computations, adjusted for LWR design [18]. The SCALE package was developed by Oak Ridge Nuclear Laboratory (ORNL, Oak Ridge, TN, USA). It is designed to solve various problems of nuclear safety analysis and design, such as criticality safety analysis or reactor physics computations. Before incorporating Polaris into the SCALE package, lattice physics analysis was performed using the TRITON module within the SCALE package. Polaris has significant advantages in comparison with TRITON, such as an easy input file structure and improved running time without affecting the quality of the results [19]. For these reasons, the Polaris module was chosen for the lattice calculations and the cross-section preparations for the BWR fuel assembly design. Polaris utilises an Embedded Self-Shielding Method (ESSM) based on the Bondarenko interpolation approach for calculating multi-group self-shielded cross-sections [18]. The transport calculations are being performed using the Method of Characteristics (MoC). Polaris is supplied either with 252 or 56 energy groups’ nuclear data libraries generated from the ENDF/B-VII.1 library. The study [20] showed that TRITON module of SCALE 6.2 with 252 energy groups’ data library has a discrepancy with well-validated commercial code CASMO5 in the range of less than ±100 pcm for the BWR pin-cell. Thus, lattice physics computational tools of SCALE 6.2 code used in the current study can be considered as a robust means for cross-section preparation for industrial standard light water reactor problems.
The simulation of BWR reactor operation was performed in the DYN3D nodal core simulator. DYN3D is a multi-physics, three-dimensional nodal code for steady-state and transient analysis of LWRs developed by Helmholtz-Zentrum Dresden-Rossendorf (HZDR, Dresden, Germany) [21]. The neutron physics model uses the nodal expansion method (NEM) for solving the three-dimensional two-group or multi-group neutron diffusion equations. The code can simulate square and hexagonal fuel assemblies’ designs, such as those of BWR and water-water energetic reactor (VVER) fuel assemblies, respectively. This study used the multi-group version of the DYN3D code. The calculated reactor thermal-hydraulics parameters, such as fuel temperature, coolant density and temperature, are fed back to the neutronics solver within DYN3D to estimate the thermal-hydraulics feedback. DYN3D can also simulate the reactor fuel cycle by incorporating burnup and fuel shuffling options into the analysis. DYN3D was initially developed for VVER reactor type, where it is the NURESIM (European Reference Simulation Platform for Nuclear Reactors) reference code [22]. However, DYN3D is currently extensively verified and validated for different types of LWRs [21]. For BWRs, the code was compared against the Nuclear Energy Agency of the Organisation for Economic Co-operation and Development (OECD/NEA) BWR Turbine Trip Benchmark [23].

3. Models Description

3.1. Fuel Assembly Design

BWR fuel assembly design has evolved noticeably from the first reactor generations. For example, the lattice size has been increased from 7 × 7 to 10 × 10, with a gradual decrease in the rod diameter [24]. The goal of BWR fuel assembly optimisation is to use fuel as efficiently as possible during reactor operation. Over the last few decades, BWR fuel vendors have iteratively enhanced FA design to improve fuel performance. Despite some differences between FA constructions, the main features, such as non-uniform axial and radial fuel enrichment, rods containing burnable poison, water rods and part-length rods, have always been present in the various designs. For this study, GE14 10 × 10 fuel assembly described in [25] was chosen for the BUC analysis. The fuel is uniformly enriched by 4.5 wt% of U-235 and the FA contains 15 gadolinia-poisoned rods with 7 wt.% of Gd2O3. The study [16] showed that the impact of averaging radial enrichment in comparison to the non-uniform one, which is typical for the modern BWR fuel, only has a minor effect on the keff and final isotopic composition in the BWR fuel assembly. Thus, the usage of the uniformly enriched fuel rods in this study will not significantly affect the results of the BUC analysis. The FA design includes 14 part-length rods which divide the FA into two axial regions. At the bottom region, all fuel rod positions are filled with fuel, forming the so-called “dominant” lattice (DOM) [25]. The upper part has empty rod spaces, providing additional moderation. This region is called a “vanished” lattice (VAN) [25]. The fuel assembly was modelled with naturally enriched (NE) uranium blankets (0.71 wt% of U-235) on top and bottom. The FA design is presented in Figure 1. Table 1 represents the main parameters of the BWR GE14 assembly.
The described fuel assembly design is preferable for the study because it is based on a real, currently operated fuel assembly configuration and contains all main features of the modern BWR GE14 assembly [25] but has a lower degree of complexity in the modelling and simulations.

3.2. Full Core Design

The openly available information about the BWR full core design and operational data is limited to either an outdated reactor configuration, as in [27], or is not presented in all required detail [28]. The recently published study [29] provided insight on an advanced BWR design based on openly available data, including the loading pattern, the operational parameters and the modern BWR GE-14 10 × 10 fuel assembly design. The reactor data from [29] were taken as a basis for the full core analysis.
The reactor core described in [29] contains 872 fuel assemblies from four different cycles, each having a cycle length of 11.25 GWd/tU, with the layout of a quarter of the core shown in Figure 2. The number of FAs in each cycle is summarised in Table 2, with an identical number of 224 assemblies in the first three cycles and four assemblies less in the last cycle. The main reactor core parameters are represented in Table 3. Thermal-hydraulics data at rated conditions are described in Table 4. Peaking factor estimated for the BWR core without control rods usage has a value around 1.8 [30]. This limitation factor, along with the parameters from Table 4, was used to verify that the developed model is close to the realistic full-core design.
Analysis conducted in [31] for the realistic control blades histories showed that control blade insertion affects the criticality of the storage cask with BWR spent fuel by approximately 0.6–1.2% of the final value. Meanwhile, for the unrealistic histories with massive control rod insertion (92% of irradiation time), the difference was found to be up to 4.3%. Hence, the effect of control rods’ movements does not contribute significantly to the criticality of the storage cask as long as the insertion time is limited, as it is assumed in normal, industrial reactor operation, and thus, control rods were omitted in the current study.
The current full-core simulations do not aim to develop a complete and precise model of the BWR reactor operation but rather a model sufficient to determine the fuel assembly burn-up behaviour in the reactor core. Hence, the evaluation of some safety parameters, such as linear power level in fuel rods [29] or expected transient behaviour, were omitted in the current study.

4. Full-Core Modelling

4.1. Cross-Section Preparation

Nodal core simulators require homogenised cross-sections and diffusion data for each unique layer of the FA and the radial and axial reflectors at the different state points of the reactor operation. The diffusion data include homogenised multi-group or two-group cross-section sets, assembly discontinuity factors (ADFs), scattering tables, etc. [34]. For this purpose, a case matrix containing state points that comprehensively describe the FA and reflector design for the envisaged operational envelope was created [5]. It covers the possible range of depletion steps and changes in the operational parameters, such as moderator density, fuel temperature or the control rods’ movements. Lattice codes produce the diffusion data by performing burnup and branch calculations in the form of a matrix. The nodal code then interpolates the unknown operational conditions lying between two branches or burnup steps or extrapolates them based on the available data if they are outside the set. The latter procedure can lead to incorrect results; thus, it is vital to cover the whole expected range of operating conditions while creating the case matrix [34].
Cross-section sets for the FA and reflector were prepared using the Polaris module of SCALE 6.2 [18]. The ENDF/B-VII.1 data library with 56 energy groups’ structures was used in the calculations since it is optimised for LWR analysis [35] and significantly reduces the computational time in comparison with 252-energy group library. Cross-sections were homogenised for two energy groups as in a standard approach for nodal LWR modelling [5]. Post-processing was performed on Polaris lattice physics archive for use with DYN3D code.
Figure 3 shows the computational models of dominant and vanished lattices in Polaris. The meshing is standard for the BWR fuel type provided by the code [18].
The fuel assemblies in the BWR reactor core are surrounded by the reflector, which can be water, a steam–water mixture or a mixture of water and structural material. The reflector model in the lattice code is typically developed by adding a reflector region to the east boundary of the typical FA configuration. This study considered three reflector types located at the bottom, side and top of the reactor core. The minimum size of the reflector is typically the width of the one FA [34]. For the current study, the bottom and top reflectors were modelled as two fuel assemblies in width, while the radial (side) reflector size was estimated by the equation from [34]:
H =   W 3 6 R 2 ( 2 arcsin [ W 2 R ] sin [ 2 arcsin [ W 2 R ] ] )
where
  • H is the average distance from the FA bundle to the reactor pressure vessel (RPV);
  • W is the width of the flat part of the FA bundle closed to the RPV;
  • R is the RPV radius.
The schematic reflector model is shown in Figure 4. The bottom reflector material is a mixture of stainless steel and water and the radial reflector consists of water, while the top, from the low-density water imitating the steam–water mixture.

4.2. Refuelling Simulations

The BWR FA average discharge burnup varies for different reactor generations, FA lattice sizes and fuel enrichments. For the modern BWR fuel, it lies in a range of 45–50 GWd/tU [36,37]. For this study, burnup limitations described in the generic design assessment of UK ABWR [38] were used. The data is summarised in Table 5.
In LWRs, a fraction of the core (usually the assemblies from the final cycle) is discharged after each cycle to the storage pond. The other FAs change their positions in the reactor core according to the specific shuffling procedure, and the new fresh fuel assemblies are loaded to the empty spaces. This process is called refuelling. The cycle length for modern BWRs is 12–18 months, while a single FA stays in the reactor core for approximately four years [39] over 3 to 4 cycles. The open data about refuelling patterns are limited, so four shuffling procedures (SP) have been developed in this study to cover the possible scope of the discharged fuel burnups of the individual fuel assemblies. Considered SPs are shown in Figure 5.
The refuelling process/shuffling procedure was programmed using Python script, which determined the new position for FAs after each cycle according to the SP algorithm from Figure 5 and then passed these data to the DYN3D code for further calculations. The script updates all DYN3D input files and launches the code, so the user only needs to create the initial DYN3D input and choose the appropriate shuffling procedure and cycle length, while further burnup and shuffling calculations will be performed automatically for an unlimited number of cycles.
In all considered SPs, fuel burnups of the FAs were sorted from minimum to maximum at each cycle and then moved according to the pattern showed in Figure 5. In the SP_A procedure, the FA coming from a maximum burnt position of the cycle C0 moves to the position of the least burnt FA of cycle C1, then it goes to the most burnt position of cycle C2, and finally, it is located to the least burnt position of the C3 cycle, while assemblies from the cycle C3 are removed from the core and the fresh FAs are loaded to the empty C0 cycle positions. In other words, maximally burnt fuel assemblies from one cycle move to the positions where the fuel assemblies of the next cycle accumulated the lowest increase in burnup. The SP_B procedure has a reversed-to-SP_A order of FAs movements, so the least burnt fuel assemblies from the cycle C0 go to the highly burnt FA positions of the cycle C1 and so on. The SP_C shuffling procedure implies that the FAs remain on the same burnup positions at each cycle, or in other words, the least burnt fuel assemblies from C0 go to similar positions of C1, and the process repeats until cycle C3. The shuffling procedure SP_D follow the SP_C shuffling procedure up to the cycle C2. Then, the FAs from C2 with the smallest burnups are moved to the maximally burnt FAs positions of the C3, and C3 FAs are discharged from the reactor core.

4.3. Reactor Cycle Simulation

The fuel assemblies from a single cycle accumulate a different average burnup depending on their positions in the reactor core. Four fuel burnup and shuffle sequences were performed to obtain the loading map and the realistic, individual burnup distribution for the fuel assemblies. The number of sequences corresponded to the four fuel cycles, or in other words, to the full length of an assembly lifetime in the reactor, which seems to be sufficient for this study, even if the achieved burnup distribution will not be in complete equilibrium. For a future, more realistic evaluation, a real burnup distribution of real operational cycles could be investigated. In the beginning, the loading map consisted of FAs from four cycles with burnup distributions estimated by burning a single FA in infinite XY geometry (reflective boundary conditions at the sides of the FA as traditionally used in lattice calculations and leakage, from top and bottom). After producing a starting map, the four cycles of the reactor operation were simulated. At the end of each cycle, FAs from the third cycles were discharged and then the fuel was reshuffled. The shuffling procedure was kept equal for creating the starting loading map as well as for the reactor operation simulations.
The reactor core was burnt in 5-day steps. The model consisted of 27 axial layers, 25 for the assembly and 2 for top and bottom reflectors. The fuel contained an excess reactivity of 1500–2500 pcm at the beginning of each cycle. The core critical state was achieved by diving the multiplication cross-sections by keff since other reactivity control features, such as control rods’ movements, were not simulated and boron in the coolant is traditionally not used in BWRs.

5. Results and Discussion

5.1. BWR Full-Core Analysis

5.1.1. Defining the Cycle Length

For the core map developed in [29] and used in this study, the cycle length for the average discharge burnup of 50 GWd/tU is 12.6 GWd/tU per cycle. However, the full core model described in [29] did not consider the effects of the fuel reloading process. A series of calculations were performed for different shuffling procedures to define an optimal cycle length and possible adjustments of the core configuration to achieve the target burnup of 50 GWd/tU while not exceeding limits set in [38] (Table 5). On the one hand, the analysis showed that the limit on maximum assembly average burnup of 60 GWd/tU was exceeded for the SP_C procedure (Figure 6), indicated by the appearance of several fuel assemblies with higher burnup (last bar on the right end of the right figure). The average discharged burnup over the core in this case (49.7 GWd/tU) is close to the set target of 50 GWd/tU. On the other hand, the SP_A procedure produces the narrowest discharged burnup distribution, indicating a very efficient fuel use for most fuel assemblies. The average discharged burnup is 50.8 GWd/tU, thus higher than in SP_C for the same cycle length, which makes it the preferred one in terms of fuel utilisation. However, as seen in Figure 6, there are still fuel assemblies detached from the main distribution (56 and 58 GWd/tU) which could be further optimised to improve the average discharge burnup. In this study, we refer to these assemblies as assembly-burnup outliers.
Further analysis showed that the assembly located at the position (3, 10) caused the outlier effects described above. To resolve this problem, the full core map was slightly modified/optimised compared to the reference, as shown in Figure 6. The FA from the (3, 10) position was moved to (3, 14), while (3, 14) was placed to (3, 12) and (3, 12) back to (3, 10). For the improved full core layout, the optimal cycle length was estimated as 11.75 GWd/tU. The impact of the modification on discharged FA burnup distribution will be discussed more extensively in the next section.

5.1.2. Optimisation of the Discharged Fuel Burnup Distribution

As was discussed earlier, due to the limited open information about reloading patterns used in modern BWRs, the authors applied four different models of the shuffling procedures (Figure 5) to deliver a full core analysis in order to evaluate the possible range of burnups of the discharged fuel assemblies. Seven different cases of fuel reloading were generated based on four shuffling procedures and two core layouts, described above. SP_A_new (SP_C_new) and SP_A_old (SP_C_old) cases use SP_A (SP_C) shuffling procedure and adjusted (Figure 7) and reference (Figure 2) full core layouts, respectively.
The SP_B, SP_D and SP_E cases are based on the more promising, adjusted core layout. SP_B and SP_D utilise the shuffling procedures with the same name, given above in Figure 5, while SP_E is an additional case where the shuffling procedures SP_A and SP_B were altered with each other for each new fuel cycle, starting with SP_A in the first cycle followed by SP_B in the second cycle and so on.
Figure 8 depicts the burnup distributions of the fuel assemblies discharged from the reactor core during four cycles of operation for the seven different cases with identical cycle lengths. The reactor core has a 90-degree reflective symmetry; hence, results are presented for a quarter of the core which contains 218 FAs in total (Figure 7). Fifty FAs of the third cycle were removed from the core after each operational cycle which, after four cycles, resulted in a total number of 200 discharged fuel assemblies.
The quality of the burnup distributions was analysed using the following parameters:
  • Average burnup of the discharged fuel assemblies (Bavrg).
  • Average burnup of the 5% least burnt fuel assemblies (B5%L).
  • Average burnup of the 5% highest burnt fuel assemblies (B5%H).
  • Average burnup of the 68 fuel assemblies from the centre of the distribution (B68). The number of FAs is equal to the capacity of the BWR storage cask.
  • Burnup range (BR)—the difference between the minimum and maximum fuel assemblies’ burnups.
Table 6 summarises the change in the developed above parameters for the produced burnup distributions in comparison with SP_A_new which represents the most optimal distribution due to its smallest burnup range. The analysis shows that the shuffling procedure and core layout adjustment do not significantly affect BAVRG and B68 burnups. However, it has to be kept in mind here that SP_C_old would not be permitted due to exceeding the suggested burnup limit in some fuel assemblies. At the same time, the B5%L, B5%H and BR parameters are more sensitive to the choice of the shuffling procedure, with SP_C_new/SP_C_old cases being significantly away from the SP_A_new. The modification of the core layout significantly improved burnup range of the distributions (by 3 GWd/tU) which was produced with the optimal SP_A shuffling procedure, while BR did not change noticeably for the SP_C case. This indicates that the adjustment has taken away the assembly-burnup outliers into lower flux positions and thereby limited the burnup accumulation. It opens new optimisation potential since the whole core could now be burnt in a slightly longer cycle, thus achieving an even higher averaged burnup. The analysis of the deltas from Table 6 shows that SP_B and SP_E scenarios are closed to the optimal SP_A_new. However, they have a wider burnup range in comparison with SP_A_new because of the assemblies-outliers, thus there is less potential for extending the cycle time. This issue could be fixed by identifying the outlying assemblies and performing loading map optimisation as described in 5.1.1. The wide BR and high Δ5%L and Δ5%H parameters of the SP_C_new and SP_C_old distributions compared to the others indicate that the shuffling procedure SP_C is far from optimal.

5.2. Burnup Credit Analysis for the Realistic BWR FA Model

5.2.1. Criticality Estimation for Single BWR FA

Lattice codes simulate fuel assembly in an infinite 2D geometry, typically with one reference water density, an estimation of the average fuel temperature and the use of a constant power approximation over burnup. However, in a real reactor core, the assembly has a limited size, surrounded by fuel assemblies from other cycles and by a reflector at the top and bottom of the fuel assembly. At the same time, the FA power varies due to burnup processes as only the reactor power is kept constant. Thus, the peak assembly power changes axially during the burnup, which is opposite to the constant power approach of the lattice calculations. At the same time, the fuel assembly power is balanced with the other FAs through the core power. In the current section, the authors aim to determine how the transition from the lattice computations (radial infinite medium approach) to a more realistic assembly model in a core simulator—a 3D approach with realistic water density distribution and fuel temperatures, but still employing reflective boundary conditions in the radial direction—affects the function of keff over burnup and to estimate the impact of the given 3D approach on the burnup credit. For this purpose, the following models based on the BWR GE14 assembly design (Figure 1) were analysed:
  • A 2D lattice model of the dominant layer (DOM) without burnable poison or in terms of the burnup credit, the so-called “fresh fuel” approach, which is referred to as Model 1 (M1).
  • A 2D lattice model of the DOM layer with burnable poison, or the “peak reactivity” approach (M2).
  • A 3D nodal model of the realistic FA with DOM and vanished layers (VAN), natural uranium blankets, non-uniform axial coolant density distribution and the reflectors on the fuel assembly ends (M3). The boundary conditions are set to reflective in the radial direction and vacuum in the axial. In addition, two separate 3D nodal models of the FA, containing DOM and VAN layers only, were created to estimate the contribution of each layer to the total criticality of the FA.
The “fresh fuel” approach is considered as the most traditional method of criticality safety analysis with respect to analysing spent fuel storage systems, which implies that the system is loaded with unirradiated fuel without burnable poison. Due to today’s widespread use of fuel assemblies containing burnable poisons, the “peak reactivity” approach has been adopted by the nuclear community [12]. As burnable absorber depletes faster than uranium during fuel irradiation, this leads to a reduction in the initial excess reactivity at the beginning of assembly life, with further rise of the fuel assembly criticality up to a maximum level referred to as the peak reactivity, followed by a further decline. The given method assumes that the fuel in the considered system is at its peak reactivity burnup when loaded. This approach is less conservative than the fresh fuel approach which is the most conservative for criticality safety analysis [26].
As will be shown later, the dominant layer mainly contributes to the criticality of the current BWR assembly and, thus, it was chosen as the reference layer for the M1 and M2 models. The coolant density in lattice calculations was set as an average for the DOM layer (0.6 g/cm3). The estimation is based on the averaged coolant density profile for various BWR fuel assemblies described in [31]. For the 3D nodal model M3, DYN3D calculates coolant density distribution based on the channel model as well as other thermal-hydraulics and thermo-dynamics parameters of the fuel assembly at each burnup step.
Figure 9 depicts the comparison of the depletion analysis for the three different models described above. The results show that the peak reactivity occurs earlier in the M3 case, when the fuel assembly is modelled under representative operational conditions, in comparison with the lattice approach M2. Furthermore, the assembly criticality at the peak is approximately 5% lower in the M3 case. A similar effect was observed in the study [16], where authors performed depletion analysis for 2D and 3D models of the BWR fuel assembly with uniform and non-uniform axial coolant density distributions. However, the investigation was limited to the peak reactivity area, while the current analysis covers the criticality evolution over the whole targeted burnups of the fuel assembly. The analysis of the M3 burnup curve beyond peak reactivity reveals a second increase in criticality near 30 GWd/tU burnup. Furthermore, after approximately 45 GWd/tU, the M3 curve has a steady negative bias with M1 and M2 cases. It occurs due to the leakage boundary conditions applied to the top and bottom.
The power profile evaluation for the realistic FA model M3 at four different burnup stages is represented in Figure 10. The power distribution was normalised at the maximum power value observed at the 30 GWd/tU burnup step. It is seen that at the initial burnups steps, for example, 0 and 10 GWd/tU, the peak power is located at the bottom (dominant) FA layer. As the fissile material depletes and gadolinium burns in this layer, the power shifts towards the top (vanished) layer where the fuel is fresher and still has a higher fissile content, as seen from Figure 10 (30 GWd/tU burnup stage). This results in the formation of the second reactivity peak on the M3 burnup curve (Figure 9) since the fissile depletion and the gadolinium burning are now accelerated in the top part of the fuel assembly due to the increased power. Finally, when the burnable poison is completely depleted and the fissile content in the central parts of the fuel assembly is significantly reduced, the power distribution peaks at the least burnt parts of the fuel assembly, the very top and bottom (50 GWd/tU burnup stage). Overall, the dominant layer plays a significant role in power production, defining the reactivity of the whole FA. This is also seen from the comparison of the M3 and the dominant layer criticality curves (Figure 9). The curves mostly coincide on the whole range of the considered burnups, except in the interval between 35 to 45 GWd/tU where the vanished layer is prevalent; see the power curve in Figure 10.
Since the M3 approach showed a substantial decrease in criticality at the peak reactivity in comparison with M2, it can be considered as an alternative approach to evaluate the burnup credit. In this case, the credit comes not only from the fuel burnup and residual gadolinium, as in the case of the peak reactivity method, but also from the increase in FA model complexity, which allows us to follow the changes in the axial power distribution while relying on calculated coolant properties and fuel temperatures. For further analysis, we will call this approach “peak reactivity of the realistic FA model”.
The development of the burnup credit methods intends to reduce the cost of spent fuel management. Hence, the gain from the BUC should be recognisable when either boral plates, which are used in the storage and transport casks as neutron absorbers, can be removed or their number can be substantially reduced, or the spent fuel storage system’s capacity can be increased.

5.2.2. The Burnup Credit of the Core

In this section, the authors aim to estimate the possible credit from the reactivity reduction of the irradiated BWR fuel assembly based on the realistic FA model M3 combined with the number of fuel assemblies discharged at the burnups of the least and most optimal burnup distributions SP_C_new and SP_A_new, respectively. This approach will be called “burnup credit of the core”. It should be noted that the criticality estimation of the FA based on M3 model does not reflect on its position in the reactor core (see description given above) since M3 simulates a single FA in the reflective radial boundary conditions. The here suggested approach for BUC analysis is based on full core modelling and, hence, is significantly more time-consuming and requires more computational power than the lattice approach or the M3 approach. However, it is crucial to create an understating about the gain which could be harvested in the case of a higher investment into the modelling or maybe just the use of fuel management data which would be available for most of the operating nuclear power plants nowadays. For this purpose, the authors developed the concept of the normalised reactivity gain from applying the BUC approach, based on the discharged burnup distributions SP_C_new and SP_A_new, to the M3 FA model in comparison with the existing BUC approaches. The normalised reactivity gain was estimated as:
ρ i j = ( k j k i ) k j k i · n i N · 10 5
where
  • i is the burnup bin number from the discharged burnup distribution;
  • j is one of the approaches, fresh fuel, peak reactivity or peak reactivity, of the realistic FA model;
  • ρij is the normalised reactivity gain between the FA criticality at the bin i and the FA criticality at the approach j;
  • kj is the FA keff at the approach j;
  • ki is the FA keff at the bin i of the considered discharged fuel burnup distribution;
  • ni is the number of FAs in the bin i;
  • N is full number of FAs in the distribution.
The normalised reactivity gain shows how much reactivity (in the form of the delta to the more approximate method) is gained by the fuel assemblies from a specific burnup bin of the considered burnup distribution. Thus, the introduced parameter correlates the gain from the optimisation of the loading pattern (achieving higher FA burnup) with the optimisation of the modelling and simulation (return on the investment in the modelling).
The results of the analysis are summarised in Figure 11. At the SP_C_new distribution, the 35 GWd/tU and 40 GWd/tU bins have the same number of the FAs as at 60 GWd/tU. However, the normalised reactivity gain from the last bin is higher. Thus, the high burnup bin at 60 GWd/tU contributes over proportionally. In the case of the SP_A_new distribution, the gain from the first two bins is close to the gain from the last bin (the number of the FAs are equal for both sets of bins). For both cases, the reactivity gain is almost negligible for 5% of the least burnt fuel assemblies in comparison to the FAs with burnups close to average and 5% of the highest burnt FAs. Here, the value could even change the sign in the case the fuel assemblies have not achieved the estimated peak value. Furthermore, the normalised reactivity gain for the optimal shuffling procedure (SP_A_new) is approximately three times higher than for the least optimal (SP_C_new) near the averaged discharged burnups. Table 7 represents the reactivity gain over the whole reactor core for the BUC of the core approach in comparison with the fresh fuel, the peak reactivity and the peak reactivity of the realistic FA model approaches. It is seen that the reactivity gain is approximately 1120 pcm higher for the SP_A_new burnup distribution than for the SP_C_new one.
To sum up, shuffling procedure optimisation can substantially increase the number of FAs benefiting from the application of the BUC method applied to the FAs at their discharged burnups.

6. Conclusions

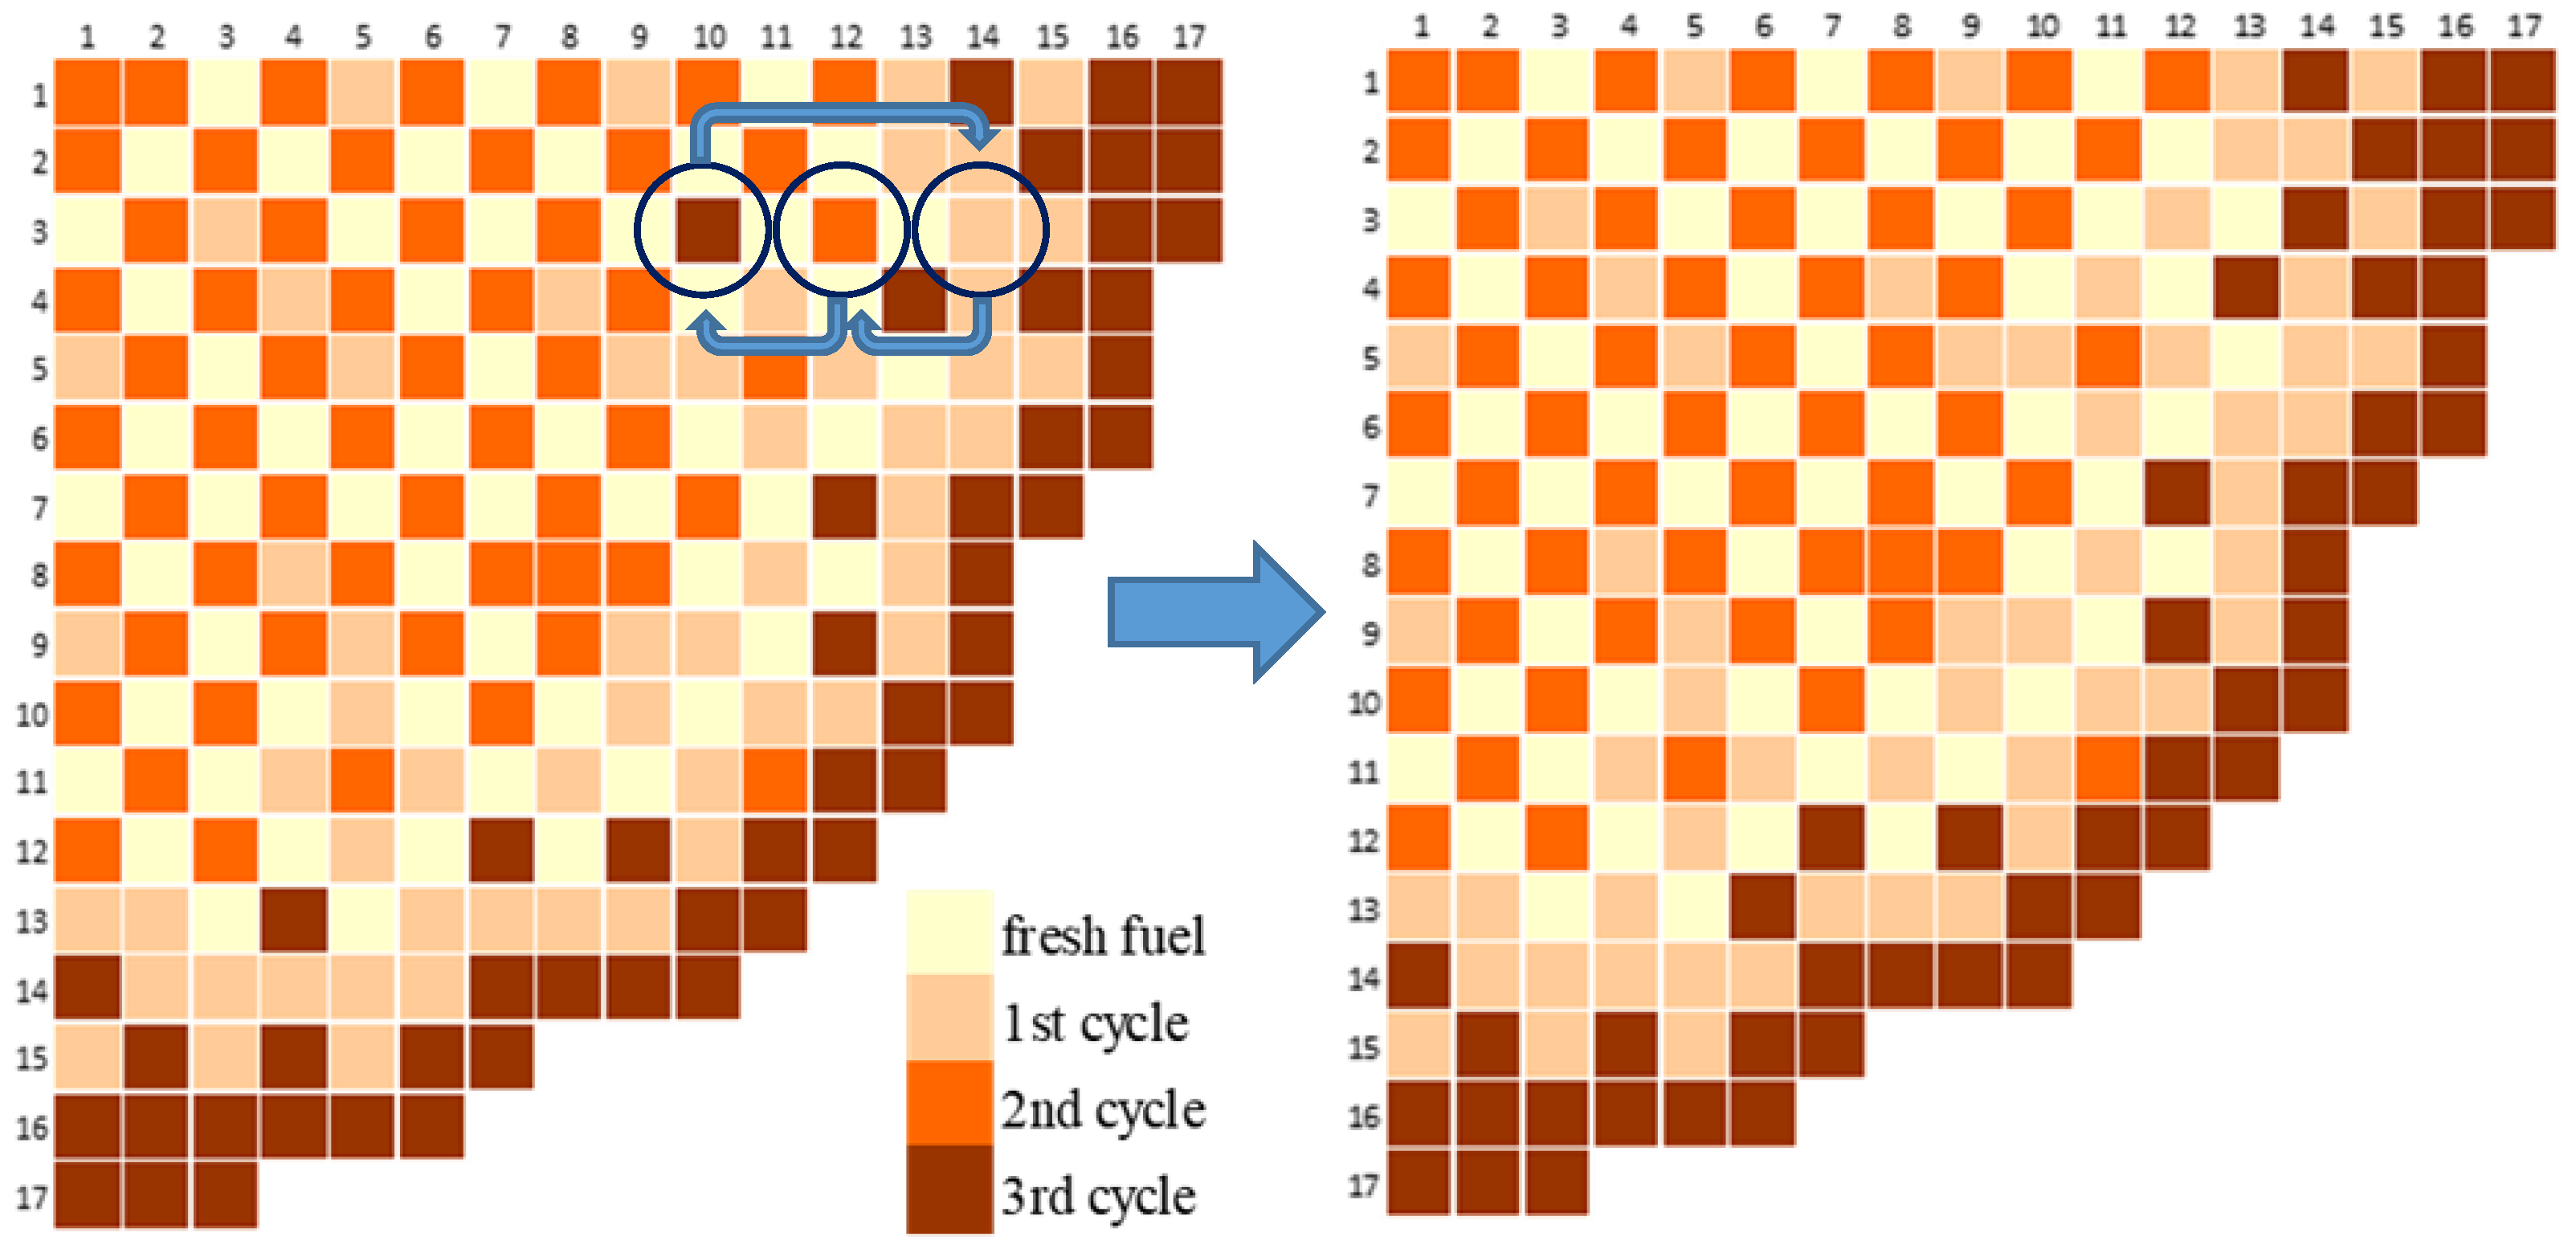
In the given study, the authors created a BWR full core reactor model based on the information available in open source. Since the fuel reloading procedure is commercially sensitive information, especially for modern reactors, the authors developed and applied a few different shuffling procedures to estimate the possible spread/variation of the fuel-discharged burnups. The analysis showed that the loading pattern from [18], used as a basis for this study, required minor adjustments to eliminate the assemblies-outliers. Overall, seven reloading patterns were analysed, two for the initial loading map and five for the adjusted one. The FA-discharged burnup distribution for the adjusted map was optimal (in terms of fuel utilisation) under the SP_A shuffling procedure with the burnup range 47.5 to 54.5 GWd/tU and least optimal under the SP_C procedure, with the burnup range 34.5 to 59 GWd/tU. The SP_B and mixed SP_A/SP_B shuffling procedures are defined as potentially optimal drafts. To achieve an industrially applicable optimum, the loading map requires further adjustments.
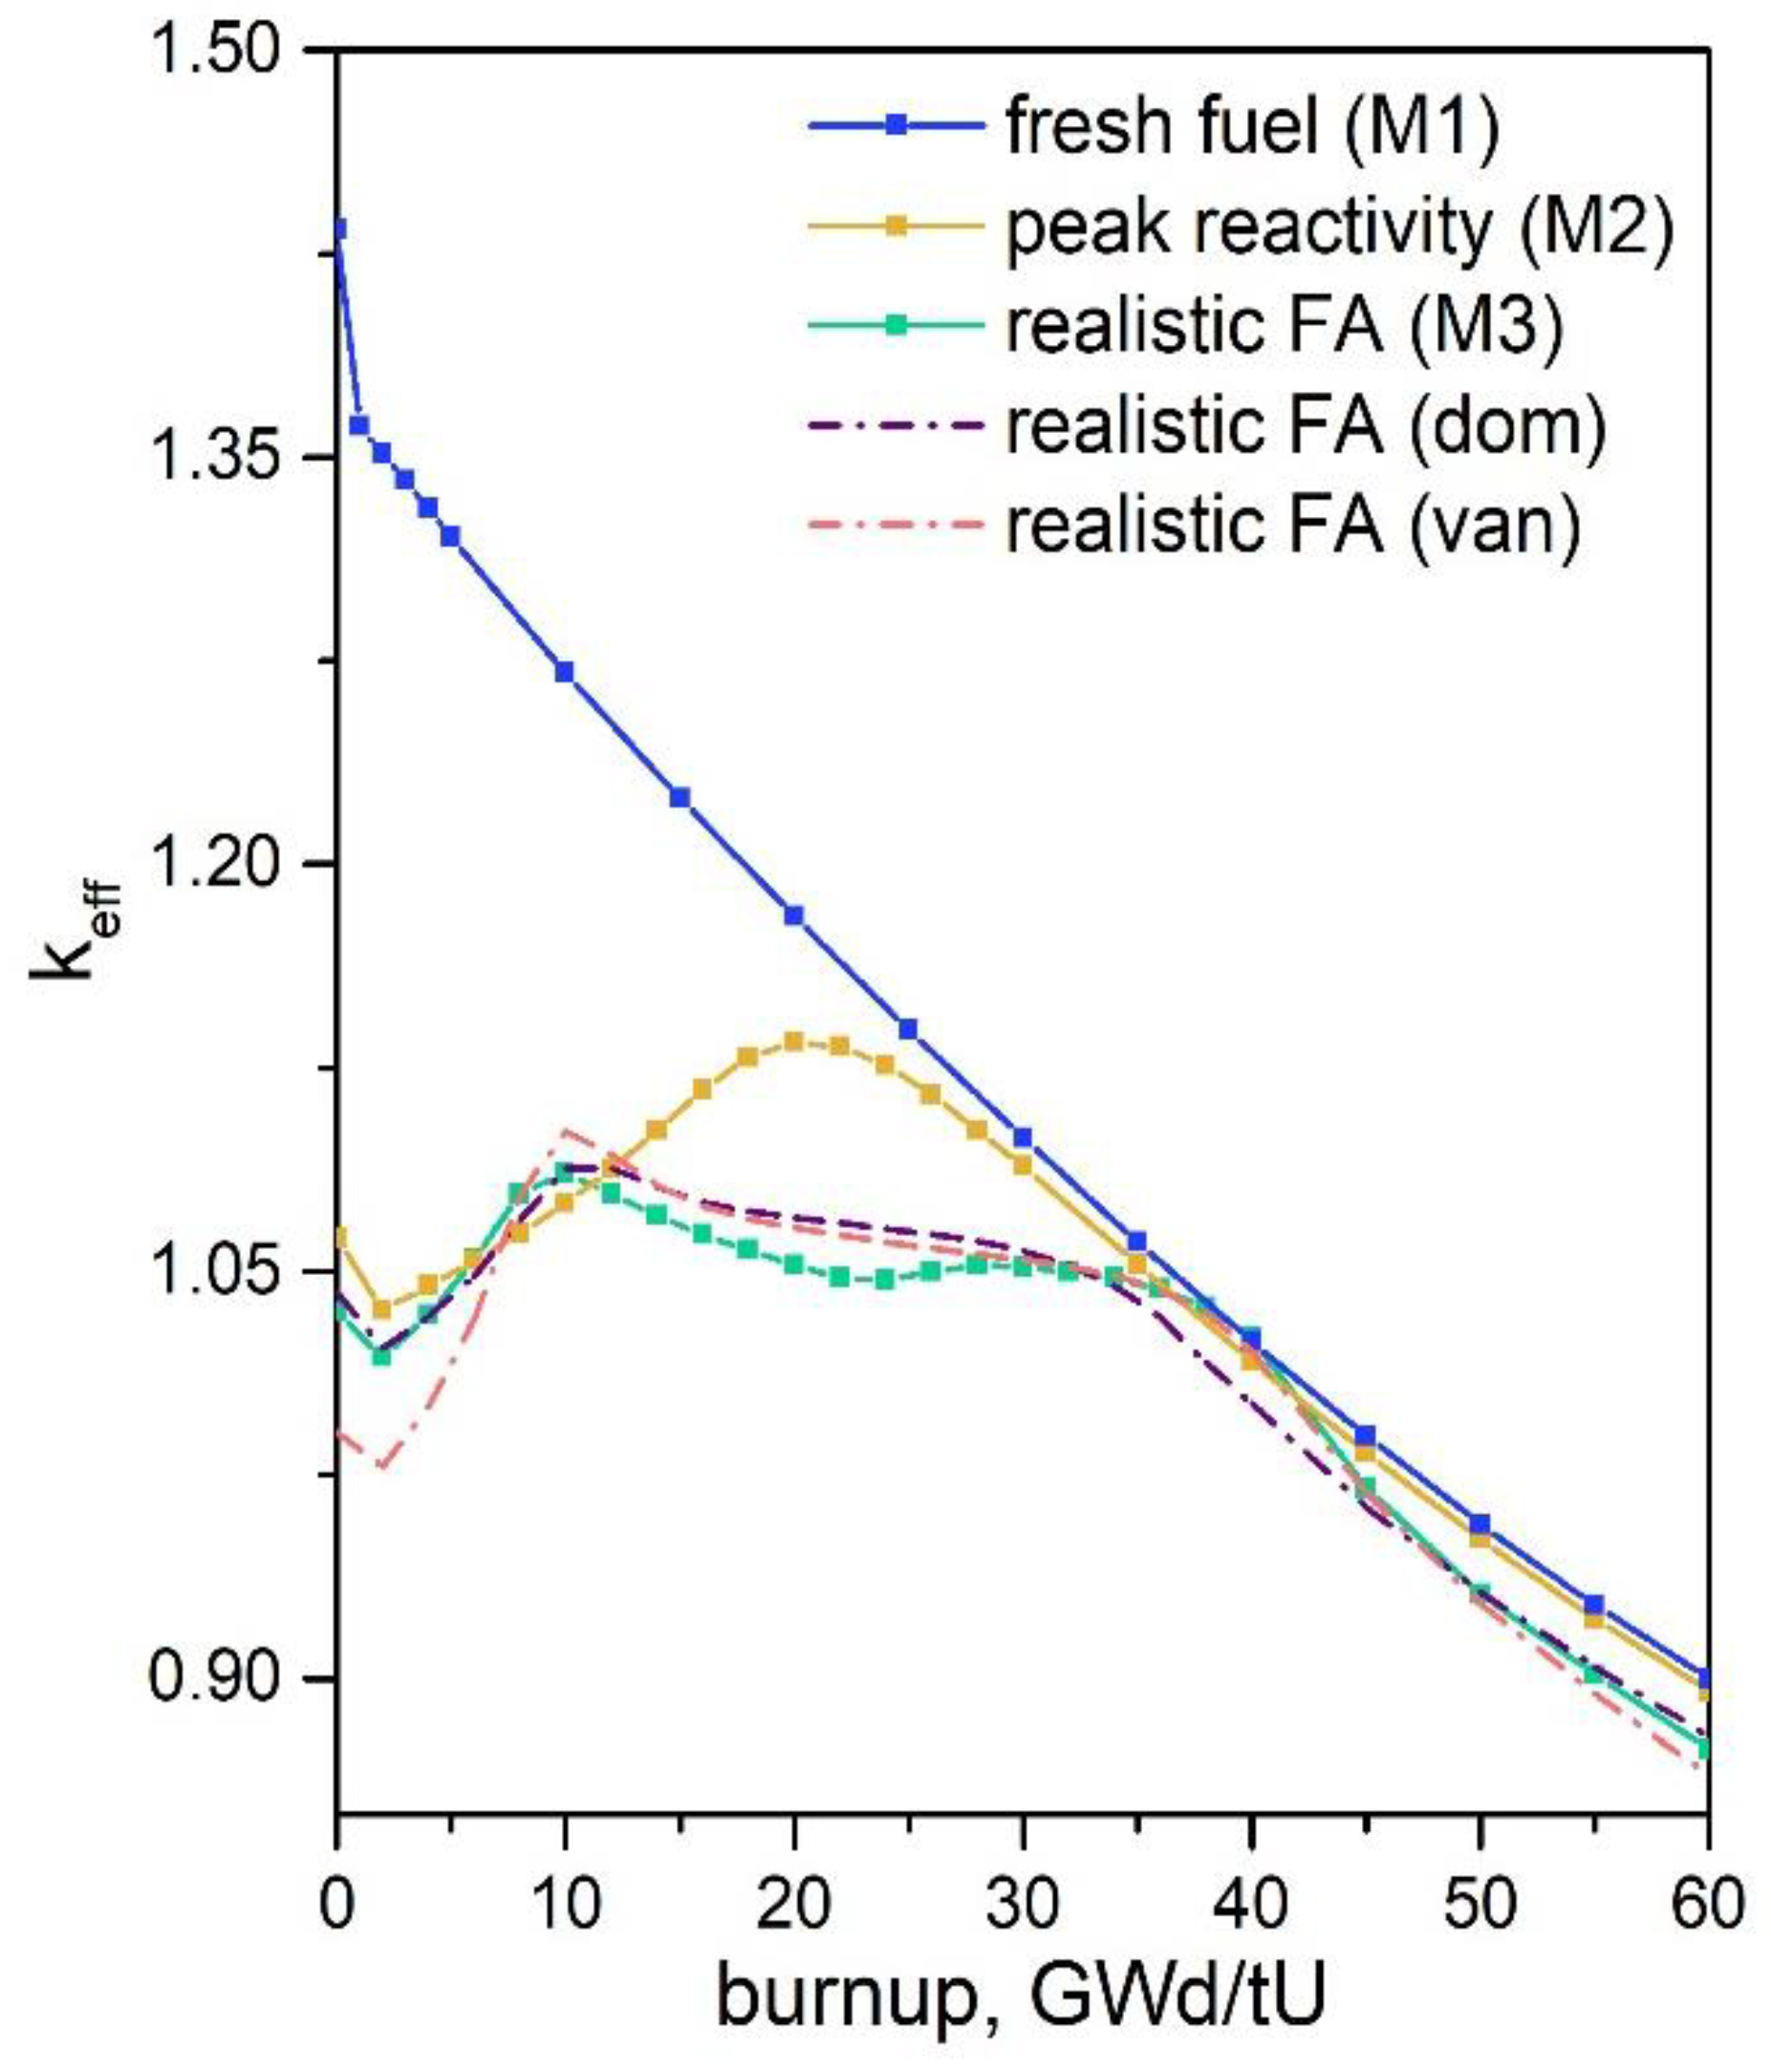
A single BWR FA model was analysed in the 2D lattice and 3D nodal approaches. The aim was to identify the impact of the increased level of FA model complexity on the criticality curve and the BUC. The results showed that the peak reactivity appears, by 10 GWd/tU, earlier on the criticality curve for the 3D BWR FA model with burnable poison in comparison with 2D lattice model and the criticality at the peak is substantially reduced. The given result coincides with the conclusions from [16]. Thus, the introduction of more detailed features in the BWR FA model using a nodal code can decrease the conservatism of the peak reactivity method when calculations are performed using the 2D lattice approach. Further investigation of the 3D model’s criticality curve revealed the presence of a second spike in criticality which, according to the power profile analysis, occurs due to the fuel depletion from the vanished layer (upper core).
Finally, the authors estimated the potential benefit from applying the burnup credit method to the modern BWR SF using the criticality curve for the 3D BWR FA model (M3) and the discharged burnup distributions obtained from the full core nodal simulations with two shuffling procedures, SP_A and SP_C. The results showed that the average reactivity gain in comparison with the fresh fuel and peak reactivity approaches is close for both SP_A_new and SP_C_new burnup distributions, even if the loading patterns are very different. The minimum reactivity decrease was 15,000 pcm or 14% in the SP_C_new case in comparison with the peak reactivity approach with the realistic FA model, while the maximum was 38,500 pcm or 35.5% for the SP_A_new case in comparison with the fresh fuel approach. On the other hand, more fuel assemblies from the distribution with the optimal shuffling scheme SP_A achieve the same level of burnup and thus show the larger reduction in reactivity in comparison with the standard BUC approaches for the BWR, and thus, future cask loading is estimated to be less sensitive.

Author Contributions

Conceptualization, A.D. and B.M.; methodology, A.D. and D.L.; software, A.D.; formal analysis, A.D.; investigation, A.D. and D.L.; data curation, A.D.; writing—original draft preparation, A.D.; writing—review and editing, A.P., D.L. and B.M.; visualisation, A.D.; supervision, B.M. and A.P. All authors have read and agreed to the published version of the manuscript.

Funding

This research received no external funding.

Acknowledgments

The authors would like to thank Yurii Bilodid from Helmholtz-Zentrum Dresden-Rossendorf, Germany for providing support with the DYN3D code.

Conflicts of Interest

The authors declare no conflict of interest.

References

  1. Crossland, I. Nuclear Fuel Cycle Science and Engineering; Elsevier: Amsterdam, The Netherlands, 2012. [Google Scholar]
  2. Wolff, D.; Bevilacqua, A.; Carlsen, B.; Chiguer, M.; González-Espartero, A.; Grahn, P.; Saegusa, T.; Sampson, M.; Seelev, I.; Wasinger, K.; et al. Storing Spent Fuel until Transport to Reprocessing or Disposal; International Atomic Energy Agency: Vienna, Austria, 2019. [Google Scholar]
  3. International Atomic Energy Agency. Nuclear Power Reactors in the World, 2019th ed.; International Atomic Energy Agency: Vienna, Austria, 2019. [Google Scholar]
  4. International Atomic Energy Agency. Energy, Electricity and Nuclear Power Estimates for the Period up to 2050; International Atomic Energy Agency: Vienna, Austria, 2018. [Google Scholar]
  5. Cacuci, D.G. Handbook of Nuclear Engineering; Vol. 1: Nuclear Engineering Fundamentals; Vol. 2: Reactor Design; Vol. 3: Reactor Analysis; Vol. 4: Reactors of Generations III and IV; Vol. 5: Fuel Cycles, Decommissioning, Waste Disposal and Safeguards; Springer Science & Business Media: Berlin, Germany, 2010. [Google Scholar]
  6. Merk, B.; Stanculescu, A.; Chellapandi, P.; Hill, R. Progress in reliability of fast reactor operation and new trends to increased inherent safety. Appl. Energy 2015, 147, 104–116. [Google Scholar] [CrossRef]
  7. Merk, B.; Litskevich, D.; Whittle, K.R.; Bankhead, M.; Taylor, R.J.; Mathers, D. On a Long Term Strategy for the Success of Nuclear Power. Energies 2017, 10, 867. [Google Scholar] [CrossRef] [Green Version]
  8. Merk, B.; Litskevich, D.; Peakman, A.; Bankhead, M. IMAGINE—A disruptive change to nuclear or how can we make more out of the existing spent nuclear fuel and what has to be done to make it possible in the UK? ATW Int. J. Nucl. Power 2019, 64, 353–359. [Google Scholar]
  9. Merk, B.; Broeders, C.H.M. Auswirkungen von verschiedenen Brennstoffzyklusoptionen auf die anfallenden Aktinidenmengen im deutschen Reaktorpark. Atw. Internationale Zeitschrift für Kernenergie 2008, 53, 404–412. [Google Scholar]
  10. Annual Commercial Spent Fuel Discharges and Burnup, 1968–30 June 2013. Available online: https://www.eia.gov/nuclear/spent_fuel/ussnftab3.php (accessed on 8 May 2020).
  11. International Atomic Energy Agency. High Burnup Fuel: Implications and Operational Experience, IAEA-TECDOC-1798; IAEA: Vienna, Austria, 2016. [Google Scholar]
  12. Marshall, W.B.; Ade, B.J.; Bowman, S.M.; Gauld, I.C.; Ilas, G.; Mertyurek, U.; Radulescu, G. Technical Basis for Peak Reactivity Burnup Credit for BWR Spent Nuclear Fuel in Storage and Transportation Systems; Oak Ridge National Lab (ORNL): Oak Ridge, TN, USA, 2015.
  13. Implementation of Burnup Credit in Spent Fuel Management Systems, IAEA-TECDOC-1013. In Proceedings of the Advisory Group Meeting, Vienna, Austria, 20–24 October 1997.
  14. Advances in Applications of Burnup Credit to Enhance Spent Fuel Transportation, Storage, Reprocessing and Disposition. IAEA-TECDOC-CD-1547. In Proceedings of the Technical Meeting, London, UK, 29 August–2 September 2005.
  15. Marshall, W.J.; Ade, B.J.; Gauld, I.C.; Ilas, G.; Mertyurek, U.; Clarity, J.B.; Radulescu, G.; Betzler, B.R.; Bowman, S.M.; Gonzalez, M. Overview of the Recent BWR Burnup Credit Project at Oak Ridge National Laboratory; Oak Ridge National Lab: Oak Ridge, TN, USA, 2019.
  16. Radaideh, M.I.; Price, D.; O’grady, D.; Kozlowski, T. Advanced BWR criticality safety part I: Model development, model benchmarking, and depletion with uncertainty analysis. Prog. Nucl. Energy 2019, 113, 230–246. [Google Scholar] [CrossRef]
  17. Price, D.; Radaideh, M.I.; O’Grady, D.; Kozlowski, T. Advanced BWR criticality safety part II: Cask criticality, burnup credit, sensitivity, and uncertainty analyses. Prog. Nucl. Energy 2019, 115, 126–139. [Google Scholar] [CrossRef]
  18. SCALE Code System. ORNL/TM-2005/39, Version 6.2.2; Oak Ridge National Laboratory: Oak Ridge, TN, USA, 2017.
  19. Jessee, M.A.; Wieselquist, W.A.; Evans, T.M.; Hamilton, S.P.; Jarrell, J.J.; Kim, K.S.; Lefebvre, J.P.; Lefebvre, R.A.; Mertyurek, U.; Thompson, A.B. Polaris: A New Two-Dimensional Lattice Physics Analysis Capability for the SCALE Code System; PHYSOR 2014; Oak Ridge National Lab.(ORNL): Oak Ridge, TN, USA, 2014.
  20. Detkina, A.; Peakman, A.; Litskevich, D.; Liang, J.-H.; Merk, B. Evaluation of BWR Burnup Calculations Using Deterministic Lattice Codes SCALE-6.2, WIMS-10A and CASMO5. Energies 2020, 13, 2573. [Google Scholar] [CrossRef]
  21. Rohde, U.; Kliem, S.; Grundmann, U.; Baier, S.; Bilodid, Y.; Duerigen, S.; Fridman, E.; Gommlich, A.; Grahn, A.; Holt, L.; et al. The reactor dynamics code DYN3D—Models, validation and applications. Prog. Nucl. Energy 2016, 89, 170–190. [Google Scholar] [CrossRef]
  22. Gomez, T.A.M.; Sanchez, E.V.H.; Kliem, S.; Gommlich, A.; Rohde, U. Integration of DYN3D inside the NURESIM platform. In Proceedings of the 17th Pacific Basin Nuclear Conference, Cancun, Mexico, 24–30 October 2010. [Google Scholar]
  23. Grundmann, U.; Kliem, S.; Rohde, U. Analysis of the Boiling Water Reactor Turbine Trip Benchmark with the Codes DYN3D and ATHLET/DYN3D. Nucl. Sci. Eng. 2004, 148, 226–234. [Google Scholar] [CrossRef]
  24. Fennern, L. Design evolution of BWRs: Dresden to generation III . Prog. Nucl. Energy 2018, 102, 38–57. [Google Scholar] [CrossRef]
  25. Ade, B.J.; Marshall, W.B.J.; Ilas, G.; Betzler, B.R.; Bowman, S.M. Impact of Operating Parameters on Extended BWR Burnup Credit, NUREG/CR-7240, ORNL/TM-2017/46; Oak Ridge National Laboratory: Oak Ridge, TN, USA, 2018.
  26. Mueller, D.E.; Scaglione, J.M.; Wagner, J.C.; Bowman, S.M. Computational Benchmark for Estimated Reactivity Margin from Fission Products and Minor Actinides in BWR Burnup Credit; ORNL Report to the NRC; Oak Ridge National Laboratory: Oak Ridge, TN, USA, 2013.
  27. Solis, J.; Ivanov, K.N.; Sarikaya, B.; Olson, A.M.; Hunt, K.W. Boiling Water Reactor Turbine Trip (TT) Benchmark; Volume I: Final Specifications (No. NEA-NSC-DOC--2001-1); Organisation for Economic Co-operation and Development: Paris, France, 2001. [Google Scholar]
  28. International Atomic Energy Agency. Boiling Water Reactor Simulator Workshop Material, 2nd ed.; International Atomic Energy Agency: Vienna, Austria, 2005. [Google Scholar]
  29. Peakman, A.; Grove, C.; Fitzgerald, K.; Gregg, R. Development of an equilibrium loading pattern and whole-core fuel performance assessment in the Advanced Boiling Water Reactor (ABWR) with UO2 and U3Si2 fuels. Prog. Nucl. Energy 2019, 117, 103053. [Google Scholar] [CrossRef]
  30. Kurihara, K.; Takeda, R.; Uchikawa, S.; Yokomi, M. Power-Flattening Method for Boiling Water Reactor. Nucl. Sci. Technol. 1981, 18, 116–124. [Google Scholar] [CrossRef]
  31. Marshall, W.J.; Ade, B.J.; Bowman, S.M.; Martinez-Gonzalez, J.S. Axial Moderator Density Distributions, Control Blade Usage, and Axial Burnup Distributions for Extended BWR Burnup Credit. NUREG/CR-7224, ORNL/TM-2015/544; US Nuclear Regulatory Commission: Rockville, MD, USA; Oak Ridge National Laboratory: Oak Ridge, TN, USA, 2016.
  32. Yamada, K.; Tajima, S.; Tsubaki, M.; Soneda, H. ABWR design and its evolution-primary system design of ABWR and ABWR-II. GENES4/ANP2003. Kyoto 2003, 15–19. [Google Scholar]
  33. Hitachi-GE Nuclear Energy. UK ABWR Generic Design Assessment Generic PCSR Chapter 11: Reactor Core; Hitachi-GE Nuclear Energy, Ltd.: Ibaraki-ken, Japan, 2017. [Google Scholar]
  34. Ade, B. SCALE/TRITON Primer: A Primer for Light Water Reactor Lattice Physics Calculations; ORNL/TM-2011/21; Oak Ridge National Laboratory: Oak Ridge, TN, USA, 2012.
  35. Rearden, B.T.; Marshall, W.B.; Williams, M.L.; Jessee, M.A.; Mertyurek, U.; Betzler, B.R. Accuracy and Runtime Improvements with SCALE 6.2; Oak Ridge National Lab (ORNL): Oak Ridge, TN, USA, 2017.
  36. Nakano, Y.; Okubo, T. Plutonium isotopic composition of high burnup spent fuel discharged from light water reactors. Ann. Nucl. Energy 2011, 38, 2689–2697. [Google Scholar] [CrossRef]
  37. Brown, C.; Hartley, K.; Hulsman, J. Extended Power Uprates and 2-yr Cycles for BWRs—Where Do We Go from Here? Nucl. Technol. 2005, 151, 120–125. [Google Scholar] [CrossRef]
  38. Hitachi-GE Nuclear Energy. Generic Design Assessment: Disposability Assessment for Wastes and Spent Fuel arising from Operation of the UK ABWR Part 1: Main Report; Hitachi-GE Nuclear Energy, Ltd.: Ibaraki-ken, Japan, 2016. [Google Scholar]
  39. Tsoulfanidis, N. The Nuclear Fuel Cycle; American Nuclear Society: La Grange Park, IL, USA, 2013. [Google Scholar]
Figure 1. Boiling water reactor (BWR) GE-14 10 × 10 fuel assembly design as used for the study.
Applsci 10 07549 g001
Figure 2. Advanced boiling water reactor (ABWR) full-core configuration of one quarter of the core.
Applsci 10 07549 g002
Figure 3. Polaris models of dominant (left) and vanished (right) FA layers for the cross-section preparation.
Applsci 10 07549 g003
Figure 4. Reflector model for the cross-section preparation.
Applsci 10 07549 g004
Figure 5. Shuffling procedures developed and tested to determine the discharge burnup of the individual fuel assemblies.
Applsci 10 07549 g005
Figure 6. Discharged burnup distributions of two different shuffling procedures based on the reference core map.
Applsci 10 07549 g006
Figure 7. BWR full core layout adjustment.
Applsci 10 07549 g007
Figure 8. Burnup distribution of the discharged fuel assemblies after four cycles from one quarter of the core for the cases with different shuffling procedures and core layouts described above: (a) SP_A_new/SP_A_old, (b) SP_B, (c) SP_C_new/SP_C_old, (d) SP_D and (e) SP_E (NEW—adjusted layout; OLD—reference layout).
Applsci 10 07549 g008
Figure 9. keff as a function of burnup for the discussed 2D lattice models and 3D nodal code model of BWR assembly.
Applsci 10 07549 g009
Figure 10. Power profile distribution for different burnups of the BWR assembly (M3 case).
Applsci 10 07549 g010
Figure 11. The normalised reactivity gain of the burnup credit (BUC) of the core approach in comparison with the fresh fuel, peak reactivity, and the peak reactivity of the realistic FA model approaches for BWR fuel for least optimal (a) SP_C_new and most optimal (b) SP_A_new burnup distributions.
Applsci 10 07549 g011
Table 1. BWR 10 × 10 assembly parameters [26].
ParameterValue
Fuel pellet radius, cm0.447
Zr clad radius, cm0.513
Fuel rod pitch, cm1.295
Assembly pitch, cm15.24
Water rod inside radius, cm1.1605
Water rod outside radius, cm1.2605
Assembly height, cm381
Table 2. Fuel assemblies (FAs) number at each cycle.
Cycle NumberFAs Number
0224
1224
2224
3200
Table 3. Design parameters for ABWR reactor core [32].
ParameterValue
Outlet reactor pressure, MPa7.171
Inlet coolant temperature, °C278.3
Core mass flow rate, kg/s14,502
Thermal output, MWth3926
Number of fuel assemblies872
Table 4. Thermal hydraulic parameters at rated conditions [33].
ParameterValue
Average heat flux430 kW/m2
Maximum heat flux1365 kW/m2
Peak fuel pellet temperature throughout the cycle1760 °C
Core average void fraction0.43
Table 5. Summarised data about burnups for BWR fuel as used in this study [38].
ParameterBurnup, GWd/tU
Average discharge burnup50
Maximum assembly average burnup60
Maximum pin burnup65
Table 6. Analysis of the differences in the burnup distribution parameters in comparison with the SP_A_new case as a reference (Δj *, GWd/tU).
CaseΔAVRGΔ5%LΔ5%HΔ68ΔBR
SP_A_new00000
SP_A_old0.07−0.20.90.083
SP_C_new−1−8.94.1−0.315.3
SP_C_old−1−8.65−0.516.4
SP_B−0.40.10.9−0.63.1
SP_D−0.7−1.22.4−0.85.5
SP_E−0.30.40.5−0.43.1
* ∆j = BijBSP_A_new,j, where j is the index of the burnup distribution parameter (Bavrg, B5%L, B5%H, B68 or BR); i is one of the considered cases; BRP_A_new,j is the value of the burnup distribution parameter with index j for the SP_A_new case; Bij is the value of the burnup distribution parameter with index j for the case i.
Table 7. The full core reactivity gain for the suggested BUC of the core approach in comparison with approximate ones.
BUC ApproachReactivity Gain, pcm
SP_A_NewSP_C_New
Fresh fuel 38,50337,384
Peak reactivity20,09718,977
Realistic FA at the peak reactivity16,17915,060
Publisher’s Note: MDPI stays neutral with regard to jurisdictional claims in published maps and institutional affiliations.

