Article

Usability Evaluation for the Integration of Library Data Analysis and an Interactive Artwork by Sensing Technology

1
Department of Information Management, National Chin-Yi University of Technology, Taichung 41170, Taiwan
2
Graduate Institute of Color & Illumination Technology, National Taiwan University of Science and Technology, Taipei 10607, Taiwan
*
Author to whom correspondence should be addressed.
Appl. Sci. 2020, 10(21), 7499; https://doi.org/10.3390/app10217499
Submission received: 28 September 2020 / Revised: 22 October 2020 / Accepted: 23 October 2020 / Published: 25 October 2020
(This article belongs to the Special Issue Advanced Technologies in Lifelong Learning)

Abstract

:
In this research, we propose innovative ideas for digital art combined with educational applications for the library. It also presents the library’s information services to be more humane and interesting. By taking interactive devices as the basis, this research integrates college library borrowing data and an interactive artwork in order to perform an information visualization service for a user in the library by using their own smart phone. This research uses an instant data operation to carry out the information inquiry applications to present three years of library borrowing data, from 2013 to 2015, obtained from the Hsih Shin University library Data Access Protocol. Finally, a usability evaluation for the interactive art is conducted. To testify that this interactive art design meets the principle of user acceptance, a questionnaire survey is used for the statistical verification. The research findings show that a positive explanation value was achieved for user acceptance. The research model proposed by this research acts as a usability evaluation of the integrated application of an interactive artwork and library information service. The research model also corresponded to the user’s emotional feedback in the HCI research field. The value of this research is that we provide usability-verified models for cross-domain applications.

1. Introduction

In recent years, interactive design devices have been integrated into information technology and artworks; this is known as interactive art. Due to the element of interaction, new media art has become the mainstream for this type of exhibition. Interactive art can be displayed in settings like museums or fine art museums, or can be included in any exhibition presented in certain culture center areas. Digital technology has made an impact on video collages, editing, synthesis procedures and the like, and virtual reality, with the sense of mixing reality having also inspired people in their creations. In the traditional creation-related fields, this interactive art is considered an innovative approach [1].
From computer art to multimedia art, and then to the developments of digital art and so-called new media art, these applications can be found not only in art exhibitions, but also in science education and even in daily life, as well as in the field of design. Interactive art could also be considered as digital art. With the feature of interaction, the factor of an engaged user is a part of this type of artwork, which is different from traditional art, where the artwork can only be seen, but not otherwise interacted with. However, the core value of interactive art would be that user experiences are created by instant interaction from the user experience.
Providing innovative interactions that can entertain the user is the crucial aim of performances of interactive technology and art integration. ‘Interaction’ is a process of communication between the work and the user. Regarding the interaction mode, the users’ cognition, as well as the mental aspect, should be the main focus. In the interactive art process, one by one, different messages are sent back and forth, where the audience becoming a user who can control the work. Interaction should have a positive impact on the performance of a work, as an amazing and joyful experience. That is the core value of interactive art is the interactive entertainment. As ‘Megatrends’ author John Naisbitt once suggested, secondary aims may be to sell products, inspire employers, or find more customers. However, first and foremost, interactive art should always be interesting entertainment [2]. In post-modern society, entertainment has come to be considered a necessary element in daily life.
In the first phase, this research takes the built-in ‘gyroscope’ motion sensor in cellphones as a tool to send signals via Wi-Fi to a server computer; by measuring the gravity and speed through the cellphone, the user can control the visual performance. By the time the server begins to run the Real-time Sprite Render, the visual effects of the universe space galaxy rotation will be presented as the animation display on the screen of the smart phone.
In the second phase, through the Data Access Protocol, this research accesses the Hsih Shin University library database, and using all information from 2013 to 2015, performs an information visualization. By carrying out the first phase using the universe interactive technology, information on the numerous books in the library, such as the book title and the number of times that a book has been borrowed, can be animated. To be precise, information visualization is an approach that can present library data analysis through interactive art. The main purpose of this is to demonstrate both ‘the interactive entertainment’ and ‘the visualized art’, where they can both be perceived by users who are engaged in the information visualization process.
When users download the cellphone APP client server and activate the program, all the library book information is presented in an animated universe form. Through the interaction between the user and the interactive device, a dynamic word cloud is shown on a huge monitor where the user can perceive beautiful cross-field integrations of library data and the interactive artwork.
Nowadays, library information services are user-oriented. To emphasize the user experience, a user-centered approach broadens the purpose of information services and the views of related tasks. During the process, the user may meet more of their needs and experience deeper emotions, such as feelings that come from enjoyment, entertainment, and attraction [3]. Since interactions with digital art are typically of value for the users, this research will take the user experience as a crucial point for the creation of entertainment. Thus, in the third phase, by observing the users’ reactions to library information services during the process of the interaction, this research takes the user experience, as well as usability, as a factor to examine for our research hypothesis.
To measure the user experience empirically, this research takes 42 users as the research subjects and emphasizes user feelings, as well as the optimization of the interface design, so as to carry out a user experience parameter analysis. Understanding the visions of the users to recognize their needs is crucial for research on the user experience [4]; this research takes an evaluation method and heuristic approach design originating from Jakob Nielsen for the usability evaluation [5]. By taking the user experience (UX) and playfulness as the factors, this research will then explore how the library information service interactive art interface design and its operating mode impact the satisfaction degree of the user, alongside the users’ willingness to engage with the interactive device. Jakob Nielsen’s 10 principles for the heuristic approach to usability evaluation are considered the evaluation standard in the field of academia [5]. Related overseas theses regarding user experience, interface design research, and user onsite interactive experience creation with interactive devices have also been continuously published.
The purposes of this research is firstly to verify that the interactive art we provide for the library information service meets the user’s acceptance. Secondly, it provides usability-verified models for the cross-domain applications between digital art and data visualization. Before attempting to answer these questions, this paper begins with a brief description of the system architecture of this interactive art in Section 2. After that, verified the usability for users in empirical way based on the Technology Acceptance Model (TAM) in Section 3. This is followed by the development of the questionnaire and statistical analysis that was conducted based on the usability theory in Section 4. Finally, this paper discusses the research results (Section 5) and concludes the research results for the usability of the interactive artwork applied in the library data analysis.

2. Theoretical Background

2.1. Interactive Art

Interactive art is a field that combines science, technology, culture, and aesthetics. Several researchers have proposed that the key feature of interactive art is the relationship between the work and people; this relationship is reciprocal, automatic, and direct. With the ability to make an impact on individual experience, and to create conversations via media with other people, interaction can be seen as a controller interface [6]. Bilda and Edmonds noted that interactive art has been considered a deep connection between the user and the work. During the interaction process, the theme of a work is narrated [7]. Kim. T and Kim. K suggested that a work would be a failure if it did not have a deep connection with the user [8]. Heinrich also proposed that, during the interactive art process, the user will engage in an instant physical participation in the work, and then, as they further impact one another, the ‘audience’ will become a ‘participant’ [9]. Furthermore, a large amount of related research has also proposed that the users‘ physical participation in the work during the interaction process is a crucial factor for the success of an interactive art exhibition. The reason for this is that, during the process, the interactive method should optimize the aspects of entertainment, work, communication, and interaction through which the user experience should be obtained. Interactive design is a significant approach to a lot of human-made goods and products. For example, software, mobile equipment, human-made environments, services, portable devices, and system constructions all have interaction at their heart [10,11,12,13,14].
Several interactive design scholars have stated that the main feature of interactive art is the user’s physical and mental satisfaction during the interactive process. Interactive art experiences include two values: (1) the interface controlling it is effective, and (2) the theme of the work is successfully conveyed [12]. Beyond the mental aspect, interaction—either individual or in a group—will make an impact on the work, yet this is repetitive and temporary, which means the original construction of the work will not be changed [10,11,12,13,14]. Based on the above-mentioned statements, it is clear that in interactive art, a work would be a failure without the interaction of the user [15,16]. During the interactive process, users’ reactions should be positive. The user experience should be comfortable, free, and enjoyable. However, discovering ways in which to ensure users have positive feelings and memories regarding a work are a major area of research in this field today [17]. Usually, designers will take the elements of ‘direct’, ‘nature’, and ‘instant’ to create an interactive artwork. The most natural way to carry out any interaction should be guided by human intuition. By operating the interface to send a message to a computer through computer tracing technology, the computer will then present audio and visual feedback to the user in order to create an interactive effect in an instant.
In addition to the above-mentioned statements, either interactive artwork is a medium that can trigger an interaction so as to create a reciprocal relationship with the user, or ‘the user’ is a necessary element during the interactive process. A lot of interactive artwork indeed sets ‘the user’ as the subject controlling the interaction, and only through the user’s control can the meaning or the purpose of the work be achieved. However, if interactive artwork is taken as a medium to convey the meaning or purpose of an artwork, the theme of the work should be more effectively conveyed. With this in mind, interactive artwork can be applied to library information services. Through the playfulness of the artwork, the interaction will not only provide education and learning services, but should also create a joyful experience for the user, in an innovative approach that traditional methods of education cannot achieve.

2.2. Related Research

The library is the lifelong learning field that connects the local learning setting with the global resources of information and knowledge in the digital era. The library offers education as to how to search and use this information and ensure the quality of information service. Thus, the library can be said to provide information qualifying as an important prerequisite for lifelong learning.
Moreover, the library holds a large amount of data regarding its users, the users’ characteristics, their information needs and information use, which can be of assistance to the library for better managing their resources and services. Library data visualizations could prove a useful tool when it comes to enhancing the decision-making process, and the directors/administration could make more successful operational choices [18].
Koltay assumes that the function of library education is not only to provide information literacy training, but also to face the challenge of data-intensive research services in the era of Big Data. The quality of data provision, data citation, and data literacy issues are critical to academic university library services. To provide these data services, innovative technologies and professionals are required [19]. To meet the requirements of high-quality data services, the library must innovate and continuously develop data visualization and information services to meet the learning requirements of their readers and improve overall information service quality.
Wójcik [20] proposed a conceptual framework that presents the information service issue of library innovation that is not based on empirical research, although it has not yet been tested in practice. However, Wójcik believed that it was a valuable framework for designing and implementing innovative services in libraries. The purpose of Wójcik’s research was to identify the data sources of innovation in library information services and point out how they can be used to improve the overall information service quality.
It is usually difficult for the library to provide management staff and users with an efficient and easy-to-understand way of explaining the meaning of such data. According to Card et al. [21], information visualization is the use of computer-supported, interactive, visual representations of abstract data to amplify cognition. Information visualization allows users to extract data from large databases in an efficient and effective way. Many scientists’ data propose that information visualizations can be regarded as a solution for this problem [18].
The advantage of visualizing data is that the meaning of information is more intuitive through the presentation of data sets. Computer graphics, combined with tags and numerical parameters (such as color, distance, and size), can make information services clearer and more user-friendly. The research framework proposed by Gkioulekas and Polydoratou [18] proposes a way to visualize future experiential service innovation, considering how to integrate realism into design methods.
Based on the above-mentioned related research on the data visualization of libraries, it can be found that most of these only provided implementable conceptual frameworks. Therefore, this research will use specialized IT skills such as interactive technology, the Wi-Fi system, and databases to optimize the data visualization of library information services, and we provide a quantifiable and verifiable theoretical framework that meets the usability principles of information systems.

3. Methodology

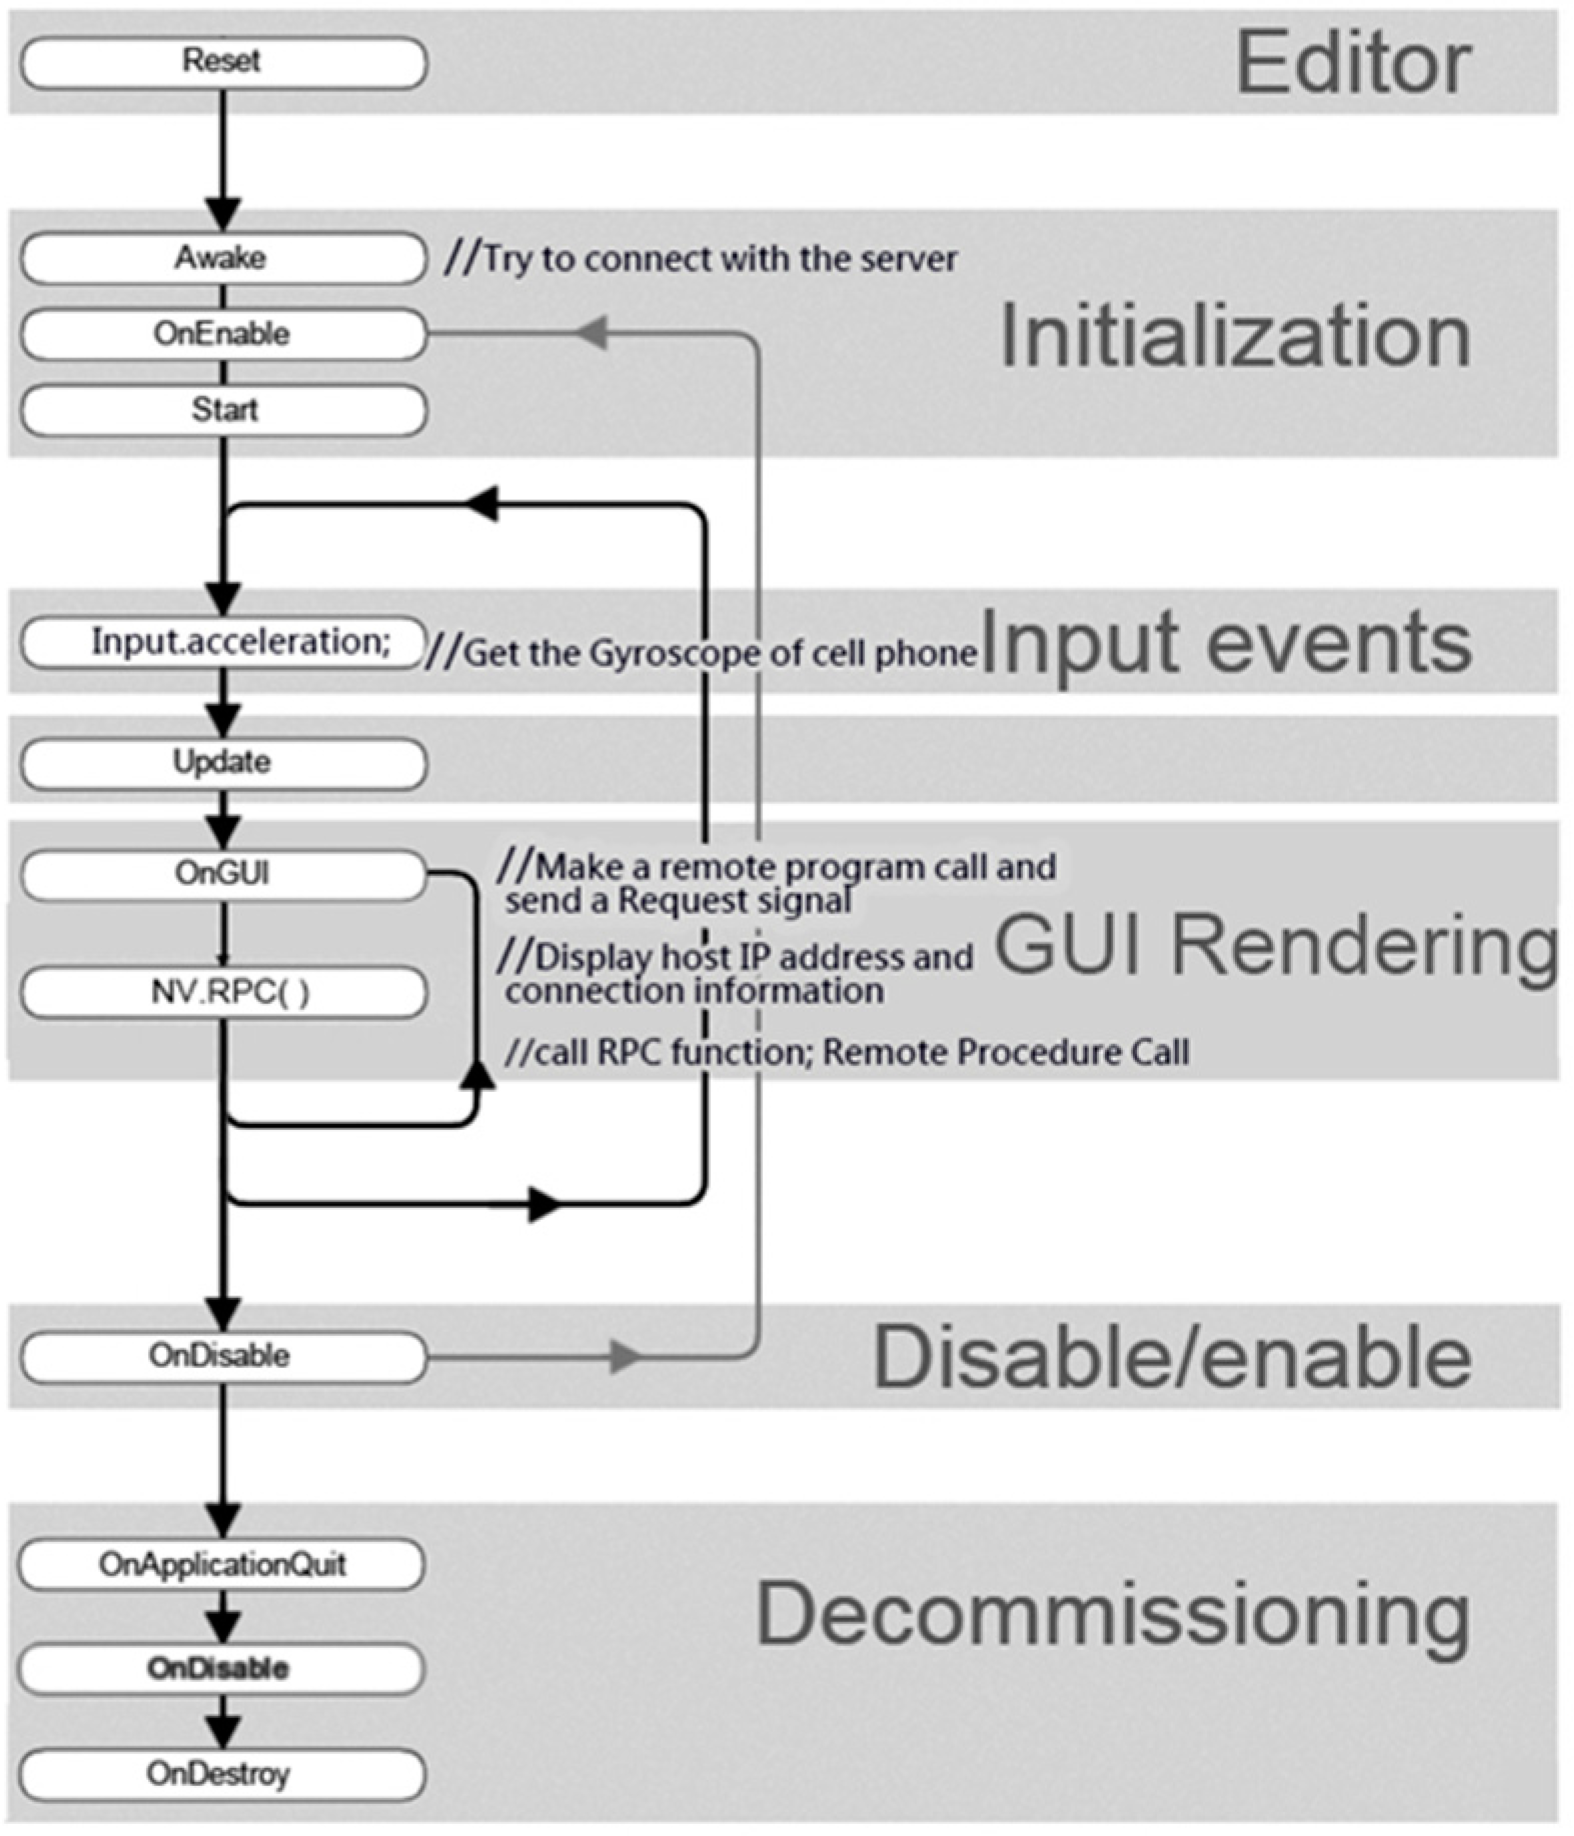
3.1. System Design Idea

By operating a client app that has been downloaded to facilitate the interaction, messages are sent via Wi-Fi, by means of a gyroscope controlling speed and gravity, to a computer. By doing so, the stable condition of the animated images will be changed on the monitor and the movement of stars will speed up, as they continue to collide with each other. Therefore, Big Band, the cloud-like galaxy, will cause cosmetic swirling. Three to nine people can randomly join or leave the interaction at the same moment, as shown in Figure 1. The Wi-Fi system is a mini telecommunications base station. Even if there is no limit on the number of connections, after reaching a certain number of people (more than 10 people), signal transmission congestion will occur, and there may even be problems such as disconnection and failure to connect the server’s IP. To increase the demand for a large number of connections for users, it is necessary to build a Wireless Array to increase the load of the number of connections. In the exhibition space of the library, it is suitable for less than 10 people that can move freely. Therefore, we only built one Wi-Fi receiver, instead of building a wireless array.
By taking Unity Engine, this research used C# language to write the connecting socket application for the client with the server via Wi-Fi. In the phase of initiation, the server makes connections with the client server when the users shake their phone to send gyroscope messages. Once the messages are received, the connection is made. The client app procedure is explained in Figure 2.
As seen Figure 3, OnEnable( ) on the server model indicates that a message is to be sent to the client server to request a connection. The connection of the socket will be made through Port 4242 once the message is received, and MS SQL Database Management will request a DB inquiry signal to create an access channel. Once the DB access channel is created, SQL is shown on the server model, indicating a message is to be sent to the SHU library server. Therefore, the library borrowing data from 2013 to 2015 will be selected, and a report of the book borrowing statistics will be sent back to the server. Based on the information that the server receives from the library server, the galaxy of universe dynamic sprite renderings will proceed, and as the book titles and borrowing information are animated on the monitor, a galaxy rotation visual effect infographic will be presented. Once the gyroscope is stopped by the user, the DB access channel is closed and the connection between the server and the client-server will be disconnected. The connection between the server and client-server is illustrated in Figure 4.

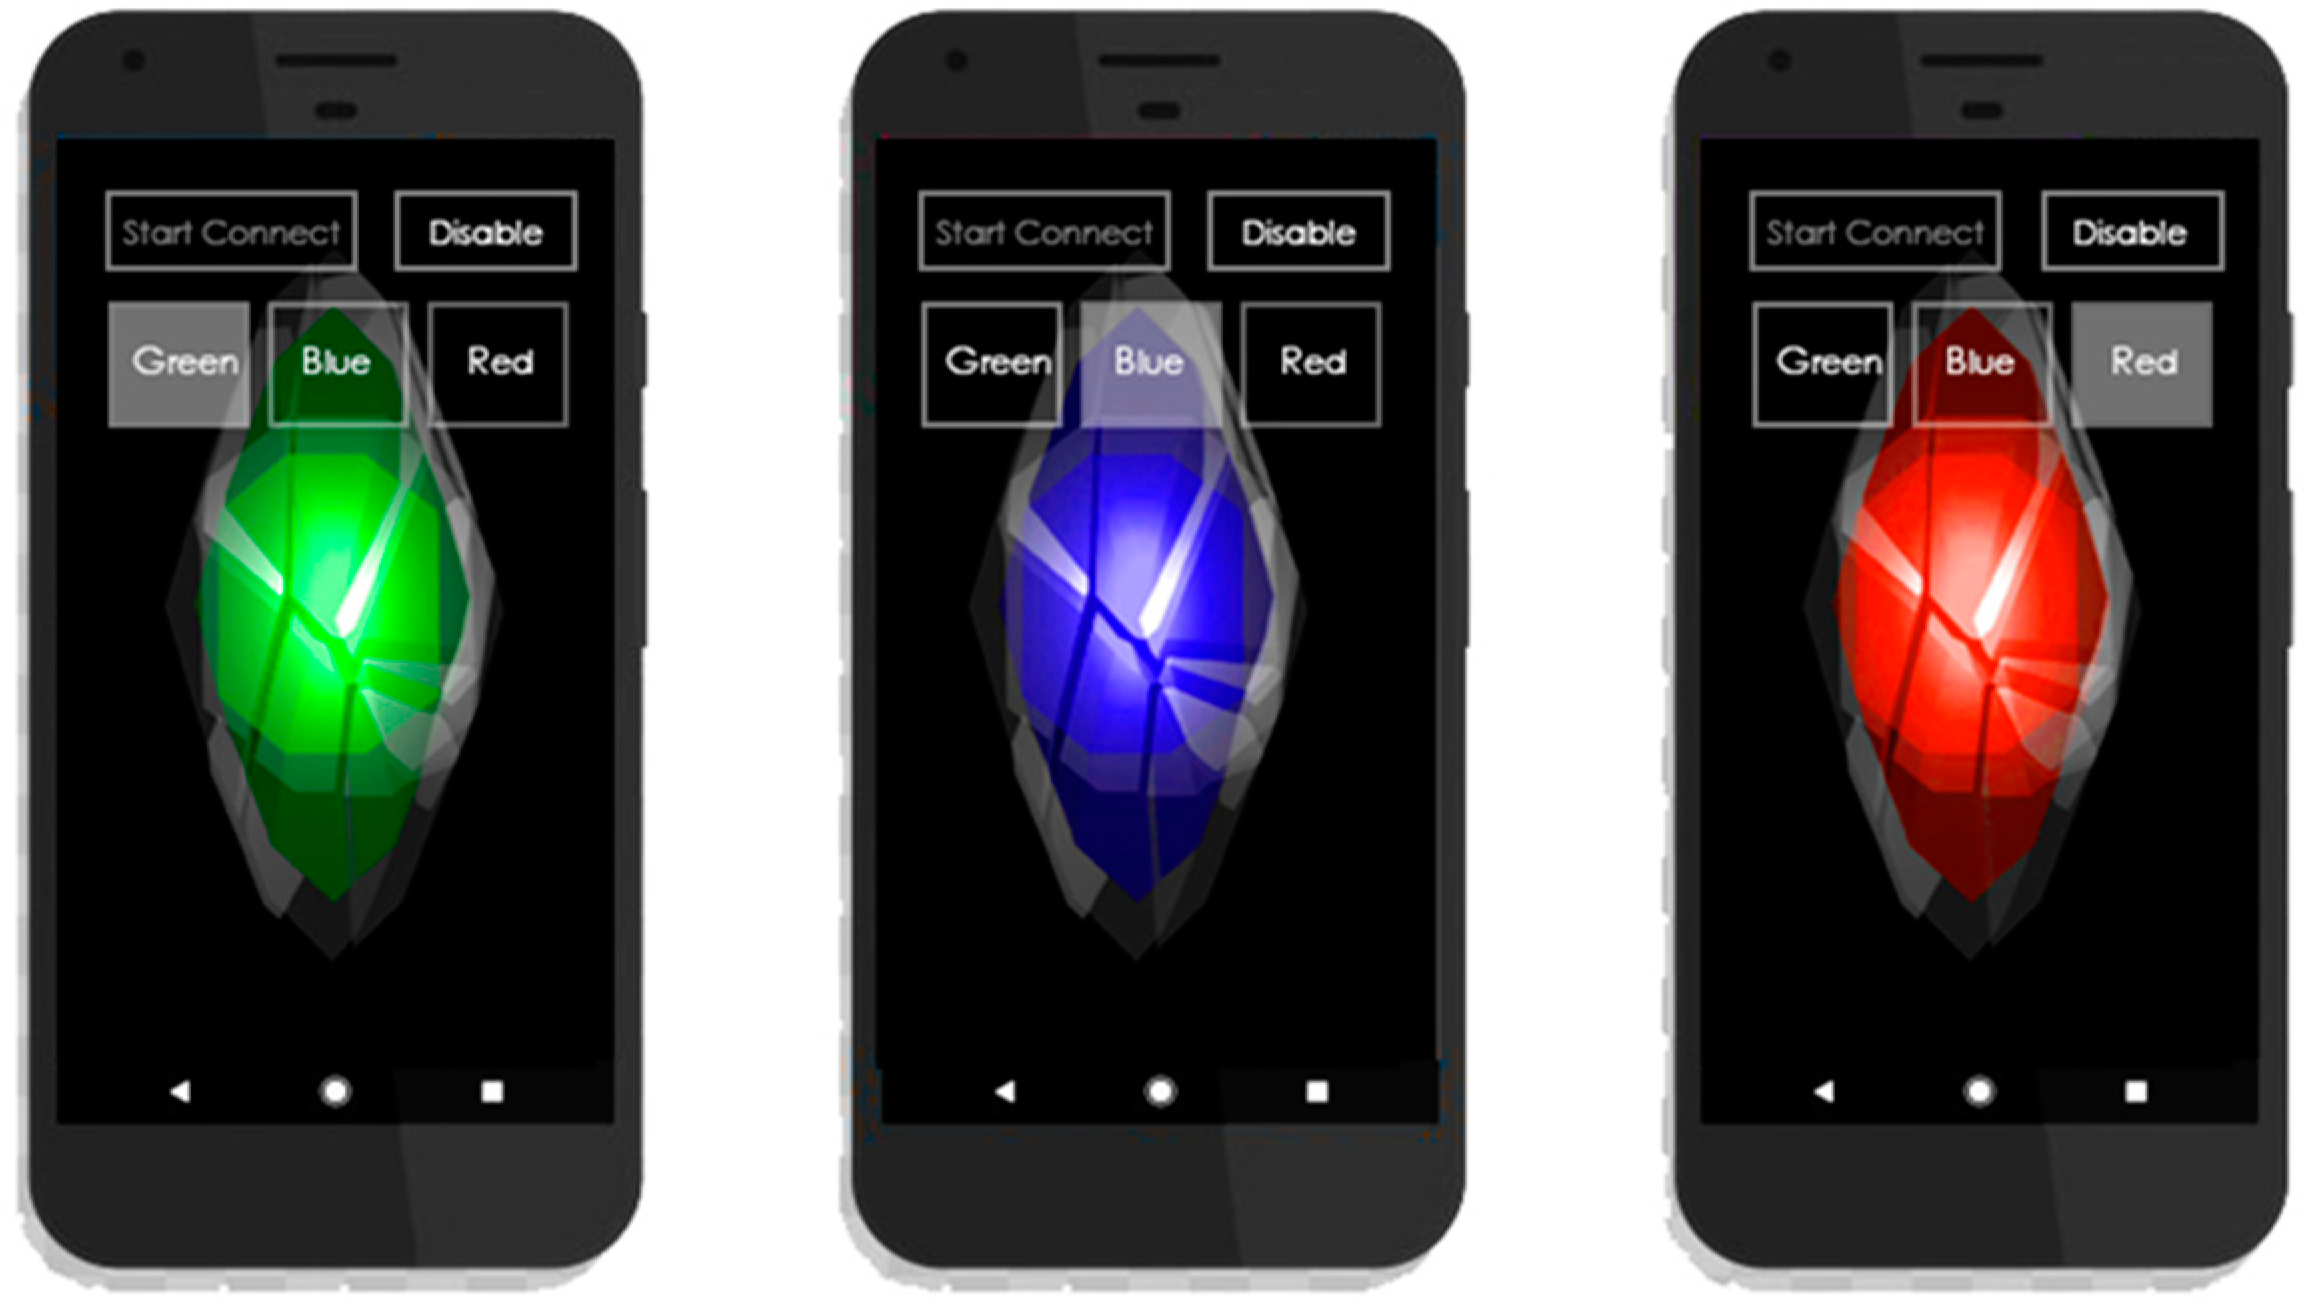
3.2. The Exhibition of the Work

For the user, digital media not only features high productivity and high efficiency, but also high entertainment. Moreover, through the user experience, digital media may ignite creativity and aesthetic inspection, which is the core value of modern interactive design. With the advanced technology now available, this research will produce an interactive artwork for people to engage in worldwide.
Regarding ‘environmental interaction’, Her once stated that art that is presented to the public usually has multiple purposes, and interaction will be part of the experience no matter how the user engages in the artwork, even if only indirectly [22]. During this process, the usability, function, and meaning of the art should never be changed. That is, the artwork is classified as a sort of recreation, or even an element that can vitalize a work. In interactive art, active operation of the system by the user can be seen as the key to a successful artwork. Although interaction is not the only means by which to perform a work, it is one way that a user experience can be obtained. Furthermore, Kwon pointed out that, today, public artworks are no longer static; artworks are presented in harmony with the environment, buildings, and architecture around them [23], which helps to convey their meaning.
Figure 5 shows the client app UI design. There are five buttons on the interface, including the ‘Start Connect’ button for activating the server connection and the ‘Disable’ button for ending the connection. The other three buttons are Red, Green and Blue, all of which can control the star color on the monitor. Users can control the buttons together at the same time to create a color mixing effect. There are 256 color combinations, which can give diverse visual effects. If desired, users can repeat the interaction or are free to leave the process when they choose. During the interaction process, the server will make a connection to the HSU Library database to collect book borrowing information, and then present this data through the projector on the monitor. As the phone stops shaking, and all the users turn off the app and leave the interaction, the image on the monitor will go back to the original state of silence, and the stars in the universe will go back to their original luminous white. This research was performed at the HSU library from 12/16/2015 to 12/21/2015 during the exhibition, and 300 to 400 people engaged with the interactive art, as shown in Figure 6a,b. The library book borrowing data analysis is explained in Figure 7. In Figure 7a, each book title and its number of loans per book can be visualized by user launch his smart phone’s gyroscope. While in Figure 7b, the service data for number of books loaned by the library was displayed as the information visualization of big data on the screen. The color of the device according user’s choice in Figure 5 will be related to the color display of the area in Figure 7b. If the user chooses green, green will be displayed for the book borrowed.

3.3. The Empirical Verification of Usability

During the exhibition from 12/16/2015 to 12/21/2015, we carried out a questionnaire survey through observing the interactive process and briefly interviewing users for the usability evaluation. Usability testing is a method to evaluate the value of digital products or systems, to verify whether the information architecture can be easily and intuitively operated by users. This method is known as user-centered design.
ISO 9241-11 [24] and ISO 13407 [25] are two important standards related to usability; the former provides the definition of usability, and the latter guidance for design usability [26]. According to the ISO 9241 standards, a usability evaluation should test the effectiveness, efficiency, and satisfaction in the specific context that a product is used by certain people. In other words, a usability test is an evaluation approach that tests whether users are satisfied with the product and examines the context effectiveness and efficiency. The evaluation procedure includes four parts: (1) definition and setting, (2) recruitment of interviewees, (3) observation and testing, and (4) results analysis. After collecting users’ feedback, quantitative tests were also conducted during the exhibition.

3.4. Description of the Questionnaire—Definition and Setting

Regarding the degree of IT system acceptance in the social science field, the Theory of Reasoned Action (TRA) [27,28] was constructed on the basis of the Technology Acceptance Model (TAM) [29]. Since traditional IT is used only for work efficiency, the influence factors would be limited to the user, such as their operation of the computer hardware or software. Since the factors of the environment and society would be expected to impact the degree of user information system acceptance, Venkatesh and Davis used TAM principles to develop the Extended Technology Acceptance Model (TAM2) [30]. TAM2 has the constructs of the social influence process (including social norms, volunteering, and social images), as well as a user cognition process (including work-related elements, product quality, performance, and perceived ease of use) [30]. Despite the fact that in TAM the social influence process has been deleted, it is clear that social norms may affect user intentions. Through TAM, however, users’ behavior and intentions towards technology products can be empirically explained, as since 1989, numerous researchers have published work on user technology acceptance theses in the field of social technology.
By observing the popularity of digital technology and the user experience of the consumption market, the concept of usability has been extended with the user-centered model, which is different from the idea that products are mainly used for purposes related to work or task achievement. Thus, to create a better user experience that takes into account users’ needs and emotions, enjoyment, entertainment, excitement, and attraction should be taken into account in the interactive process [3].
Wetzlinger, Auinger, and Dorflinger stated that the user satisfaction degree of a system should be focused on the usability evaluation [31], and the Software Usability Scale (SUS) questionnaire was their preferred measure for usability evaluations [32]. The SUS is considered to be a reliable approach for usability evaluation [33,34], and is outlined in Table 1.
Questions (2), (3), (4), (6), (7), (8) and (10) are related to perceived ease of use. Questions (1) and (5) are about perceived usefulness, and (9) reflects the user satisfaction degree. The two factors of perceived usefulness and perceived ease of use are the most important to test in a usability evaluation.
Moon and Kim emphasized individual perceived playfulness. They suggested that user intention and attitude to net-related entertainment would be affected by perceived playfulness [35]. As for the degree of digital media acceptance, Moon and Kim proposed that perceived playfulness may help increase user cognition, and further recognize the user’s intention. Thus, this research will take ‘perceived playfulness’ as the main factor to explore in relation to the value of interactive artwork.

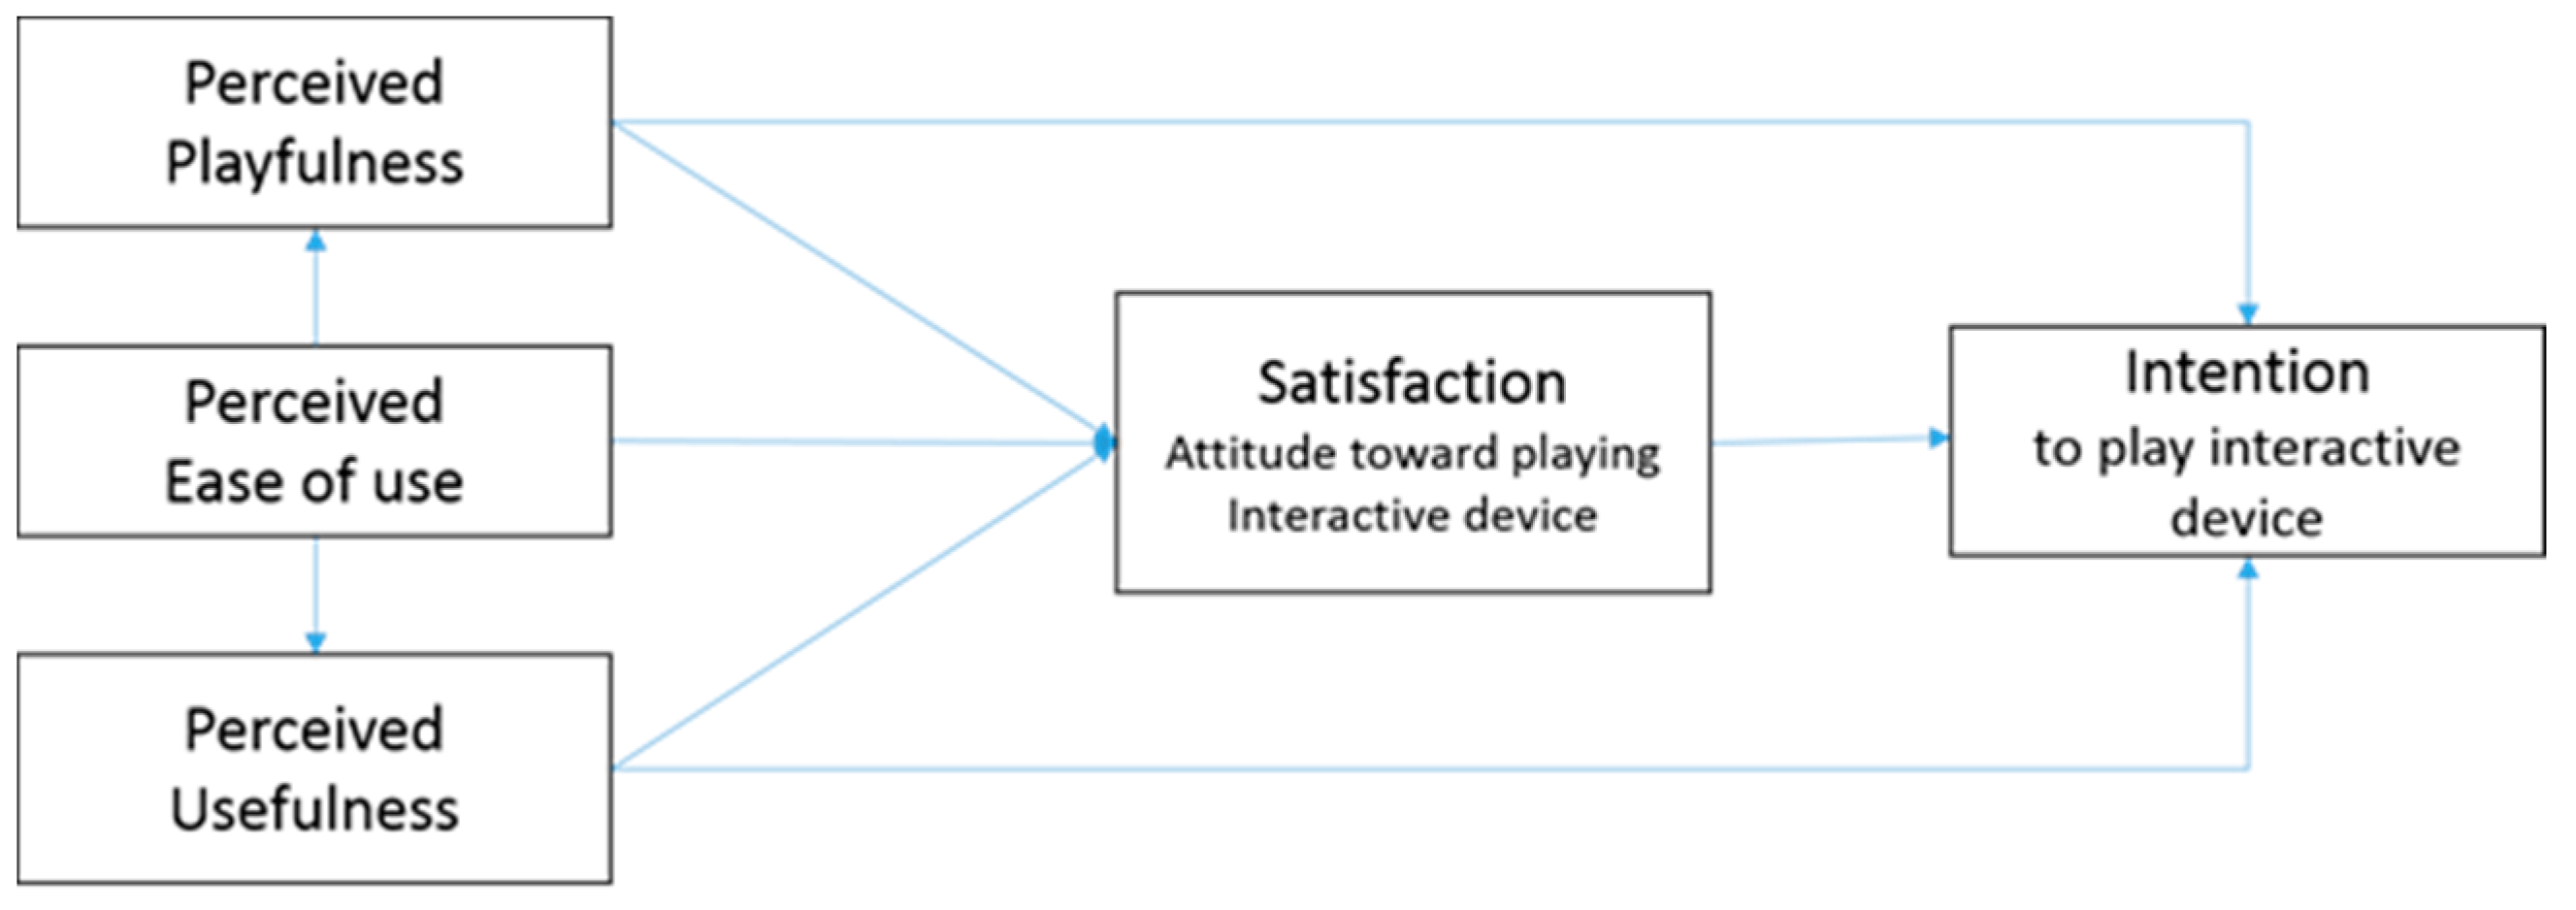
3.5. Research Model and Hypotheses

Based on the ISO standards, three constructs are essential for usability evaluation, along with TAM constructs and the factor of perceived playfulness, which Moon and Kim proposed. This research builds a construct for integrating library data analysis into artwork usability evaluations, as seen in Figure 8. The research constructs include: (1) Perceived Playfulness, (2) Perceived Ease of Use, (3) Perceived Usefulness, (4) Satisfaction, and (5) Intention.
(1)
Perceived Playfulness
Both internal and external factors may affect the intention to use information technology [36,37]. The internal factor in this research is the sense of excitement and playfulness that comes from engaging with the operating system. The external factors are the goals or rewards that can be achieved by using the operating system [36,38,39]. ‘Perceived playfulness’ is positively related to the internal and external factors of user acceptance, as testified by related research on the Internet [35,40], virtual stores [41], AR teaching systems [17,42] and online games [36,43]. Perceived playfulness in this research is defined as the joyful feeling that the user experiences during their interaction with the interactive artwork. We proposed that ‘perceived playfulness’ should help convey the theme of the artwork and increase user satisfaction.
(2)
Perceived Ease of Use
In the TAM model, ‘perceived ease of use’ is positively and directly related to user intention. In this research, it refers to the easy and intuitive operation of the artwork. Related research, such as in online media or digital media [36,44,45], AR education applications [17], and so forth, has confirmed that ‘perceived ease of use’ is a key factor in user acceptance. This research further proposes that ‘perceived ease of use’ should include the ability to engage with the interactive artwork with a light heart. ‘Perceived ease of use’ should also increase the sense of joyfulness. ‘Perceived ease of use’ is positively related to perceived playfulness, according to related research [30,36]. This research thus proposes that ‘perceived ease of use’ directly affects perceived playfulness, perceived usefulness, and user satisfaction.
(3)
Perceived Usefulness
There are many diverse aspects of efficiency. For most multimedia and information systems, efficiency refers to tasks being completed quickly and with few mistakes. Decreasing the number of steps in the process of operating the information system and multimedia can also enhance efficiency, which has been confirmed by related TAM research [17,30,36,37,43]. According to the TRA model, efficiency feedback can be defined as user self-internal identified, and also can be defined as the degree of user acceptance [36]. Lin and Lu suggested that ‘perceived usefulness’ is closely linked to usability [46]. ‘Perceived usefulness’ in this research is defined in terms of the interactive art system. We propose that ‘perceived usefulness’ should directly affect user satisfaction.
(4)
Satisfaction
According to Lin and Lu, satisfaction is a main factor influencing whether a user will continue to use a service [46]. For instance, if a user is satisfied with a website, then the user will repeatedly visit the website. User satisfaction is formed by the whole image of a product. Chang, Hu, and Chen, in applying AR to the usability evaluation of a culture environmental learning system, suggested that the user satisfaction degree will not merely increase user intention, but will also enhance user learning performance [17]. ‘Satisfaction’ in this research is defined as the sense of satisfaction that can be created by the interaction with the interactive artwork. The degree of satisfaction should directly affect user intention to use the system, and is also positively linked to the factors of ‘Perceived Playfulness’, ‘Perceived Ease of use’, and ‘Perceived Usefulness’.
(5)
Intention
‘Intention’ here is closely linked to the factors of perceived playfulness, perceived ease of use, perceived usefulness, and satisfaction degree. It refers to the users’ willingness to engage with the interactive art again.
Accordingly, the following eight hypotheses have been proposed by this research:
Hypothesis 1.
‘Perceived Playfulness’ is positively related to ‘Satisfaction’ with respect to interaction with the interactive art device.
Hypothesis 2.
‘Perceived Playfulness’ is positively related to the user’s ‘Intention’ of reusing the interactive art device.
Hypothesis 3.
‘Perceived Ease of Use’ is positively related to ‘Perceived Playfulness’ with respect to interaction with the interactive art device.
Hypothesis 4.
‘Perceived Ease of Use’ is positively related to ‘Perceived Usefulness’ with respect to interaction with interactive art device.
Hypothesis 5.
‘Perceived Ease of Use’ is positively related to ‘Satisfaction’ with respect to interaction with the interactive art system.
Hypothesis 6.
‘Perceived Usefulness’ is positively related to ‘Satisfaction’ with respect to interaction with the interactive art device.
Hypothesis 7.
‘Perceived Usefulness’ is positively related to the user’s ‘Intention’ with respect to interaction with the interactive art system.
Hypothesis 8.
‘Satisfaction’ is positively related to the user’s ‘Intention’ with respect to interaction with the interactive art system.

4. Statistical Methodologies and Analysis Results

‘Perceived Playfulness’ refers to internal cognition and exploration. When users are motivated, their interactions tend to be more joyful and they can become immersed more easily. There are four questions in this research designed for exploration of ‘perceived ease of use’ and ‘perceived usefulness’. All the questions are based on the ISO 9241-11 and ISO 13407 standards, as well as the TAM2 theory proposed by Venkatesh and Davis [30]. In the two categories of the usability evaluation, there are four questions that are about ‘perceived usefulness’, and four questions related to ‘perceived ease of use’. As for ‘intention’, this research used the Likert method to examine users’ willingness to engage with the interactive art system’ again. There are four questions related to intention. For the 5-point Likert scale, 1 is the minimum reaction, while 5 is the maximum reaction. The related explanations and definitions are shown in Table 2. The questionnaire is showed on Appendix A.

4.1. Descriptive Statistics

The questionnaire survey was conducted from 12/16/2015 to 12/21/2015 at the HSU library during the interactive process. The research subjects were the users invited to experience the interaction. The questionnaire design is shown in Table 2; the total content of the questionnaire is shown in the indexes. There were 42 valid questionnaires collected. Based on the survey results, there were 12 female interviewees, with a survey rate of 27.9, and 30 male interviewees, with a survey rate of 69.1. The interviewees were all HSU students, and the average age was 19 to 22. According to the average value of each construct, all the average values were >3, which means all responses to the interactive artwork were positive. The descriptive statistics are shown in Table 3.

4.2. Analysis of Reliability

The analysis of reliability measures the consistency of the questionnaire constructs. That is, if a group of respondents is given the same questionnaire, this analyzes whether the results of multiple measurements are consistent. Taking the 5-point Likert approach as an example, when Cronbach’s α value <0.35, this indicates low reliability; a value between 0.35 and 0.70 means moderate reliability; and a value >0.7 indicates higher reliability. The analysis standard is reached if all constructs have a value of 0.7 or higher [48]. This research used SPSS to undertake the reliability analysis for each research component, and the results were: ‘Perceived Playfulness’ 0.907, ‘Perceived Ease of Use’ 0.875, ‘Perceived Usefulness’ 0.869, ‘Satisfaction’ 0.856, and ‘Intention’ 0.841. All the measured Cronbach α values were over 0.7, which means every research component of the questionnaire has an acceptable level of reliability.

4.3. Analysis of Validity

This research used Confirmatory Factor Analysis to examine validity, and applied Principle Component Analysis to recognize the differences between each construct. The method of examination was a varimax rotation of KMO, as well as the Barlett spherical test; after the testing, the KMO value was 0.676 and the Barlett spherical test value was 670.655, which meant that the questionnaire data was adequate for carrying out factor analysis. Each component eigenvalue would have to be at least 1 for the questions to be combined into a construct which can be classified as one factor. The higher the eigenvalue, the more reliable the results are. By means of ‘Principal Component Analysis’ and the ‘varimax rotation of KMO’, five factors were analyzed and had eigenvalues over 1.0; ‘Satisfaction’ was 2.694, ‘Perceived Playfulness’ was 3.239, ‘Perceived Usefulness’ was 3.073, ‘Perceived Ease of Use’ was 3.168, and ’Intention‘ was 2.866. As seen in Table 4, the axis of rotation and load values were over 1, and the total interpretation of variance was up to 75.196%, meaning that the results have a high validity.

4.4. Analysis of the Correlation Coefficient

Based on the construct values of the 42 questionnaires, we found the average value and carried out the analysis of the correlation coefficient by the Pearson’s correlation coefficient analysis method, in order to examine the relationships of each construct. A correlation coefficient value equal to 1 represents a total relationship, 0.7~0.99 indicates it is highly related, 0.4~0.69 indicates it is moderately related, 0.1~0.39 indicates it is somewhat related, 0.01~0.09 represents it is slightly related, and 0 means there is no relationship. As can be seen from Table 3 and Table 4, the values show how the factors are related to one another. The analysis results are shown in Table 5. According to the results, this research had eight hypotheses:
(1)
‘Perceived Playfulness’ and ‘Satisfaction’ are positively related; the eigenvalue is 0. 485 (**). Hypothesis 1 is valid.
(2)
‘Perceived Playfulness’ and ‘Intention’ are positively related; the eigenvalue is 0.334 (*). Hypothesis 2 is valid.
(3)
‘Perceived Ease of Use’ and ‘Perceived Playfulness’ are positively related; the eigenvalue is 0.514 (**). Hypothesis 3 is valid.
(4)
‘Perceived Ease of Use’ and ‘Perceived Usefulness’ are positively related; the eigenvalue is 0.185. Hypothesis 4 is not valid.
(5)
‘Perceived Ease of Use’ and ‘Satisfaction’ are positively related; the eigenvalue is 0.533 (**). Hypothesis 5 is valid.
(6)
‘Perceived Usefulness’ and ‘Satisfaction’ are positively related; the eigenvalue is 0.397 (**). Hypothesis 6 is valid.
(7)
‘Perceived Usefulness’ and ‘Intention’ are positively related; the eigenvalue is 0.269. Hypothesis 7 is not valid.
(8)
‘Satisfaction’ and ‘Intention’ are positively related; the eigenvalue is 0.310 (*). Hypothesis 8 is valid.
According to the SPSS correlation coefficient analysis results, and based on the ISO standards, the five constructs that are related match those proposed by experts on interactive artwork usability evaluation. The overall finding is that the users’ response to the artwork was positive. The relationships between each component are shown in Table 5.
As seen in Figure 9, the ‘perceived playfulness’ of the interactive art is moderately related to the ‘perceived ease of use’, and is slightly related to the ‘perceived usefulness’ of the library information services. The eigenvalue was 0.485** between ‘perceived playfulness’ and ‘satisfaction’, and 0.334 between ‘perceived playfulness’ and ‘intention’. This means the users were satisfied overall with the interactive artwork, and about 1/3 of the users would like to use the interactive artwork again. The eigenvalue of 0.533 between ‘perceived ease of use’ and ‘satisfaction’ means more than half of the users were satisfied with the interactive artwork in terms of its ease of use. The eigenvalue of 0.397 between ‘perceived usefulness’ and ‘satisfaction’ indicates that about 40% of the users were satisfied that the interactive artwork effectively presented library information. Finally, the eigenvalue of 0.31 between ‘satisfaction’ and ‘intention’ suggests that about 1/3 of the users were satisfied with the interactive artwork, and would like to use it again.

4.5. Analysis Strategy for Assessing the Model

This research used SEM to carry out the construct analysis. SEM is a powerful second-generation multivariate analysis technique that includes a measurement model and structural model. The measurement model is used to discover the latent variables based on the current variables. The structural model is used to examine the strength and direction of the relationships of the constructs [49]. SEM has been widely applied by IS researchers [50,51]. Additionally, this research also used AMOS software to examine the quantity value and factor structures.
Table 6 shows that the variables extracted by the constructs are greater than any squared correlation, which indicates that the constructs are empiricists and exist individually. This research is thus satisfied with the research models, including the convergent and discriminant validity. Consequently, all the measures used in this research show that the research model provides a good fit to the data.

5. Discussion

Based on related academic theories, in Section 3, we proposed a usability evaluation for an interactive artwork, in which the analysis of reliability and the analysis of validity met the standards of examination. In Table 3, the descriptive statistics analysis results indicate that the user responses to the interactive artwork were positive with respect to the aspects of ‘perceived playfulness’, ‘perceived ease of use’, ‘perceived usefulness’, ‘satisfaction’, and ‘intention’ (>3.5).
The research results confirm these hypotheses, and the perception of users, such as ‘perceived playfulness’, ‘perceived ease of use’, and ‘perceived usefulness’, can improve user intention in using the interactive artwork. As we expected at the beginning of the study, the proposed research Hypotheses 1 to 7 were verified.
Moreover, according to the results of the correlation coefficient analysis, we propose that the perceived ease of use is not related to the perceived usefulness, and the perceived usefulness is not related to intention. The other constructs are all positively related to one another, which means that this research model explains the construct correlation of the interactive artwork usability. As can be seen in Figure 9, the results show that perceived playfulness is closely linked to the factors of satisfaction and intention. This suggests that interaction can create entertainment, as the degree of satisfaction with the library information services should impact users’ intention to reuse this interactive artwork. Thus, in this case, interaction can create entertainment. In this way, this research model adequately explains the usability of the interactive artwork.
In recent years, digital art with interactive elements has been widely applied in museums and digital cultural theme exhibitions presented in certain culture centers. However, whether cross-field interactive art performances related to information services is accepted by users has not been well researched as yet. Based on TAM research results and related literature reviews, this research examined the usability evaluation of an interactive artwork, and further proposed perceived playfulness as a crucial factor construct of usability when considering the concept of user acceptance. In this research, only 42 valid questionnaires were obtained for statistical analysis, and we hope to obtain more questionnaires in the future so as to further explore the usability evaluation of this integration of information services into an interactive artwork.

6. Conclusions

Good innovative design comes from technological progress. Due to the continuous emergence of new interactive technology, digital art has achieved great performance in the past ten years. In the presentation of traditional art, the audience is only the information receiver of the art theme. As interaction is regarded as one of the digital creative media, digital art performances are beginning to emphasize user participation (including the user experience). Usability, or user acceptance, has become one of the important indicators for evaluating the success of digital art.
In this research, the innovation of digital art is combined with the educational application of the library information service. The data visualization was used to tie the pleasant of digital art dynamic images for the library information services. In addition, this research believes that visualize data sources applications should ensure acceptance of use. Therefore, we believe that a feasible usability evaluation framework is proposed for evaluating data visualization systems for information service is critical. This is also the value of digital art combined with cross-domain applications such as information services or education services.
The interactive artwork can fully make library information service data more intuitive, understandable, and more interesting with the interactive process. Users can understand which books are often borrowed from the data analysis, the frequency with which the specified book has been borrowed, and whether these books are related to the user’s interests. The interactive artwork can promote the library in becoming an interesting field for the lifelong learning of users, because they feel that the library can provide high-quality data services.
The statistical methods and analysis results implemented in the fourth section show that the research purpose was achieved; firstly, by verifying that the interactive art we provided for the library information service met the user’s acceptance; and secondly, by providing usability-verified models for cross-domain applications between digital art and data visualization. Therefore, we believe that the proposal of a feasible usability evaluation framework for evaluating data visualization systems for information services is critical. This is also the value of digital art combined with cross-domain applications such as information services or education services.
Usability evaluations of devices and performances are rarely carried out, as most interactive art is focused on the exhibition aspect, rather than being user centered. The user experience is hard to understand, as users’ emotional responses to art are internal and often private. Thus, this research took a cross-field approach that integrated library book borrowing data into an interactive device to create an interactive artwork; the users could use their own smartphone to engage with library book borrowing information through an interactive art performance of a library information visualization service. Furthermore, for this cross-fields interactive artwork application, this research proposed a usability evaluation analysis model based on user feedback data and statistical examination of the usability of the interactive artwork. Limited research has been published in this area, so this research represents a unique viewpoint.
The research future can be extended, and the focus on data analytics in the future will be heavily centered on analytical applications such machine learning and decision tree methods combined the organization’s information services, particularly in relation to human factors, information visualization, communication, and the presentation of data analytics results through the latest data mining technologies, such as interactive analytics, digital interfaces, data storytelling, and new algorithms and methods.

Author Contributions

Conceptualization, Y.-S.C.; formal analysis, Y.-S.C.; methodology, Y.-S.C.; writing—original draft, Y.-S.C. and K.-J.H.; writing—review & editing, Y.-S.C. and K.-J.H.; supervision, Y.-S.C.; software, Y.-S.C. and K.-J.H.; validation, K.-J.H.; visualization K.-J.H. All authors have read and agreed to the published version of the manuscript.

Funding

This research received no external funding.

Acknowledgments

Thanks go to Shih Hsin University library, and the project of teachers and students from Shih Hsin University and the team of University Social Responsibility.

Conflicts of Interest

The authors declare no conflict of interest.

Appendix A. Questionnaire Questions

Appendix A.1. Perceived Playfulness

  • I think that using interactive artwork is interesting in the library.
  • I think that the data visualization of this interactive artwork is interesting.
  • I think that the information service of this interactive artwork is interesting.
  • I think that the presentation of this interactive artwork is interesting.

Appendix A.2. Perceived Ease of Use

  • I think this interactive artwork is easy to operate.
  • I think this interactive artwork is easy to use.
  • I feel that this interactive artwork is easy to operate.
  • I can effectively operate this interactive artwork

Appendix A.3. Perceived Usefulness

  • The interactive artwork could help me understand the information service of the library.
  • The interactive artwork could provide the data visualization of the library.
  • The interactive artwork could help me more recognize the book borrowing information.
  • The interactive artwork could convey a positive communication of the information service of the library.

Appendix A.4. Satisfaction

  • I consider that functions in this interactive artwork are integrated well.
  • I would have a sense of satisfaction while using this interactive artwork.
  • I am satisfied with using the interactive artwork.
  • I am satisfied with using the information service of this interactive artwork.

Appendix A.5. Intention

  • I think I would like to use this interactive artwork again.
  • I would like to spend the time on the interactive artwork because the content of that really attract me.
  • I will recommend the interactive artwork to people.
  • Overall, I have a positive viewpoint of the interactive artwork.

References

  1. Christiane, P. Digital Art, 3rd ed.; Thames & Hudson Ltd.: London, UK, 2003; p. 36. [Google Scholar]
  2. Naisbitt, J. Megatrends: Ten New Directions Transforming Our Lives; Warner Books (Warner Communications Company): New York, NY, USA, 1982; ISBN 978-0-446-35681-7. [Google Scholar]
  3. Hassenzahl, M.; Tractinsky, N. User experience–A research agenda. Behav. Inf. Technol. 2006, 25, 91–97. [Google Scholar] [CrossRef]
  4. Brown, T. Design Thinking. Harv. Bus. Rev. 2008, 86, 84–92. [Google Scholar] [PubMed]
  5. Nielsen, J. Heuristic evaluation. In Usability Inspection Methods; Neilsen, J., Mack, R.L., Eds.; John Wiley & Sons: New York, NY, USA, 1994. [Google Scholar]
  6. Popper, F. From Technological to Virtual Art; MIT Press: Cambridge, MA, USA; London, UK, 2007. [Google Scholar]
  7. Bilda, Z.; Bowman, C.; Edmonds, E. Experience evaluation of interactive art: Study of GEO landscapes. In Proceedings of the 5th Australasian Conference on Interactive Entertainment, Brisbane, Queensland, Australia, 3–4 December 2008. [Google Scholar]
  8. Kim, K.N.; Kim, T. Utilization of material-focused paintings in interactive art through the analysis of immersive elements. Digit. Creat. 2012, 23, 278–290. [Google Scholar] [CrossRef]
  9. Heinrich, F. Investigating Interactive Beauty—A research-art installation. Leonardo Electron. Alm. 2012, 18, 1174–1179. Available online: https://vbn.aau.dk/en/publications/investigating-interactive-beauty-a-research-art-installation (accessed on 12 January 2020).
  10. Rokeby, D. Critical Issues in Electronic Media. In Transforming Mirrors: Subjectivity and Control in Interactive Media; Simon, P., Ed.; State University of New York Press: New York, NY, USA, 1995; pp. 133–158. [Google Scholar]
  11. Sims, R. Interactivity: A forgotten art? Comput. Hum. Behav. 1997, 13, 157–180. [Google Scholar] [CrossRef]
  12. Ascott, R. Reframing Consciousness: Art, Mind and Technology; Intellect: Exeter, UK, 1999. [Google Scholar]
  13. Rogala, M. Toward a theory of interactive art experience. In Proceedings of the 3rd International symposium of interactive media design, Istanbul, Turkey, 5–7 January 2005. [Google Scholar]
  14. Dezeuze, A. The‘Do-it-Yourself’ Artwork: Participation from Fluxus to New Media; Manchester University Press: Manchester, UK; New York, NY, USA, 2010. [Google Scholar]
  15. Knickmeyer, R.L.; Mateas, M. Preliminary Evaluation of the Interactive Drama Facade. In CHI’05 Extended Abstracts on Human Factors in Computing Systems, April, 2005; Association for Computing Machinery: New York, NY, USA, 2005; pp. 1549–1552. [Google Scholar]
  16. Edmonds, E.; Everitt, D.; Macaulay, M.; Turner, G. On physiological computing with an application in interactive art. Interact. Comput. 2004, 16, 897–915. [Google Scholar] [CrossRef]
  17. Chang, Y.S.; Hu, Y.J.; Chen, H.W. Learning Performance Assessment for Culture Environment Learning and Custom Experience with an AR Navigation System. Sustainability 2019, 11, 4759. [Google Scholar] [CrossRef] [Green Version]
  18. Gkioulekas, P.; Polydoratou, P. Information visualisation and library data: A case study of Public Library of Veria, Greece. In Proceedings of the ELPUB 2019 23rd edition of the International Conference on Electronic Publishing, Marseille, France, 2–4 June 2019. [Google Scholar]
  19. Koltay, T. Facing the Challenge of Data-Intensive Research: Research Data Services and Data Literacy in Academic Libraries; Emerald Group Publishing: Bingley, West, Yorkshire, UK, 2016; pp. 45–61. [Google Scholar] [CrossRef]
  20. Wójcik, M. How to design innovative information services at the library? Libr. Hi Tech 2019, 37, 138–154. [Google Scholar] [CrossRef]
  21. Card, S.; Mackinlay, J.; Shneiderman, B. Readings in Information Visualization: Using Vision to Think; Morgan Kaufmann: San Francisco, CA, USA, 1999. [Google Scholar]
  22. Her, J.J. Ambient Interaction: Case Studies of Interactive Artworks in Public Space. Int. J. Digit. Media Des. 2013, 5, 23–32. [Google Scholar]
  23. Kwon, M. One Place After Another: Site-Specific Art and Locational Identity; MIT Press: Cambridge, MA, USA; London, UK, 2004. [Google Scholar]
  24. ISO/IEC. 9241-14 Ergonomic Requirements for Office Work with Visual Display Terminals (VDT)s–Part 14 Menu Dialogues, ISO/IEC9241-14: 1998 (E); International Organization for Standardization: Geneva, Switzerland, 1998. [Google Scholar]
  25. ISO/IEC. 13407 Human-Centred Design Processes for Interactive Systems, ISO/IEC 13407; International Organization for Standardization: Geneva, Switzerland, 1999. [Google Scholar]
  26. Jokela, T.; Iivari, N.; Matero, J.; Virkkula, M. The standard of user-centered design and the standard definition of usability: Analyzing ISO 13407 against ISO 9241-11. ACM Int. Conf. Proceeding Ser. 2003, 46, 53–60. [Google Scholar]
  27. Fishbein, M. Attitude and the prediction of behavior. In Readings in Attitude Theory and Measurement; Fishbein, M., Ed.; John Wiley: New York, NY, USA, 1967; pp. 477–492. [Google Scholar]
  28. Fishbein, M.; Ajzen, I. Belief, Attitude, Intention and Behavior. An Introduction to Theory and Research; Addison-Wesley Publishing Company: Reading, MA, USA, 1975. [Google Scholar]
  29. Davis, F.D. A Technology Acceptance Model for Empirically Testing New End-User Information Systems: Theory and Results; Sloan School of Management, Massachusetts Institute of Technology: Boston, MA, USA, 1986. [Google Scholar]
  30. Venkatesh, V.; Davis, F. A Theoretical Extension of the Technology Acceptance Model: Four Longitudinal Field Studies. Manag. Sci. 2000, 46, 186–204. [Google Scholar] [CrossRef] [Green Version]
  31. Wetzlinger, W.; Auinger, A.; Dörflinger, M. Comparing Effectiveness, Efficiency, Ease of Use, Usability and User Experience When Using Tablets and Laptops. Lect. Notes Comput. Sci. 2014, 8517, 402–412. [Google Scholar] [CrossRef]
  32. Brooke, J. SUS–A quick and dirty usability scale. In Usability Evaluation in Industry; Jordan, P.W., Thomas, B., Weerdmeester, B.A., McClelland, A.L., Eds.; Taylor and Francis: London, UK, 1996; pp. 189–194. [Google Scholar]
  33. Bangor, A.; Kortum, P.T.; Miller, J.T. An Empirical Evaluation of the System Usability Scale. Int. J. Hum. Comput. Interact. 2008, 24, 574–594. [Google Scholar] [CrossRef]
  34. Lewis, J.R.; Sauro, J. The Factor Structure of the System Usability Scale. In Human Centered Design; Hutchison, D., Kanade, T., Kittler, J., Kleinberg, J.M., Mattern, F., Mitchell, J.C., Naor, M., Nierstrasz, O., Pandu Rangan, C., Steffen, B., et al., Eds.; Springer: Berlin/Heidelberg, Germany, 2009; pp. 94–103. [Google Scholar]
  35. Moon, J.; Kim, Y. Extending the TAM for a world-wide-web context. Inf. Manag. 2001, 38, 217–230. [Google Scholar] [CrossRef]
  36. Hsu, C.L.; Lu, H.P. Why do people play on-line game? An extend TAM with social influences and flow experience. Inf. Manag. 2004, 41, 853–868. [Google Scholar] [CrossRef]
  37. Davis, F.; Bagozzi, R.P.; Warshaw, P.R. Extrinsic and Intrinsic Motivation to Use Computers in the Workplace. J. Appl. Soc. Psychol. 1992, 22, 1111–1132. [Google Scholar] [CrossRef]
  38. Deci, E.; Ryan, R. Accessibility and stability of predictors in the theory of planned behavior. J. Personal. Soc. Psychol. 1987, 63, 754–765. [Google Scholar]
  39. Vellerand, R. Toward a hierarchy model of intrinsic and extrinsic motivation. Adv. Exp. Soc. Psychol. 1997, 29, 271–360. [Google Scholar]
  40. Teo, T.; Lim, V.; Lai, R. Intrinsic and extrinsic motivation in Internet usage. Omega Int. J. Manag. Sci. 1999, 27, 25–37. [Google Scholar] [CrossRef]
  41. Chen, L.; Gillenson, M.; Sherrell, D. Enticing on-line consumers: An extended technology acceptance perspective. Inf. Manag. 2002, 39, 705–719. [Google Scholar] [CrossRef]
  42. Chang, Y.S. The Effect Assessment of Reading Experience and Use Intention for AR Interactive Device. EURASIA J. Math. Sci. Technol. Educ. 2018, 14, 531–542. [Google Scholar] [CrossRef]
  43. Chang, Y.S.; Wang, C.C. Why Are Players Being Immersed in Online Game? A Study on the Game’s Creating Value of Emotion for Players. Int. J. Digit. Media Des. 2012, 4, 49–67. [Google Scholar]
  44. Hsu, C.L.; Lin, J.C. Acceptance of Blog Usage: The Roles of Technology Acceptance, Social Influence and Knowledge Sharing Motivation. Inf. Manag. 2008, 45, 65–74. [Google Scholar] [CrossRef]
  45. Mathieson, K.; Chin, W. Extending the technology acceptance model: The influence of perceived user resources. Data Base Adv. Inf. Syst. 2001, 32, 86–112. [Google Scholar] [CrossRef]
  46. Lin, C.C.; Lu, H.P. Internet Ethics: An Empirical Study of Students’ Online Ethical Perception. Soochow J. Econ. Bus. 2004, 46, 87–102. [Google Scholar]
  47. Chang, Y.S.; Hu, K.J.; Chiang, C.W.; Lugmayr, A. Applying Mobile Augmented Reality (AR) to Teach Interior Design Students in Layout Plans: Evaluation of Learning Effectiveness Based on the ARCS Model of Learning Motivation Theory. Sensors 2019, 20, 105. [Google Scholar] [CrossRef] [PubMed] [Green Version]
  48. Cronbach, L.J. Coefficient alpha and the internal structure of tests. Psychometrika 1951, 16, 297–334. [Google Scholar] [CrossRef] [Green Version]
  49. Hsu, C.L.; Lu, H.P. Consumer behavior in online game communities: A motivational factor perspective. Comput. Hum. Behav. 2007, 23, 1642–1659. [Google Scholar] [CrossRef]
  50. Chau, P.Y.K.; Hu, H.P. Investigating healthcare professionals’ decisions to accept telemedicine technology: An empirical test of competing theories. Inf. Manag. 2002, 39, 297–311. [Google Scholar] [CrossRef]
  51. Lee, G.G.; Pai, J.-C. Effects of organizational context and inter-group behavior on the success of strategic information systems planning: An empirical study. Behav. Inf. Technol. 2003, 22, 263–280. [Google Scholar] [CrossRef]
Figure 1. Design idea for this research interactive art.
Applsci 10 07499 g001
Figure 2. The procedure for client connecting server.
Applsci 10 07499 g002
Figure 3. The procedure for server model.
Applsci 10 07499 g003
Figure 4. The system architecture of this interactive art.
Applsci 10 07499 g004
Figure 5. The UI design of the client app.
Applsci 10 07499 g005
Figure 6. (a) Exhibit site 1 and (b) Exhibit site 2 of the interactive art exhibition at Shih Hsin University library.
Applsci 10 07499 g006
Figure 7. (a) Book title and number of loans per book visualization in the smart phone’s gyroscope. (b) Service data for the number of books loaned by the library information visualization.
Applsci 10 07499 g007
Figure 8. The research model.
Applsci 10 07499 g008
Figure 9. Results of the correlation analysis.
Applsci 10 07499 g009
Table 1. Usability scale questionnaire.
System Usability ScaleStrongly Agree  Strongly Disagree
12345
1 I think I would like to use this product again.
2 I think this product is not easy to operate.
3 I think this product is easy to use.
4 I need Tech Support that can help me to use this product.
5 I consider that functions in this product are integrated well.
6 I feel that there is too much inconsistency in this product.
7 I think that most people get to know how to use this product quickly.
8 I feel that this product is difficult to operate.
9 I would have a sense of confidence while using this product.
10 I need to learn a lot before I can effectively operate this product
Table 2. The construction of the questionnaire and reference resource.
ConstructionExplanation of the ConstructionRelated LiteratureMethod of MeasurementQuestion Number
Perceived PlayfulnessThe user is entertained during the interactive process.[35,36,37,38,39,40]5-point Likert scale4
Perceived Ease of UseHow difficult or easy it is to use the interactive system.[30,31,32,36,44,45]5-point Likert scale4
Perceived usefulnessThe user obtained sufficient information through their interaction with the interactive device.[30,31,32,36,37,43]5-point Likert scale4
SatisfactionThe user is satisfied while using the interactive artwork.[17,31,32,44,47]5-point Likert scale4
IntentionThe degree of the user’s willingness of return to reuse the interactive art system.[31,32,43]5-point Likert scale4
Personal InformationThe user’s personal informationResearch designOrdinal Scale7
Total 27
Table 3. Descriptive statistics for the constructs.
ConstructionsIndividualMeanStandard DeviationVariance
Perceived Playfulness424.55950.493280.243
Perceived Ease of Use424.35710.491210.241
Perceived Usefulness424.50600.446830.200
Satisfaction424.35120.452160.204
Intention424.20830.357480.128
Effective Sample Size N (Excluded)42
Table 4. Total interpretation of variance.
FactorsInitial EigenvalueAxis of Rotation and Load
EigenvalueVariable %Total %EigenvalueVariable %Total %
Perceived Playfulness 7.37436.87136.8713.23916.19316.193
Perceived Ease of Use 2.61213.06149.9323.16815.84032.033
Perceived Usefulness2.20811.04260.9753.07315.36347.396
Intention1.6368.18169.1562.86614.33061.726
Satisfaction1.2086.04075.1962.69413.47075.196
Table 5. The correlation analysis.
Perceived PlayfulnessPerceived Ease of UsePerceived UsefulnessSatisfactionIntention
Perceived Playfulness10.514 (**)0.399 (**)0.485 (**)0.334 (*)
Perceived Ease of Use0.514 (**)10.1850.533 (**)0.234
Perceived Usefulness0.399 (**)0.18510.397 (**)0.269
Satisfaction0.485 (**)0.533 (**)0.397 (**)10.310 (*)
Intention0.334 (*)0.2340.2690.310 (*)1
* p < 0.05, ** p < 0.01.
Table 6. Discriminant validity.
Perceived Playfulness Perceived Ease of Use Perceived Usefulness Satisfaction Intention
Perceived Playfulness 0.843
Perceived Ease of Use 0.566 0.800
Perceived Usefulness 0.422 0.203 0.794
Satisfaction 0.598 0.658 0.416 0.769
Intention 0.458 0.232 0.382 0.461 0.755
Publisher’s Note: MDPI stays neutral with regard to jurisdictional claims in published maps and institutional affiliations.

