1. Introduction
The evolution of telecommunications has enabled operators to offer services increasingly adapted to users’ needs, such as the possibility of voice and video communications, with a major concern regarding the Quality of Service (QoS) they provide to customers [
1]. Despite the constant evolution of technologies towards the Fifth Generation (5G) of telecommunications, the Fourth Generation (4G) is only expected to reach its peak in 2022, being subsequently replaced by 5G [
2].
To ensure QoS, operators initially plan their networks and analyse the signal coverage for a given geographical area, which can be validated by carrying out Drive Tests (DTs). One of the major drawbacks of DTs is the expensive way in which DT campaigns are carried out, since they are time-consuming, costly, and, after all, they only depict the network status at the time they were performed. Despite these disadvantages, the information collected by DTs is very valuable as it allows for detecting regions where the signal received power level is lower than expected, therefore allowing us to optimise network planning [
3].
There are many tools to assist operators in network planning; however, the starting point is always the signal coverage, which can be estimated using appropriate propagation models and tools. For example, a propagation model that uses terrain morphology data, network Key Performance Indicators (KPIs), and other data, has been implemented using AWS [
4] services, which can be found in a network management tool called
Metric [
5], developed by Multivision [
6]. The referred model, named Automatically Calibrated Standard Propagation Model (ACSPM) is technology agnostic and can be used in any existing technology, such as third generation or 4G. The description of all details involved in the estimation of the ACSPM signal, as well as its implementation, are discussed in [
7], where it is also possible to find validation metrics for the model. The implementation of this model was a base for new cellular planning algorithms, such as the estimation of neighbouring cells [
8], which allows not only frequency planning [
9], but also Scrambling Code (SC) planning for Universal Mobile Telecommunications System networks (UMTS) networks [
10].
This ACSPM model was initially designed and implemented for Single Input Single Output (SISO) communication systems, which are now changing to Multiple Input Multiple Output (MIMO) systems due to the increase in required user’s data rate and QoS [
11]. The concept of MIMO in this research is related to spacial diversity, as multiple antennas are used in order to improve the quality of the transmission link and thus offer a better QoS to the user [
12,
13]. If this system changeover is key to improve the QoS it is therefore essential to know the impact on signal propagation when moving to the MIMO system and how it can be appropriately foreseen by the propagation model used.
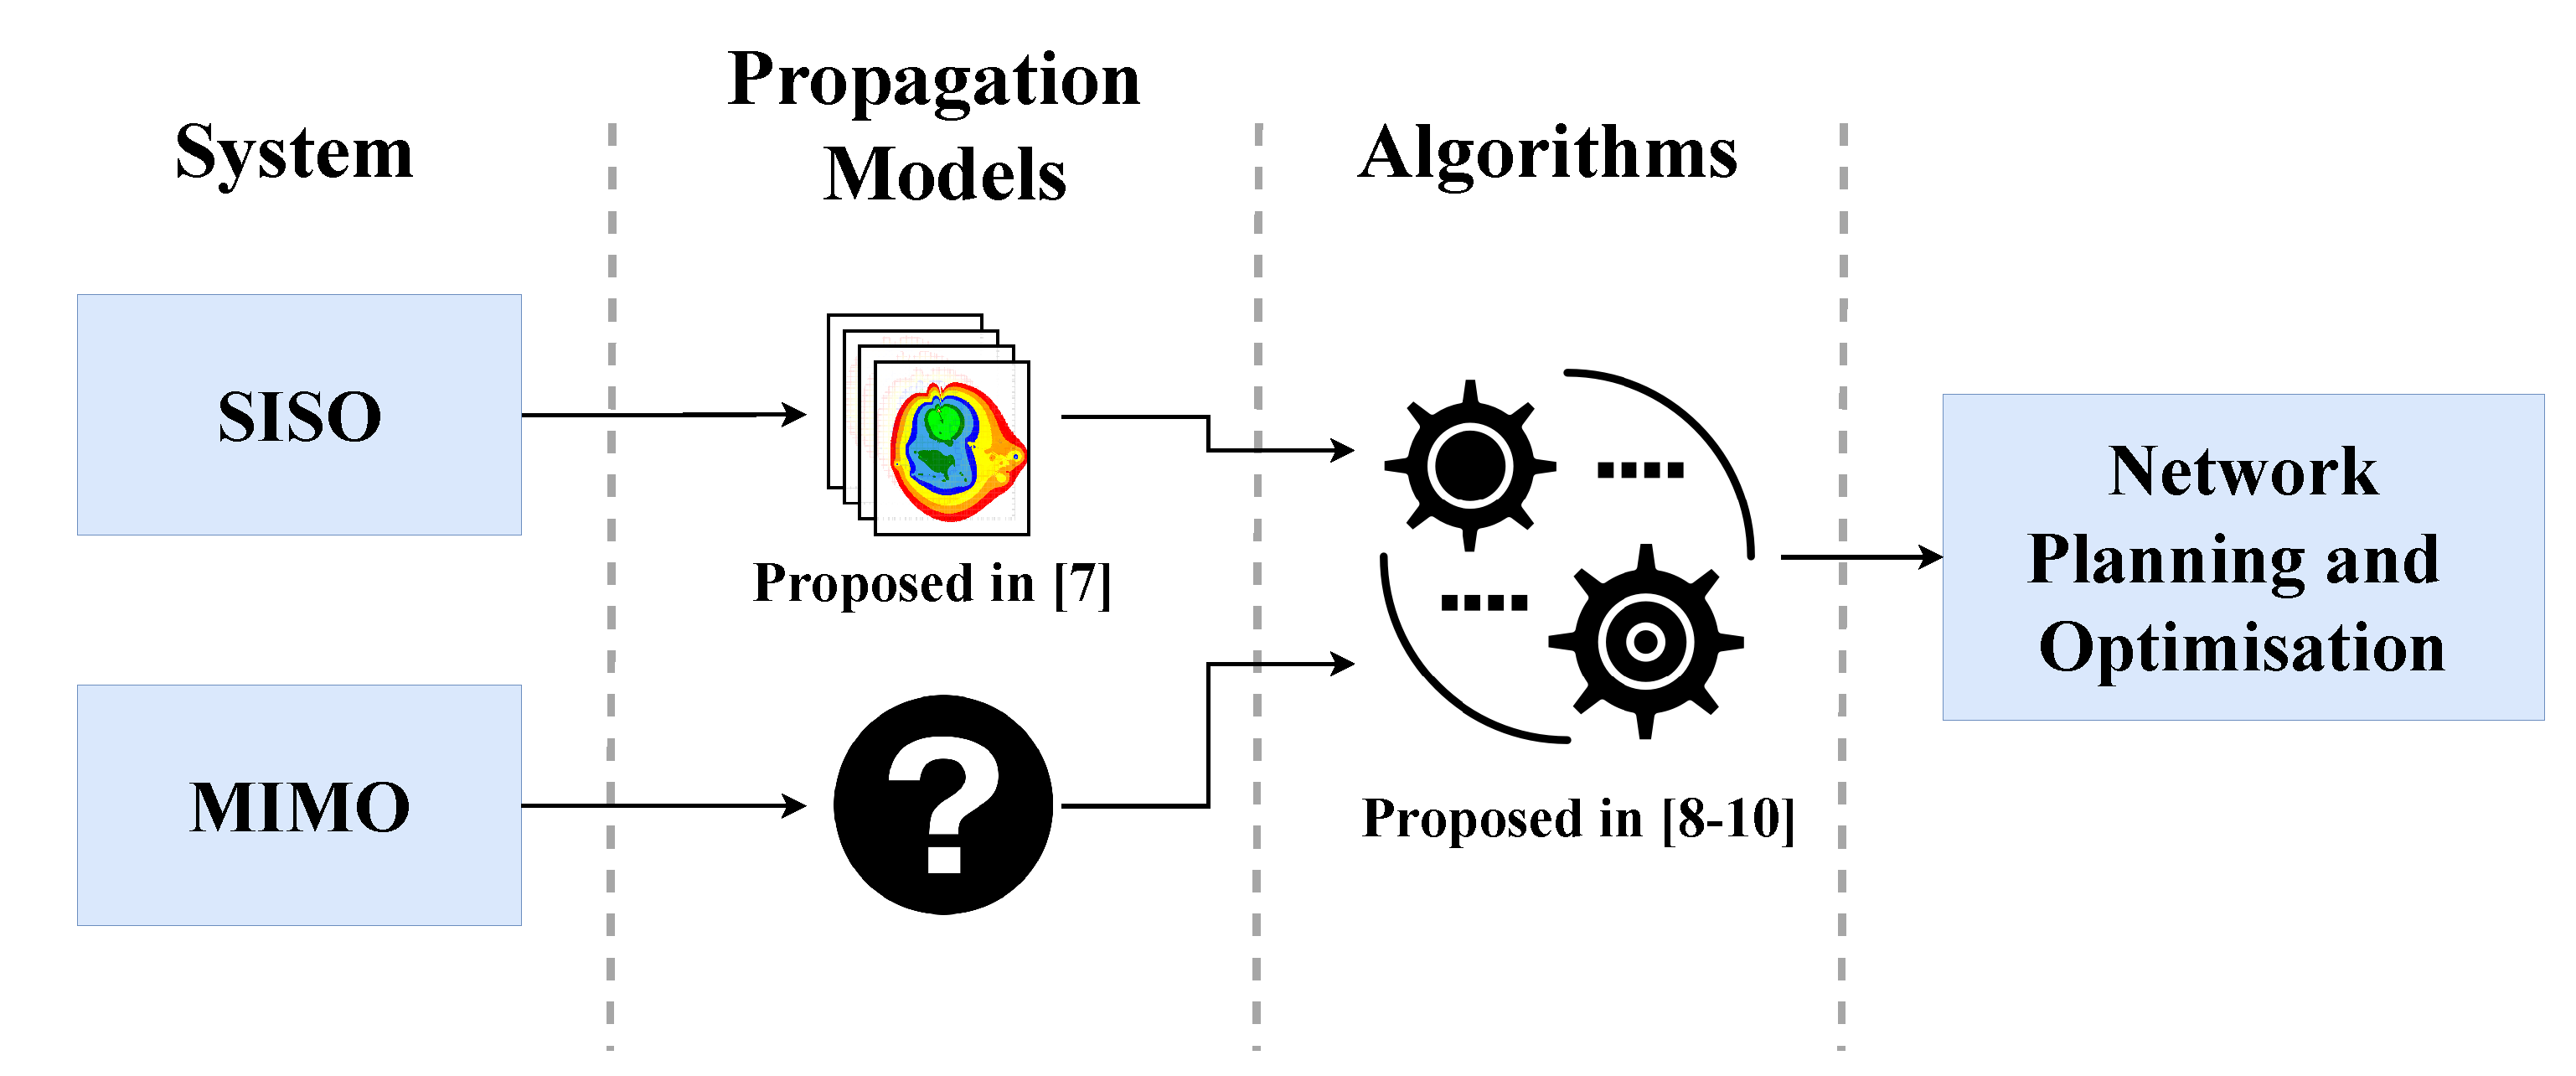
Operator’s DT campaigns using MIMO systems are still very limited and they only depict specific scenarios (e.g., two transmitting antennas and two receiving antennas), while DT campaigns for SISO systems are more widely available. The motivation for this study lies in the possibility of using these SISO DT campaigns, so as they can be used with propagation models for MIMO systems, which immediately brings a great cost advantage. The use of this methodology enables a simple estimation of coverage for a MIMO system, allowing for the application of algorithms for network planning and optimisation. In
Figure 1, the motivation for this study is depicted.
In this paper, the authors present a theoretical methodology, with some simulation results, that allows us to verify the impact of the Bit Error Rate (BER) performance when changing from a SISO system to a MIMO system, which can also be used to estimate the received power level with the MIMO system in a given area.
This paper considers the use of MIMO systems with Single-Carrier and Frequency-Domain Equalization (SC-FDE) in order to allow, not only an efficient power amplification at the Mobile Terminal (MT), but also a reduction in envelope fluctuations when compared with Orthogonal Frequency Division Multiplexing (OFDM) [
14,
15,
16,
17]. In addition, when using SC-FDE, there is also a performance improvement when we use iterative Frequency-Domain Equalization (FDE), such as Iterative Block Decision Feedback Equalization (IB-DFE), instead of linear FDE, as is done in this research work [
18].
The characterisation of the system considered in this study is presented in
Section 2 and the BER performance of the SISO systems is theoretically calculated in
Section 3.
Section 4 presents the results obtained through the BER performance simulation for both SISO and MIMO systems, allowing us to evaluate the impact when switching from SISO to MIMO scenarios. The model is then used with a real SISO scenario, described in
Section 5 to evaluate how it would behave in a MIMO scenario. This paper ends with
Section 6 where the main conclusions are drawn.
The following denotation is employed in this paper: In general, the upper-case letters denote frequency-domain variables, while lower case letters denote time-domain variable. Bold upper letters represent matrices or vectors and the Hermitian matrix of is denoted by . The expectation of x is represented by and , , , denotes samples—respectively, “soft decision” and “hard decision” estimation of x.
2. System Characterisation
The scenario considered in this paper is a point-to-point connection in a SISO system with a highly frequency selective channel.
The system is modelled assuming a data block, of size
N, transmitted in the frequency-domain and expresses as
, which is the Discrete Fourier Transform (DFT) of the time-domain as a data block
, where data symbols
are selected according to the Quadrature Phase-Shift keying (QPSK) rule with Gray mapping. The received signal in the frequency-domain is denoted as
whose Inverse Discrete Fourier Transform (IDFT) corresponds to
samples in the time-domain. The received signal can also be expressed by Equation (
1):
where the frequency-domain block of the transmitted block
is represented by
, the
and
represent the channel noise and the channel for the
subcarrier, respectively.
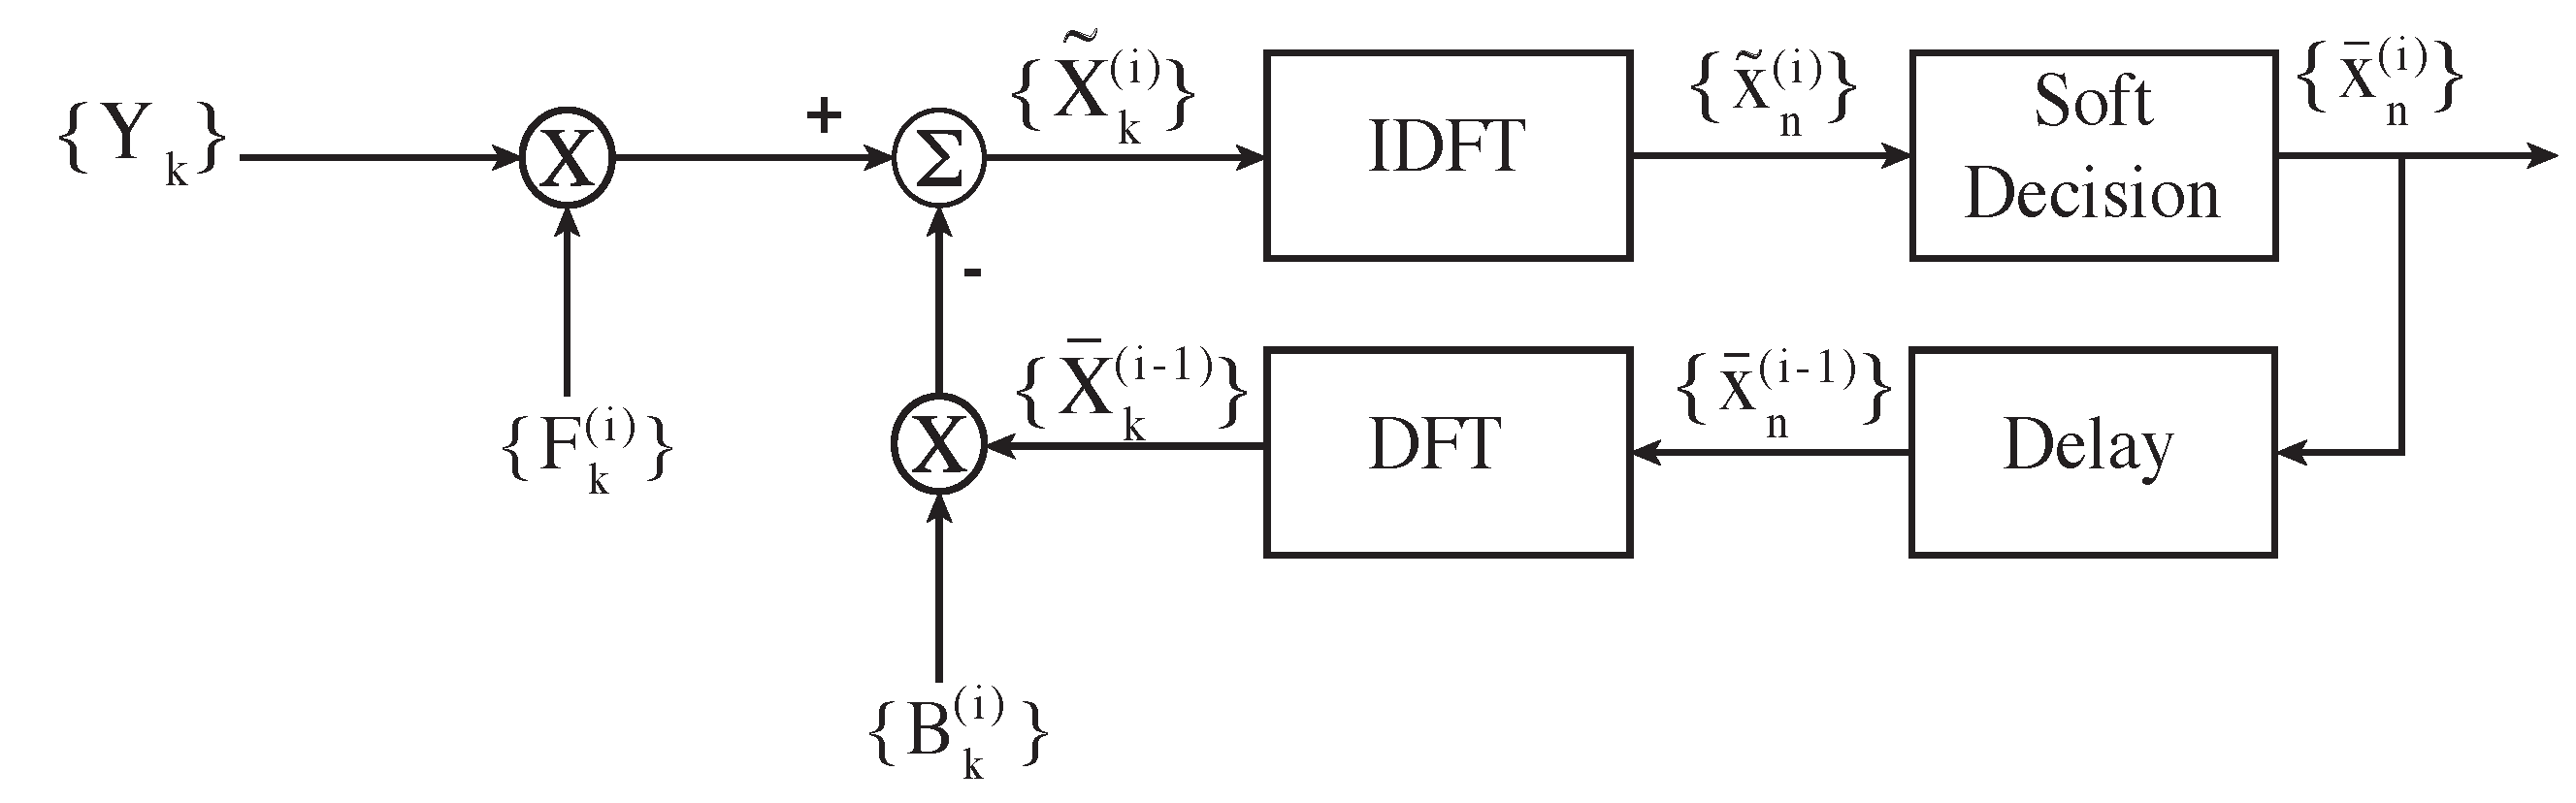
The iterative FDE receiver considered is the Iterative Block Decision Feedback Equalization (IB-DFE) [
19] presented in
Figure 2. This IB-DFE receiver has two filters the feedforward filter,
, which equalises the channel, and the feedback filter,
, which is responsible for removing the Inter-Symbol Interference (ISI), using the previous iteration values.
For the
iteration and
subcarrier, the estimated signal,
, is given by:
which, for the first iteration, can be simplified to
The “soft decision” of the previous iteration is expressed by
, which is the DFT of the time-domain block
, whose average value, according to [
20], is given by:
where
and
Coefficients
and
are chosen so as to minimise the Mean Square Error (MSE) and, consequently, to minimise the BER. They can be given by [
21,
22]:
where
represents the correlation coefficient and is defined by:
Considering QPSK modulation,
can be approximately given by:
where
and
3. Theoretical BER Performance
As previously mentioned, coefficients
and
are chosen so as to minimise the MSE and BER. For a SISO system, these coefficients can be expressed by Equations (
8) and (
9), respectively.
The BER performance for a QPSK constellation is given by:
where
denotes the Gaussian error function and
From Equation (
15),
depicts the MSE which can be calculated by Equation (
16):
As
can be given by:
where
denotes "hard decision" and is expressed by:
Therefore, Equation (
17) can be written as:
Knowing the expression for
, Equation (
16) can be expanded as:
Since
, after some mathematical manipulation, Equation (
20) can be rewritten as:
Equation (
21) can be simplified to:
By using Equations (
14) and (
25) it is then possible to evaluate the BER performance of a SISO system. When considering a MIMO system, Equation (
25) should be replaced by Equation (
26). Equation (
26) is fully derived and explained in [
23], where the BER performance of receivers that can be used in MIMO systems are analysed and compared. Each element depends on both the user and the subcarrier and this increases the complexity, since, in MIMO systems, it is necessary to work with matrices. Therefore, in this expression, the elements
and
are matrices for each subcarrier. The matrix
equalises the channel and the matrix
is responsible for removing the ISI, using the previous iteration values, as explain in
Section 2 for an SISO system. Just for simplicity, user and subcarrier dependency have been dropped out, with the exception for the
factor.
4. Simulation Results
To obtain theoretical values of BER performance as a function of achieved by SISO and MIMO systems, simulation was used. The simulation parameters considered were 100 blocks with 256 transmitted data symbols (), and a duration of 4 microseconds. As usual, is the relation between the average bit energy for the receiving antenna, , and the unilateral power spectral density of the Additive White Gaussian Noise (AWGN) channel noise, . In both SISO and MIMO scenarios, the number of active users was always 1. The number of receiving antennas in that user varied from the SISO scenario to the MIMO scenario.
In terms of simulation parameters, it is considered a MIMO scenario where the different pairs of antennas are uncorrelated and there is Rayleigh fading in the different multipath components. It is also important to point out that the average power is uncorrelated. We consider linear amplification and a perfect channel synchronisation and estimation.
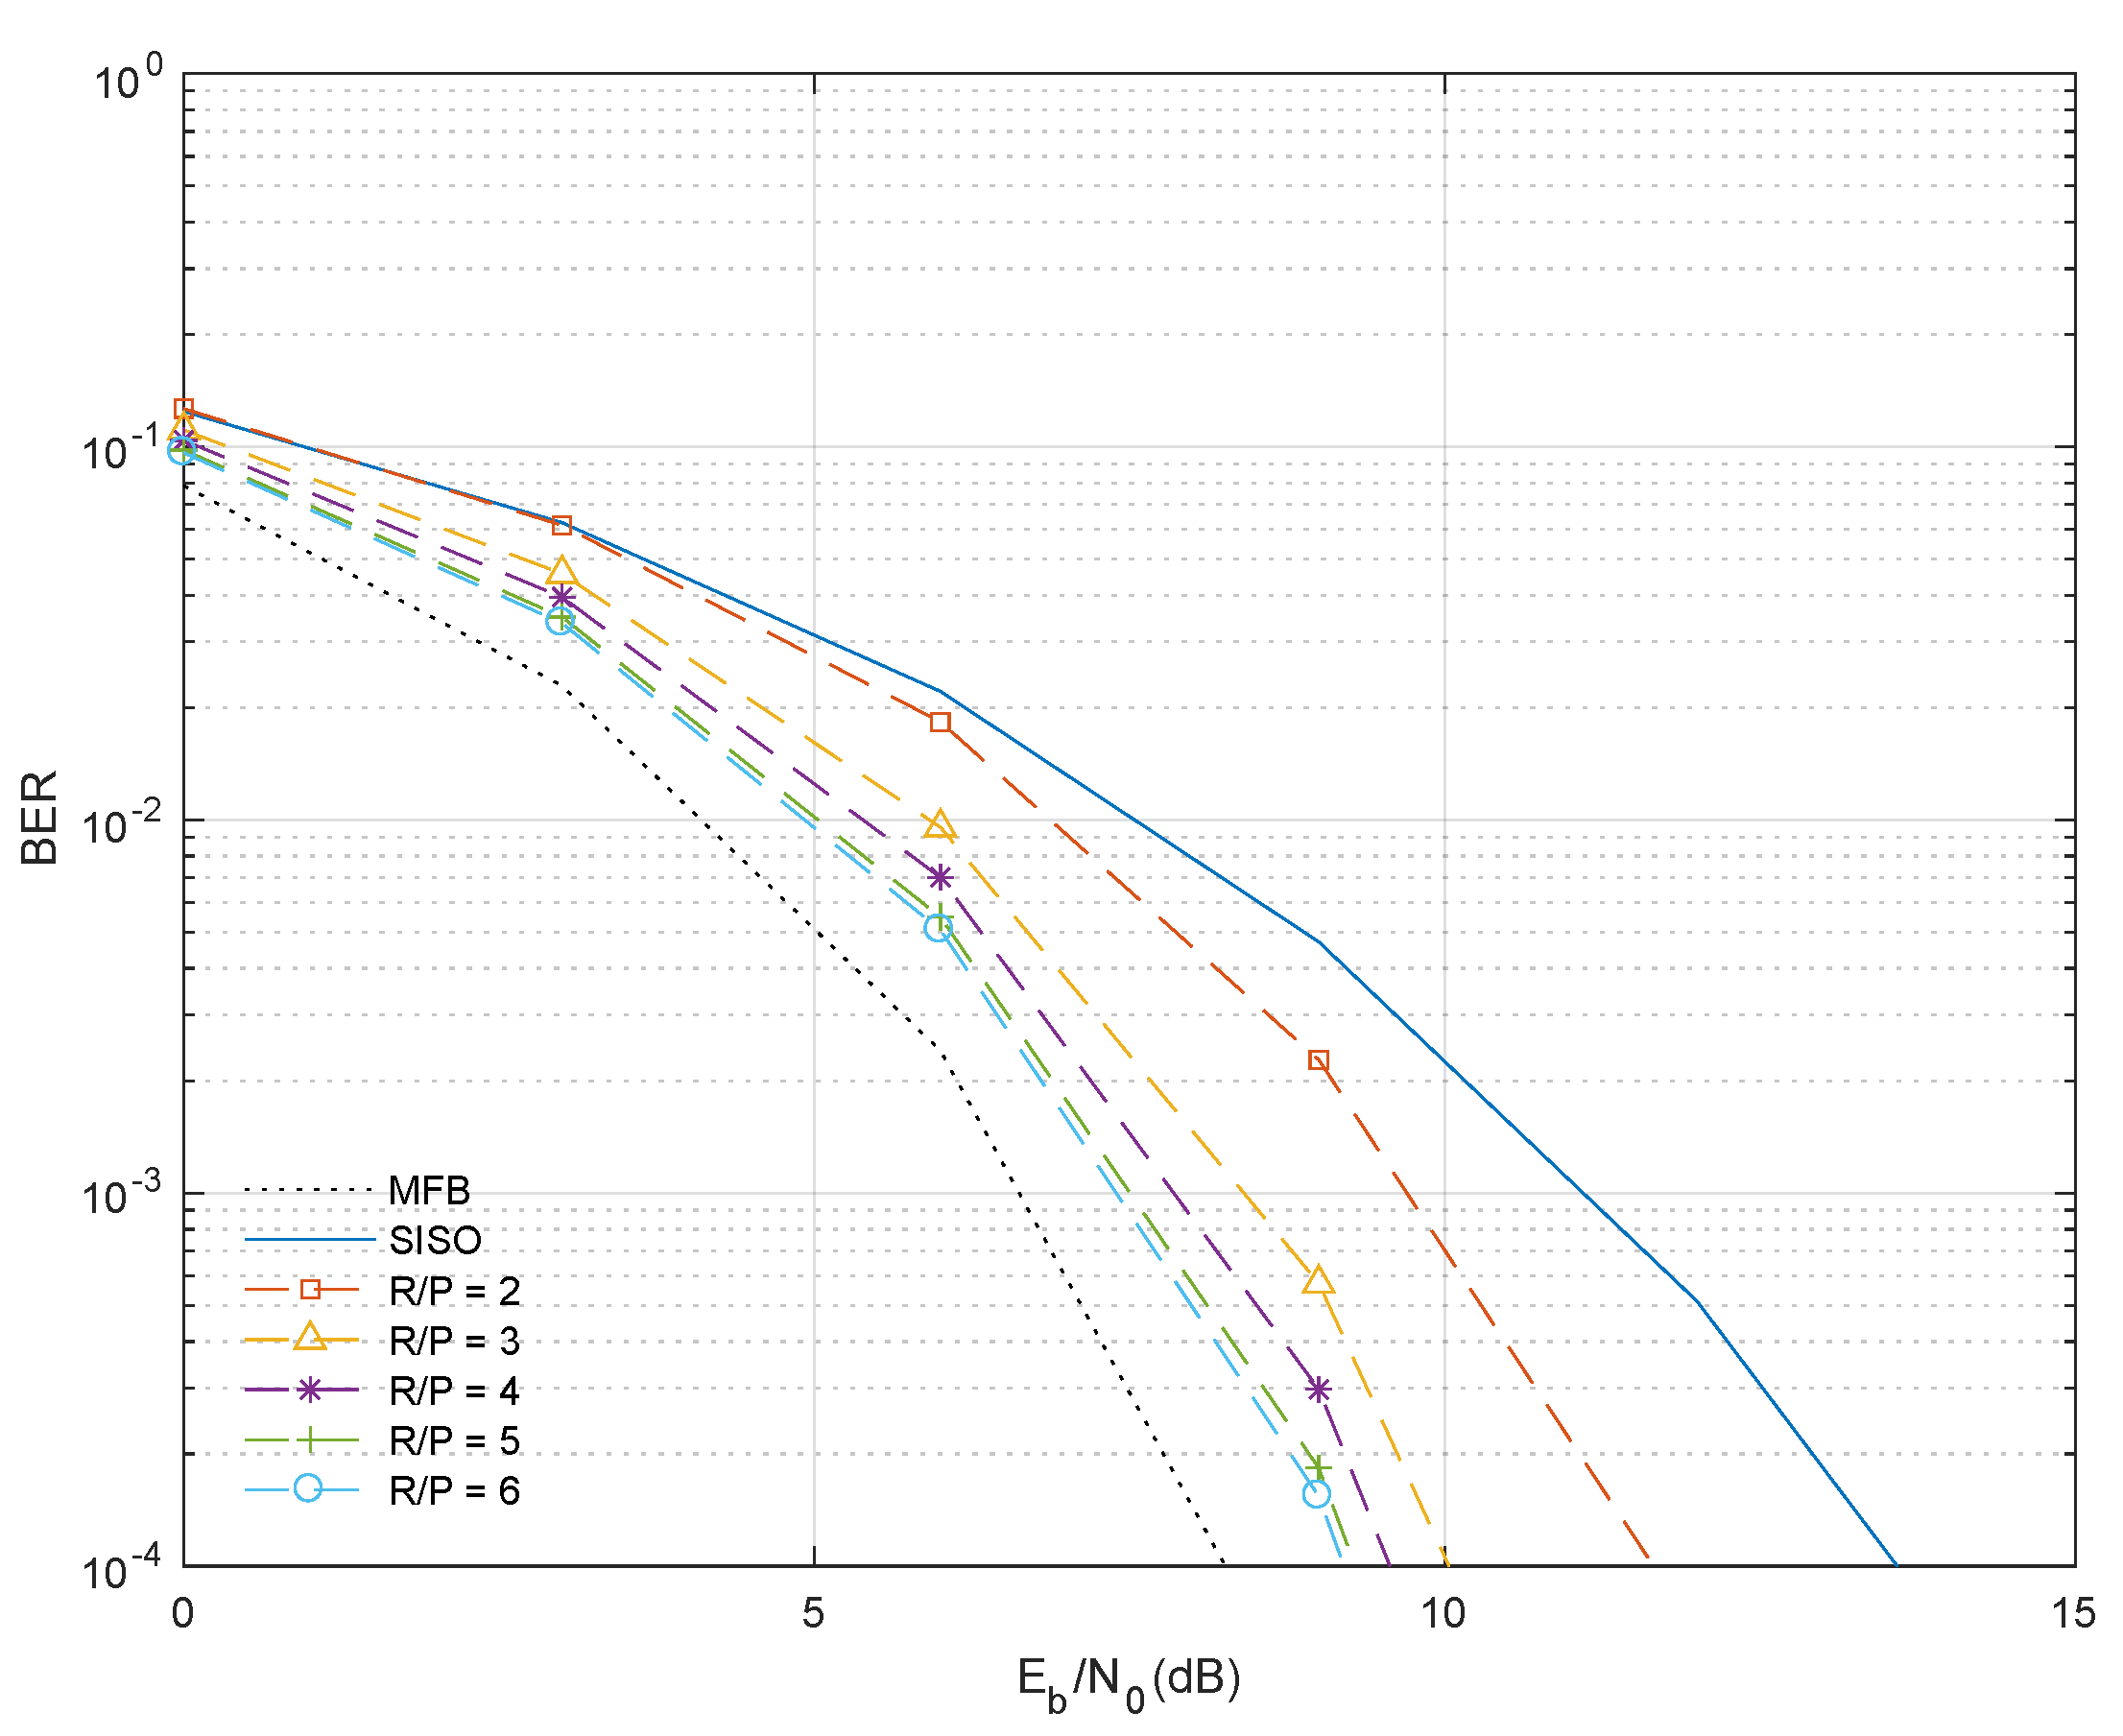
The theoretical values for the BER performance achieved by this procedure clearly show us the advantage of using previous DTs in a SISO system to infer the performance of a MIMO system. The obtained results (depicted in
Figure 3, and only the first iteration of IB-DFE was considered) show that the greater the ratio between transmitting antennas (P) and receiving antennas (R) the higher the BER performance achieved, as it is supposed in a MIMO system.
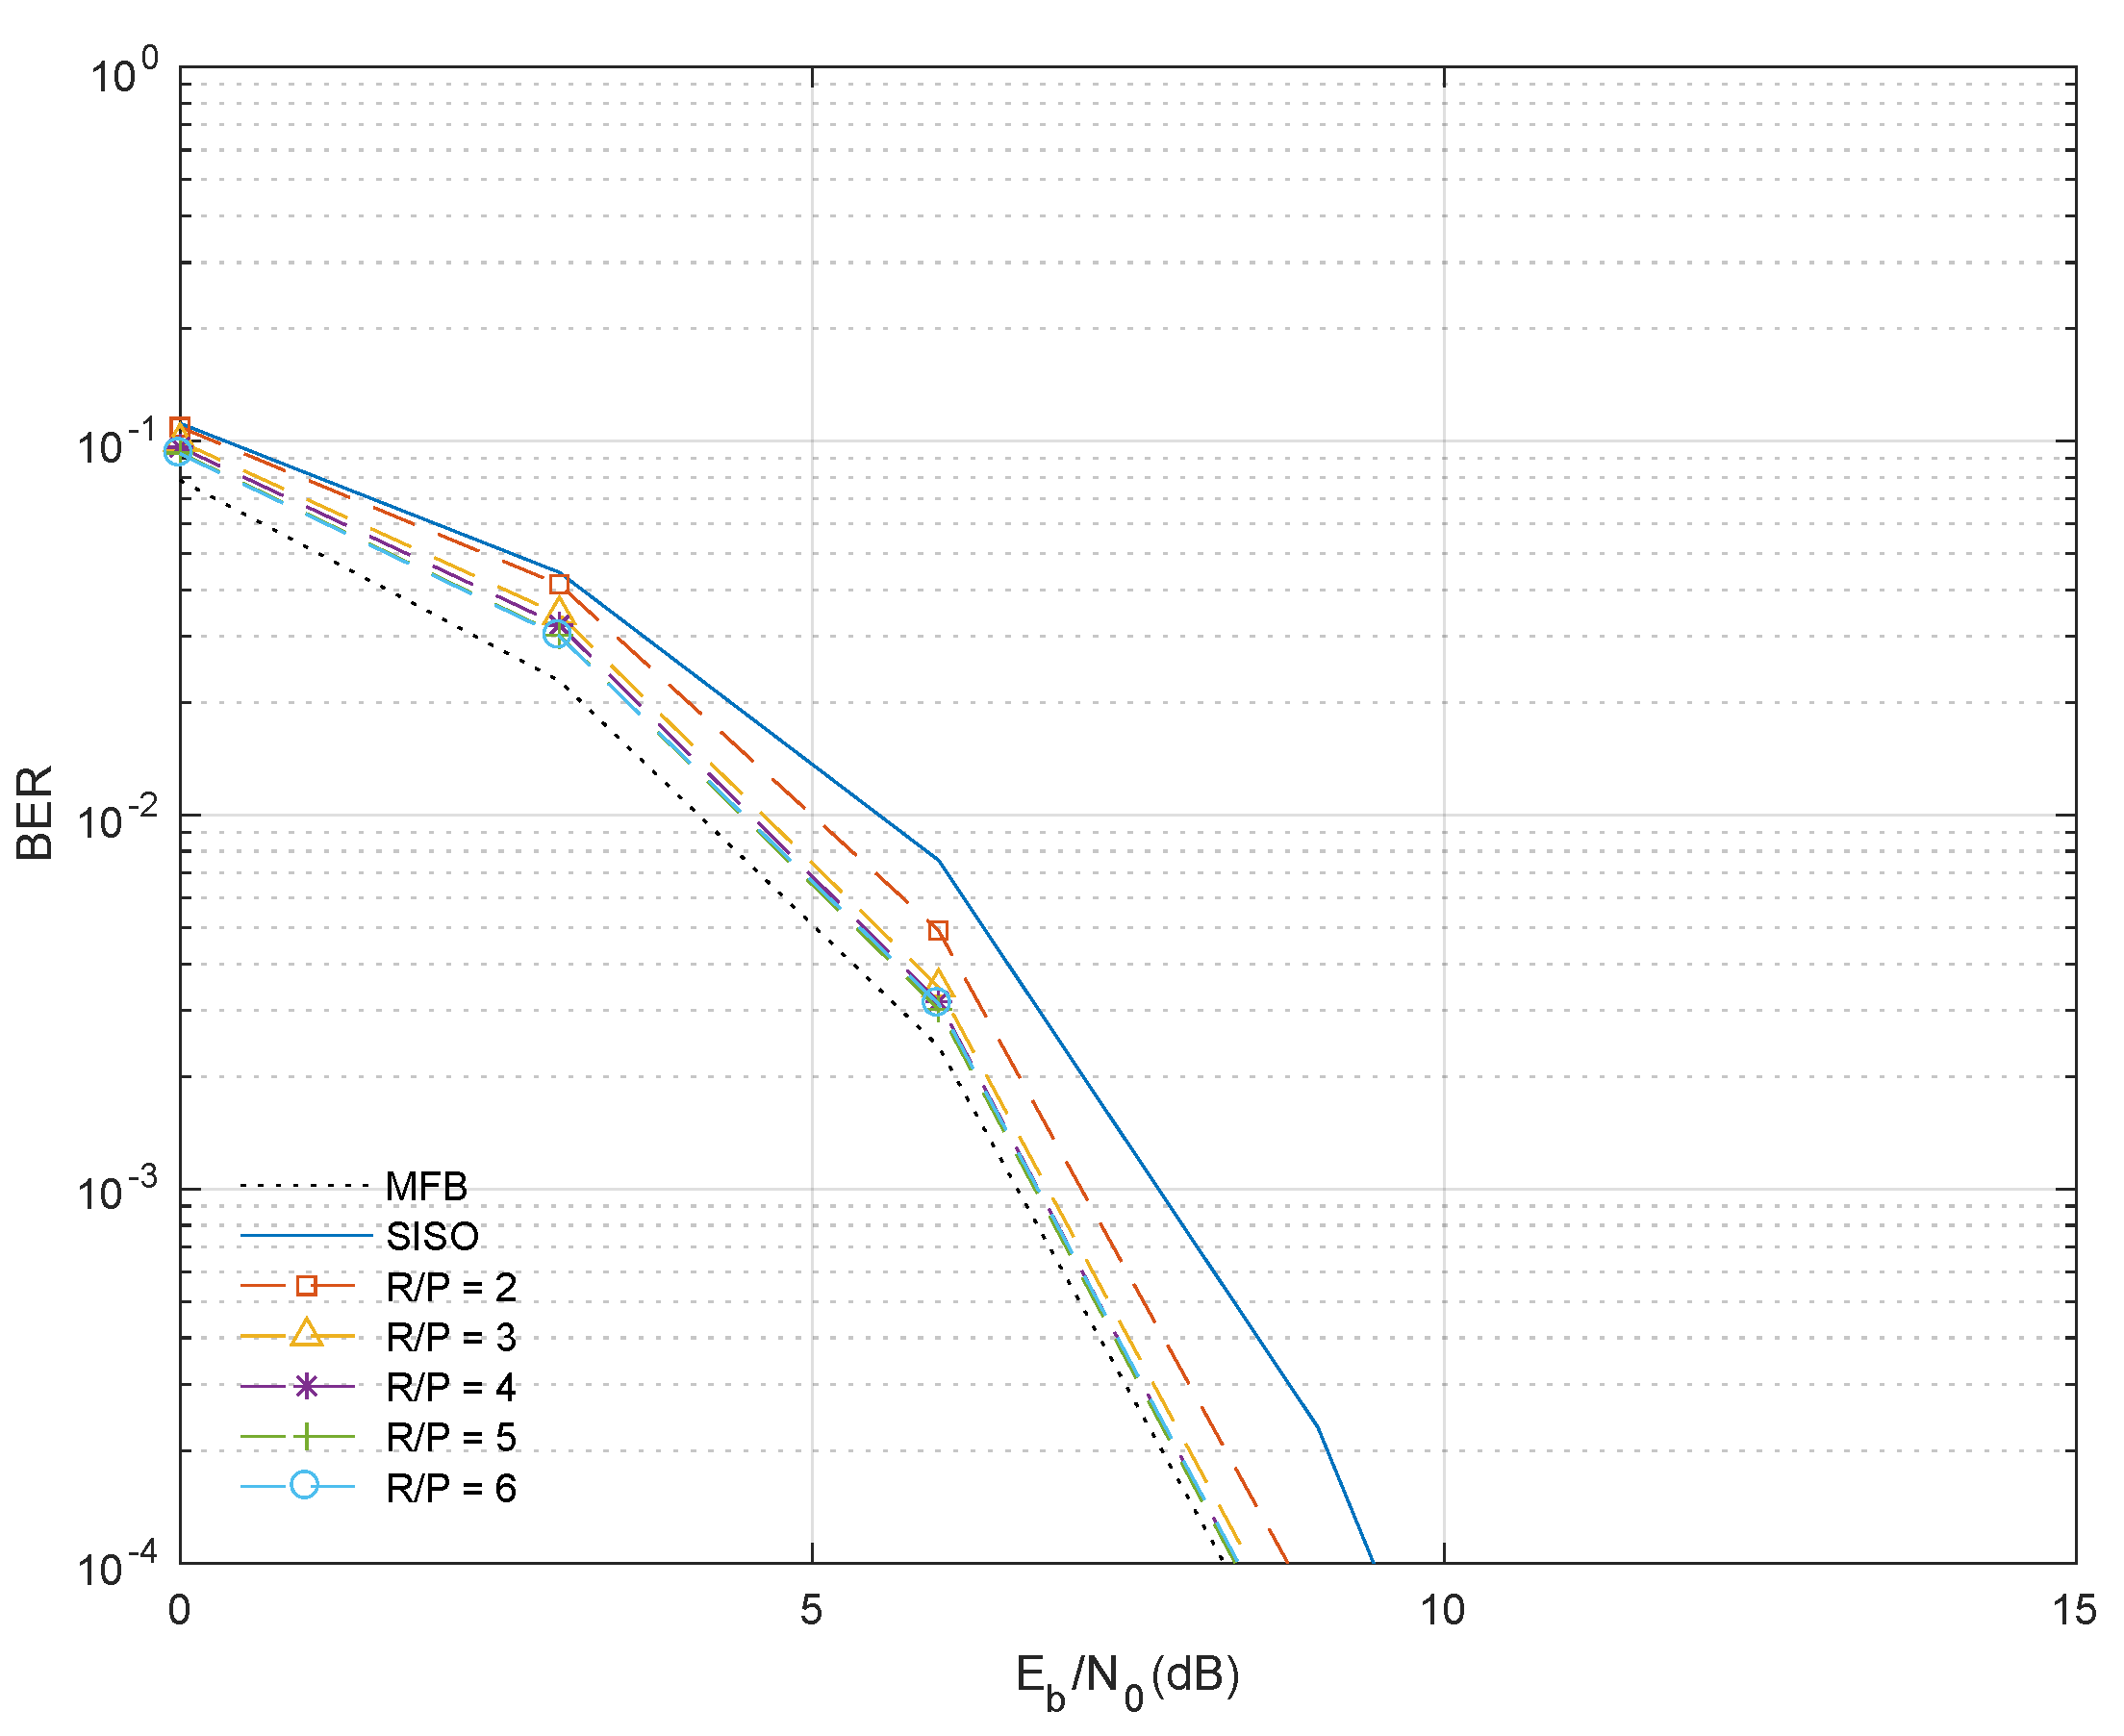
By using the iterative process of the receiver, the performance improves significantly, approaching the Matched Filter Bound (MFB), which represents the best performance that the receiver can ever achieve [
24]. In this study, we have verified that the performance for the third iteration of IB-DFE already presents results very satisfactory and close to the MFB. It must be emphasised that this performance close to the MFB is only possible due to the use of IB-DFE. If we were only using linear FDE, as it is the case for the first iteration shown in
Figure 3, the MIMO coverage would be worse and that is the main difference when we compare the results of
Figure 3 and
Figure 4. Accordingly, it is also possible to verify that, for a given BER value, the
values of the different
ratios are closer, when compared with the first iteration.
For each
ratio studied, the BER values considered for obtaining the performance were
,
and
, for which the corresponding
values were obtained. By obtaining these
values, it was then possible to calculate the difference between the performance of SISO and MIMO systems, which is represented by
. This difference, for the first iteration of IB-DFE, is shown in
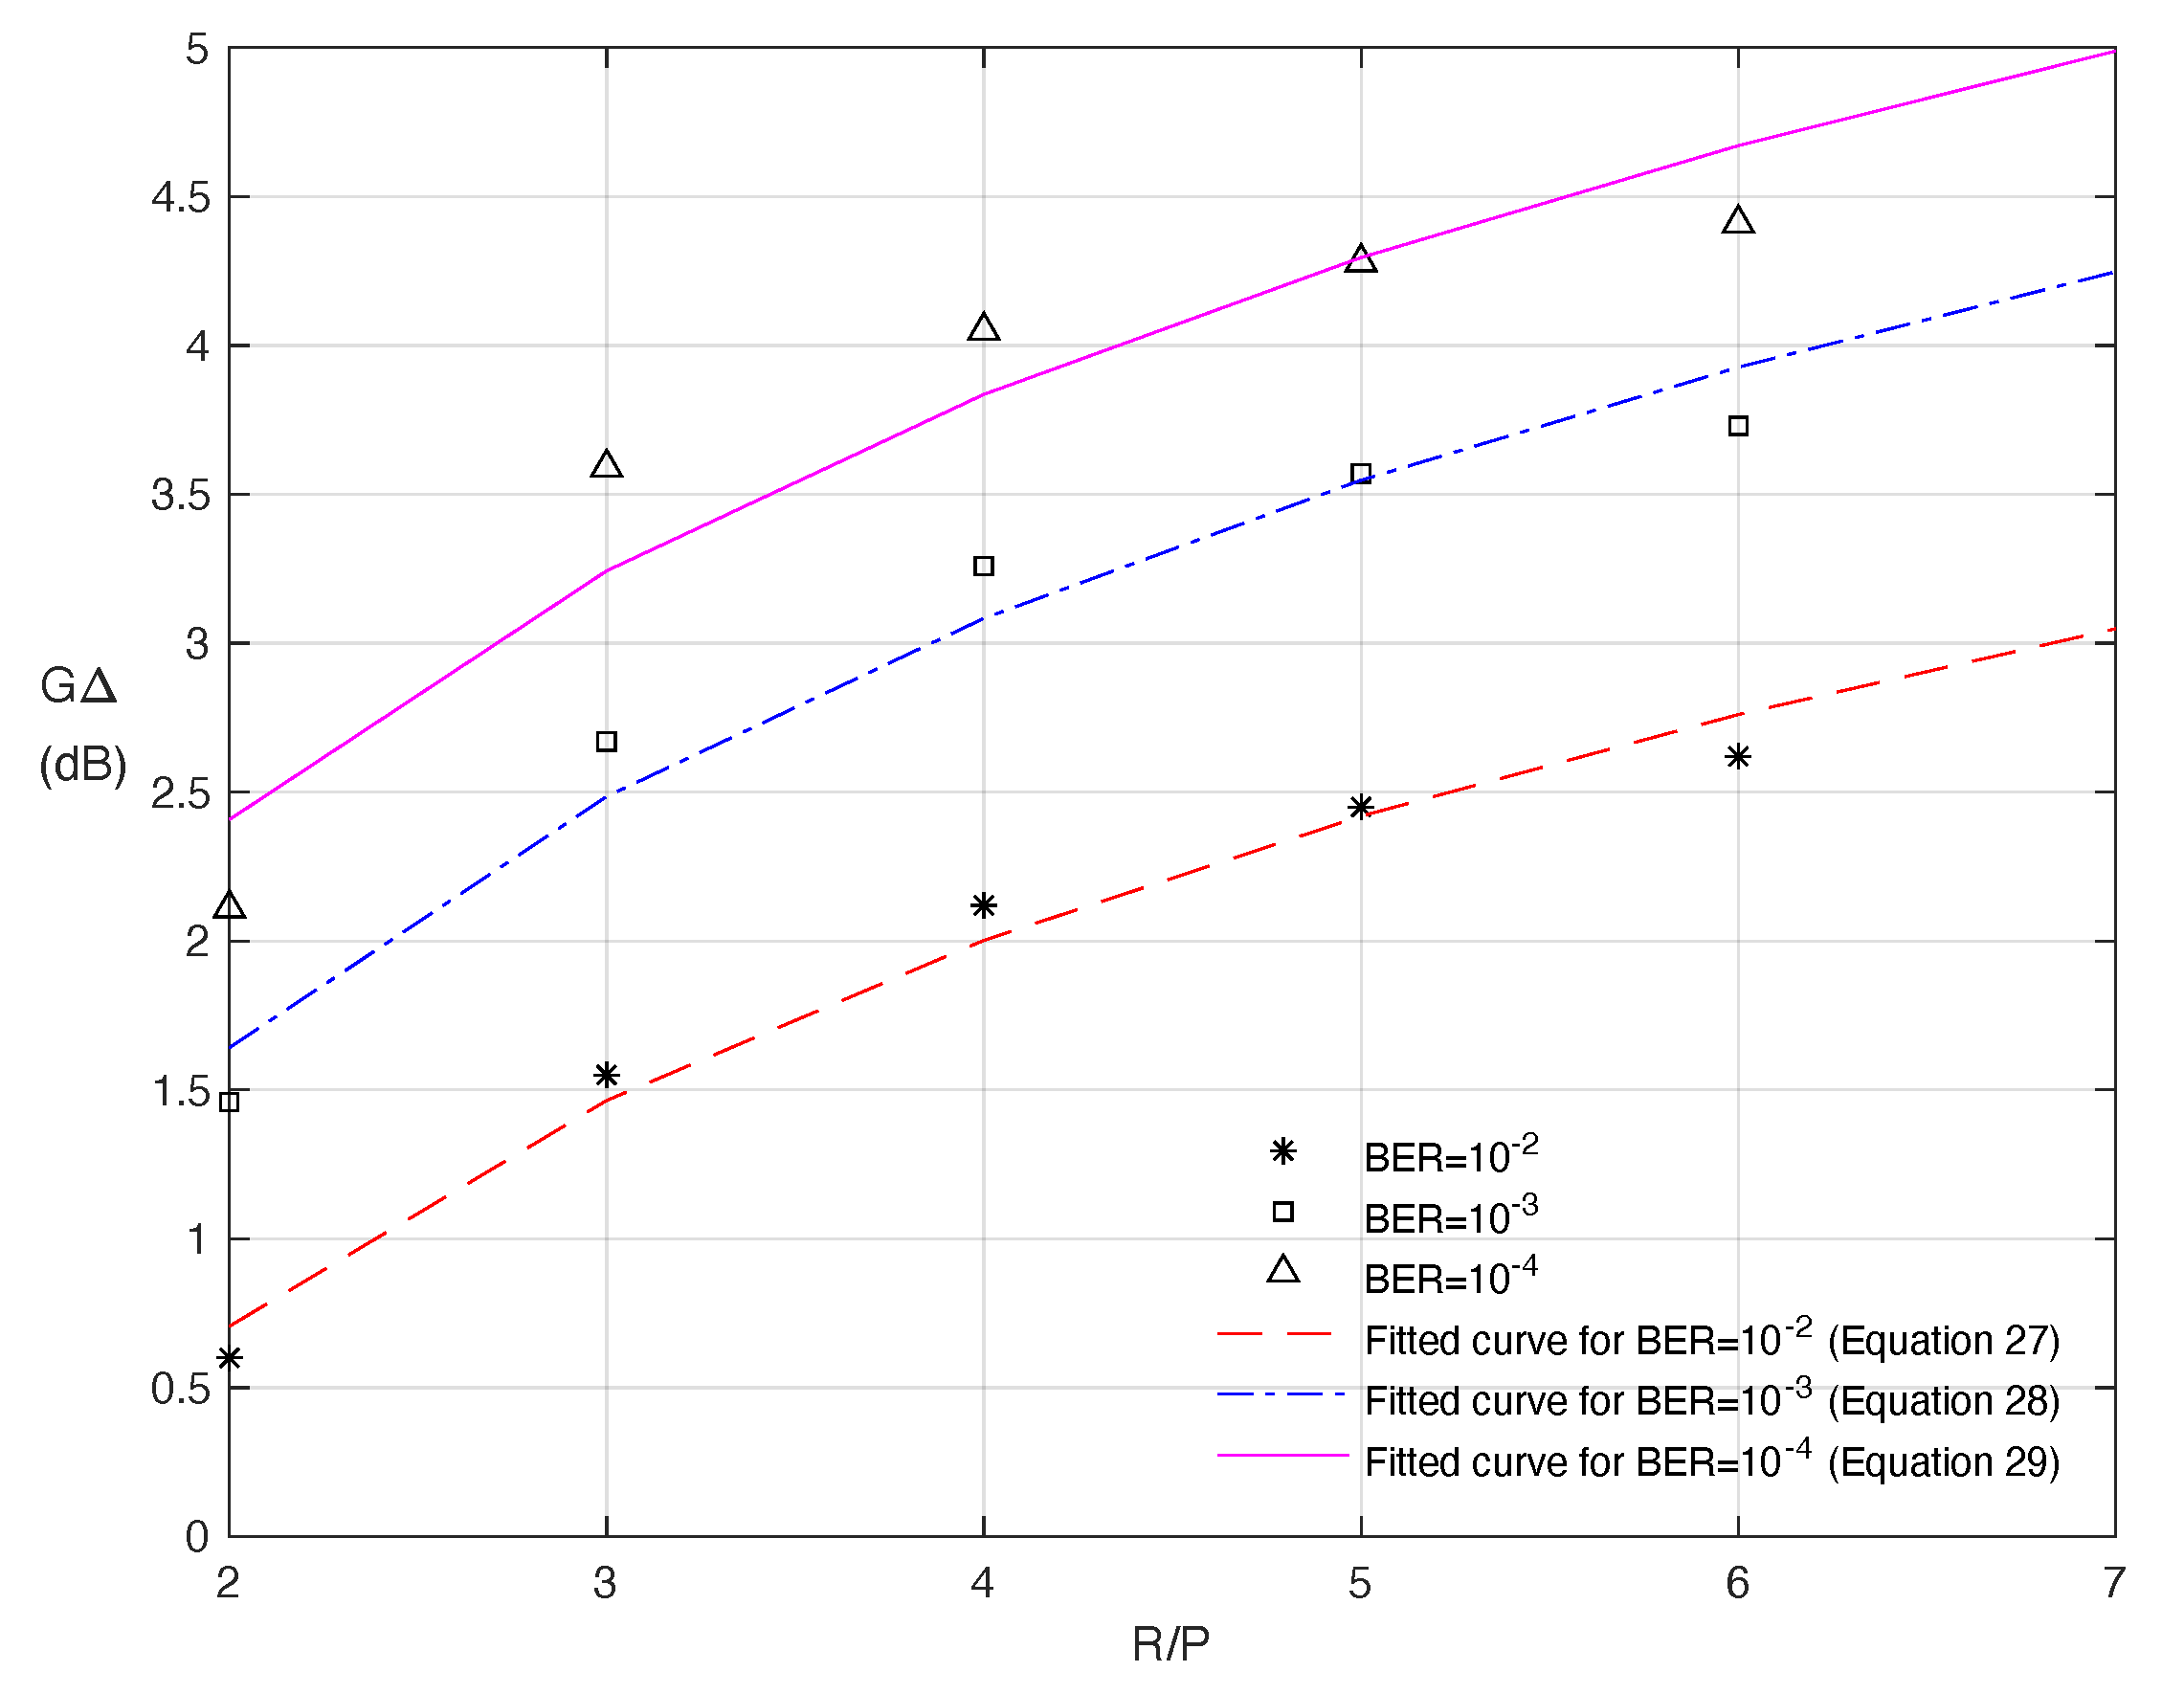
Figure 5, where the fitted lines for each case are also depicted.
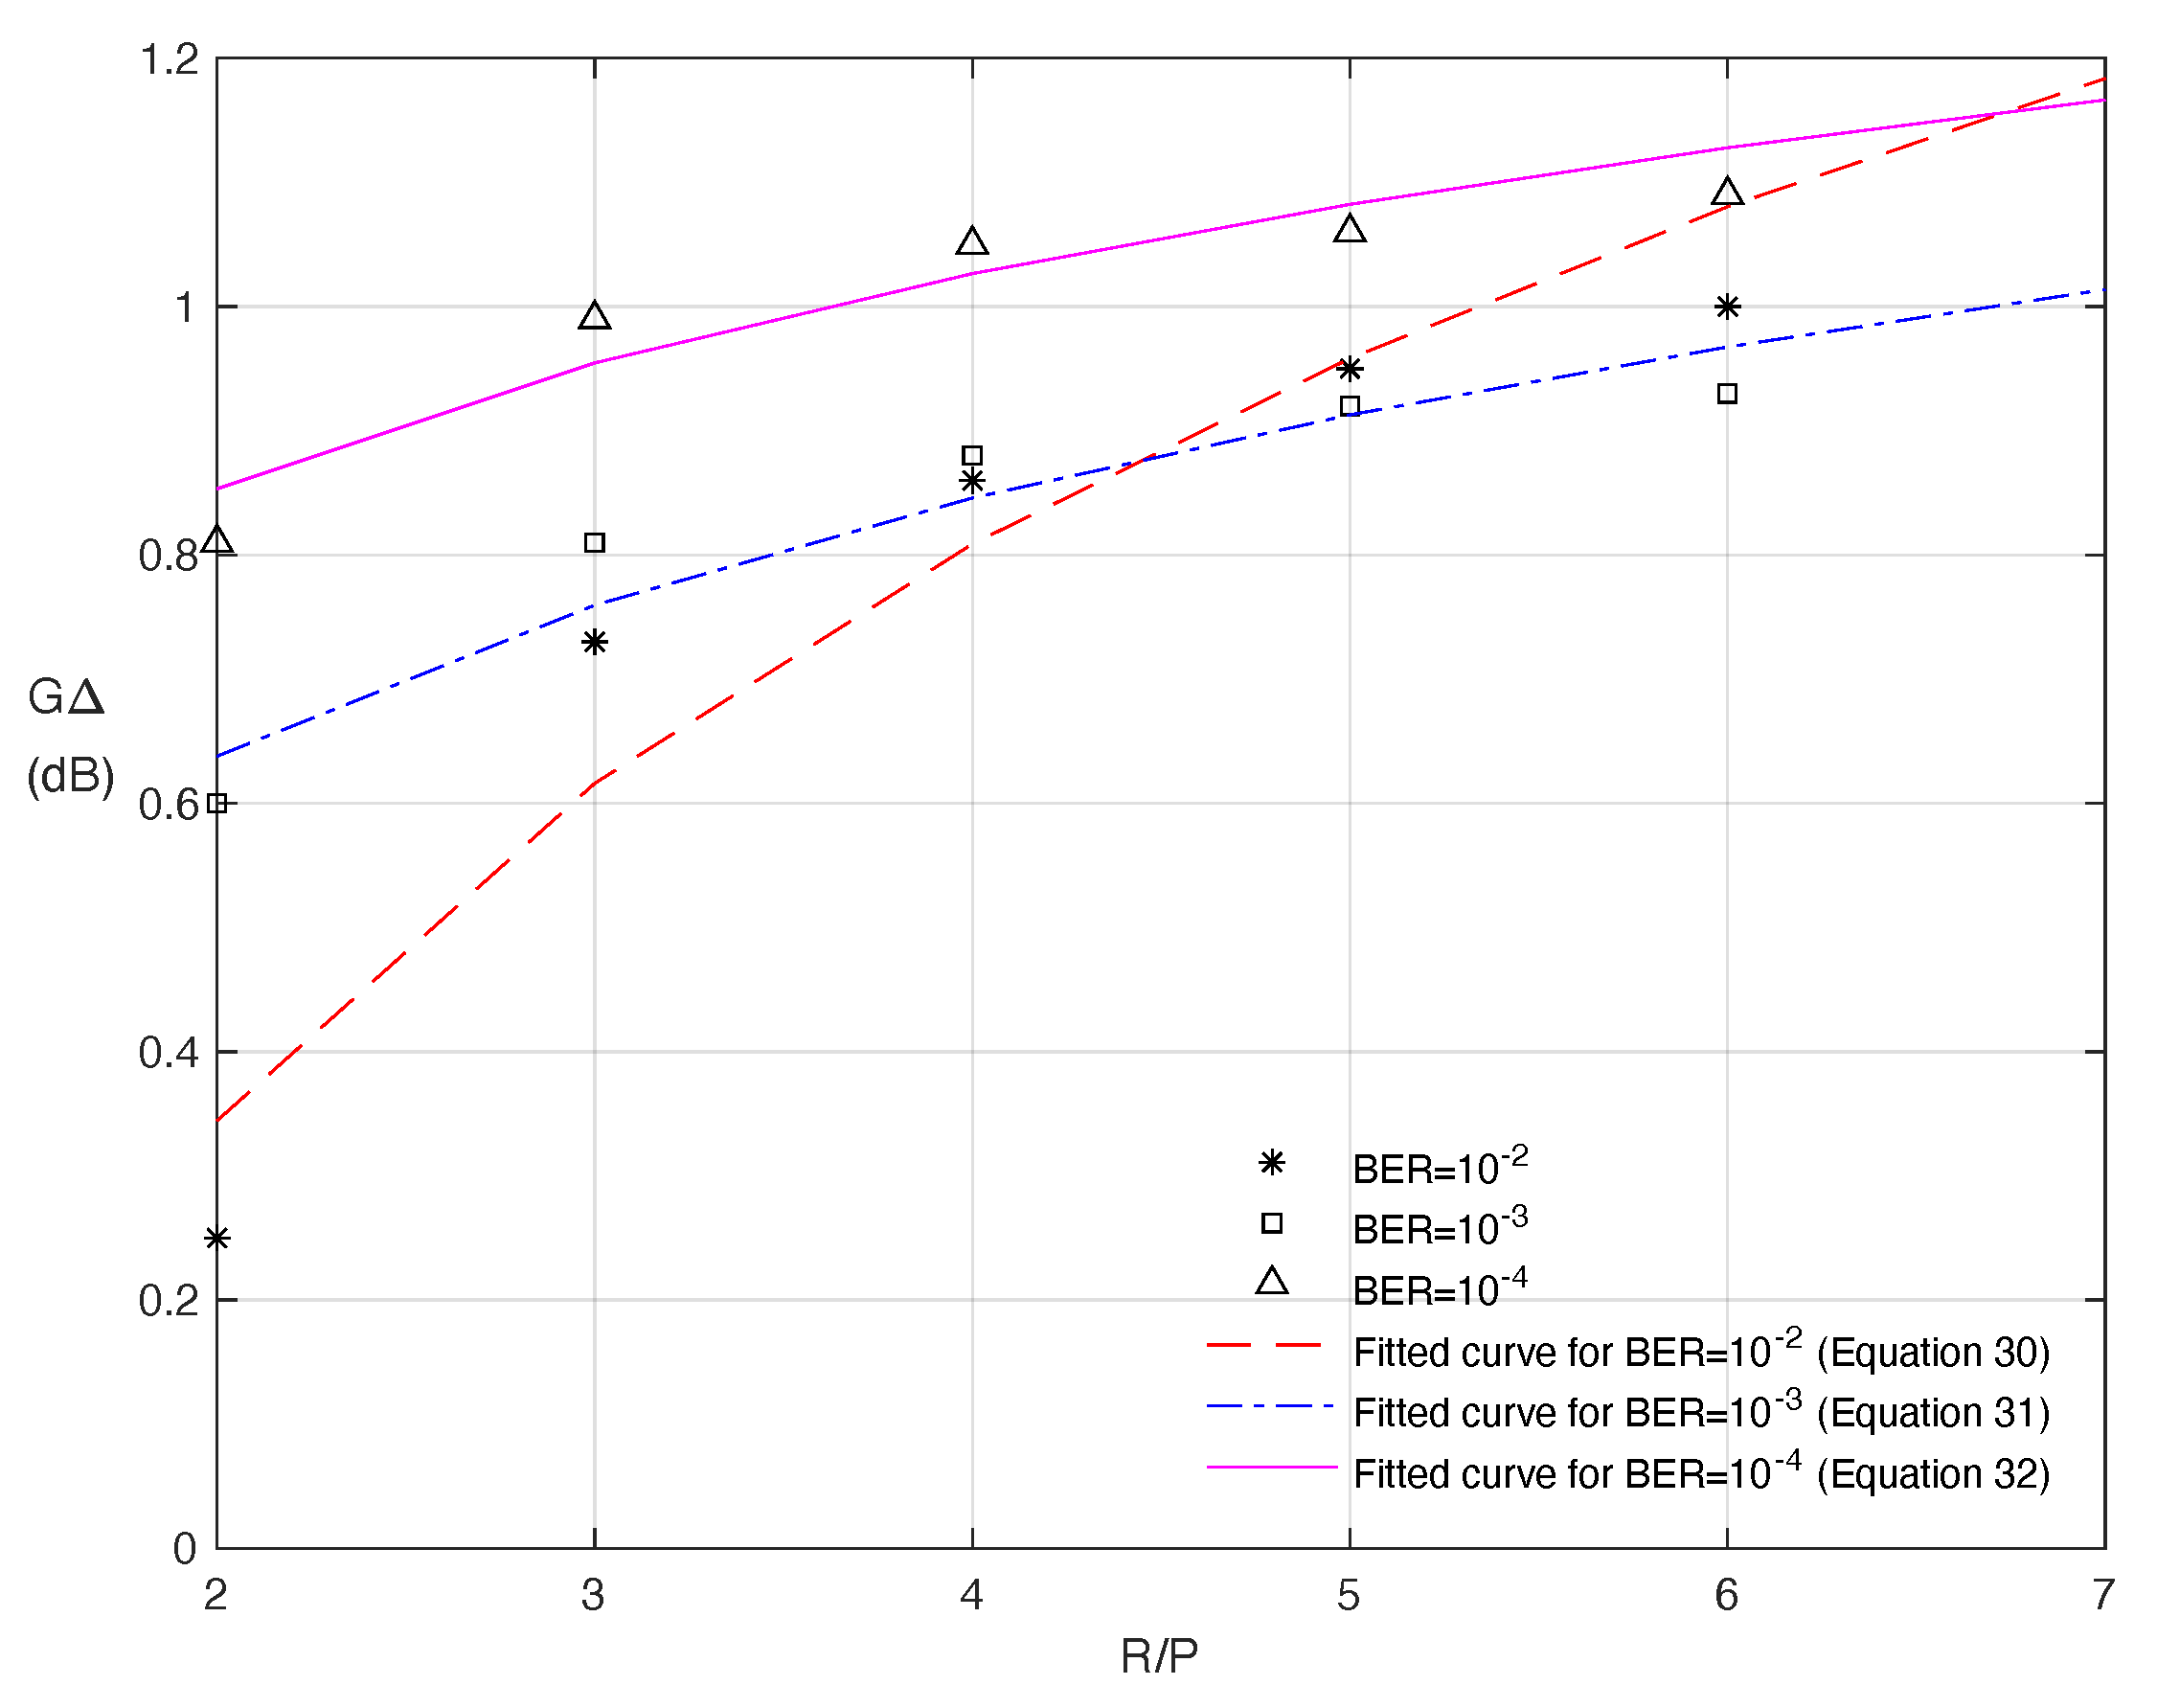
As depicted in
Figure 6, the difference between the SISO and MIMO systems decreases for the third iteration of the IB-DFE.
Through the fitted curves, shown in
Figure 6, it is possible to predict the
(the difference between SISO and MIMO systems for a given BER performance), considering the variation in the
ratio. For the first iteration and considering a BER performance of
the fitted curve is given by Equation (
27). Equation (
28) corresponds to a BER of
and Equation (
29) denotes the fitted curve for a BER of
.
In the third iteration, Equations (
30)–(
32) represent the fitted curves for the BER values of
,
and
, respectively.
Using the previous equations, it is now possible, for a given BER performance, to know the impact on the
ratio of changing from a SISO system to a MIMO system. Note that this relationship is a function of the
ratio, so the higher this ratio the greater the impact. As an example, and according to Equation (
27), for a BER of
and the first iteration of IB-DFE, the value of
, improves by approximately
dB (
dB), when moving from a SISO system to a MIMO system with 2 transmitting antennas and 10 receiving antennas (
).
When changing from a SISO system to a MIMO system, the associated complexity will also be increased, as the number of transmitting and receiving antennas will increase. For the specific case of IB-DFE, this complexity is associated with the need to invert matrices, in order to calculate the
factor, whose dimensions will always be at least
. The complexity of this receiver is therefore greater than for the linear case, since one more IDFT/DFT pair exits per iteration [
25,
26].
5. Performance Results
The Signal-to-Noise Ratio (SNR) is the ratio between signal and noise power. Therefore, if we assume that the noise power remains constant, we can derive the signal power as a function of the SNR. The SNR ratio can be expressed in decibels (dB), as denoted in Equation (
33):
where
, and
denote signal and noise power, respectively.
The
expression, in linear terms, can be written as:
where
B, and
denote signal bandwidth and bit rate, respectively. In our analyses,
is negligible since it is the same for both SISO and MIMO. Thus, the Equation (
33) can be rewriten as:
After some mathematical manipulation, it is possible to arrive at the relationship between the signal power in a SISO and in a MIMO system, indicated by Equation (
36):
If we now assume that both the noise and the BER performance value remain constant, it is possible to estimate the coverage area of a MIMO system based on the coverage of a SISO system, considering a downlink scenario.
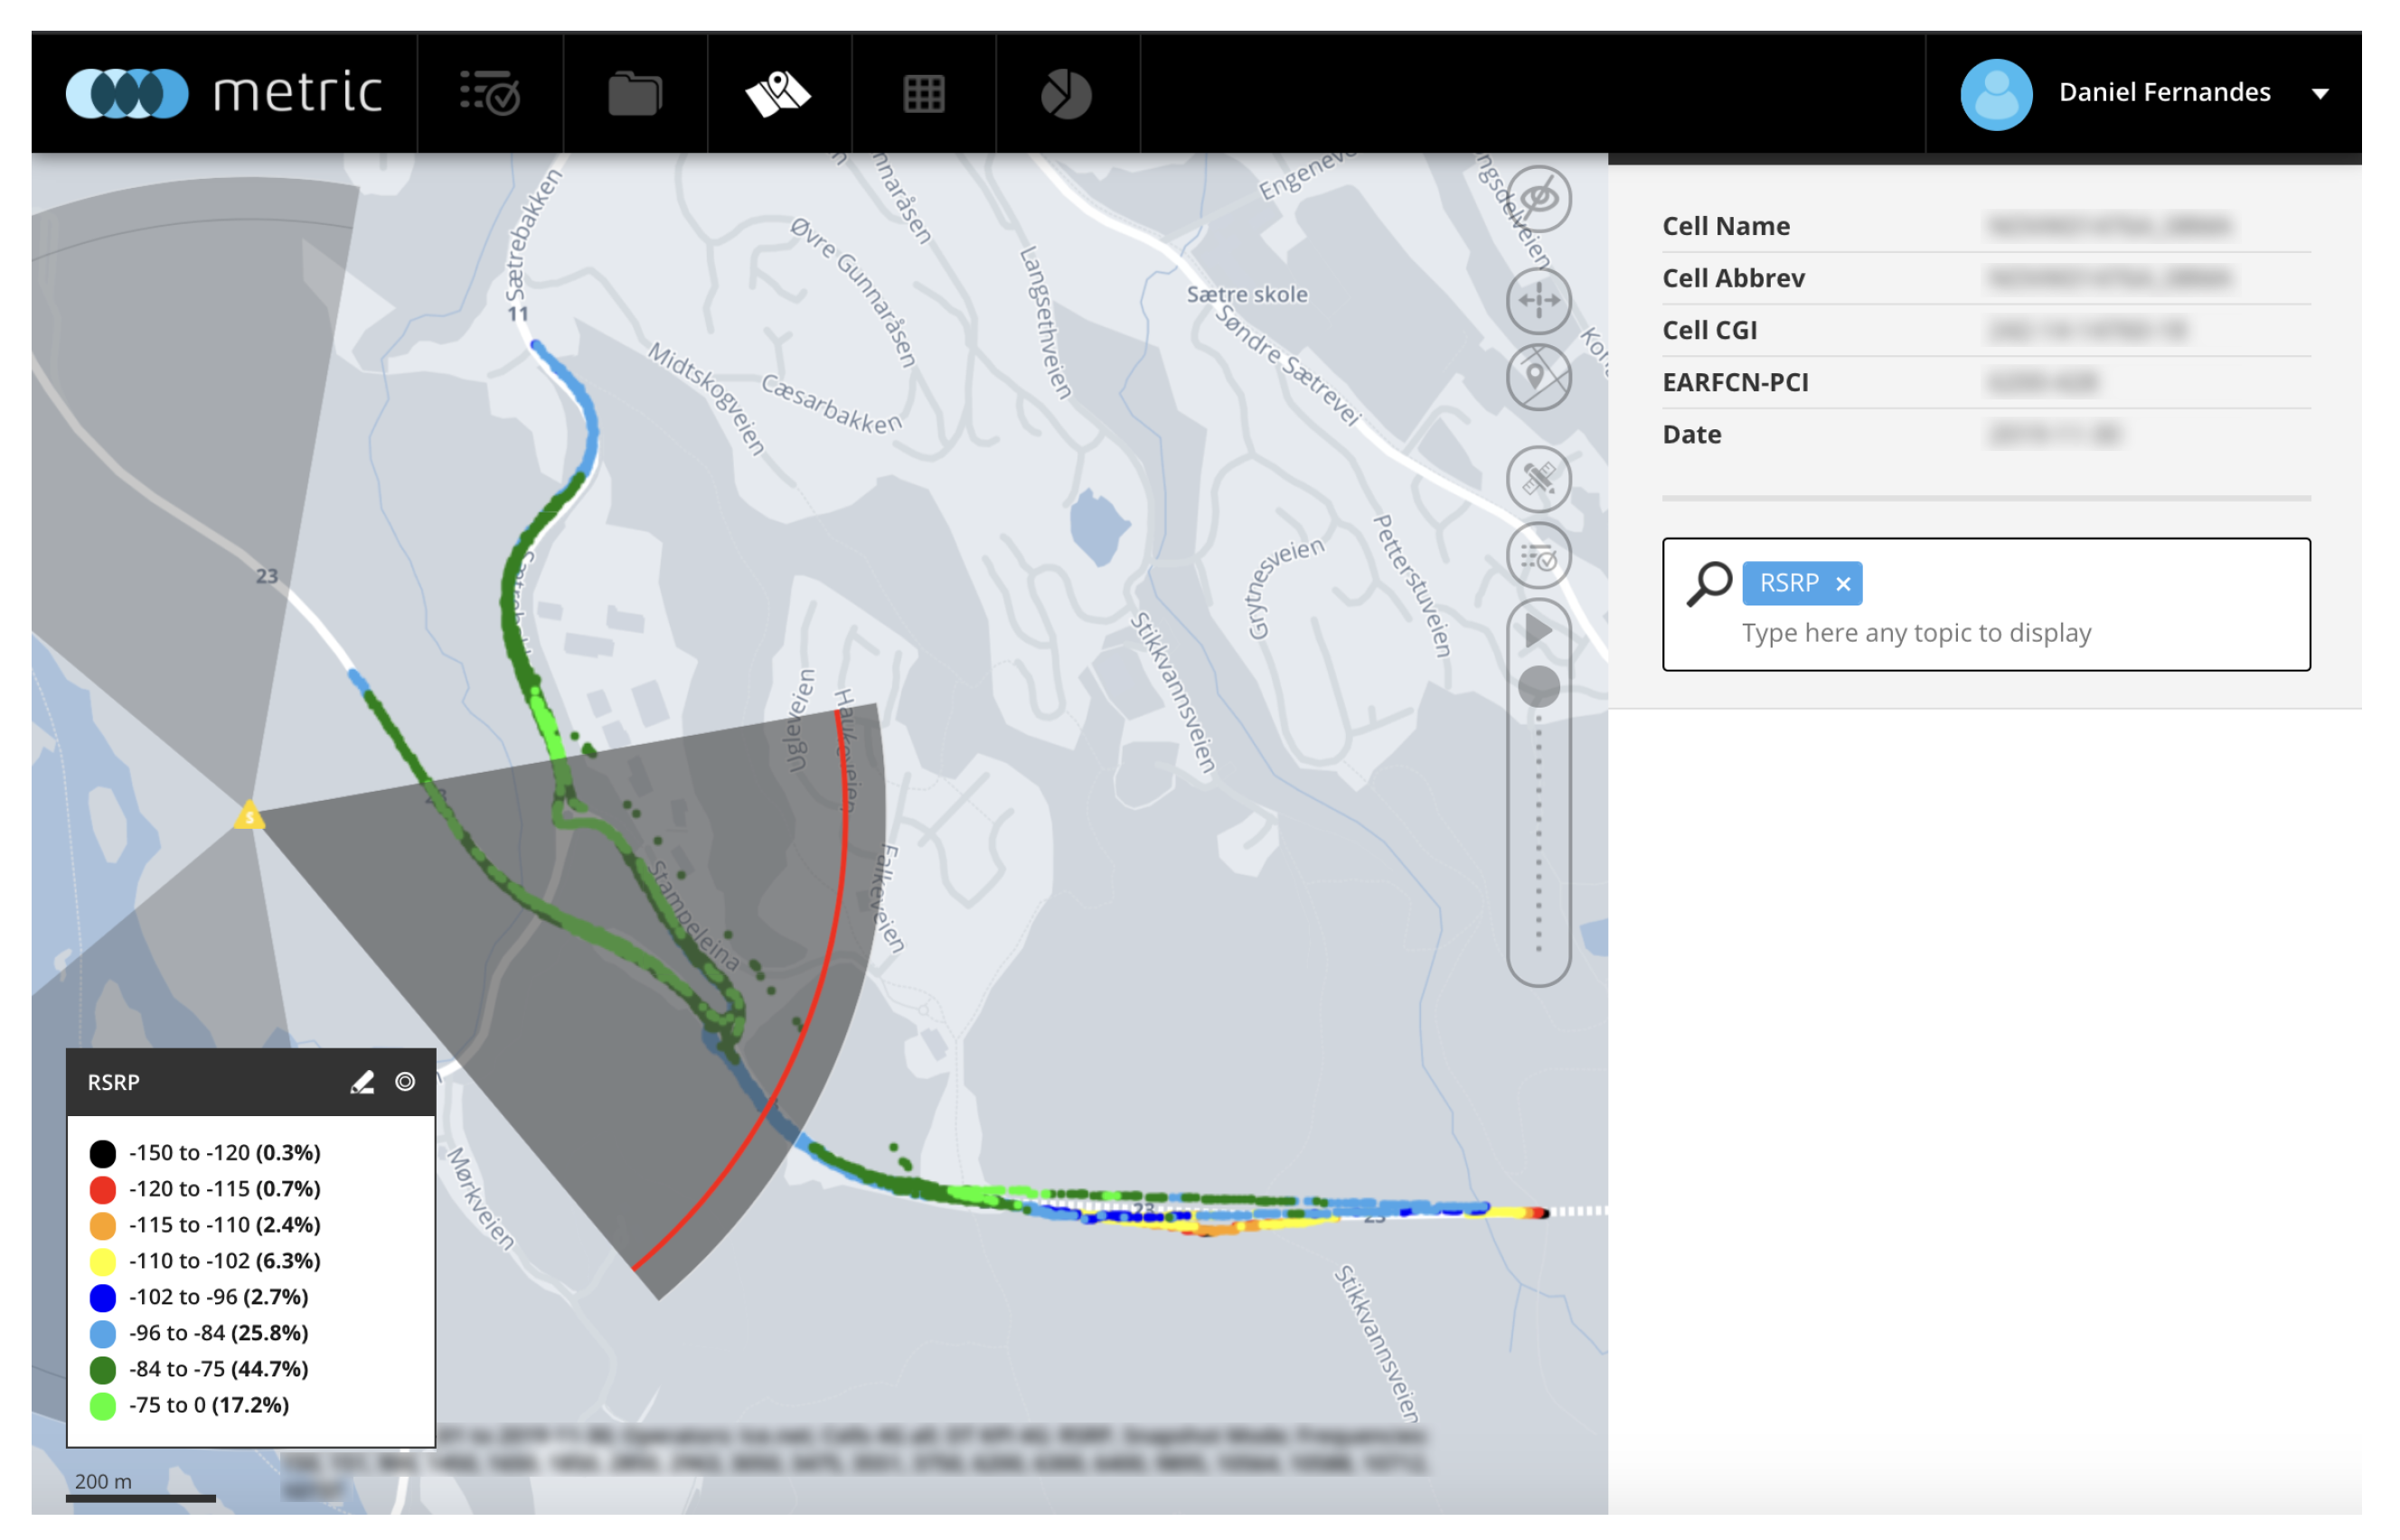
In order to test this possibility of extending the coverage area of a SISO system to a MIMO system, a 4G antenna from a northern European country manufacturer was considered, working on a downlink frequency of 796 MHZ and a transmission power of 46 dBm. This scenario, illustrated in
Figure 7, was taken from the
Metric platform [
5], which is a network monitoring and management web platform developed by the
Multivision company [
6]. This platform is currently used by several mobile operators worldwide, aggregating Configuration Management (CM) and Key Performance Indicators (KPI) data, as well as DTs from their networks.
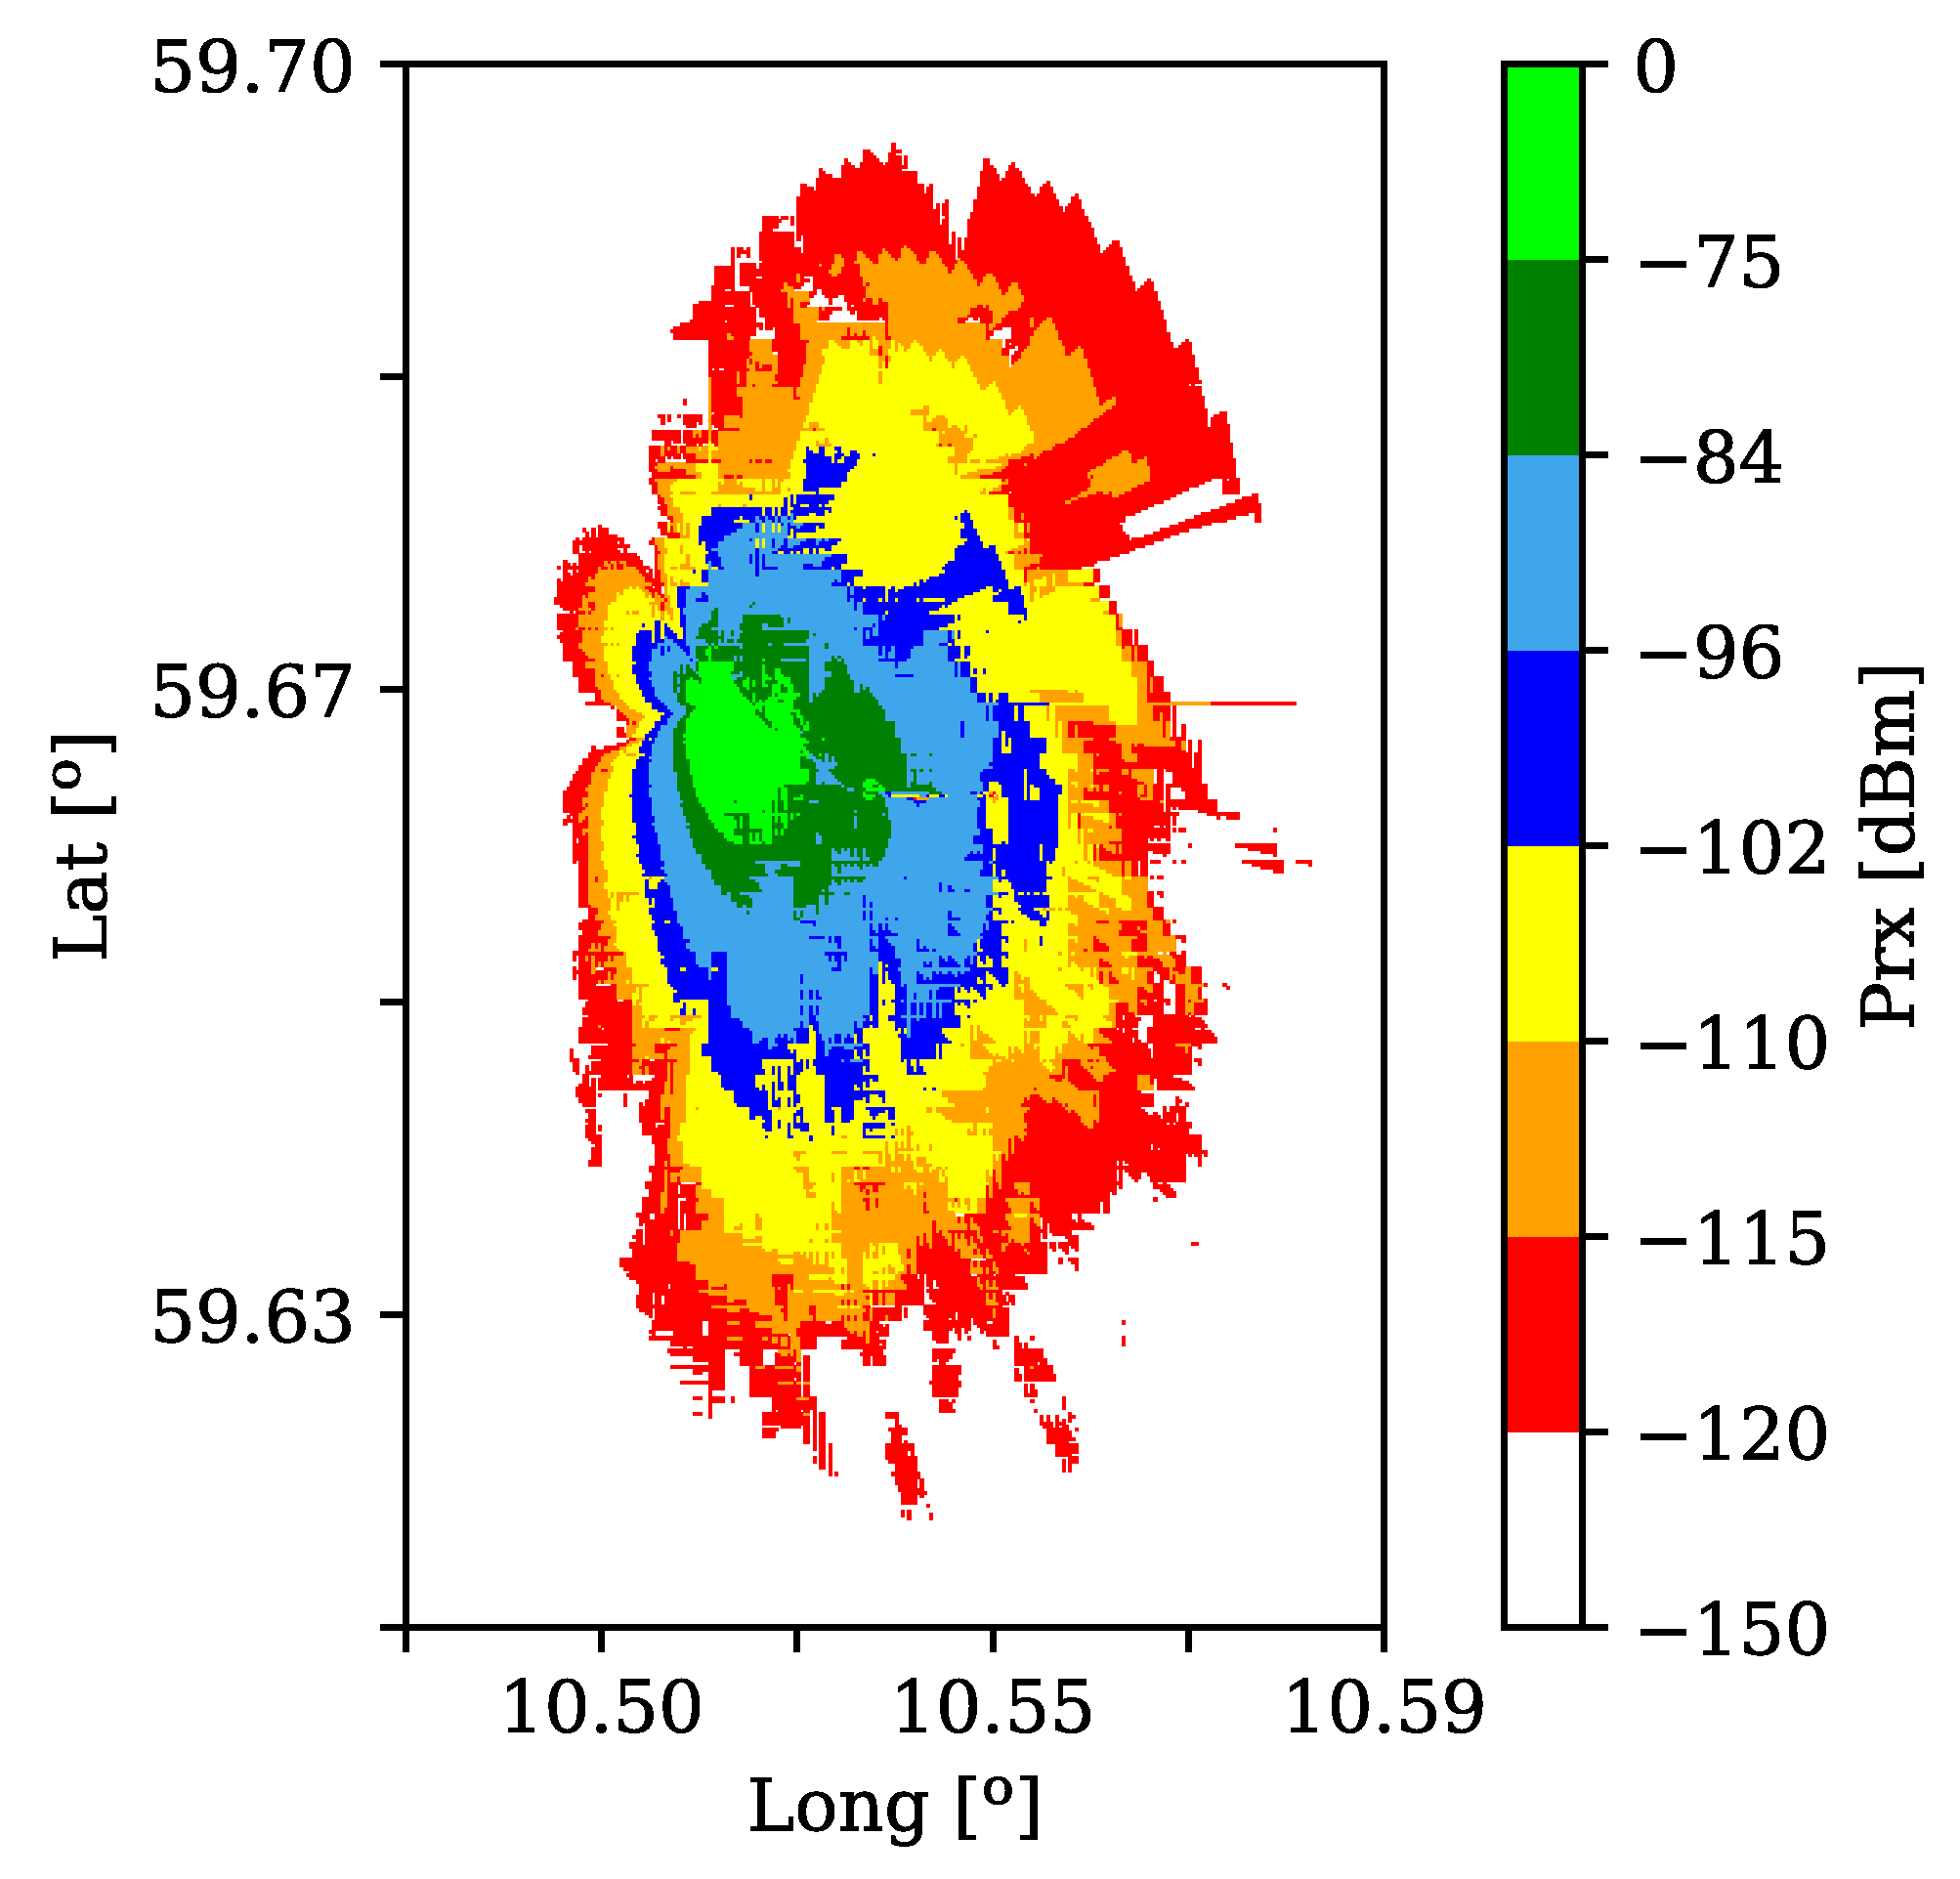
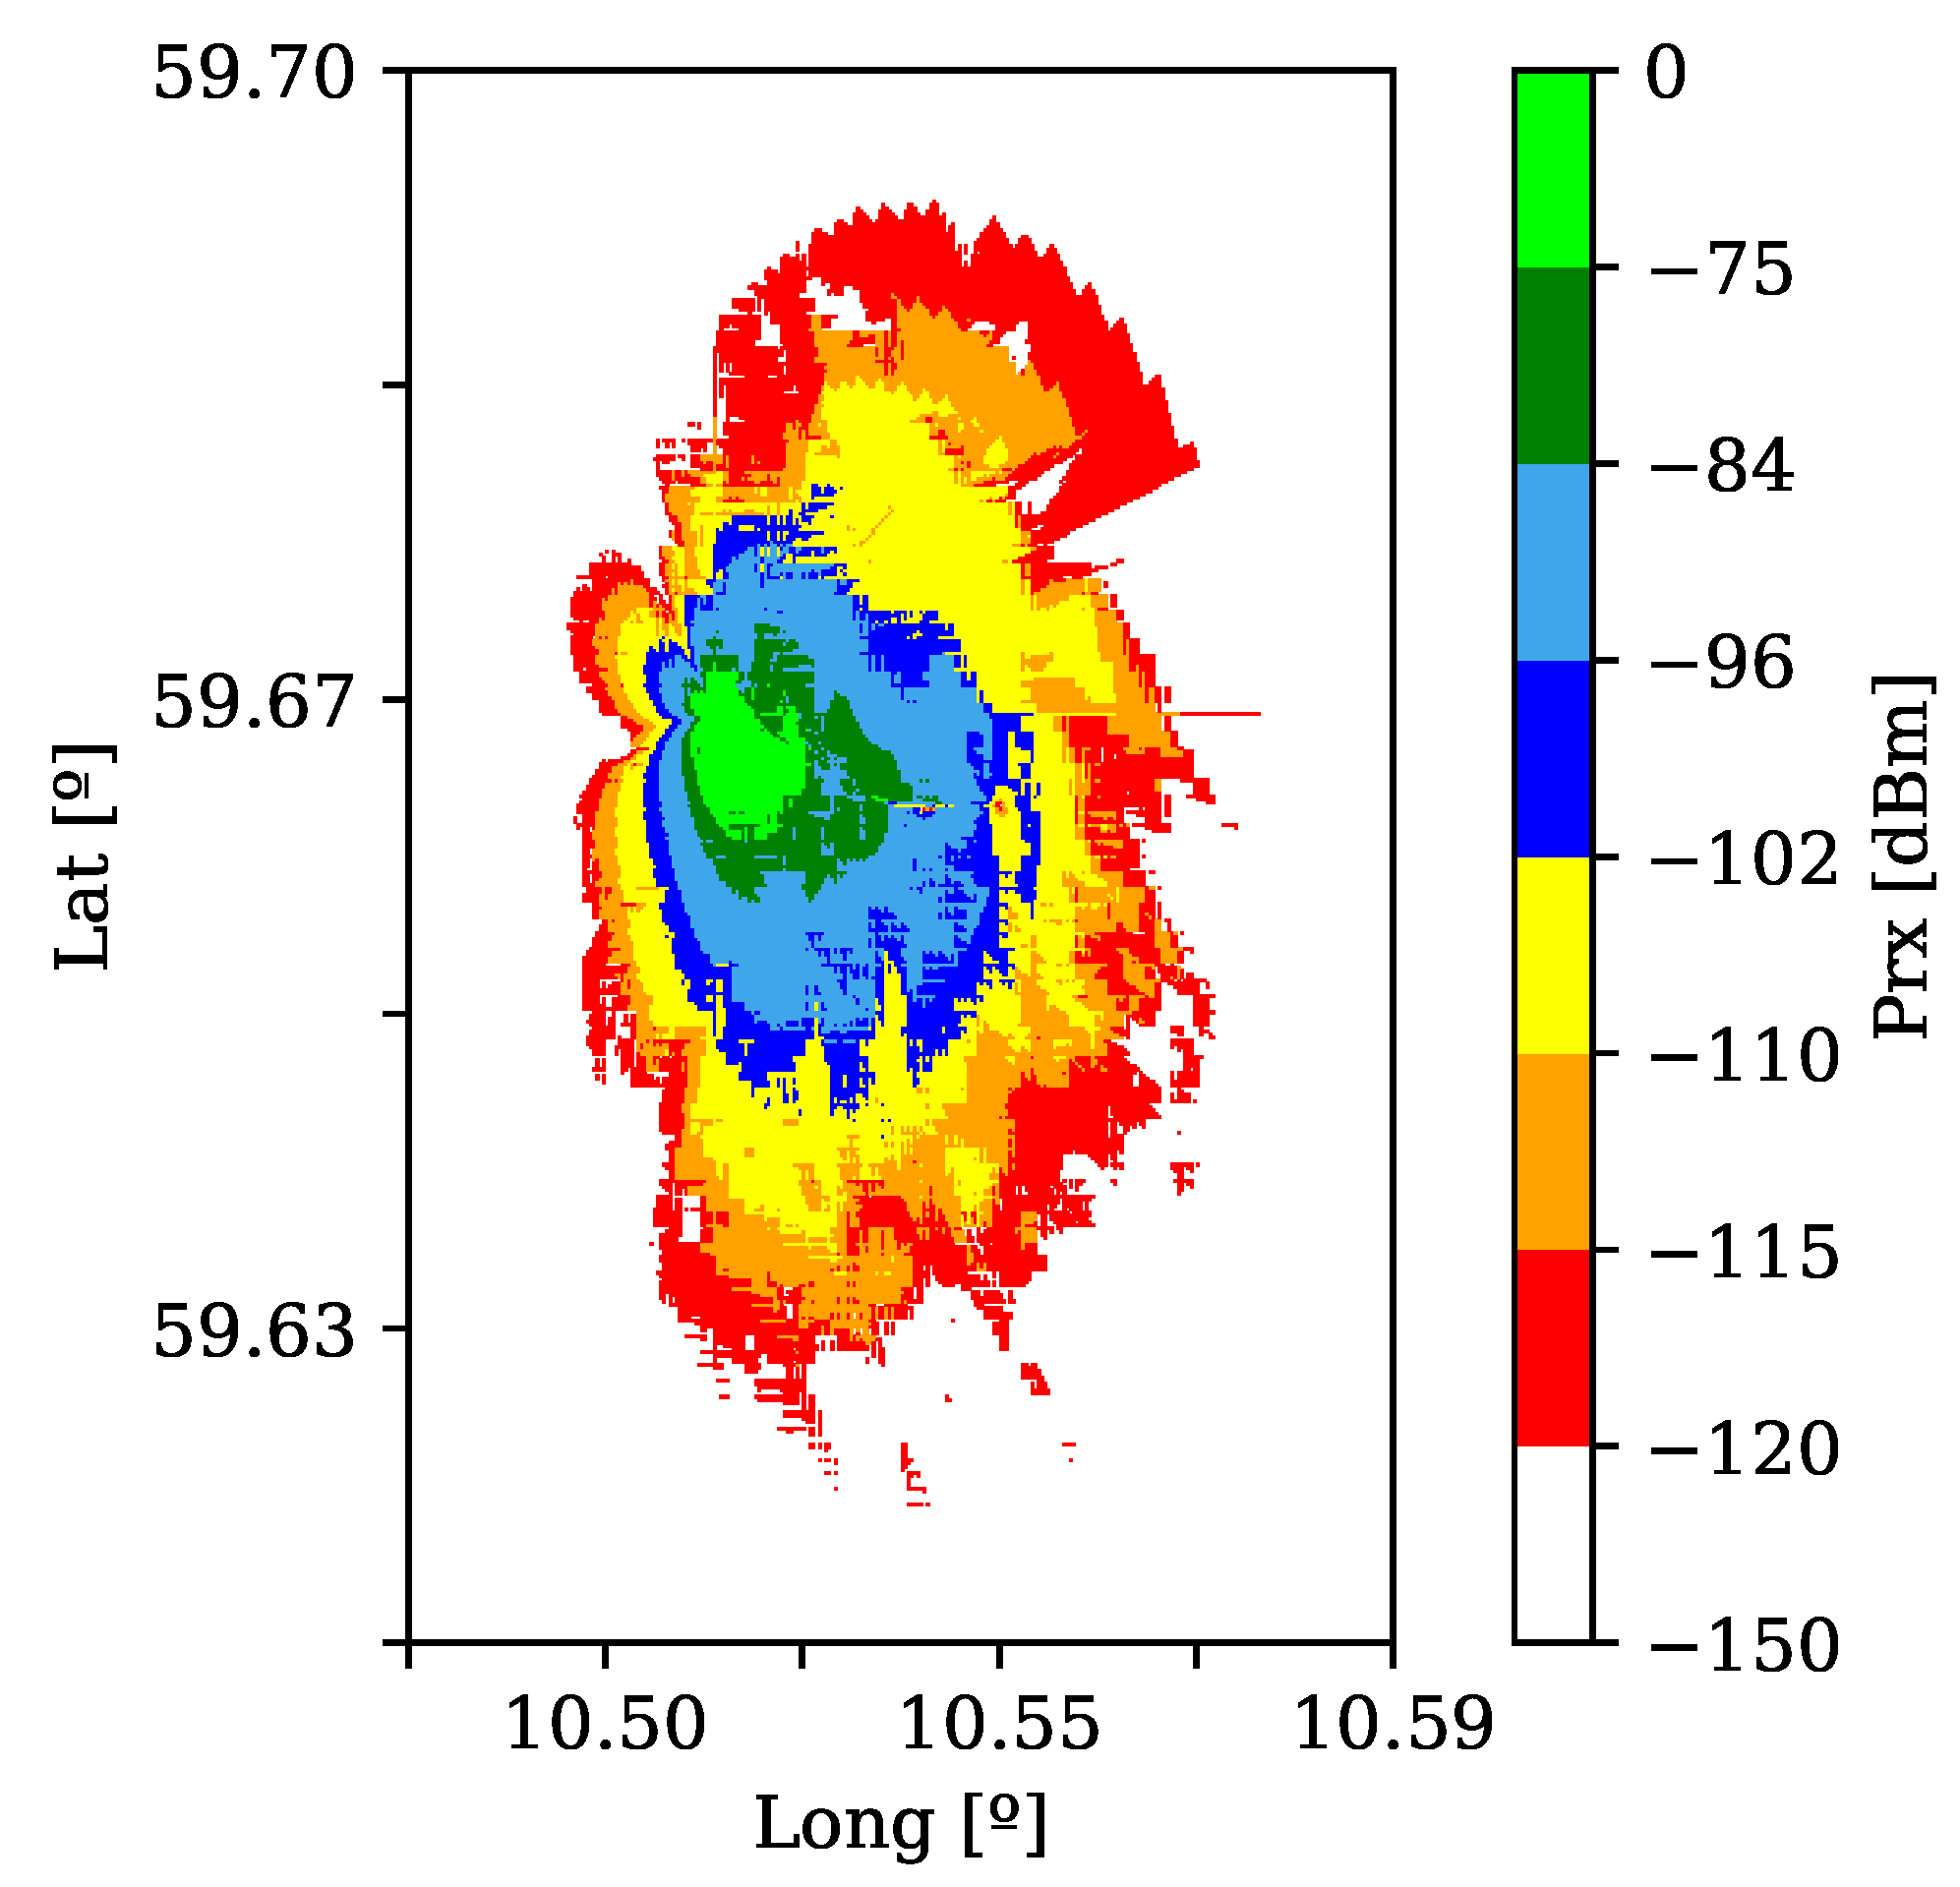
If the radiation pattern of the transmitting antenna was considered, with the gain in the receiving antenna of 0 dB, and the DT campaign measures taken, it is possible to apply the ACSPM model and to estimate the coverage area for this scenario as in [
27], depicted in
Figure 8.
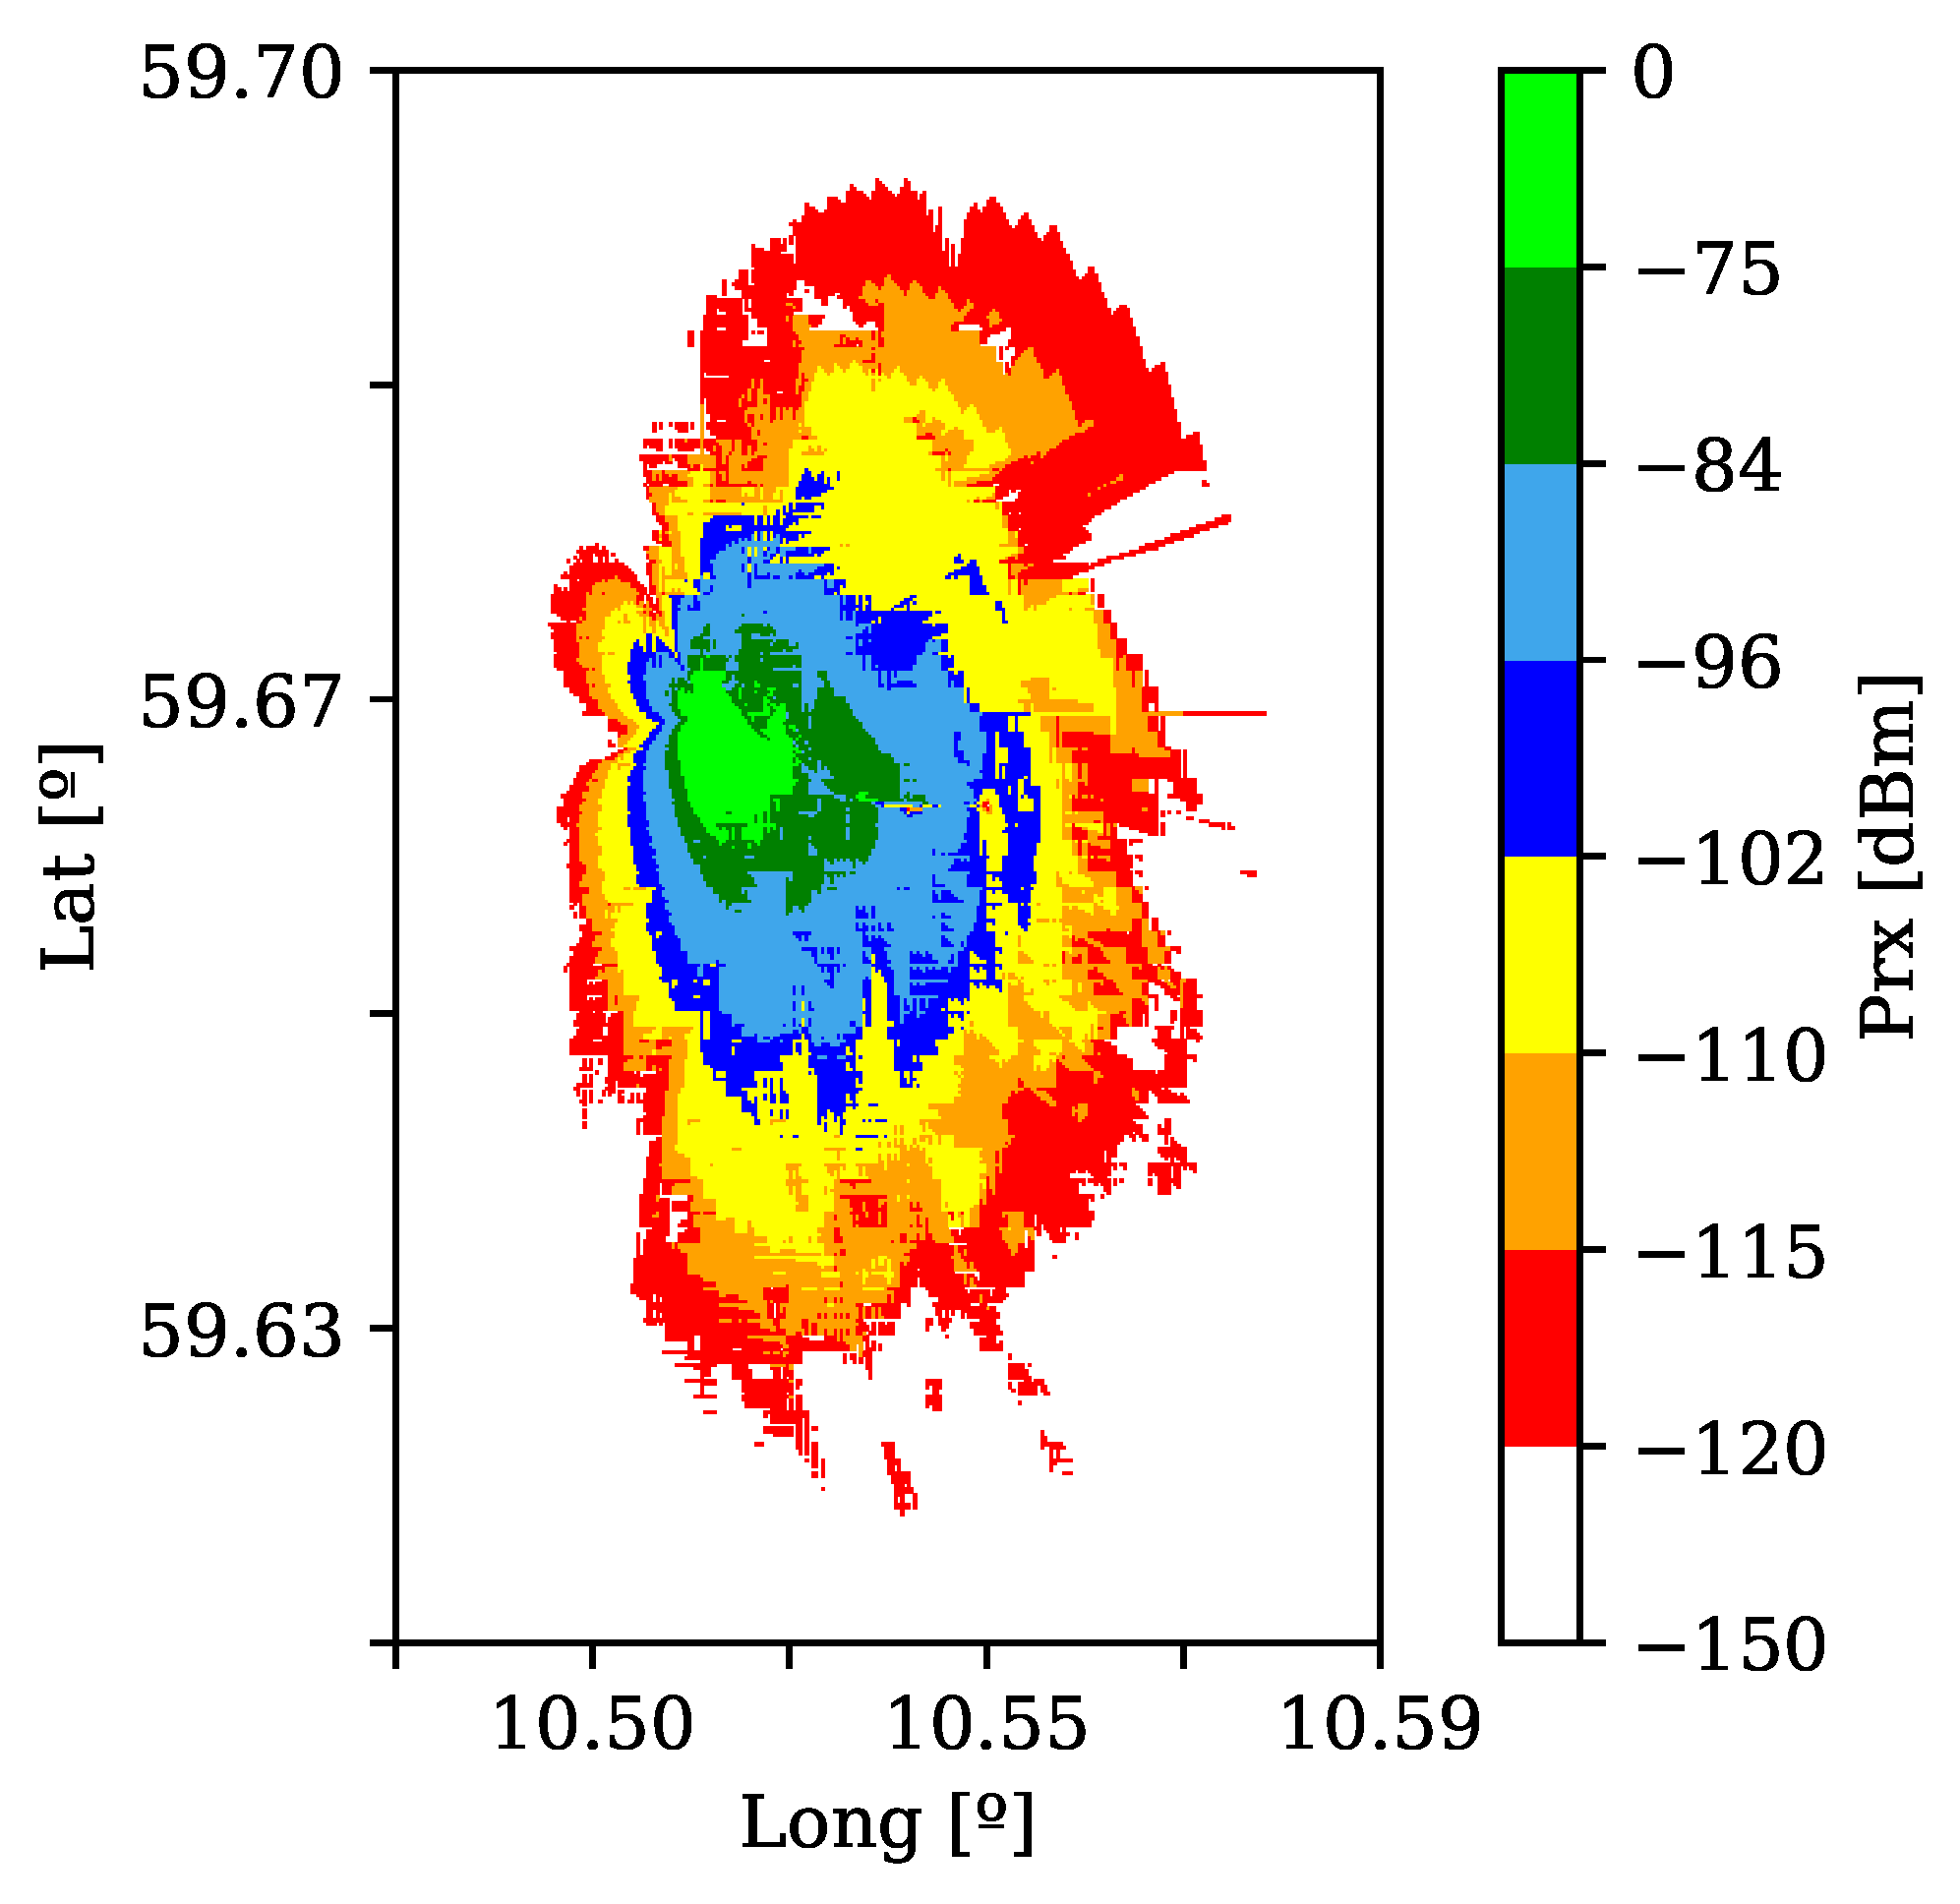
As mentioned above,
values improve by
dB (
dB) when changing from a SISO system to a MIMO system with an
and a BER of
. For example, if the power received at a given point in the SISO system that was estimated as
dBm, the value corresponding to the MIMO system in this same scenario will now be estimated as
dBm for the scenario presented. Accordingly, the coverage scenario presented in
Figure 8 would then be changed to that depicted in
Figure 9.
If we consider a minimum sensitivity of
dBm required for the correct establishment of communications between the base station and a mobile receiving terminal, and by comparing the coverage results depicted in
Figure 8 and
Figure 9, it can be concluded that the useful area for communications has been reduced about
.
If we now consider the third iteration of IB-DFE on the mobile receivers, the value of
reduces by approximately
dB (
dB), when extrapolating coverage from a SISO system to a MIMO system with 20 transmitting antennas and 2 receiving antennas; that is, an
ratio of 10, and a BER of
. The resulting coverage area for this system is depicted in
Figure 10. In this case, we conclude that if we have MIMO coverage instead of SISO, the coverage area is reduced by about
.
As we can verify from these results, the overall coverage area of a MIMO system is reduced, once the directivity of multiple antennas concentrates radiation in some more specific and desired areas. However, we must be aware that MIMO systems have simultaneous data streams covering the different antenna sectors from each Base Station, as opposed to SISO systems. Therefore, and although there is a slightly smaller global coverage area for MIMO systems, the increase in the number of data streams allows for an increase in the data rate, which improves the QoS for users and the overall capacity, when compared to a SISO system. Despite the results achieved, it should be noted that with the change from a SISO system to a MIMO system the complexity associated with the receiver also increases. The methodology presented is independent of the geographical area where it is applied as this factor only influences the signal estimation through the propagation models. If a propagation model is influenced by terrain morphology, the values obtained for MIMO systems will also take this fact into account, if we use this methodology.
6. Conclusions
The main objective of the work carried out and described in this paper was to estimate the signal coverage of a MIMO system based on the coverage of a SISO system, already optimised with DTs taken for it, in a efficient and practical way.
To meet these objectives, the theoretical BER performance achieved by the SISO systems was initially evaluated and then compared with the BER performance of equivalent MIMO systems. From this theoretical analysis it was then possible to estimate the BER performance improvement that occurs, for a given BER and ratio, when switching from SISO systems to MIMO systems. The expressions obtained in this study allows for the propagation models created and tested for SISO systems to be easily extended to MIMO systems, enabling the use of well-known propagation models in MIMO systems.
The scenario and simulation data chosen to validate this concept has shown that, for a given BER performance, MIMO systems using IB-DFE receivers can in fact improve the system, as we should expect. It was shown that, although the signal coverage area can be reduced by , the existence of more independent and simultaneous data streams in MIMO systems improves the user experience and increases the overall capacity of the system.
As future work, it would be interesting to experimentally validate the methodology presented and confirm that the coverage for an actual MIMO system corresponds to the predictions.


