Abstract
Large-scale eco-efficient production of polyoxymethylene dimethyl ethers (PODEn) has garnered wide attention as environmental-friendly diesel additives. Among the various PODEn research studies, the effect of water on the PODEn process is one of the most important research fields. In this work, the effects of water content in feedstock on the reboiler duty of the PODEn process were analyzed by rigorous simulation. To ensure the accuracy of the model, vapor–liquid equilibria (VLE) data of PODE2-H2O were measured and the model was regressed by using the experimental data. Furthermore, the production process consisting of raw material preparation section and PODEn synthesis section was evaluated by comparing it with the various water contents (0, 0.05, 0.10 and 0.15 g/g) in feedstock. We found the reboiler duty in the case of 0.10 g/g water in feedstock was lowest (77.99 MJ/kg), which is even lower than anhydrous case (100.24 MJ/kg). The results suggest that the water can be appropriately allowed in the production, which can reduce the reboiler duty of the PODEn.
1. Introduction
Poly(oxymethylene) dimethyl ethers (PODEn) are environmentally benign diesel additives with the formula of H3C-O-(CH2O)n-CH3(n ≥ 2) [1]. PODEn of chain lengths n = 3–5 have suitable flash points [2] and melting points [3], which could reduce the soot and also, indirectly, NOx during the combustion process in compression ignition engines [4,5,6]. Thus, higher combustion efficiency could be achieved by blending PODEn in diesel [7,8]. Moreover, PODEn can be used as oxygenated fuels to direct oxidation fuel cells [9] and as green solvents for the chemical industry [10,11].
Two kinds of synthesized educts are necessary for the synthesis of PODEn: end-group (CH3O-) providers, such as methylal (DMM), methanol (MeOH), or dimethyl ethers (DME) and chain-group (-CH2O-) providers, such as trioxane (TOX), formaldehyde (FA) or paraformaldehyde (PF) [12,13]. All these providers can be synthesized by methanol at the very start. Poly(oxymethylene) dimethyl ethers is a key research direction for coal-based methanol, facing serious oversupply in China [14]. In the published articles, there are possible synthesis routes and technologies for production of PODEn: DMM/TOX route [15,16,17], DMM/PF route [14,18], DME/ TOX route [19,20], and MeOH/FA solution route [21,22,23]. The routes of DMM/TOX, DME/TOX, and DMM/PF have a high yield of PODE3−5 [14,15], but these routes have high costs due to chain-group providers TOX and PF. In contrast, the route using MeOH/FA solution has a lower yield of PODE3−5 [23,24]. Methylal and PODE2 are the main oligomers in the MeOH/FA solution route due to the Schulz−Flory distribution of PODEn products [25,26,27]. Water in the reactants leads to the decomposition of PODEn, which is the main reason for the decrease of PODE3–5 [4]. Therefore, the selectivity of PODE3−5 can be improved by reducing water content in feedstock. Meanwhile, water not only affects the yield of PODE3–5 but also makes the purification process more complicated [28]. Therefore, the effects of water on the PODEn process represent one of the most important research fields.
Large scale green production of PODEn would be crucial if diesel-PODEn blends are applied to tackle the worldwide formidable air pollution by particulate matter. In the articles, Burger et al. [29] conceptually designed a large scale production in which PODEn was formed from methylal and TOX. Tsinghua University [30] provided a technology synthesizing PODEn from methylal and PF, which was applied in practice in Shandong Yuhuang Chemical Co., Ltd. in China. Schmitz et al. [31] designed a conceptual process for the production of PODEn by the route using the MeOH/FA solution. In addition to the above manufacturing procedure, there are also many articles about the PODEn process [32,33]. In the articles, there is no detail on the effects of water content on the manufacturing procedure and it still needs to be explored. In the present work, we will focus on the effects of water content on the PODEn process, especially energetic efficiency. To attain this goal, a complete PODEn process with lower water content needs to be established, which our group has already provided [34]. We continue to develop this process in this work. We explored by rigorous simulation that methylal is separated as a distillate product from mixtures containing formaldehyde, water, methanol, methylal, and PODE2. Furthermore, the production process consisting of raw material preparation section and PODEn synthesis section was evaluated by comparing it with the various water contents in the feedstock.
To be able to simulate the process, the physico-chemical model used in the present work needs to be built up. Starting with the pioneering work [28], the model was developed and tested [35,36,37,38,39,40,41,42,43,44,45]. In the model, the non-idealities in the liquid phase are taken into account using a UNIFAC-based activity coefficient model. In very recent work, the model of Schmitz et al. [46] parametrizes and validates the model using only liquid–liquid equilibrium and not vapor–liquid equilibrium in PODE2-H2O systems. In this work, PODE2 is a light key component that affects the separation to obtain the product. The vapor–liquid equilibrium of PODE2–H2O has influences on analysis and simulation. Therefore, the present work closes the gap by measuring and regressing vapor–liquid equilibria data of PODE2-H2O so that we can ensure the accuracy of the model.
2. Thermodynamic Data Acquisition
2.1. Materials
Methoxy(methoxymethoxy)methane(PODE2) was supplied by Chengdu Organic Chemicals Co., Ltd. (Chengdu, China), Chinese Academy of Sciences. It was purified by batch distillation in a lab-scale glass distillation column. The mass fraction is 0.995 g/g, satisfying the requirement of phase equilibrium experiment. One-component Karl–Fischer reagent for volumetric method (Pyridine-free) was obtained from Tianjin Concord Technology Co., Ltd. (Tianjin, China). Pure water was provided by Yong Qingyuan Distilled Water Co., Ltd. (Tianjin, China).
2.2. Apparatus
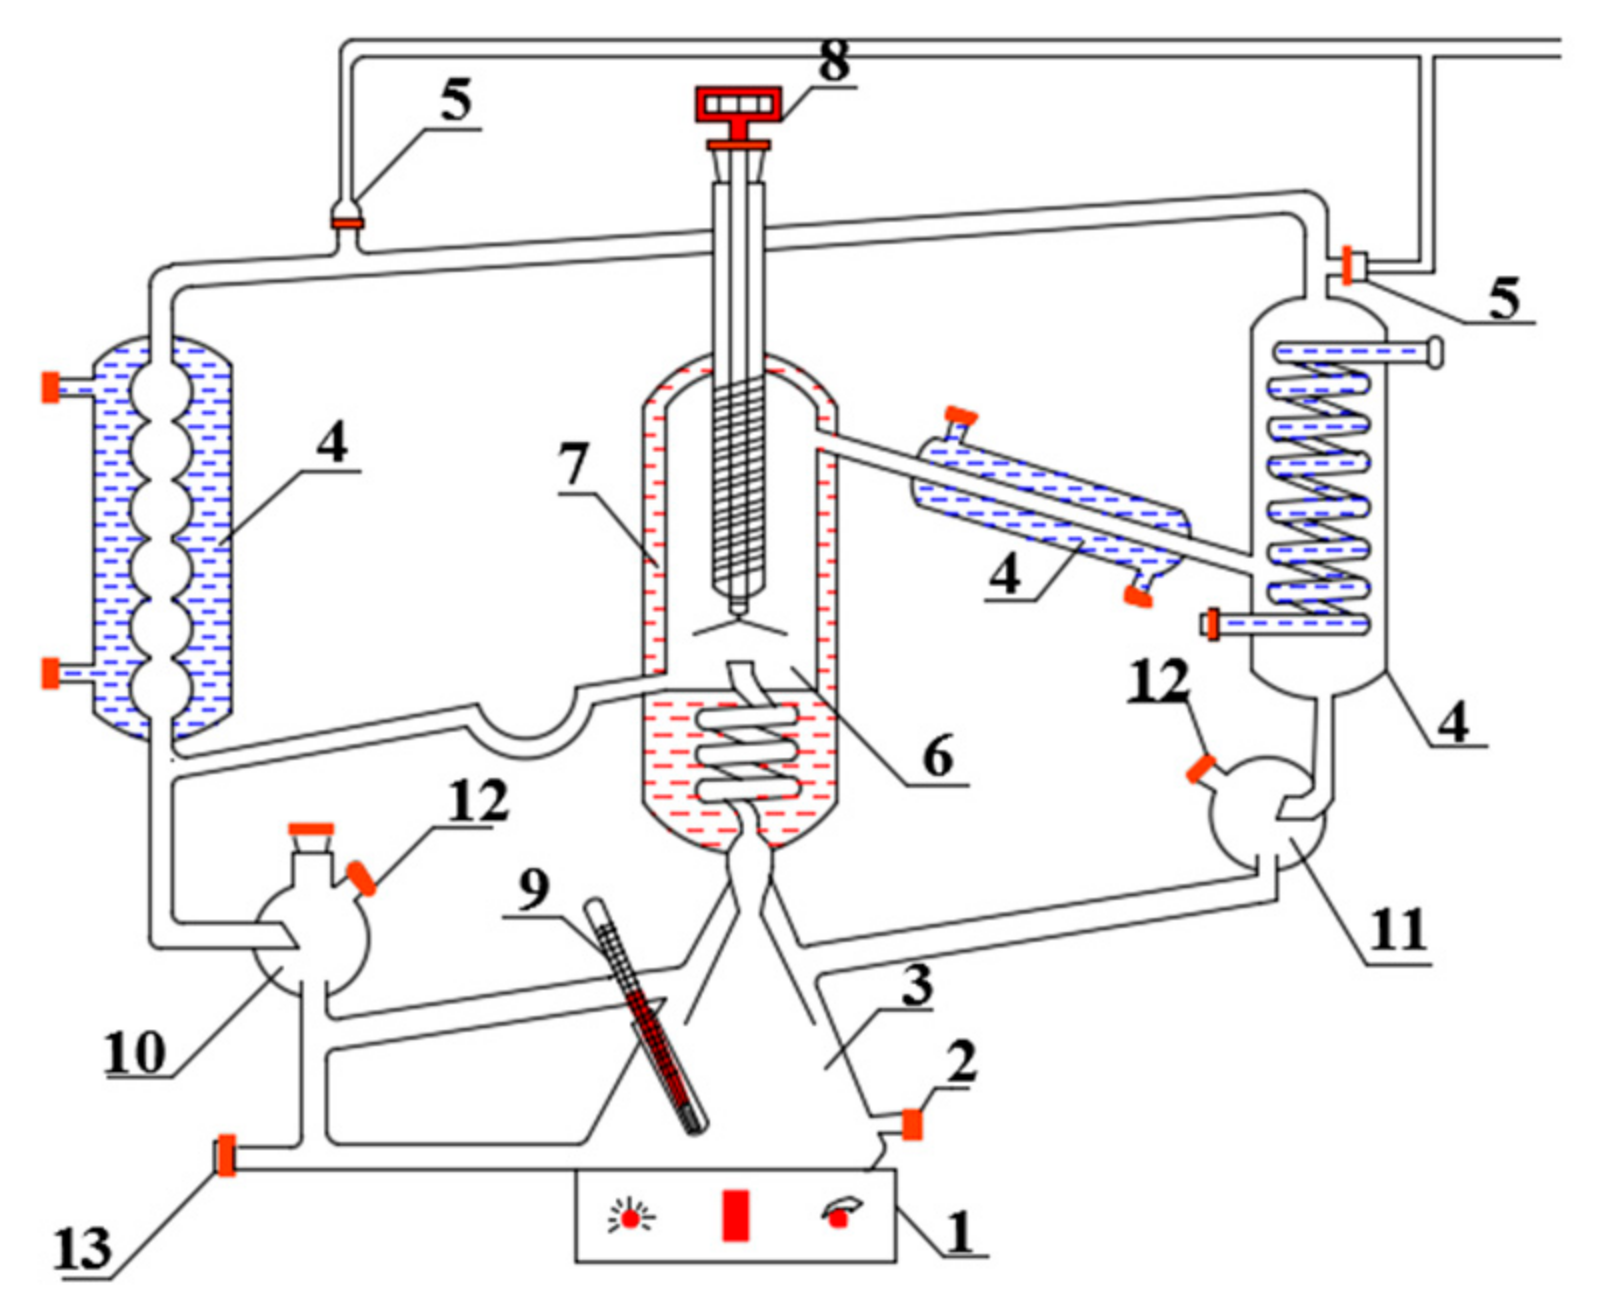
The experimental apparatus used here to obtain and analyze the phase equilibria for VLE and batch distillation is described in detail in previous works [34]. The double-circulating vapor−liquid equilibrium cell is shown in Figure 1. The equilibrium temperatures were measured with a Pt-100 thermometer (model 1552A-12-DL, provided by Fluke Calibration (Shanghai, China)), with an accuracy of ±0.01 K.
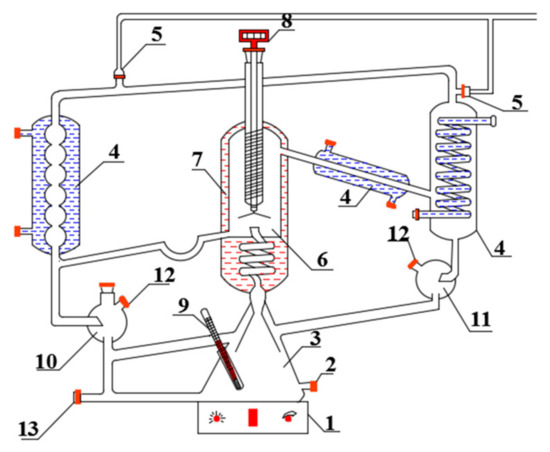
Figure 1.
Vapor–liquid equilibrium instrument.
1—magnetic heating plate; 2—feed port; 3—boiling chamber; 4—condenser; 5—vacuum interface; 6—balance room; 7—insulation layer; 8—digital thermometer; 9—thermocouple thermometer; 10—liquid sampling port; 11—sampling port for gas phase (condensate); 12—sample room; 13—drain port.
2.3. Procedure and Analysis
In a typical experiment, the light component is added to the still, and then the content of the heavy component in the still is increased in intervals by a syringe. In this equilibrium process, both the vapor and the liquid phase are continuously circulating to ensure that equilibrium can be established. In each experiment, the equilibrium between the vapor and the liquid phases was assumed when the temperature remained constant for 30 min or longer, and the vapor and liquid samples were withdrawn simultaneously by sampling port for gas phase and liquid sampling port, respectively. The equilibrium temperature was measured with a Pt-100 thermometer.
The overall mass fraction of water was analyzed by Karl–Fischer titration. The analysis was operated at least three times to get accurate results. The relative error for each of the three methods is typically below 0.02 g/g and the sum of mass fraction is between 0.97 g/g and 1.03 g/g. The overall mass fractions of all components were analyzed and normalized to a sum of 1 g/g by proportional weighting.
2.4. Vapor–Liquid Equilibrium Measurement Results
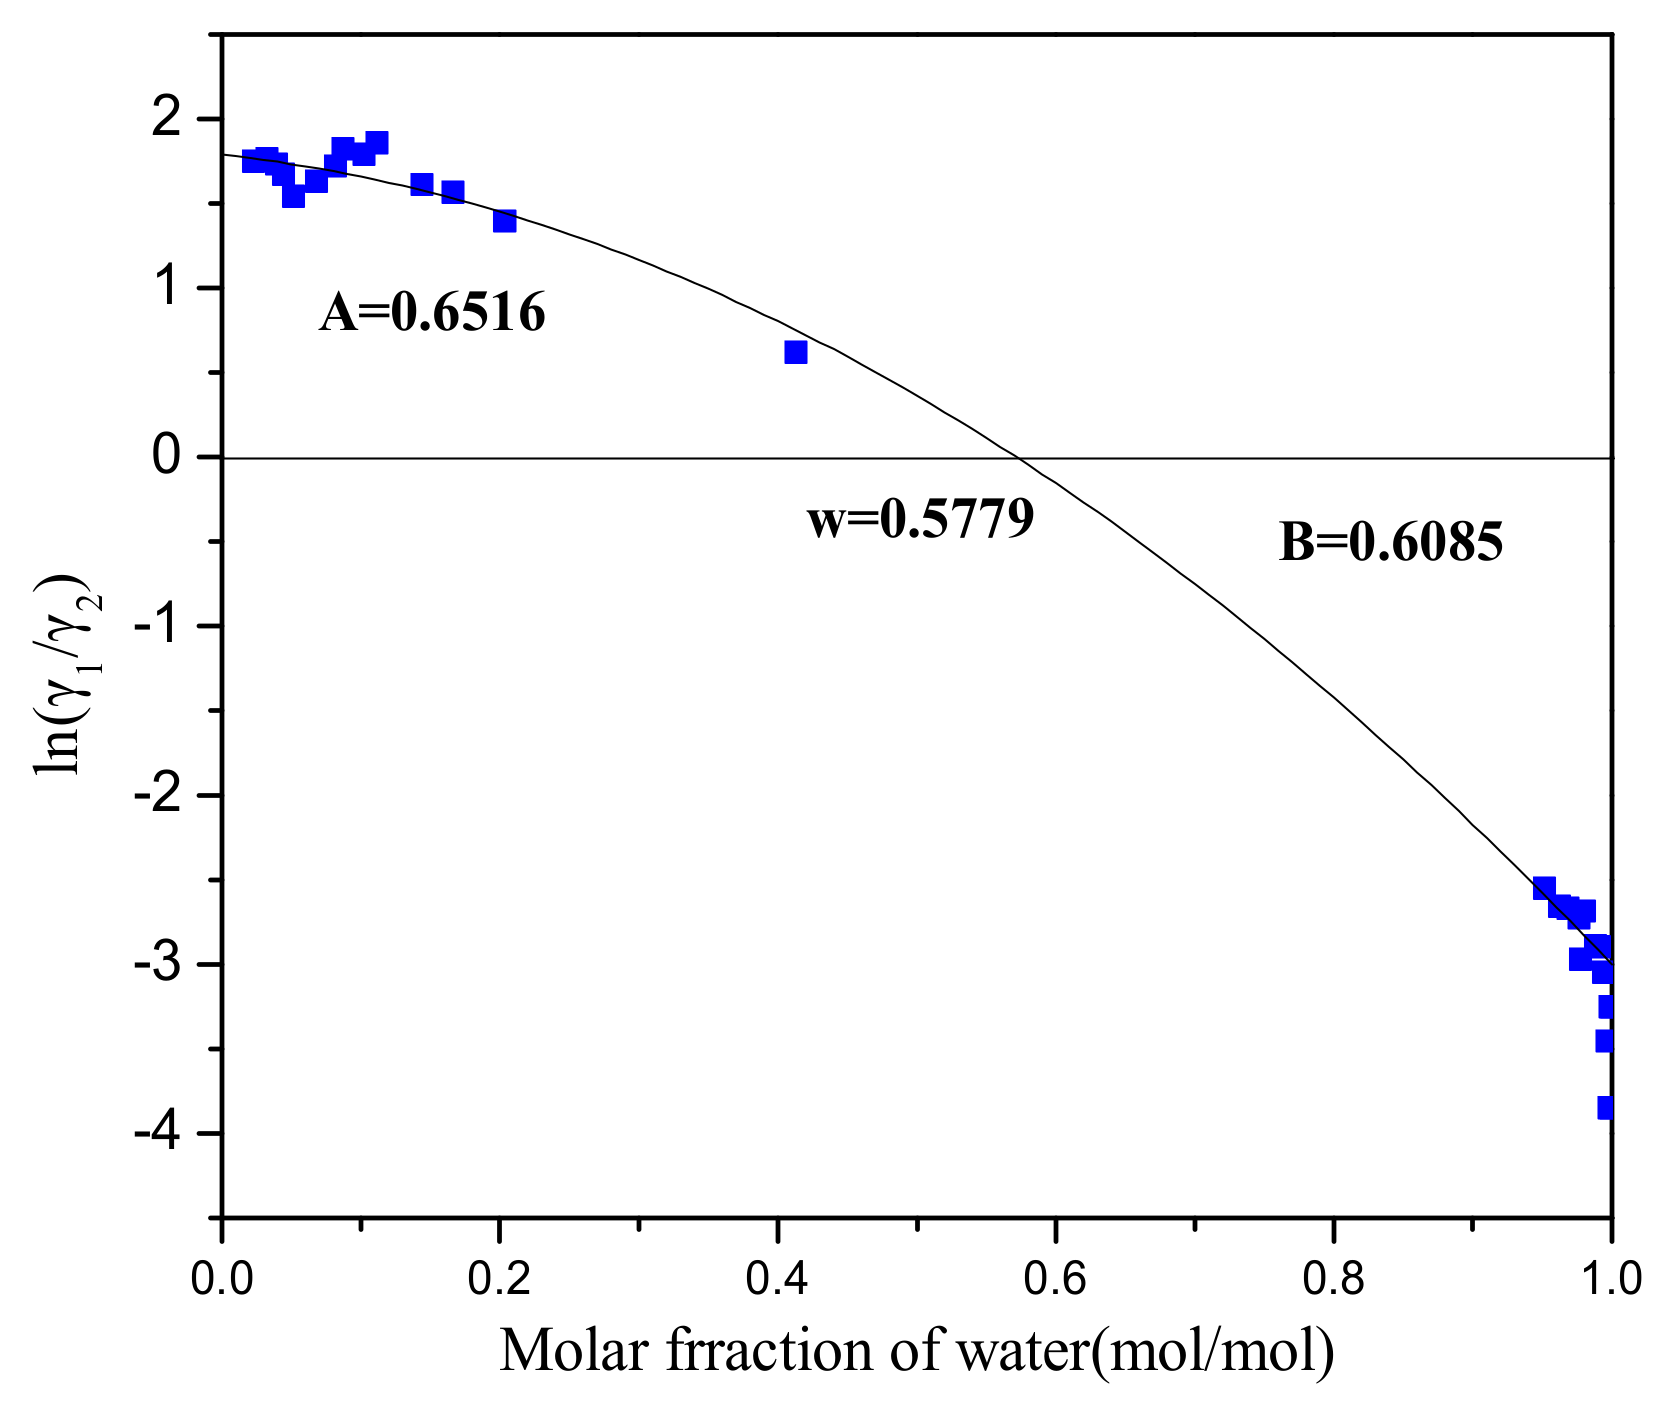
Numerical results of the isobaric VLE measurements carried out in the present work for the system H2O (1) + PODE2 (2) are given in Supplementary Materials Table S1. Experiments showed that an azeotrope exists between water and PODE2. In this paper, we verified the experimental data by means of the Herington test for thermodynamic consistency [47]. The plot of ln(γ1/γ2)—x1 is illustrated in Figure 2, and it provides that the criteria value of |D − J| is = 4.50 < 10, indicating that the measured VLE data are in good agreement with thermodynamic consistency.

Figure 2.
Thermodynamic consistency test. (A: The area above the x-axis; B: The area below the x-axis; ω: The point of intersection with the x-axis).
2.5. Parameter Regression
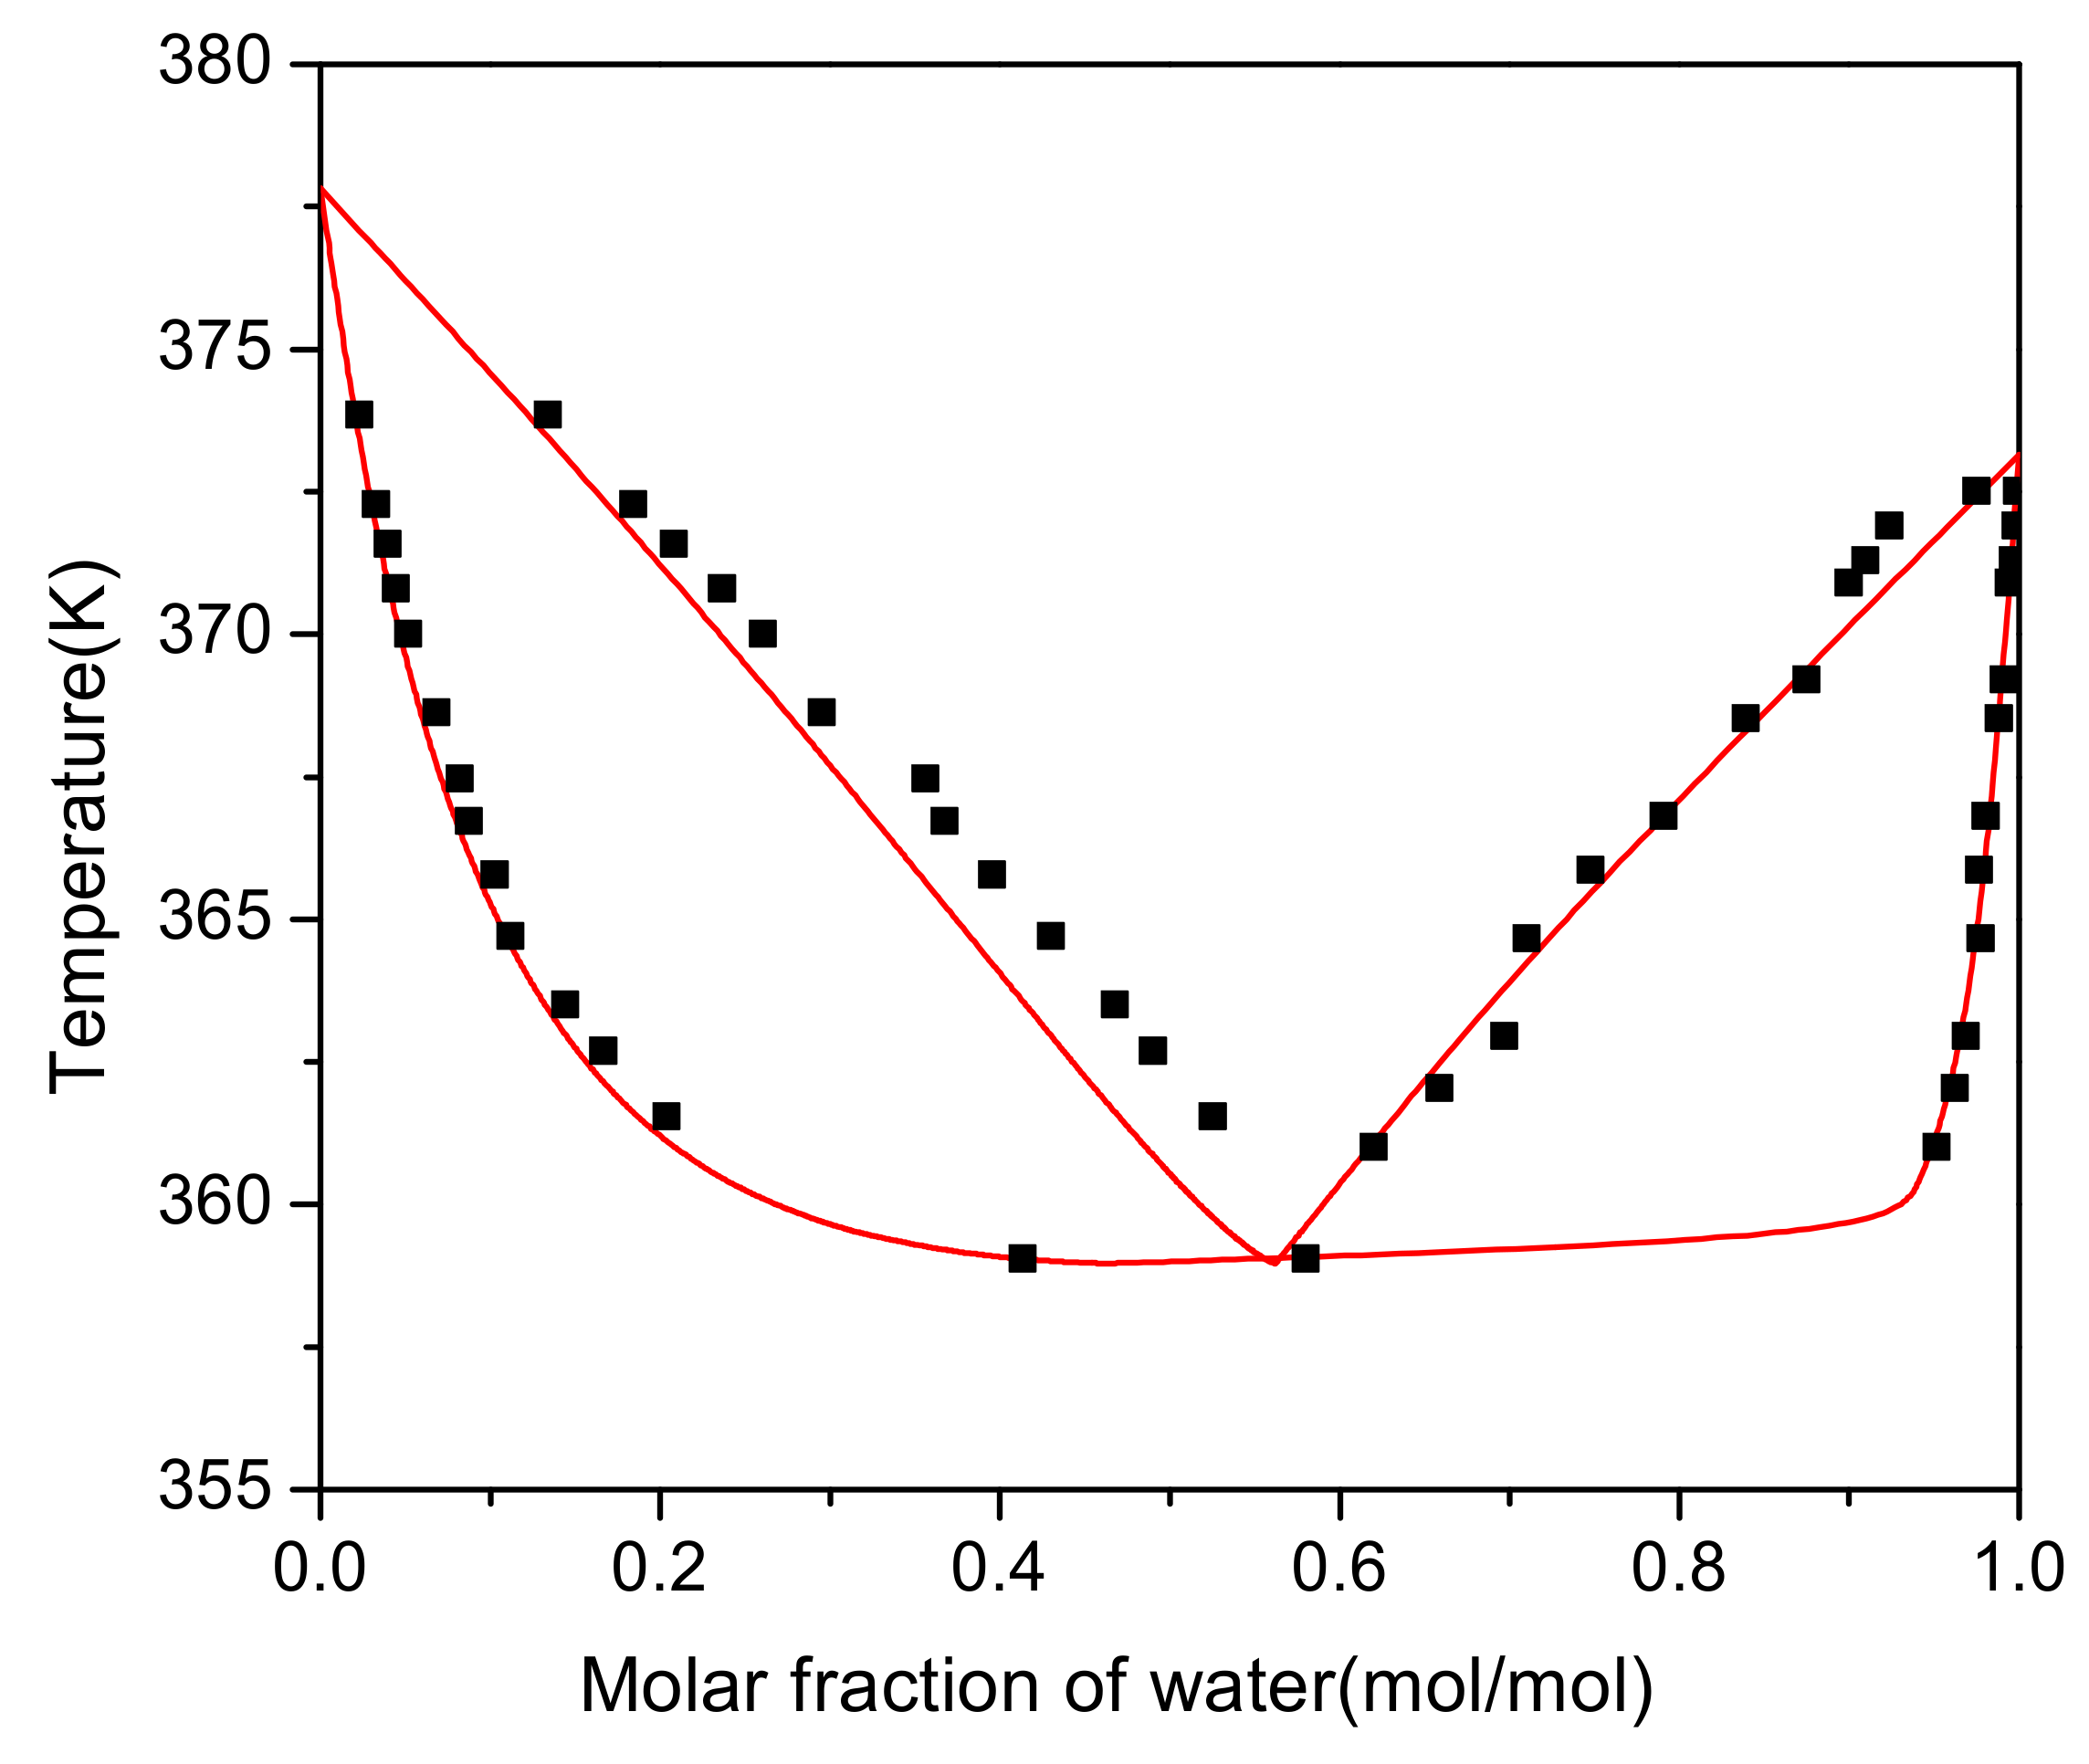
For this system, the interaction parameters between group (CH2O)OME and group H2O (parameters a2,10 and a10,2, c.f. Table S4) were fitted based on the experimental VLE data. Group (CH2O)OME is part of PODEn as distinguished from HFn and MGn, c.f. Table S3. In the parameter fit, the deviation between the experimental and calculated mass fractions in the vapor and the liquid phase was minimized using a maximum-likelihood method. The parameters carried out using the software Aspen Plus V8.4 were a2,10 = 151.112 − 0.8776T/K and a10,2 = 615.95. As can be seen from Figure 3, liquid phase has good consistency which means regression is accurate. There is a large deviation in the vapor phase with a range 0.3–0.5. The reason is that the vapor is identified as an ideal gas and is divorced from reality.

Figure 3.
Vapor–liquid equilibrium diagram. (⯀) Experimental results. Lines: Model.
3. Modeling
3.1. Physico-Chemical Model
A formidable challenge lies in the thermodynamic model used for formaldehyde-containing solutions. The system used in this paper (formaldehyde + methanol + water) performs complicated thermodynamic behaviors. Formaldehyde (FA, CH2O) reacts with water (H2O) to poly(oxymethylene) glycols (MGn, HO−(CH2O)n−H) [48]. The reactions are described by Equations (1) and (2).
Formaldehyde reacts with methanol (MeOH, CH3OH) to poly(oxymethylene) hemiformals (HFn, HO−(CH2O)n−CH3) [48]. The reactions of formaldehyde with methanol are described by Equations (3) and (4).
Equations (1)–(4) occur in the system everywhere without any catalyst, and their equilibria are such that the amount of monomeric formaldehyde is negligible and most of them form oligomers. In this work, we describe the ternary mixture with UNIFAC model and treat the unstable species HFn and MGn as electrolytes in the feature of the Chemistry section of Aspen Plus. In the gas phase, it ignores Equations (2) and (4), and since the vapor pressure of MGn and HFn with n ≥ 2 is deemed sufficiently low [48], the influence would be imperceptible even if there is an estimation deviation. The chemical equilibrium of Equations (1)–(4) in the aqueous and methanol solution is modeled by activity-based chemical equilibrium constants, which are taken from Drunsel et al. [49] In this paper, the maximal chain length of MGn and HFn in this model is limited to n = 8. The species MGn and HFn for n ≤ 3 are the main oligomers, and increasing the chain length does not significantly affect the calculation results [49]. In reactive systems containing formaldehyde, methanol, and water, two different ways of describing the composition are used. In this work, overall concentrations are depicted instead of the true composition of all components.
In accordance with the original models [28], we considered an ideal vapor phase and describe non-ideality of the liquid phase through the UNIFAC model. The structural groups in the system (FA + water + mathanol + methylal + PODEn + TOX) are given in Table S2, which also contains the size parameters R and surface parameters Q of the groups. The UNIFAC group assignment is given in Table S3. The UNIFAC group interaction parameters are given in Table S4. Interaction parameters between groups 1−9 were adopted from Kuhnert et al. [45], and group 10, namely (CH2O)OME, was adopted from Schmitz et al. [44].
3.2. Chemical Model
The PODEn are chemically stable in neutral and weakly alkaline conditions. In acidic environments, the following reactions occur only in the presence of a catalyst. The formation of the PODEn with n > 1 from methylal and highly concentrated formaldehyde solution are described according to Equations (5) and (6).
In this work, two side products were observed: methanol and trioxane (TOX) [50]. The appearance of methanol can formally be explained by Equations (7) and (8). The appearance of trioxane is not delved into too deeply in this work.
The chemical equilibrium constants of Equations (5) and (6) were adopted from Zheng et al. [27,30] In all reactions, the maximal chain length of PODEn is limited to n=8. PODEn≤6 is the main polymer, therefore, there is no need to improve the chain length [30].
3.3. True Composition and Overall Composition
In reactive systems containing formaldehyde, water, and methanol, two different ways of describing the composition are used. Besides the true composition of all components, the overall concentrations are given. The poly(oxymethylene) glycols would completely decompose into formaldehyde and water (see Section 3.1). Furthermore, poly(oxymethylene) hemiformals would completely decompose into formaldehyde and methanol (see Section 3.1). The true oncentrations quantify all poly(oxymethylene) glycols and poly(oxymethylene) hemiformals. However, it is not intuitive and complex enough. In this work, overall concentrations are depicted when results are presented.
4. Process Design and Simulation
4.1. Process Description
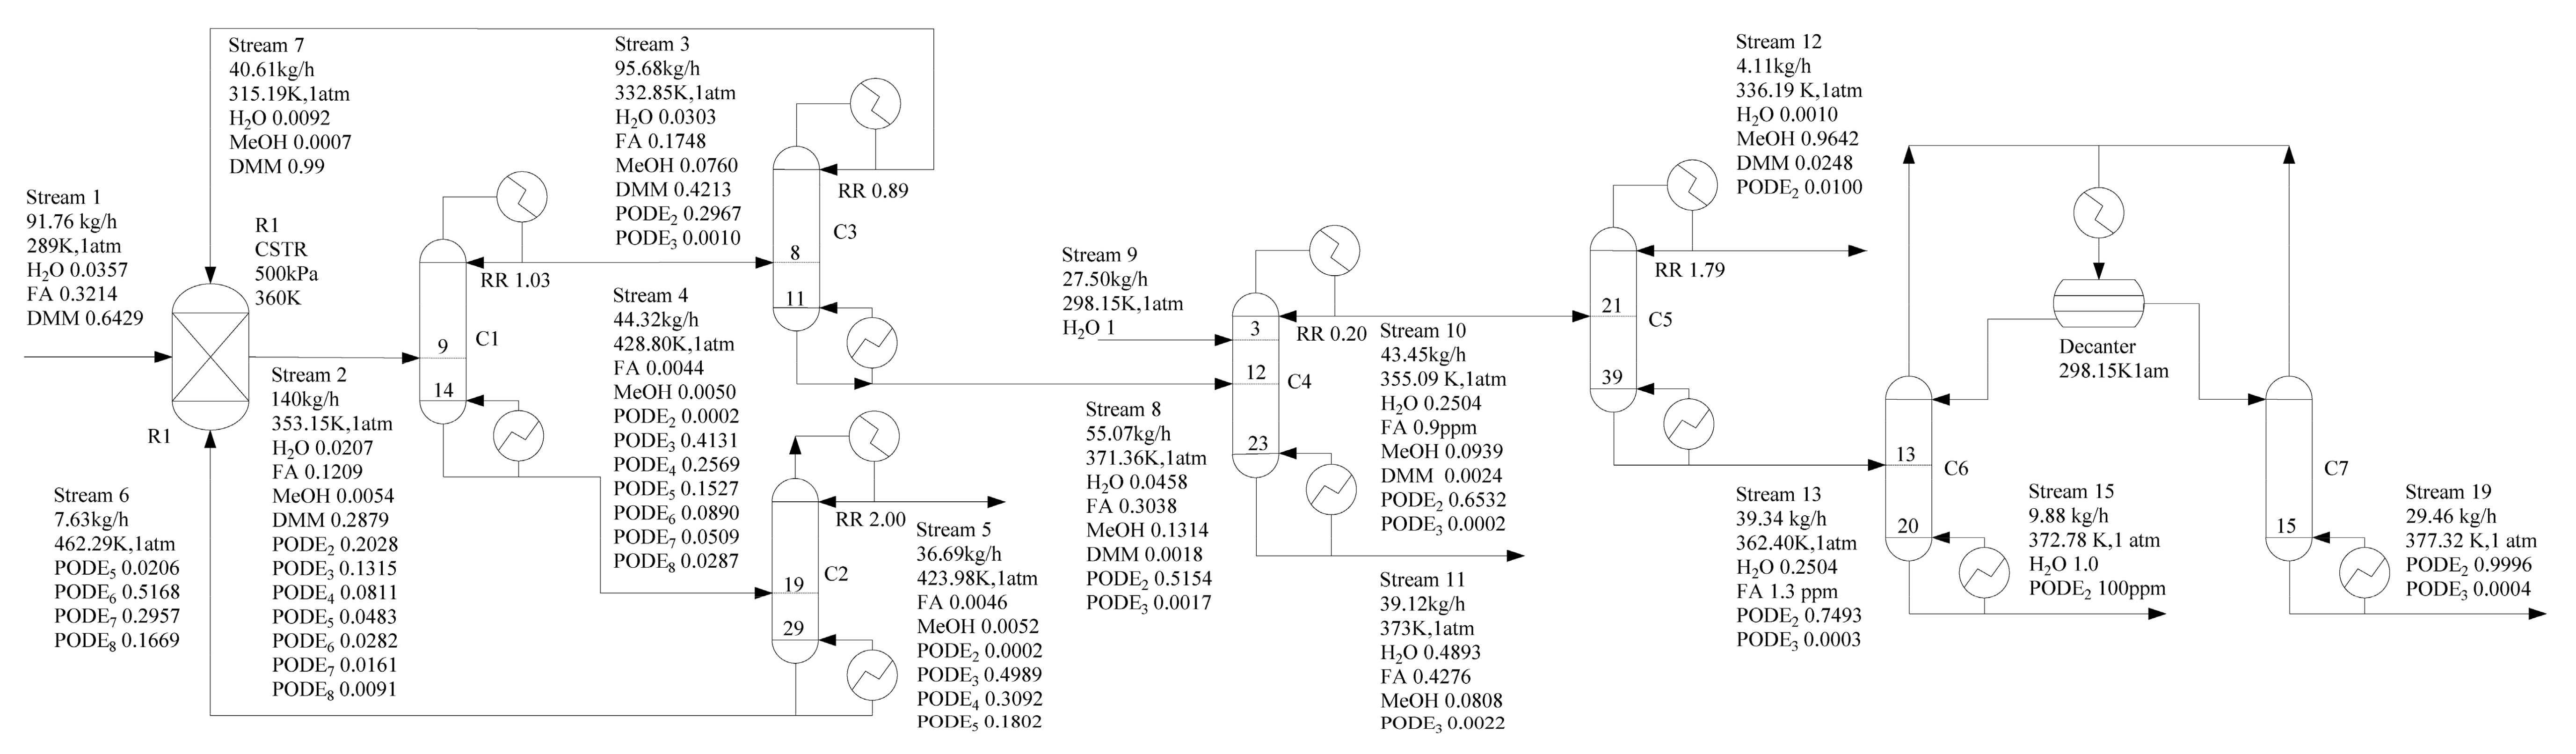
Based on our previous work [34], a flowsheet of the novel PODEn production process is depicted in Figure 4. There are two main differences between this work and the original process. One is that the column C3 separates methylal as a distillate product (stream 7) from mixtures containing formaldehyde, water, mathanol, methylal, and PODE2 (stream 8), which are recycled back to the reactor. It is well known that an azeotrope exists between methanol and methylal [51]. However, experimental results from our batch distillation experiments show that formaldehyde has effects on the methylal–methanol azeotrope, therefore, we can obtain high-purity methylal. The batch distillation experiments are given in supporting information. We will explore the reasons for the rigorous simulation in the following section. The other is water and PODE2 is separated by heterogeneous azeotropic distillation. Water is obtained from column C6 as bottom product (stream 15), and PODE2 is obtained from column C7 as bottom product (stream 19).
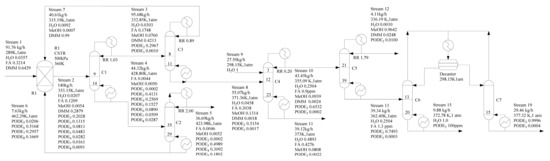
Figure 4.
Optimized process design flowsheet (mass fraction).
The detailed description is as follows: the feed stream 1, containing methylal, formaldehyde and H2O, is fed to the acidic catalyzed reactor R1 to produce PODEn after mixing with the recycle streams 6 and 7. The reactor outlet stream 2 comprising formaldehyde, H2O, methanol, methylal, and PODEn of various chain lengths is fed to a rectifying sequence to separate main products of PODE3−5 and recycle other components. The column C1 separates PODEn of chain lengths n ≥ 3 as the bottom product (stream 4), which avoid formaldehyde polymerization when all other light components are distilled together as overhead products (stream 3). Column C2 separates target products of PODE3−5 and recycles other components back to the reactor. Column C3 separates methylal as an overhead product (stream 7) from mixture formaldehyde, H2O, methanol, methylal and PODE2 (stream 8) which are recycled back to the reactor. Column C4 using water as entrainer can separate formaldehyde from the system (PODE2 + formaldehyde + H2O + methanol). Thus, formalin can be segregated from the intricate mixture by stream 11. For column C5, it is proved that methanol is obtained in a sharp split as a top product (stream 12), and PODE2 with water is obtained as the bottom product (stream 13). Finally, water is obtained from column C6 as the bottom product (stream 15), and PODE2 is obtained from column C7 as the bottom product (stream 19) by heterogeneous azeotropic distillation. PODE2 can be used as a product or be recycled to the reactor R1 by an additional pipeline.
The principles of optimization are as follows: by controlling the same product quality through reflux ratio and quantity of distillate, the number of theoretical plates and feed plate is optimized. When increasing the number of theoretical plates has little influence on the energy consumption of the reboiler, the number of theoretical stages is determined. After determining the number of theoretical stages, it is possible to find the feeding plate with the lowest energy consumption of the reboiler. In this way, the separation conditions of the distillation column can be obtained.
4.2. Effects of FA/MeOH Ratio and Water Content on Methylal Separation
Methylal needs to be returned to the reactor and separated from the mixture containing formaldehyde, water, methanol, methylal, and PODE2. However, batch distillation experimental results show that the high-purity methylal, as distillate product, can be obtained from column C3. The reasons for this phenomenon were explored. However, this system involving formaldehyde, methanol and water is complicated, therefore, it is difficult to discuss the influences of each of these components. The FA/MeOH ratio and water content have effects on effluent from the top of the distillation column. In this work, we just focus on the influence of the FA/MeOH ratio and the water content in Stream 3 at normal pressure to simplify the problem. The result is as follows:
The effect of FA/MeOH ratio is shown in Figure 5. The conditions are far enough to meet the separation requirements that the number of plates (N) is 40 and the reflux ratio (RR) is 2. With the increasing FA/MeOH ratio, the concentration of methylal from the top of the distillation column first increases and then decreases, and there is a peak value between 1.4 and 1.5. The reason is that methanol reacting with formaldehyde to polymers of HFn from the Equations (3) and (4) are withdrawn at the bottom of the distillation column. According to the results, in order to gain higher concentrations of methylal, it is beneficial to ensure that the FA/MeOH ratio is between 1.4 and 1.5.
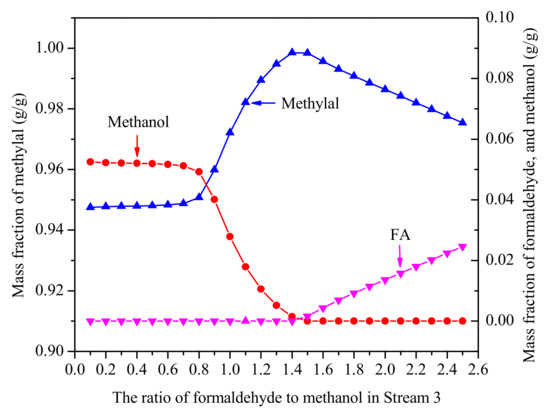
Figure 5.
The effect of FA/MeOH ratio on effluent from the top of distillation column. (N = 40, RR = 2, no water).
The effect of water content is shown in Figure 6a,b. Two orientations need to be discussed in the conditions (N = 40, RR = 2). One is when FA/MeOH ratio is less than 1.4, and the other is greater than 1.5. Therefore, FA/MeOH ratio was selected 1 and 2 respectively. FA/MeOH ratio of 1 is shown in Figure 6a. At this point, the main composition of mixture from the top of the distillation column is methylal, trace of methanol, trace of water and almost no formaldehyde. It is not necessary to increase the water content without restriction and limit the water content to 0.15, as higher concentrations of water lead to considerably decreased yields of PODEn in the reactor [31]. With the increase of water content, water appeared, methanol content decreased and methylal content increased. The results showed that the presence of water was beneficial to increase the concentration of methylal. When the FA/MeOH ratio is less than 1.4, formaldehyde is not enough to completely react with methanol. When water is added to the system, water-PODE2 azeotrope is more stable than FA-MeOH-PODE2 azeotrope which appears in physico-chemical model. Formaldehyde is released to form HFn to combine more methanol, so that the content of methylal increases and the content of methanol decreases.

Figure 6.
The effect of water content on effluent from the top of distillation column. ((a)—FA/MeOH ratio = 1, (b)—FA/MeOH ratio = 2).
A FA/MeOH ratio of 2 is shown in Figure 6b. The results show that the content of methylal increases first and then decreases with the increase of water content, formaldehyde decreases first and then disappears, methanol appears first and then increases, and water also appears in the substances on the top of the distillation column. It can be concluded that when the FA/MeOH ratio is greater than 1.5, appropriate water content is helpful to increase the content of methylal. When the FA/MeOH ratio is higher than 1.5, excessive formaldehyde is enough to completely react with methanol. When water is added to the system, water reacts with formaldehyde to the polymers of MGn from Equations (1) and (2). Therefore, the concentration of formaldehyde at the top of the distillation column decreases and the concentration of methylal increases. When limits are exceeded, water competes with formaldehyde. The result is a decrease of methylal and an increase of methanol.
The analysis of FA/MeOH ratio and water content helps us to understand this complex reactive multicomponent mixture. It is generally known that the product composition of the reaction is different when formaldehyde with different water content is added to the reactor as feed. At the same time, it also affects the separation of methylal due to different water content and FA/MeOH ratio. The separation of methylal with different water content in formaldehyde as feed (stream 1 in Figure 4) is shown in Figure 7. The results indicate that high purity methylal can be obtained in the range of 0.05-0.20 g/g water content in formaldehyde. If the distillate product is returned to the reactor, the range of less than 0.05 g/g water content in formaldehyde is also allowed.
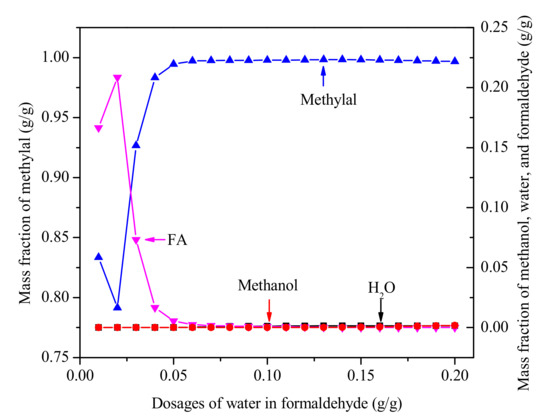
Figure 7.
The purity of methylal with different water content of formaldehyde. (Methylal/CH2O mass ratio 2:1, N = 40, RR = 2).
4.3. Effects of Water Content on Reboiler Duty per Unit Mass of PODE3–5
Generally, the production process of PODEn consists of raw material preparation section and PODEn synthesis section. To explore the effects of water content on energy consumption per unit mass of PODE3-5, the energy of the chain-group providers with different water content should also be considered. The chain-group providers we chose was trioxane. Trioxane is a very important raw material in the production of PODEn. The analysis of trioxane is representative, which helps us understand why the route DMM/TOX costs more. The separation process with different water content is different. However, producing PODEn in different processes need to meet the same constraints. These constraints are given in Table 1. To simplify issues, the energy consumption we discuss is just reboiler duty, which basically reflects the level of energy expenditure. Power for the transfer of material is not considered.

Table 1.
Constraints used for the optimization of the process.
According to trioxane preparation process [33,52] given in Figure 8, we now separate chain-group providers containing formaldehyde, trioxane and water as the bottom product from column T3 by changing the bottoms rate. For reboiler duty per unit mass of the chain-group providers containing formaldehyde, trioxane, and water, the reboiler duty of each equipment in the process is shown in Figure 9. It can be seen that allowing water and formaldehyde in feedstock can reduce reboiler duty. As the allowable water content and formaldehyde increase, the circulation does not have to be increased to improve the quality of the product, which has a significant impact on column T2.

Figure 8.
Flowsheet of the highly concentrated chain-group providers containing formaldehyde, trioxane, and water production process.
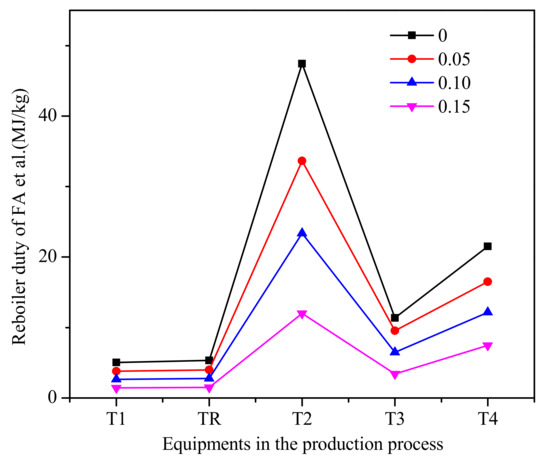
Figure 9.
The reboiler duty of each equipment in the process of formaldehyde et al. (Methylal/CH2O mass ratio 2:1).
For the anhydrous case, the process of PODEn produced from trioxane and methylal developed by Burger et al. [29] is applied (see Figure 10). For other water content, the process of PODEn produced from methylal, trioxane, formaldehyde, and water by from our work is applied (see Figure 4).
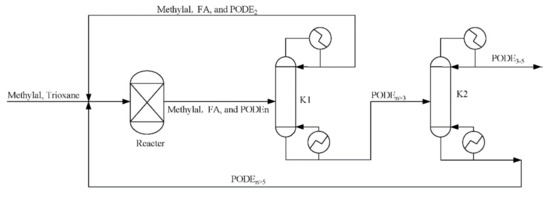
Figure 10.
Flowsheet of the polyoxymethylene dimethyl ethers (PODEn) from methylal and trioxane.
The reboiler duty of each equipment in the process is shown in Figure 11. As can be seen from Figure 11, the reboiler duty of column C1 and C2 increases with the increase of water content. The role of the column C1 is the separation of PODEn≥3 as the bottom product from mixtures of formaldehyde, water, methanol, methylal, and PODEn≥2. The role of column C5 is separating methanol as a top product from mixtures of water, methanol, and PODE2. This means that the reasons for the increase of reboiler duty are the increase of methanol in the reactor by decomposition and the decrease in the conversion rate of PODEn. It should be noted that since only the reboiler duty is considered, the accurate cost of the product needs further analysis required to decide which PODEn synthesis process is economic.
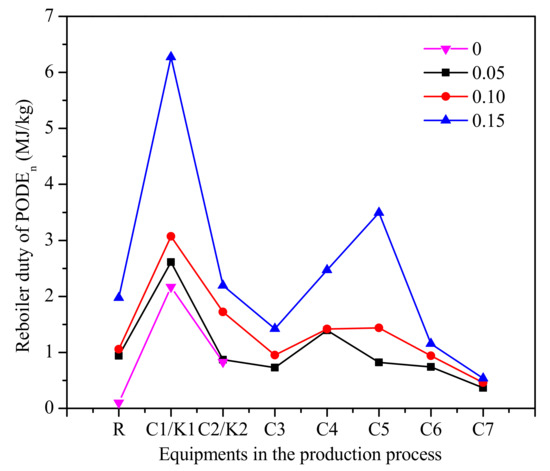
Figure 11.
The reboiler duty of each equipment in the process of PODEn. (Methylal/CH2O mass ratio 2:1).
Total energy expenditure per unit mass of PODE3-5 with different water content is shown in Figure 12. The results showed an impressive and rapid impact on reboiler duty per unit quality product. With the increase in water content, total energy expenditure decreases. When the water content is 0.15 g/g, the total reboiler duty increases owing to the decrease in the yield of PODE3−5. Total energy expenditure per unit mass of PODE3−5 is affected by two factors: raw material preparation section and PODEn synthesis section. As the concentration of formaldehyde and water in trioxane increases, the reboiler duty decreases. However, with the increase of water content, the conversion rate of PODE3−5 decreased and the reboiler duty increased. Therefore, we can effectively reduce the reboiler duty of PODEn by allowing adequate water in the production process.
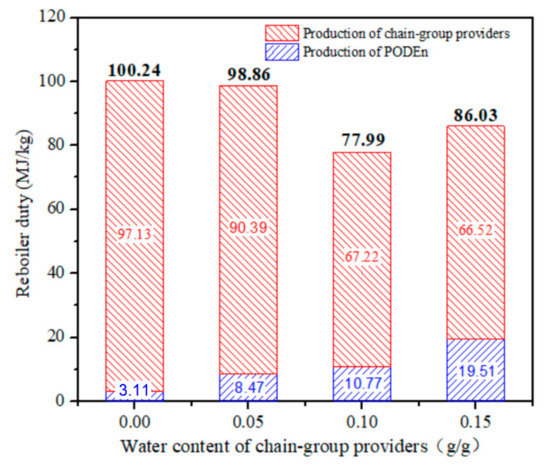
Figure 12.
Reboiler duty per unit mass of product with different water content. (Methylal/CH2O mass ratio 2:1).
Finally, we simulated the process synthesized by chain-group providers with 0.10 g/g water, and methylal. The specific calculation results are shown in Figure 4.
5. Conclusions
In this work, the effects of the ratio of water content on the separation procedure were analyzed by means of process simulation. The water content not only affects the separation process but also the energy of the product. Production processes with levels of water content (0, 0.05, 0.10, and 0.15 g/g) in feedstock were evaluated. We found the reboiler duty in the case of 0.10 g/g water in feedstock was lowest (77.99 MJ/kg), which is even lower than anhydrous case (100.24 MJ/kg). The water can be appropriately allowed in production, which can reduce the reboiler duty of the product.
Supplementary Materials
The following are available online at https://www.mdpi.com/2076-3417/10/21/7474/s1, Table S1: Experiment data of H2O (1) + PODE2 (2).(p = 101.3kPa), Table S2: UNIFAC structural groups with size and surface parameters, Table S3: UNIFAC group assignment, Table S4: The UNIFAC group interaction parameters, Table S5: Raw material composition and chemical properties of the materials, Table S6: Experimental results of batch distillation.
Author Contributions
Conceptualization, Z.H.; methodology, Z.H.; software, C.F.; validation, Z.H., and C.F.; formal analysis, C.F.; investigation, C.F.; resources, Z.H.; data curation, C.F.; writing—original draft preparation, C.F.; writing—review and editing, C.F.; visualization, C.F.; supervision, Z.H.; project administration, Z.H.; funding acquisition, Z.H. All authors have read and agreed to the published version of the manuscript.
Funding
This research was funded by the National Key R&D Program of China (2018YFB0604900).
Conflicts of Interest
The authors declare no conflict of interest.
References
- Boyd, R.H. Some Physical Properties of Polyoxymethylene Dimethyl Ethers. J. Polym. Sci. 1961, 50, 133–141. [Google Scholar] [CrossRef]
- Kang, M.-R.; Song, H.-Y.; Jin, F.-X.; Chen, J. Synthesis and physicochemical characterization of polyoxymethylene dimethyl ethers. J. Fuel Chem. Technol. 2017, 45, 837–845. [Google Scholar] [CrossRef]
- Lautenschütz, L.; Oestreich, D.; Seidenspinner, P.; Arnold, U.; Dinjus, E.; Sauer, J. Physico-chemical properties and fuel characteristics of oxymethylene dialkyl ethers. Fuel 2016, 173, 129–137. [Google Scholar] [CrossRef]
- Burger, J.; Siegert, M.; Ströfer, E.; Hasse, H. Poly(oxymethylene) dimethyl ethers as components of tailored diesel fuel: Properties, synthesis and purification concepts. Fuel 2010, 89, 3315–3319. [Google Scholar] [CrossRef]
- Härtl, M.; Seidenspinner, P.; Jacob, E.; Wachtmeister, G. Oxygenate screening on a heavy-duty diesel engine and emission characteristics of highly oxygenated oxymethylene ether fuelOME1. Fuel 2015, 153, 328–335. [Google Scholar] [CrossRef]
- Lumpp, B.; Rothe, D.; Pastötter, C.; Lämmermann, R.; Jacob, E. Oxymethylene ethers as diesel fuel additives of the future. MTZ 2011, 72, 34–38. [Google Scholar] [CrossRef]
- Liu, H.; Wang, Z.; Wang, J.; He, X. Improvement of emission characteristics and thermal efficiency in diesel engines by fueling gasoline/diesel/PODEn blends. Energy 2016, 97, 105–112. [Google Scholar] [CrossRef]
- Li, B.; Yoo, K.H.; Wang, Z.; Boehman, A.L.; Wang, J. Experimental and Numerical Study on Autoignition Characteristics of the Gasoline/Diesel/Ethanol and Gasoline/Diesel/PODE/Ethanol Fuels. Energy Fuels 2019, 33, 11841–11849. [Google Scholar] [CrossRef]
- Baranton, S.; Uchida, H.; Tryk, D.A.; Dubois, J.L.; Watanabe, M. Hydrolyzed polyoxymethylenedimethylethers as liquid fuels for direct oxidation fuel cells. Electrochim. Acta 2013, 108, 350–355. [Google Scholar] [CrossRef]
- Liu, Q.; Zhang, X.; Ma, B. Solubility of 2-Ethylanthraquinone in Binary Mixtures of Oligooxymethylene Dimethyl Ethers with Different Number of CH2O Groups of n = 2, 3, and 4 from 293.15 to 343.K. J. Chem. Eng. Data 2016, 61, 3254–3265. [Google Scholar] [CrossRef]
- Schappals, M.; Breug-Nissen, T.; Langenbach, K.; Burger, J.; Hasse, H. Solubility of Carbon Dioxide in Poly(oxymethylene) Dimethyl Ethers. J. Chem. Eng. Data 2017, 62, 4027–4031. [Google Scholar] [CrossRef]
- Zhao, Q.; Wang, H.; Qin, Z.-F.; Wu, Z.-W.; Wu, J.-B.; Fan, W.-B.; Wang, J.G. Synthesis of polyoxymethylene dimethyl ethers from methanol and trioxymethylene with molecular sieves as catalysts. J. Fuel Chem. Technol. 2011, 39, 918–923. [Google Scholar] [CrossRef]
- Liu, H.; Wang, Z.; Li, Y.; Zheng, Y.; He, T.; Wang, J. Recent progress in the application in compression ignition engines and the synthesis technologies of polyoxymethylene dimethyl ethers. Appl. Energy 2019, 233–234, 599–611. [Google Scholar] [CrossRef]
- Zheng, Y.; Tang, Q.; Wang, T.; Liao, Y.; Wang, J. Synthesis of a Green Fuel Additive Over Cation Resins. Chem. Eng. Technol. 2013, 36, 1951–1956. [Google Scholar] [CrossRef]
- Xue, Z.; Shang, H.; Zhang, Z.; Xiong, C.; Lu, C.; An, G. Efficient Synthesis of Polyoxymethylene Dimethyl Ethers on Al-SBA-Catalysts with Different Si/Al Ratios and Pore Sizes. Energy Fuels 2016, 31, 279–286. [Google Scholar] [CrossRef]
- Wu, J.; Zhu, H.; Wu, Z.; Qin, Z.; Yan, L.; Du, B.; Fan, W.; Wang, J. High Si/Al ratio HZSM-5 zeolite: An efficient catalyst for the synthesis of polyoxymethylene dimethyl ethers from dimethoxymethane and trioxymethylene. Green Chem. 2015, 17, 2353–2357. [Google Scholar] [CrossRef]
- Burger, J.; Ströfer, E.; Hasse, H. Chemical Equilibrium and Reaction Kinetics of the Heterogeneously Catalyzed Formation of Poly(oxymethylene) Dimethyl Ethers from Methylal and Trioxane. Ind. Eng. Chem. Res. 2012, 51, 12751–12761. [Google Scholar] [CrossRef]
- Zhao, Y.; Xu, Z.; Chen, H.; Fu, Y.; Shen, J. Mechanism of chain propagation for the synthesis of polyoxymethylene dimethyl ethers. J. Energy Chem. 2013, 22, 833–836. [Google Scholar] [CrossRef]
- Haltenort, P.; Hackbarth, K.; Oestreich, D.; Lautenschütz, L.; Arnold, U.; Sauer, J. Heterogeneously catalyzed synthesis of oxymethylene dimethyl ethers (OME) from dimethyl ether and trioxane. Catal. Commun. 2018, 109, 80–84. [Google Scholar] [CrossRef]
- Breitkreuz, C.F.; Schmitz, N.; Ströfer, E.; Burger, J.; Hasse, H. Design of a Production Process for Poly(oxymethylene) Dimethyl Ethers from Dimethyl Ether and Trioxane. Chem. Ing. Technik 2018, 90, 1489–1496. [Google Scholar] [CrossRef]
- Schmitz, N.; Homberg, F.; Berje, J.; Burger, J.; Hasse, H. Chemical Equilibrium of the Synthesis of Poly(oxymethylene) Dimethyl Ethers from Formaldehyde and Methanol in Aqueous Solutions. Ind. Eng. Chem. Res. 2015, 54, 6409–6417. [Google Scholar] [CrossRef]
- Schmitz, N.; Burger, J.; Hasse, H. Reaction Kinetics of the Formation of Poly(oxymethylene) Dimethyl Ethers from Formaldehyde and Methanol in Aqueous Solutions. Ind. Eng. Chem. Res. 2015, 54, 12553–12560. [Google Scholar] [CrossRef]
- Zhang, J.; Fang, D.; Liu, D. Evaluation of Zr–Alumina in Production of Polyoxymethylene Dimethyl Ethers from Methanol and Formaldehyde: Performance Tests and Kinetic Investigations. Ind. Eng. Chem. Res. 2014, 53, 13589–13597. [Google Scholar] [CrossRef]
- Zhang, J.; Shi, M.; Fang, D.; Liu, D. Reaction kinetics of the production of polyoxymethylene dimethyl ethers from methanol and formaldehyde with acid cation exchange resin catalyst. React. Kinet. Mech. Catal. 2014, 113, 459–470. [Google Scholar] [CrossRef]
- Wang, D.; Zhao, F.; Zhu, G.; Xia, C. Production of eco-friendly poly(oxymethylene) dimethyl ethers catalyzed by acidic ionic liquid: A kinetic investigation. Chem. Eng. J. 2018, 334, 2616–2624. [Google Scholar] [CrossRef]
- Wang, H.; Shen, J. Decomposition of polyoxymethylene dimethyl ethers and synthesis of bisphenol F. Catal. Today 2017, 298, 263–268. [Google Scholar] [CrossRef]
- Zheng, Y.; Tang, Q.; Wang, T.; Wang, J. Kinetics of synthesis of polyoxymethylene dimethyl ethers from paraformaldehyde and dimethoxymethane catalyzed by ion-exchange resin. Chem. Eng. Sci. 2015, 134, 758–766. [Google Scholar] [CrossRef]
- Maurer, G. Vapor-liquid equilibrium of formaldehyde and water-containing multicomponent mixtures. AIChE J. 1986, 32, 932–948. [Google Scholar] [CrossRef]
- Burger, J.; Ströfer, E.; Hasse, H. Production process for diesel fuel components poly(oxymethylene) dimethyl ethers from methane-based products by hierarchical optimization with varying model depth. Chem. Eng. Res. Des. 2013, 91, 2648–2662. [Google Scholar] [CrossRef]
- Zheng, Y.; Tang, Q.; Wang, T.; Wang, J. Molecular size distribution in synthesis of polyoxymethylene dimethyl ethers and process optimization using response surface methodology. Chem. Eng. J. 2015, 278, 183–189. [Google Scholar] [CrossRef]
- Schmitz, N.; Ströfer, E.; Burger, J.; Hasse, H. Conceptual Design of a Novel Process for the Production of Poly(oxymethylene) Dimethyl Ethers from Formaldehyde and Methanol. Ind. Eng. Chem. Res. 2017, 56, 11519–11530. [Google Scholar] [CrossRef]
- Ai, Z.-J.; Chung, C.-Y.; Chien, I.L. Design and Control of Poly(oxymethylene) Dimethyl Ethers Production Process Directly from Formaldehyde and Methanol in Aqueous. IFAC Pap. 2018, 51, 578–583. [Google Scholar] [CrossRef]
- Burre, J.; Bongartz, D.; Mitsos, A. Production of Oxymethylene Dimethyl Ethers from Hydrogen and Carbon Dioxide—Part II: Modeling and Analysis for OME3–5. Ind. Eng. Chem. Res. 2019, 58, 5567–5578. [Google Scholar] [CrossRef]
- Han, Z.; Ren, Y.; Li, H.; Li, X.; Gao, X. Simultaneous Extractive and Azeotropic Distillation Separation Process for Production of PODEn from Formaldehyde and Methylal. Ind. Eng. Chem. Res. 2019, 58, 5252–5260. [Google Scholar] [CrossRef]
- Hahnenstein, I.; Hasse, H.; Kreiter, C.G.; Maurer, G. 1H- and 13C-NMR Spectroscopic Study of Chemical Equilibria in Solutions of Formaldehyde in Water, Deuterium Oxide, and Methanol. Ind. Eng. Chem. Res. 1994, 33, 1022–1029. [Google Scholar] [CrossRef]
- Hahnenstein, I.; Albert, M.; Hasse, H.; Kreiter, C.G.; Maurer, G. NMR Spectroscopic and Densimetric Study of Reaction Kinetics of Formaldehyde Polymer Formation in Water, Deuterium Oxide, and Methanol. Ind. Eng. Chem. Res. 1995, 34, 440–450. [Google Scholar] [CrossRef]
- Hasse, H.; Hahnenstein, I.; Maurer, G. Revised vapor-liquid equilibrium model for multicomponent formaldehyde mixtures. AIChE J. 1990, 36, 1807–1814. [Google Scholar] [CrossRef]
- Hasse, H.; Maurer, G. Vapor-liquid equilibrium of formaldehyde-containing mixtures at temperatures below K. Fluid Phase Equilibria 1991, 64, 185–199. [Google Scholar] [CrossRef]
- Albert, M.; Hahnenstein, I.; Hasse, H.; Maurer, G. Vapor–liquid equilibrium of formaldehyde mixtures: New data and model revision. AIChE J. 1996, 42, 1741–1752. [Google Scholar] [CrossRef]
- Albert, M.; Garcıa, B.C.; Kreiter, C.; Maurer, G. Vapor-Liquid and Chemical Equilibria of Formaldehyde-Water Mixtures. AIChE J. 1999, 45, 2024–2033. [Google Scholar] [CrossRef]
- Albert, M.; García, B.C.; Kuhnert, C.; Peschla, R.; Maure, G. Vapor–liquid equilibrium of aqueous solutions of formaldehyde and methanol. AIChE J. 2000, 46, 1676–1687. [Google Scholar] [CrossRef]
- Albert, M.; Hahnenstein, I.; Hasse, H.; Maurer, G. Vapor−Liquid and Liquid−Liquid Equilibria in Binary and Ternary Mixtures of Water, Methanol, and Methylal. J. Chem. Eng. Data 2001, 46, 897–903. [Google Scholar] [CrossRef]
- Albert, M.; Hasse, H.; Kuhnert, C.; Maurer, G. New Experimental Results for the Vapor-Liquid Equilibrium of the Binary System (Trioxane + Water) and the Ternary System (Formaldehyde + Trioxane + Water). J. Chem. Eng. Data 2005, 50, 1218–1223. [Google Scholar] [CrossRef]
- Schmitz, N.; Friebel, A.; von Harbou, E.; Burger, J.; Hasse, H. Liquid-liquid equilibrium in binary and ternary mixtures containing formaldehyde, water, methanol, methylal, and poly(oxymethylene) dimethyl ethers. Fluid Phase Equilibria 2016, 425, 127–135. [Google Scholar] [CrossRef]
- Kuhnert, C.; Albert, M.; Breyer, S.; Hahnenstein, I.; Hasse, H.; Maurer, G. Phase Equilibrium in Formaldehyde Containing Multicomponent Mixtures: Experimental Results for Fluid Phase Equilibria of (Formaldehyde + (Water or Methanol) + Methylal)) and (Formaldehyde + Water + Methanol + Methylal) and Comparison with Predictions. Ind. Eng. Chem. Res. 2006, 45, 5155–5164. [Google Scholar] [CrossRef]
- Schmitz, N.; Breitkreuz, C.F.; Ströfer, E.; Burger, J.; Hasse, H. Vapor–liquid equilibrium and distillation of mixtures containing formaldehdye and poly(oxymethylene) dimethyl ethers. Chem. Eng. Process. Process Intensif. 2018, 131, 116–124. [Google Scholar] [CrossRef]
- Wisniak, J. The Herington Test for Thermodynamic Consistency. Ind. Eng. Chem. Res. 1994, 33, 177–180. [Google Scholar] [CrossRef]
- Frederic Walker, J. Formaldehyde; Reinhold Publishing: New York, NY, USA, 1964. [Google Scholar]
- Drunsel, J.-O.; Renner, M.; Hasse, H. Experimental study and model of reaction kinetics of heterogeneously catalyzed methylal synthesis. Chem. Eng. Res. Des. 2012, 90, 696–703. [Google Scholar] [CrossRef]
- Oestreich, D.; Lautenschütz, L.; Arnold, U.; Sauer, J. Reaction kinetics and equilibrium parameters for the production of oxymethylene dimethyl ethers (OME) from methanol and formaldehyde. Chem. Eng. Sci. 2017, 163, 92–104. [Google Scholar] [CrossRef]
- Dong, Y.; Dai, C.; Lei, Z. Extractive distillation of methylal/methanol mixture using ethylene glycol as entrainer. Fluid Phase Equilibria 2018, 462, 172–180. [Google Scholar] [CrossRef]
- Grützner, T.; Hasse, H.; Lang, N.; Siegert, M.; Ströfer, E. Development of a new industrial process for trioxane production. Chem. Eng. Sci. 2007, 62, 5613–5620. [Google Scholar] [CrossRef]

Publisher’s Note: MDPI stays neutral with regard to jurisdictional claims in published maps and institutional affiliations. |
© 2020 by the authors. Licensee MDPI, Basel, Switzerland. This article is an open access article distributed under the terms and conditions of the Creative Commons Attribution (CC BY) license (http://creativecommons.org/licenses/by/4.0/).