Article

Spectral Line Reflectance and Fluorescence Imaging Device for Skin Diagnostics

Biophotonics Laboratory, Institute of Atomic Physics and Spectroscopy, University of Latvia, LV-1586 Riga, Latvia
*
Author to whom correspondence should be addressed.
Appl. Sci. 2020, 10(21), 7472; https://doi.org/10.3390/app10217472
Submission received: 30 September 2020 / Revised: 20 October 2020 / Accepted: 22 October 2020 / Published: 24 October 2020
(This article belongs to the Special Issue Medical Imaging and Analysis)

Abstract

:

Featured Application

Non-contact express assessment of in-vivo skin malformations.

Abstract

The multi-spectral-line imaging concept, which was recently implemented for the snapshot mapping of three main skin chromophores—melanin, oxy-hemoglobin, and deoxy-hemoglobin, is further explored for the snapshot capturing of four spectral line images at wavelengths of 450, 523, 638, and 850 nm, with the consecutive acquiring of a 405 nm excited fluorescence image. A corresponding laser-based prototype device was designed and assembled. Processing of the mentioned five images enables obtaining distribution maps of four skin chromophores within the malformation and comparing their mean fluorescence intensity with that of the surrounding healthy skin. This set of information is helpful for dermatologists, cosmetologists, oncologists, and other healthcare professionals to quantify the diagnosis of skin malformations (including cancers) and to follow up the recovery process after therapy. This paper describes the design of the developed proof-of-concept prototype device and initial test results.

1. Introduction

Human skin malformations exhibit abnormal distribution of the absorbing chromophores (e.g., epidermal melanin, dermal hemoglobin); this clinical feature is typical for burns, bruises, and a number of vascular and pigmented skin lesions, including tumors [1]. Skin chromophore distribution maps can provide useful qualitative and quantitative information on the severity of pathology and its development, as well as on the efficiency of skin recovery processes after therapy. Simple and fast skin chromophore mapping facilitates decision taking and further strategy development in dermatology, cosmetology, oncology, surgery, and forensics. Currently, the procedures with commercially available devices able to provide skin chromophore distribution maps (e.g., SIAscope [2]) are time-consuming, the equipment is expensive, and it is inconvenient for use (cable-connected to computer), which limits applications in personalized medicine and in the field conditions.
Fluorescence imaging provides additional clinical information on skin malformations in a patient-friendly non-contact way. For example, images of skin autofluorescence (i.e., natural fluorescence without any additives) are helpful for skin cancer assessment [3]; autofluorescence imaging in slow video mode reveals fragments of different pathologies within complex skin malformations [4]. A combined multi-spectral-autofluorescence imaging shows promising potential for the early screening of malignant skin melanoma [5].
Each chromophore has its specific absorption spectrum [6], so the skin-remitted light intensity depends on the detection wavelength and composition of the comprised chromophores within the examined skin area. A set of several spectral images of the same skin target, captured within different wavelength bands, can be converted into a set of chromophore distribution maps [7]. There are two main approaches for obtaining spectral images—by narrowband spectral filtering of the image sensor at spectrally broadband illumination of the target area, or by means of spectrally narrowband illumination. The first approach is widely used in hyperspectral imaging (HSI) systems that capture sequential target images at several tens of adjacent spectral bands using interference filters [8], liquid crystal filters [9], or other means of spectral filtering. Commercial and custom-designed HSI systems were used for skin chromophore mapping [8,10,11,12]; however, routine clinical applications of the HSI systems are limited due to their robustness, expensiveness, and the need for powerful computing resources. The set of processed data in the case of HSI may include a number of spectral images not containing any useful information. The HSI image acquisition process may last from several seconds [12] to a minute or longer [13], so movements of the skin target area during the procedure can cause image artefacts. Special image stabilization algorithms [14] could reduce or fully avoid the motion artefacts, but it takes extra time and computing resources. In addition, in many cases, calculations of complicated integrals comprising spectral features of the chromophore absorbance and the filtered HSI band shape are necessary.
The second approach—spectrally selective illumination—has been mainly used in skin multi-spectral imaging (MSI) systems where sequentially switchable non-overlapping spectral bands of illumination (e.g., by several light-emitting diodes (LEDs) with different peak wavelengths at typical spectral full width at half maximum FWHM ≈20–50 nm) are exploited [15,16]. Advanced MSI systems are portable and self-sustained, much cheaper than HSI systems, and better adapted for clinical use. The MSI processing procedure is also faster thanks to the lower number of the spectral images, typically between 3 and 8. Still, skin motion artefacts and the processing of relatively broadband spectral images may cause serious problems.
Obviously, both the acquisition time of the spectral image set and the spectral bandwidth of each image have to be minimized. Ultimate performance can be achieved if the set of monochromatic (single-wavelength) spectral images is obtained by a single snapshot; this technique is provisionally called “snapshot multi-spectral-line imaging” or SMSLI [17,18]. In this case, a set of spectral line images is obtained under uniform illumination of the target simultaneously by several spectral lines, e.g., emitted by lasers. To extract n spectral line images in a snapshot, the number of spectral sensitivity bands of the image sensor system also has to be n. For instance, standard RGB color cameras can record three spectral line images by a single snapshot if the illumination spectrum comprises three spectral lines, each of them positioned within one of the detection bands (R, G, or B) [19,20,21]. Triple spectral line imaging has been successfully applied for colored counterfeit detection [17,22] and for remote distribution mapping of the main skin chromophores (melanin, oxy-, and deoxy-hemoglobin) [23,24]. However, also mapping of other skin chromophores (e.g., bilirubin, lipids, or water) is of diagnostic interest; therefore, SMSLI technologies for higher n values have to be developed. Our previous study in this direction resulted with a battery-powered proof-of-concept device for the snapshot acquisition of four spectral line images to map four skin chromophores, also being able to capture skin autofluorescence (AF) images under the violet 405 nm laser excitation [25]. However, its double-camera design appeared too robust and inconvenient for clinical applications. As the next step, we developed a more compact and handy single-camera design, which is described in this paper.

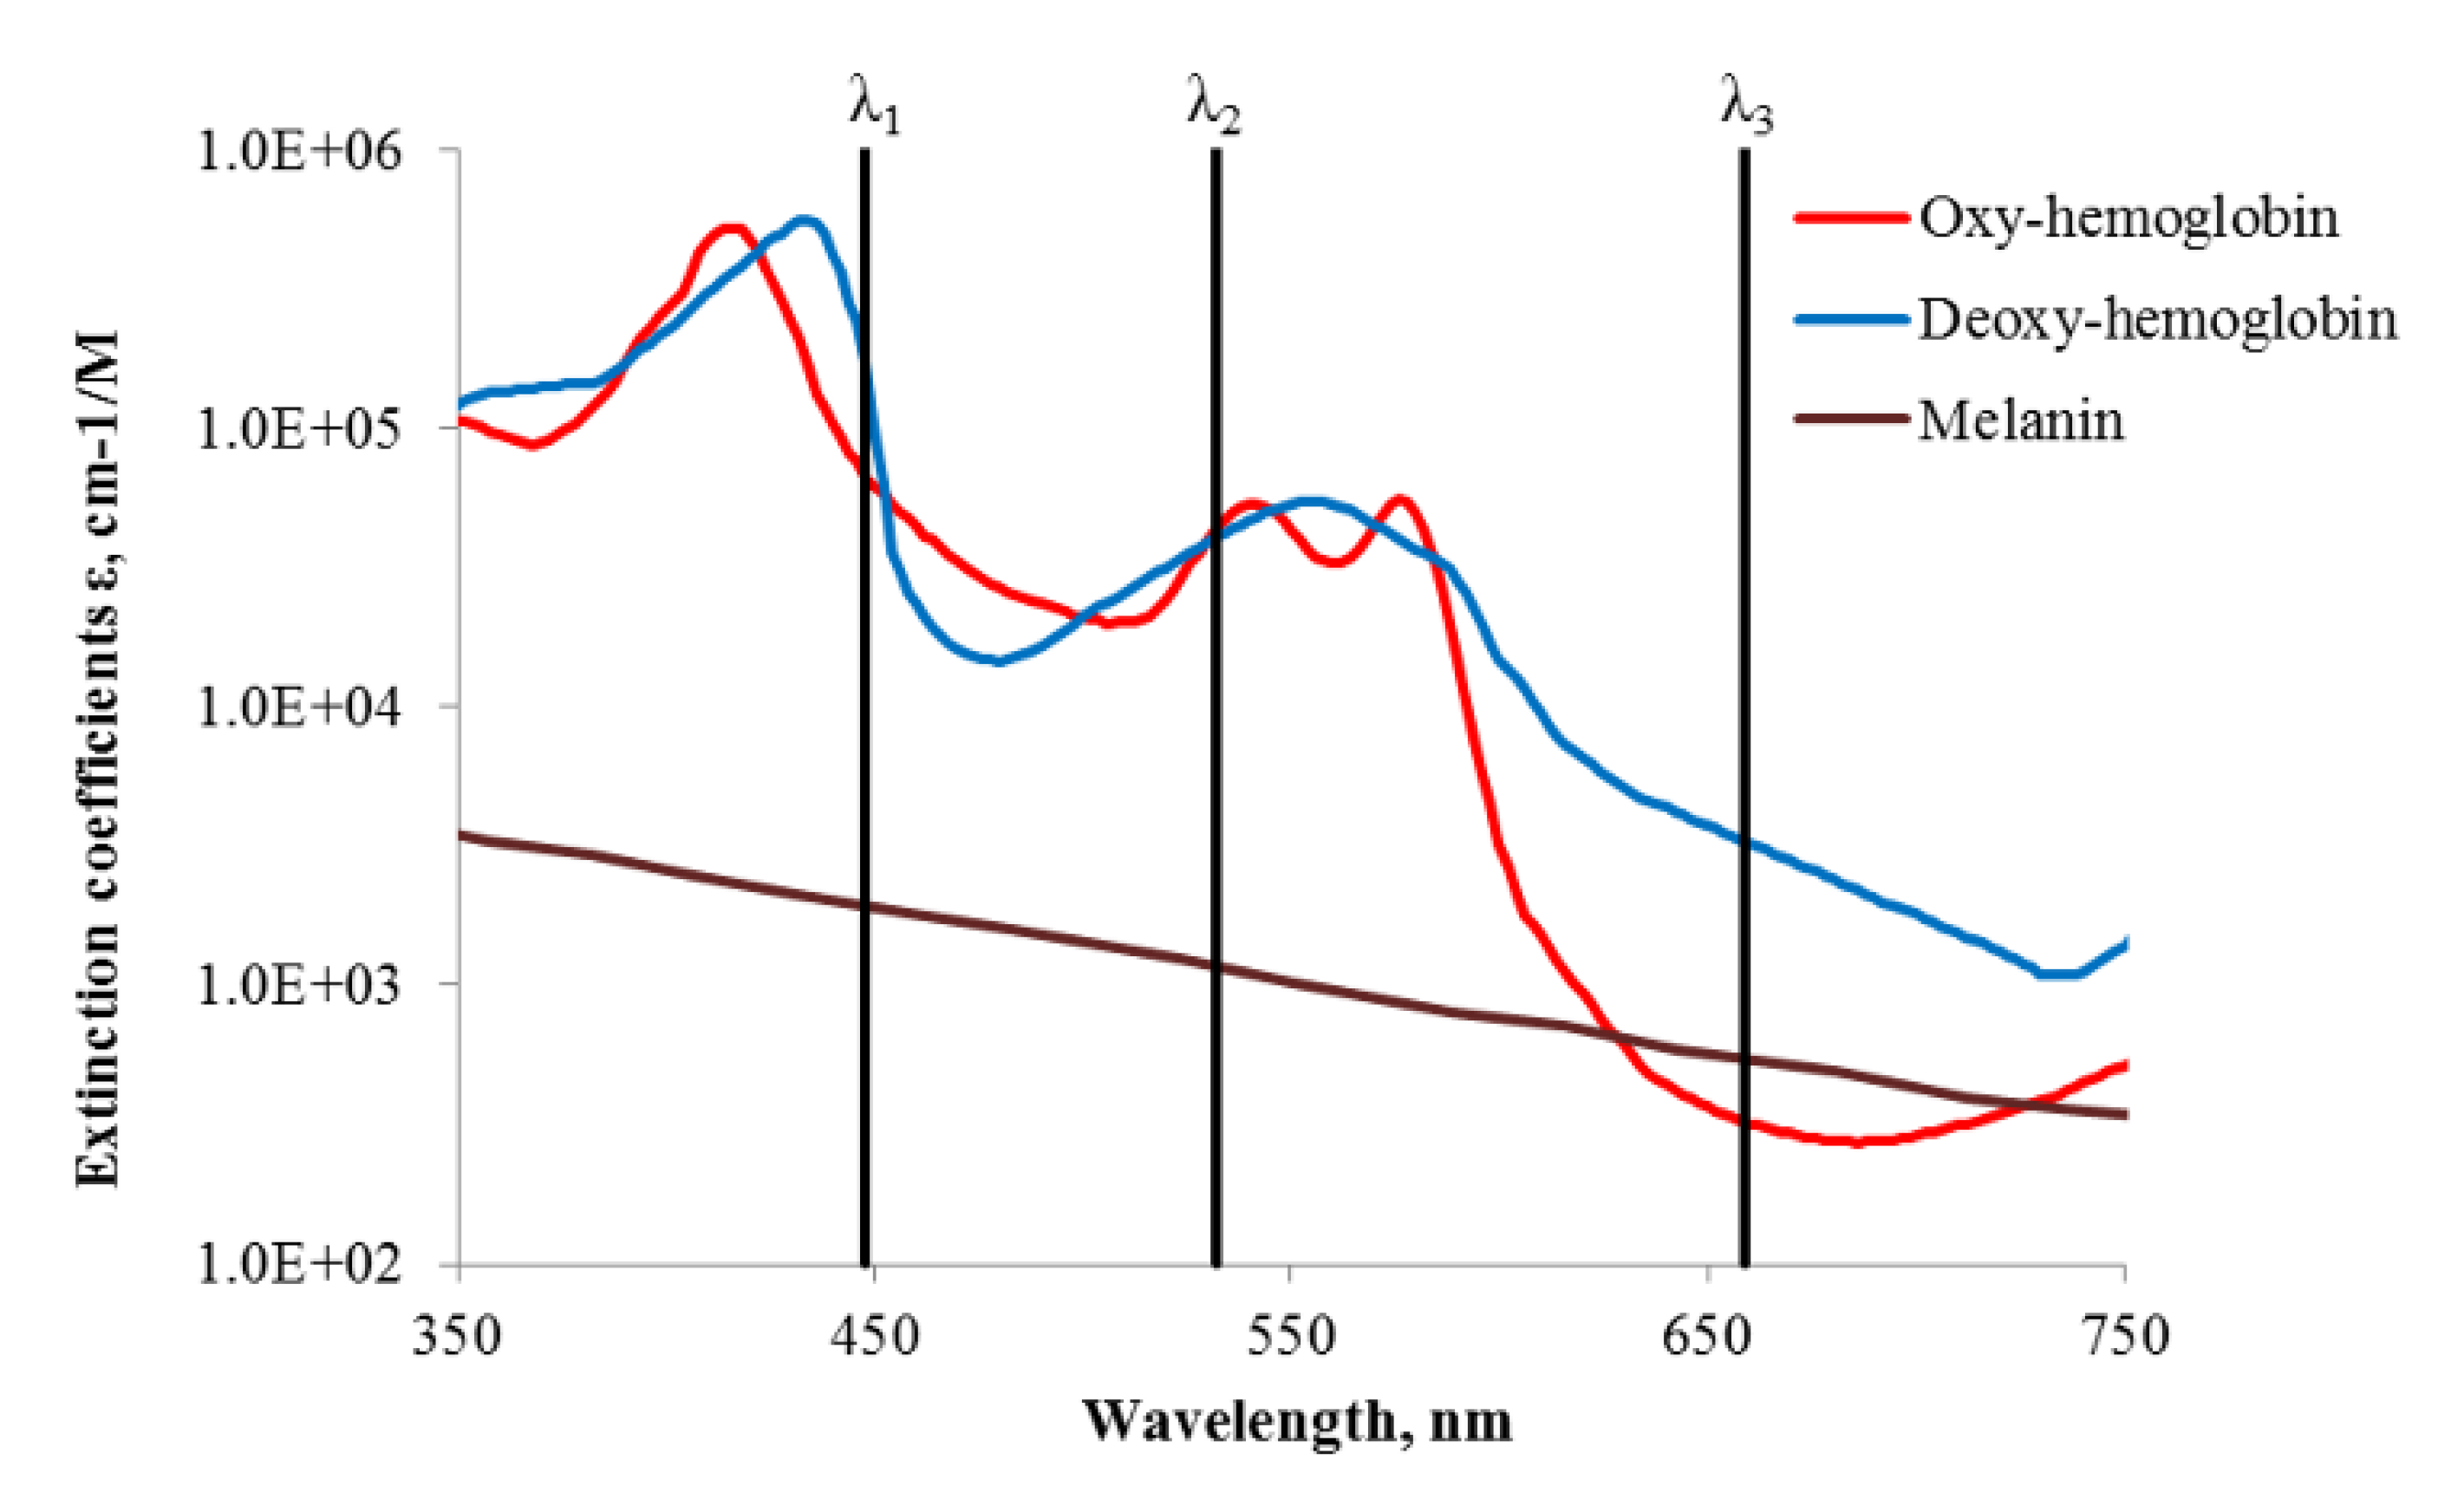
2. Method of Skin Chromophore Mapping

The general concept of snapshot skin chromophore mapping at fixed wavelengths, used in this work, is explained at Figure 1 for the case n = 3 [24]. The three-chromophore skin model suggests that the dominant absorbers in skin at any of the fixed wavelengths λj (j = 1, 2, 3) are oxy-hemoglobin (further abbreviated by a), deoxy-hemoglobin (b), and melanin (c)—see the crossings of their absorption curves with the vertical lines at Figure 1. The RGB image of the skin pathology spot is captured under illumination that comprises discrete spectral lines at wavelengths λ1, λ2 and λ3. With respect to the spectral sensitivity of the image sensor and the cross-talk between its detection bands at the particular wavelengths, three spectral line images are extracted from the image dataset as described in [19,20]. If the skin surface reflection is suppressed (e.g., by means of crossed polarizers), variations in chromophore composition will lead to changes of the diffusely reflected light intensities at each of the fixed wavelengths. Such variations in the pathology region relatively to the healthy skin can be estimated by measuring reflected light intensities from equally sized regions of interest in the pathology (Ij) and the adjacent healthy skin (I0j). The ratios Ij/I0j at each pixel or pixel’s group of three spectral line images contain information on the concentration increase or decrease of all three regarded chromophores Δci (i = a, b, c), which can be further mapped over the whole image area.
The intensity changes at three exploited wavelengths due to absorption can be represented in terms of the Beer–Lambert law:
{ ln ( I 1 I 01 ) = l 1 ( Δ c a ε a ( λ 1 ) + Δ c b ε b ( λ 1 ) + Δ c c ε c ( λ 1 ) ) ln ( I 2 I 02 ) = l 2 ( Δ c a ε a ( λ 2 ) + Δ c b ε b ( λ 2 ) + Δ c c ε c ( λ 2 ) ) ln ( I 3 I 03 ) = l 3 ( Δ c a ε a ( λ 3 ) + Δ c b ε b ( λ 3 ) + Δ c c ε c ( λ 3 ) )
where εij) —extinction coefficients of the three regarded chromophores at three exploited wavelengths, and lj—absorption path length in skin at a particular wavelength. Chromophore concentration increase or decrease at each image pixel or selected group of pixels is found by solving the linear equation system (1). For an increased number of chromophores to be mapped (e.g., for n = 4), the number of working wavelengths and equations in (1) has to be correspondingly increased.

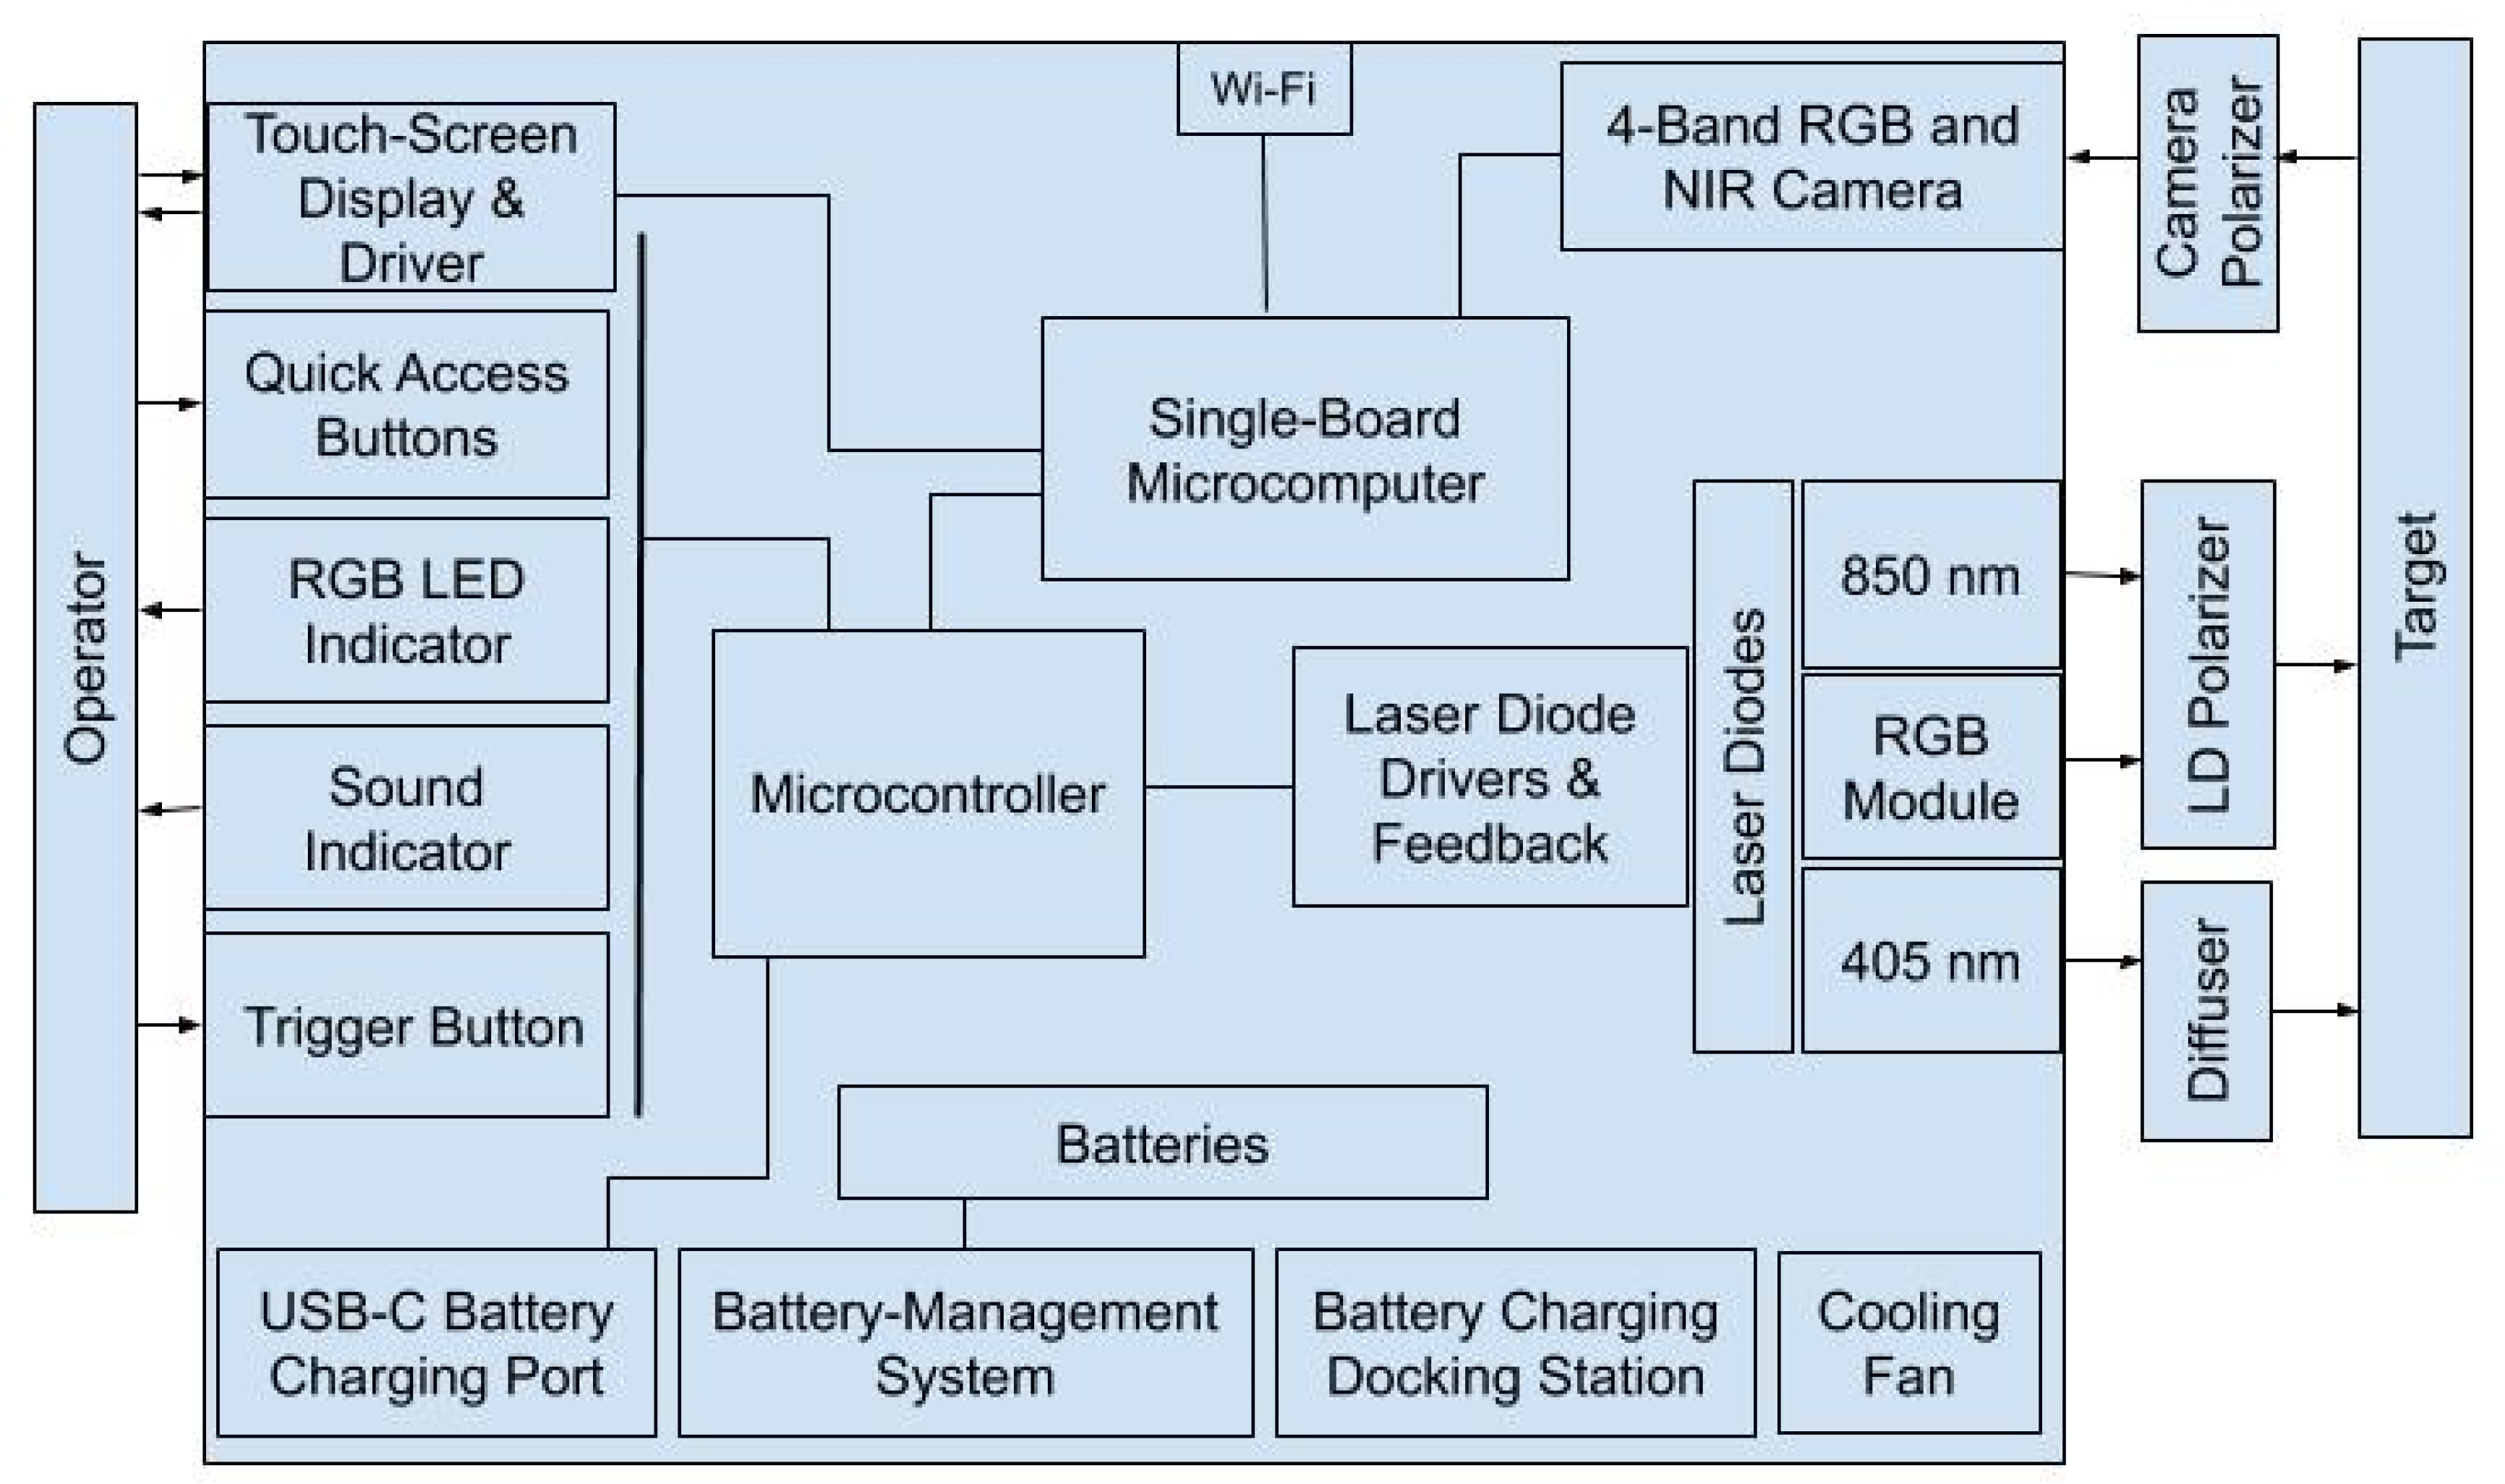
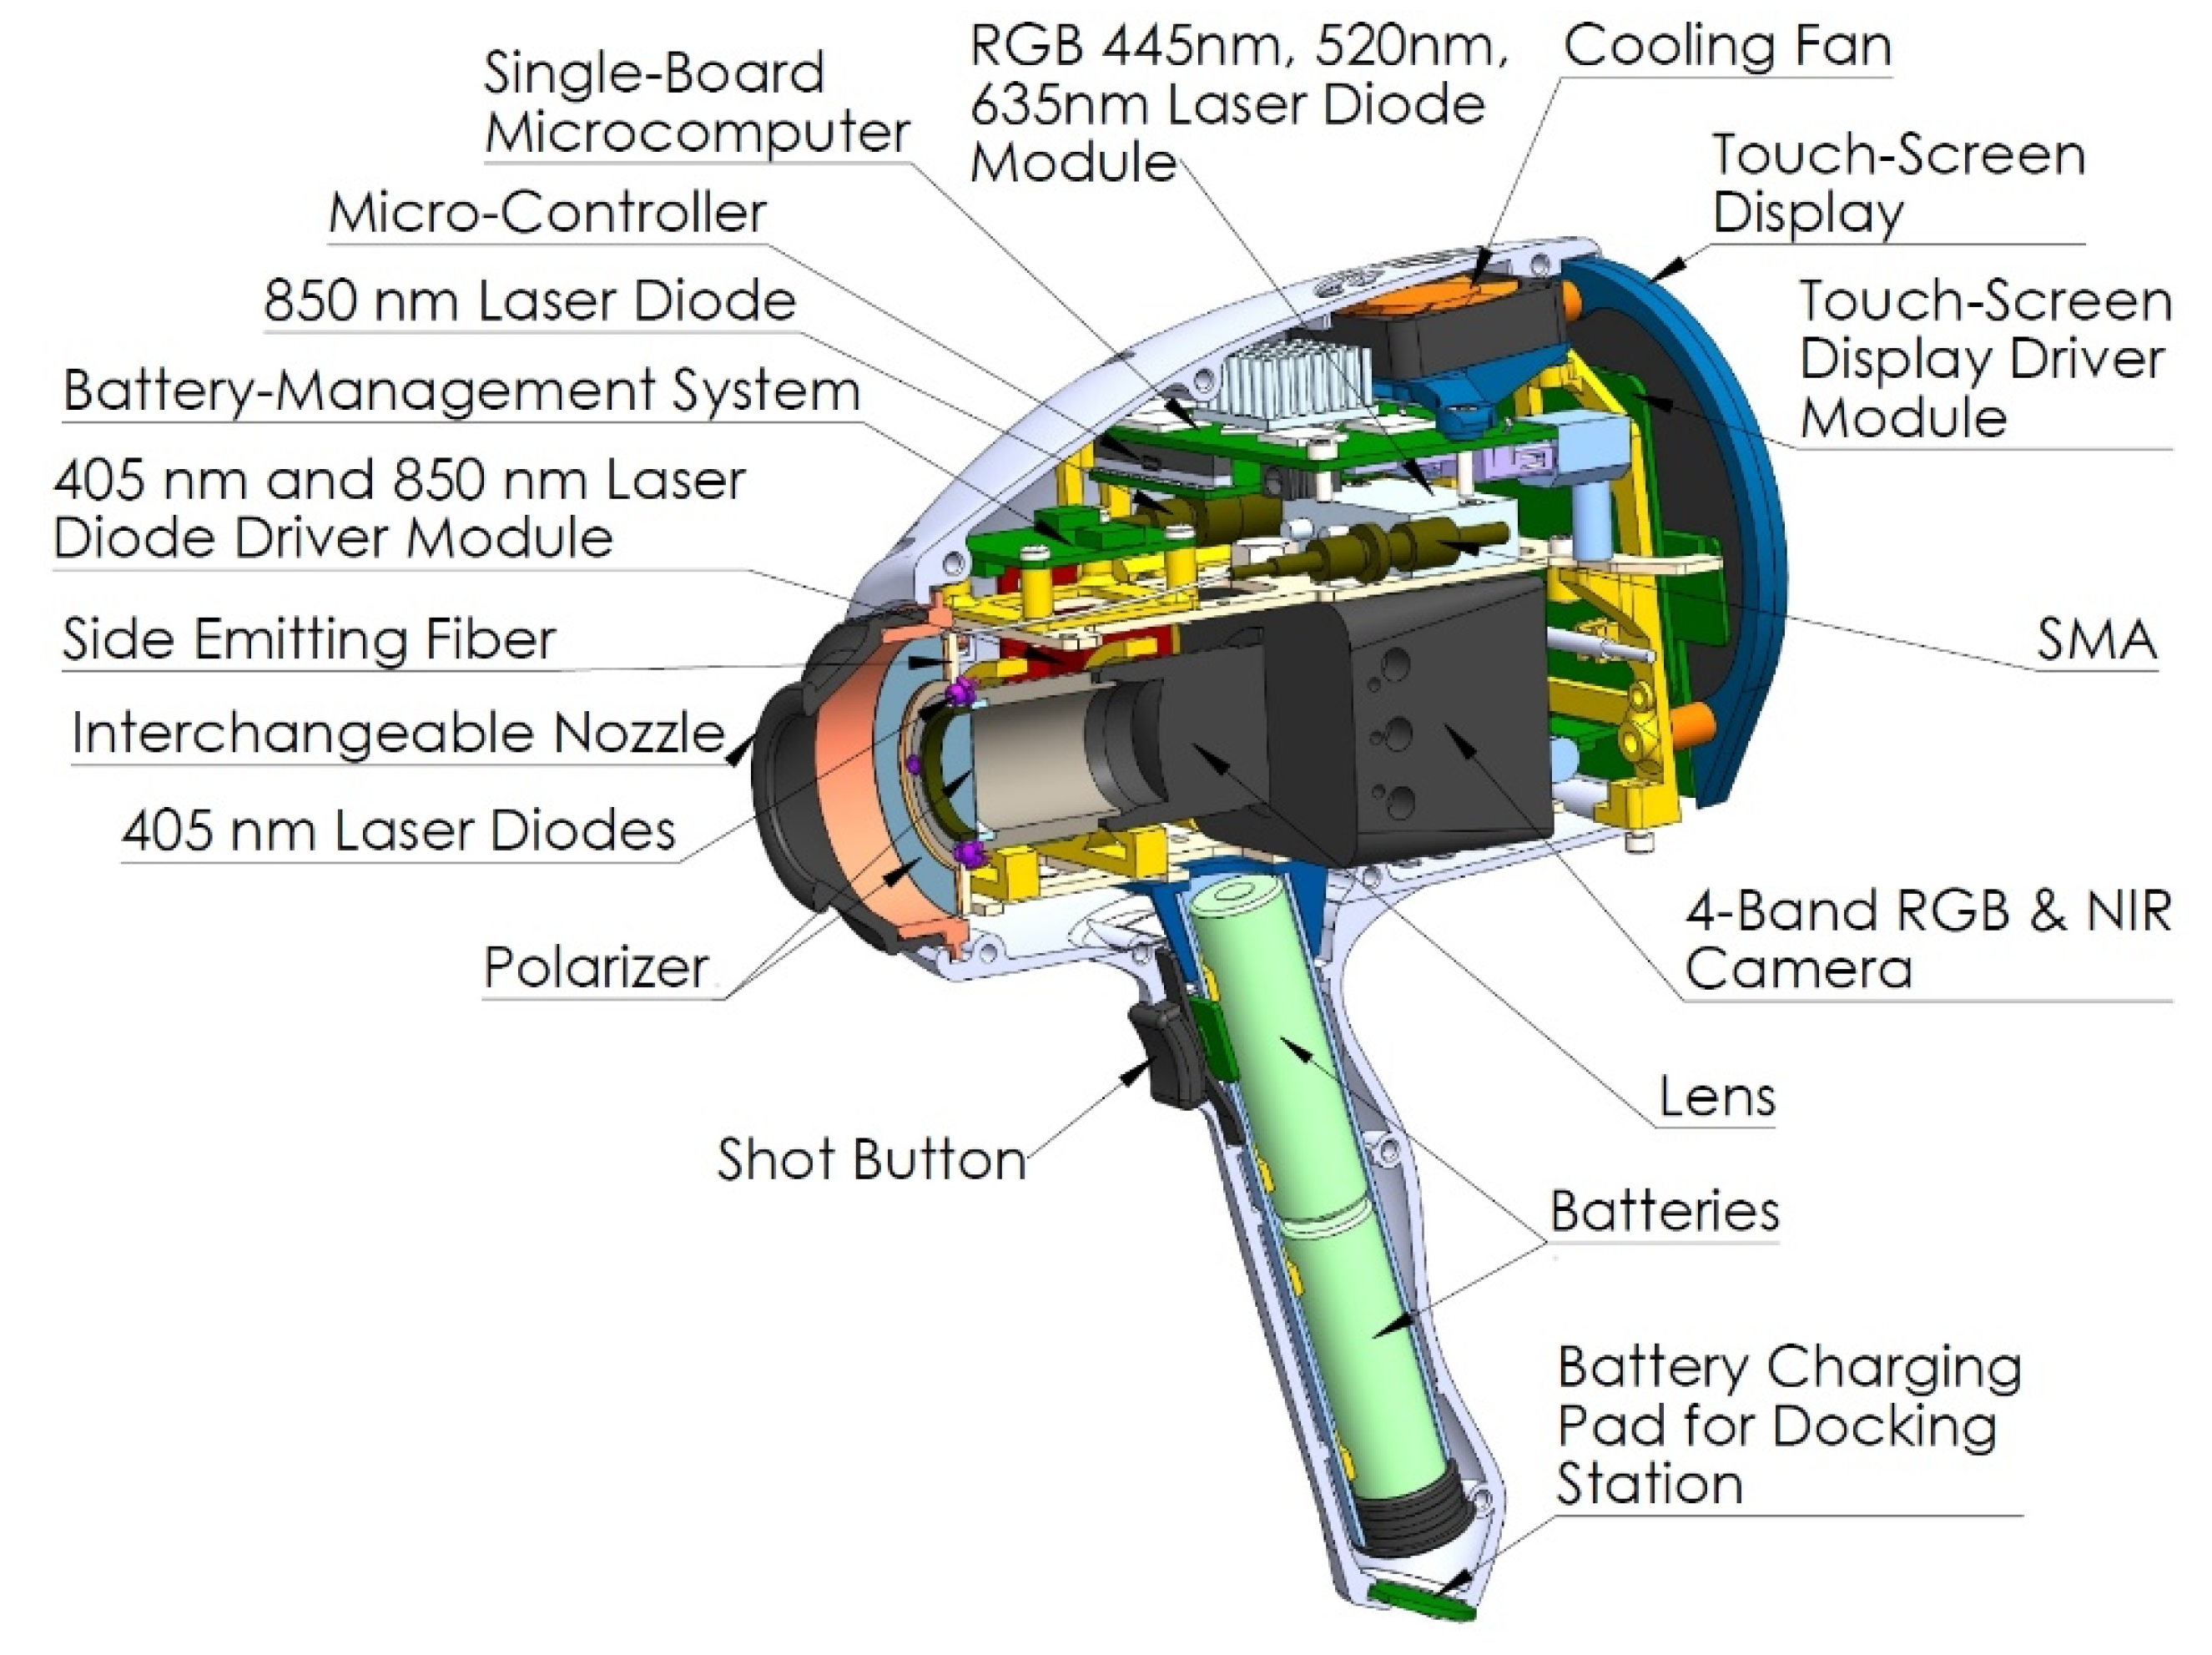
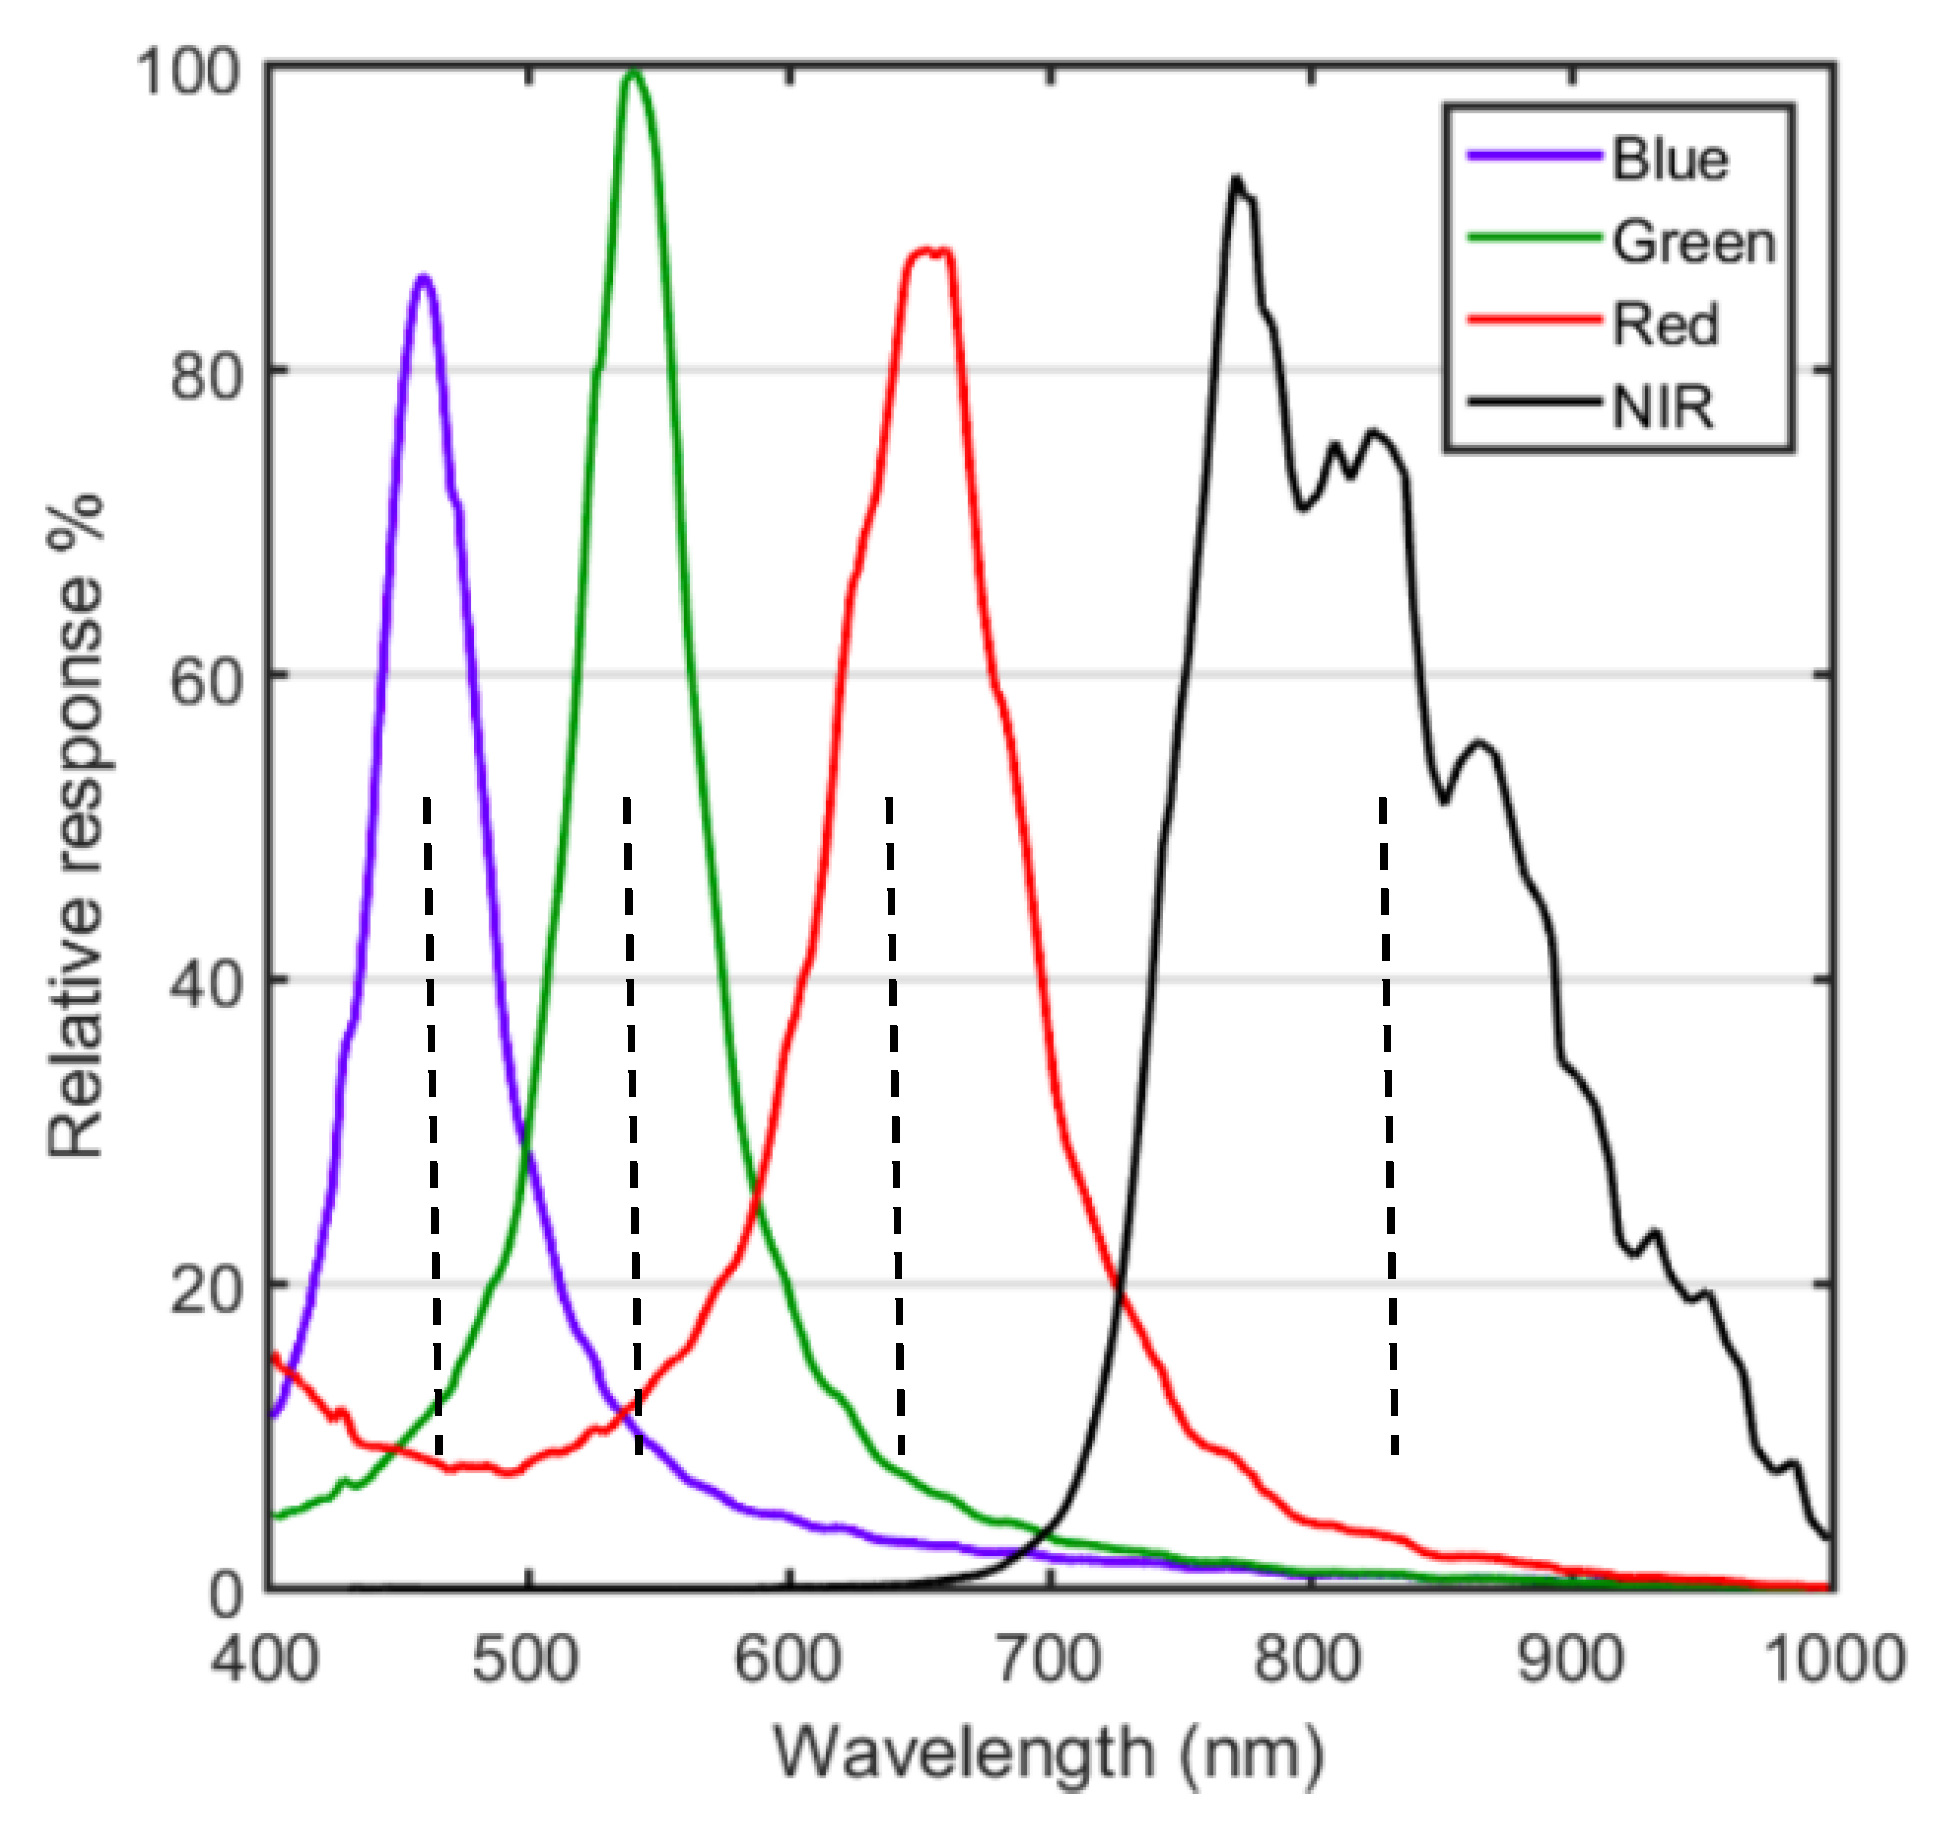
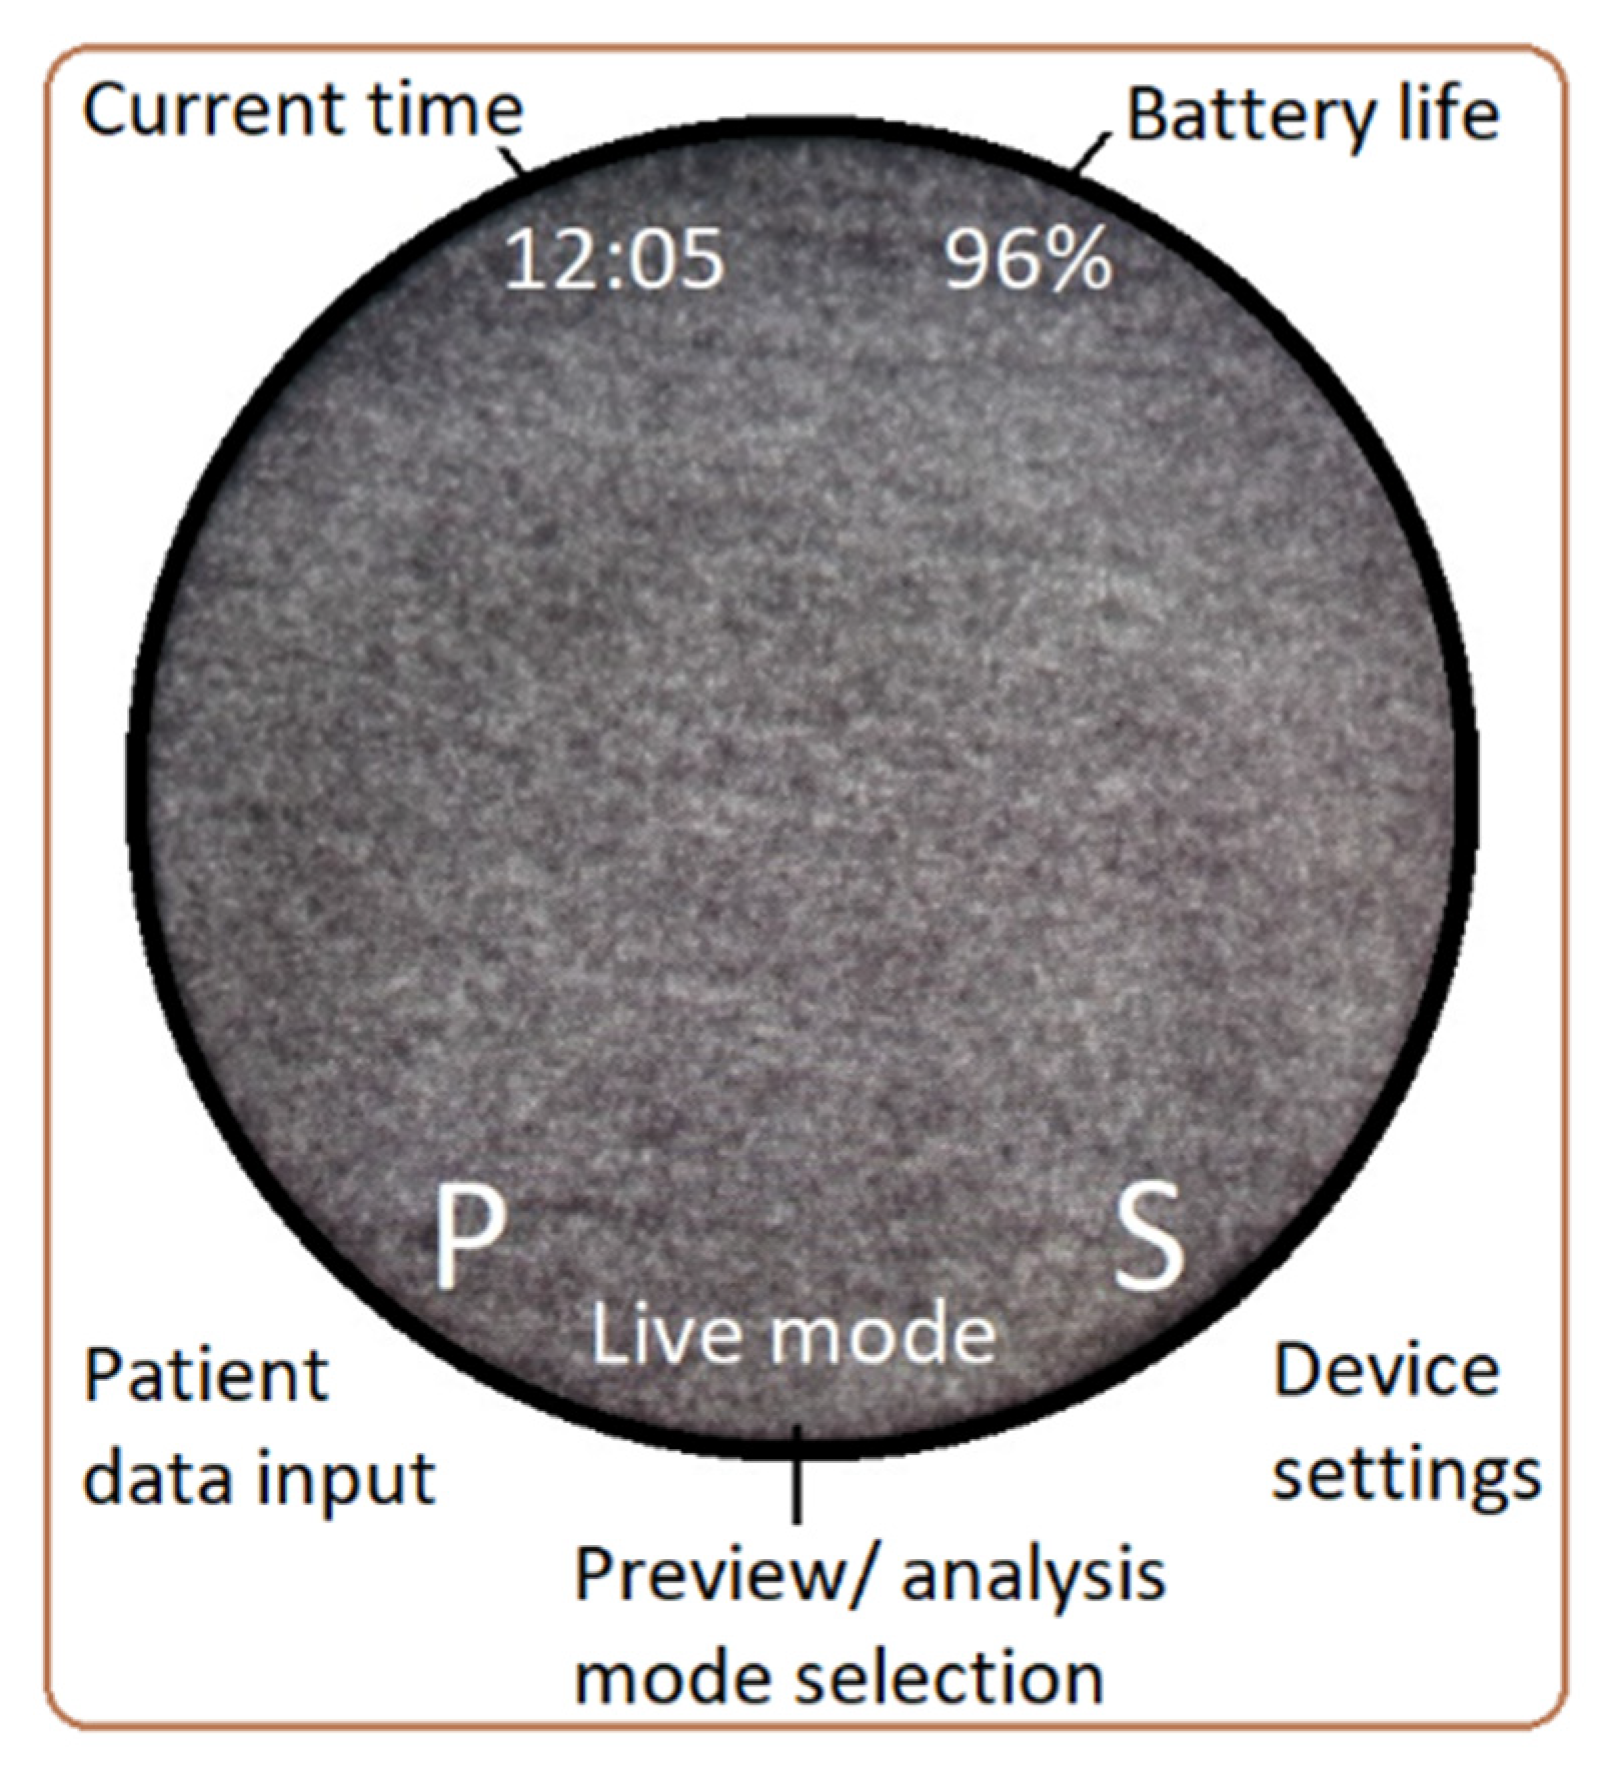
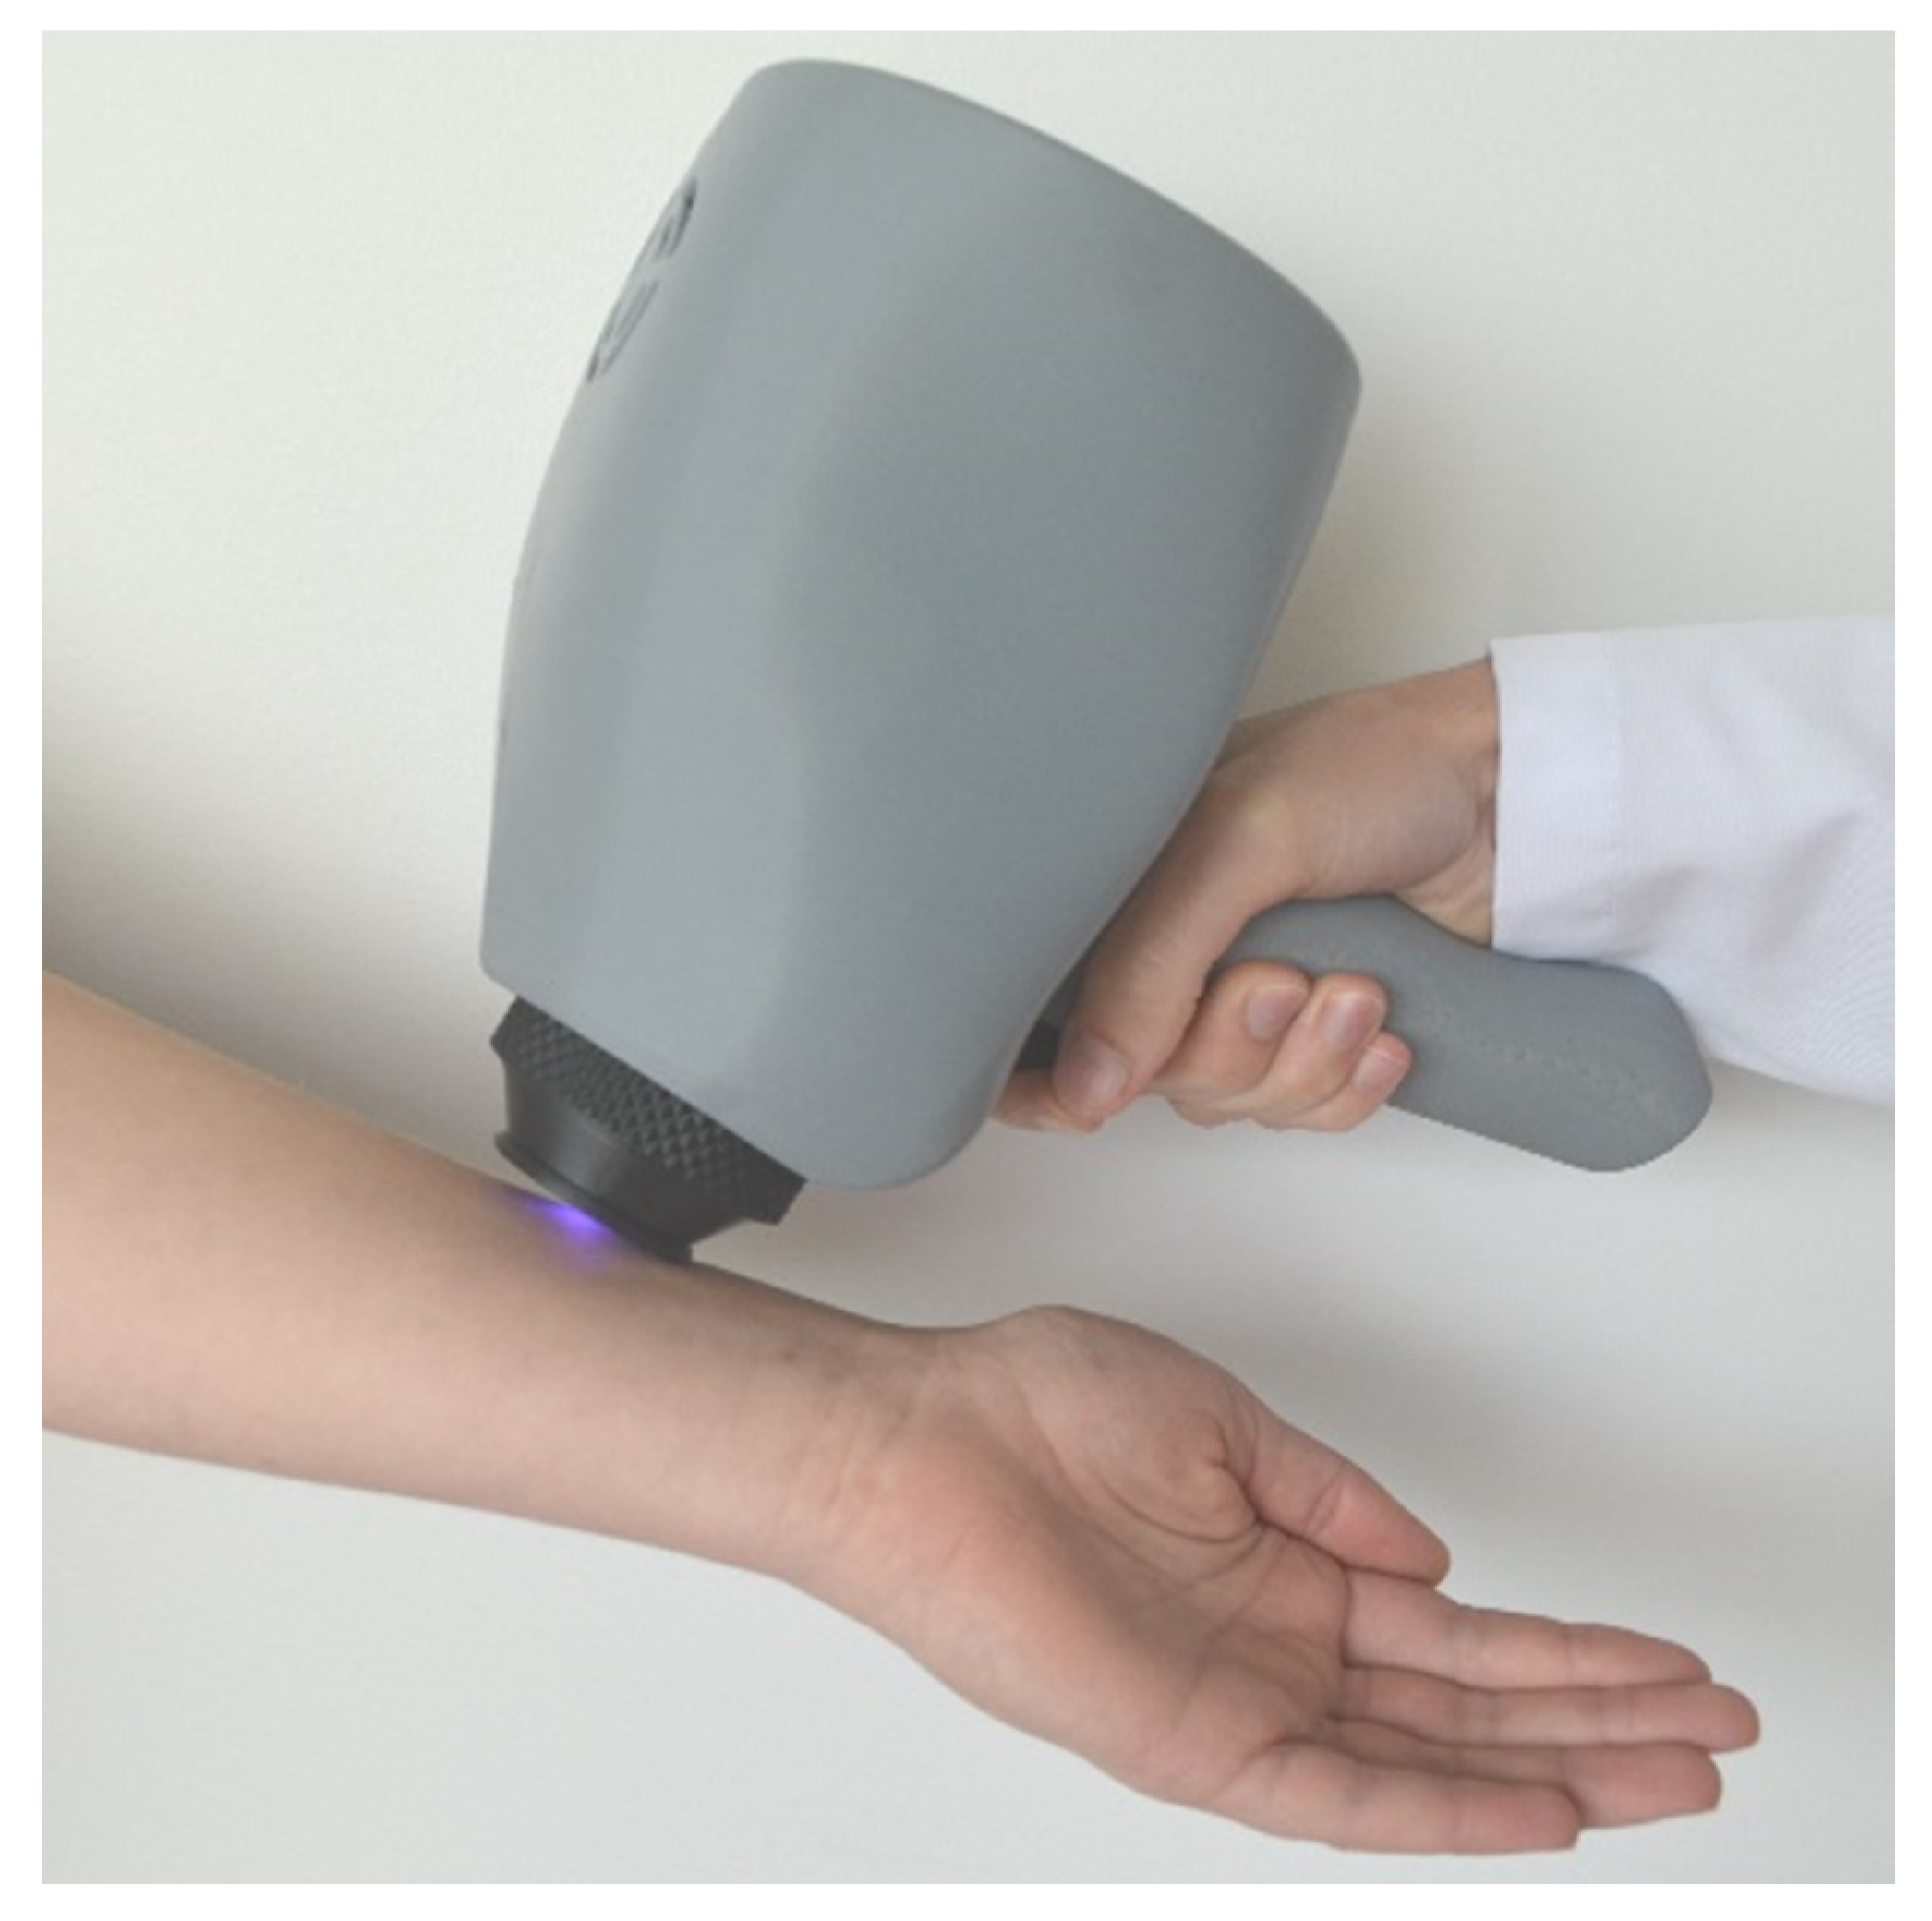
3. Design of the Prototype Device

A block-diagram of the device is presented in Figure 2, and its design scheme is presented in Figure 3. Two laser modules—an RGB fiber-coupled module (Elite Optoelectronics, CN) simultaneously emitting three spectral lines (450, 523, and 638 nm, ≈20 mW power each) and a module emitting at 850 nm (RLDH850-40-3, Roithner, AT with a 800 nm long-pass filter) — are used for 4-wavelengths illumination of skin via a visible – near infrared polarizer (#33084, Edmund Optics, UK). A spiral-shaped flat loop of side-emitting 400 micron silica core optical fiber (Light Guide Optics Ltd., LV) serves as the illumination source [28]. The fiber is SMA-terminated at both ends; one of them is used for the RGB laser input and the other one is used for the 850 nm laser input. In result, the examined skin area is uniformly illuminated by the four above-mentioned laser spectral lines. Four 405 nm, 40 mW laser diodes (DL-5146-101S, Roithner, AT) are square-placed inside the fiber spiral to enable the excitation of skin autofluorescence. The skin target area is round with a diameter of 10, 20, or 30 mm, depending on the used changeable conical nozzle, which is inside-covered by a black coating film (Spectral Black, Actar, IL). The device is fully self-sustained using four rechargeable Li-ion batteries (INR18650-35E, Samsung, KR) for power supply.
A four-band RGB-NIR camera (MSC-RGBN-1-A, Spectral Devices Inc., CA) covered by a 420 nm long-pass filter, equipped with an objective lens (25 mm #67-715, Edmund Optics, US) and top-mounted orthogonally oriented VIS-NIR polarizer, is capturing an image of the targeted skin area with subsequent extraction of the four spectral line images. They are further stored in the embedded single-board computer (Rock960, Vamrs, CN) and wi-fi transmitted to an external computer for the calculation of four chromophore distribution maps using the previously developed algorithm [9]. Within a second, the laser modules are switched off, violet lasers are switched on, and an autofluorescence image at the G-channel of the camera is captured. This image is also transmitted to the external computer in order to discriminate seborrheic keratosis from skin melanoma and other pigmented lesions [29]. The second imaging step can be skipped or used alone, if necessary.
The device is initiated by an operator pushing the START button and selecting the appropriate operation mode (SMSLI only, AF image only, combined mode) and exposure time for the RGB-NIR camera. Then, the camera and lasers are switched on, and the device is properly placed on the skin target area (monitored on the round display). After pressing the SHOT button, a micro-controller (STM32G071, STMicroelectronics, CH) synchronizes the proper illumination of the target to capture the image (or set of images), which is/are read by the single-board-computer. The recorded images can be seen on the display and/or are transmitted via the single-board computer’s wi-fi to the remote computer for the calculation of chromophore maps or performing other tasks.
The recorded RAW images (2048 × 2048 pixels) are stored on the computer hard disk. In order to get correct multi-spectral reflectance images, first, the RAW data are pre-processed. RAW images are converted into R-G-B-IR spectral line images (512×512 pix.) using the SpectralDevices debayering algorithm and the available spectral sensitivity curves of four detection bands (Figure 4). Then, the spectral un-mixing is done using linear operation:
I = A * Is−1
where Is(x,y,λ) is a matrix consisting of intensity values of the spectral image at the xy pixel and the given wavelength λ, and I(x,y,λ) is spectrally-unmixed image; A(λ) is the correction matrix calculated from the camera photo-sensitivity curves.
Next, flat-field correction for each spectral image is performed, using a special image filtering technique. The idea is to compensate for possible uneven illumination caused by a deformed skin surface caused by the device’s cap pressure. To find the non-evenness function of surface illumination, a 2D median filter is applied (kernel size 128 × 128 pixels); then, the spectral image is divided by this function. The normalized reflectance image is calculated as:
R = (I - Id)/(If - Id)
where R(x,y) is a reflectance at each xy pixel of the spectral image, Id is an image measured in dark conditions (the image values depends on the camera gain, exposure, and temperature), and If(x,y) is the filtered image. The Id spectral images are acquired before or after each measurement. Finally, the image outside the region of interest is masked with dark pixels to highlight the circular image area on the monitor screen. The processing of MS data is done by custom designed Matlab software. The software performs off-line processing of RAW image data using the algorithms described above.
The user’s interface (Figure 5) is designed for live showing of skin target and the recorded/stored skin images. The device can be managed by means of the touchscreen display. The software allows the manual adjustment of device parameters such as the intensity of light sources, camera gain, and exposure. Before each measurement, specific patient data and identification of the examined skin malformation are stored. The two image sets (four spectral line images and the autofluorescence image) are captured within two seconds. All recorded images are transmitted to the monitor screen. The measurement data also can be transferred to the remote server computer for more detailed analysis.
Outlook of the prototype device is presented in Figure 6.

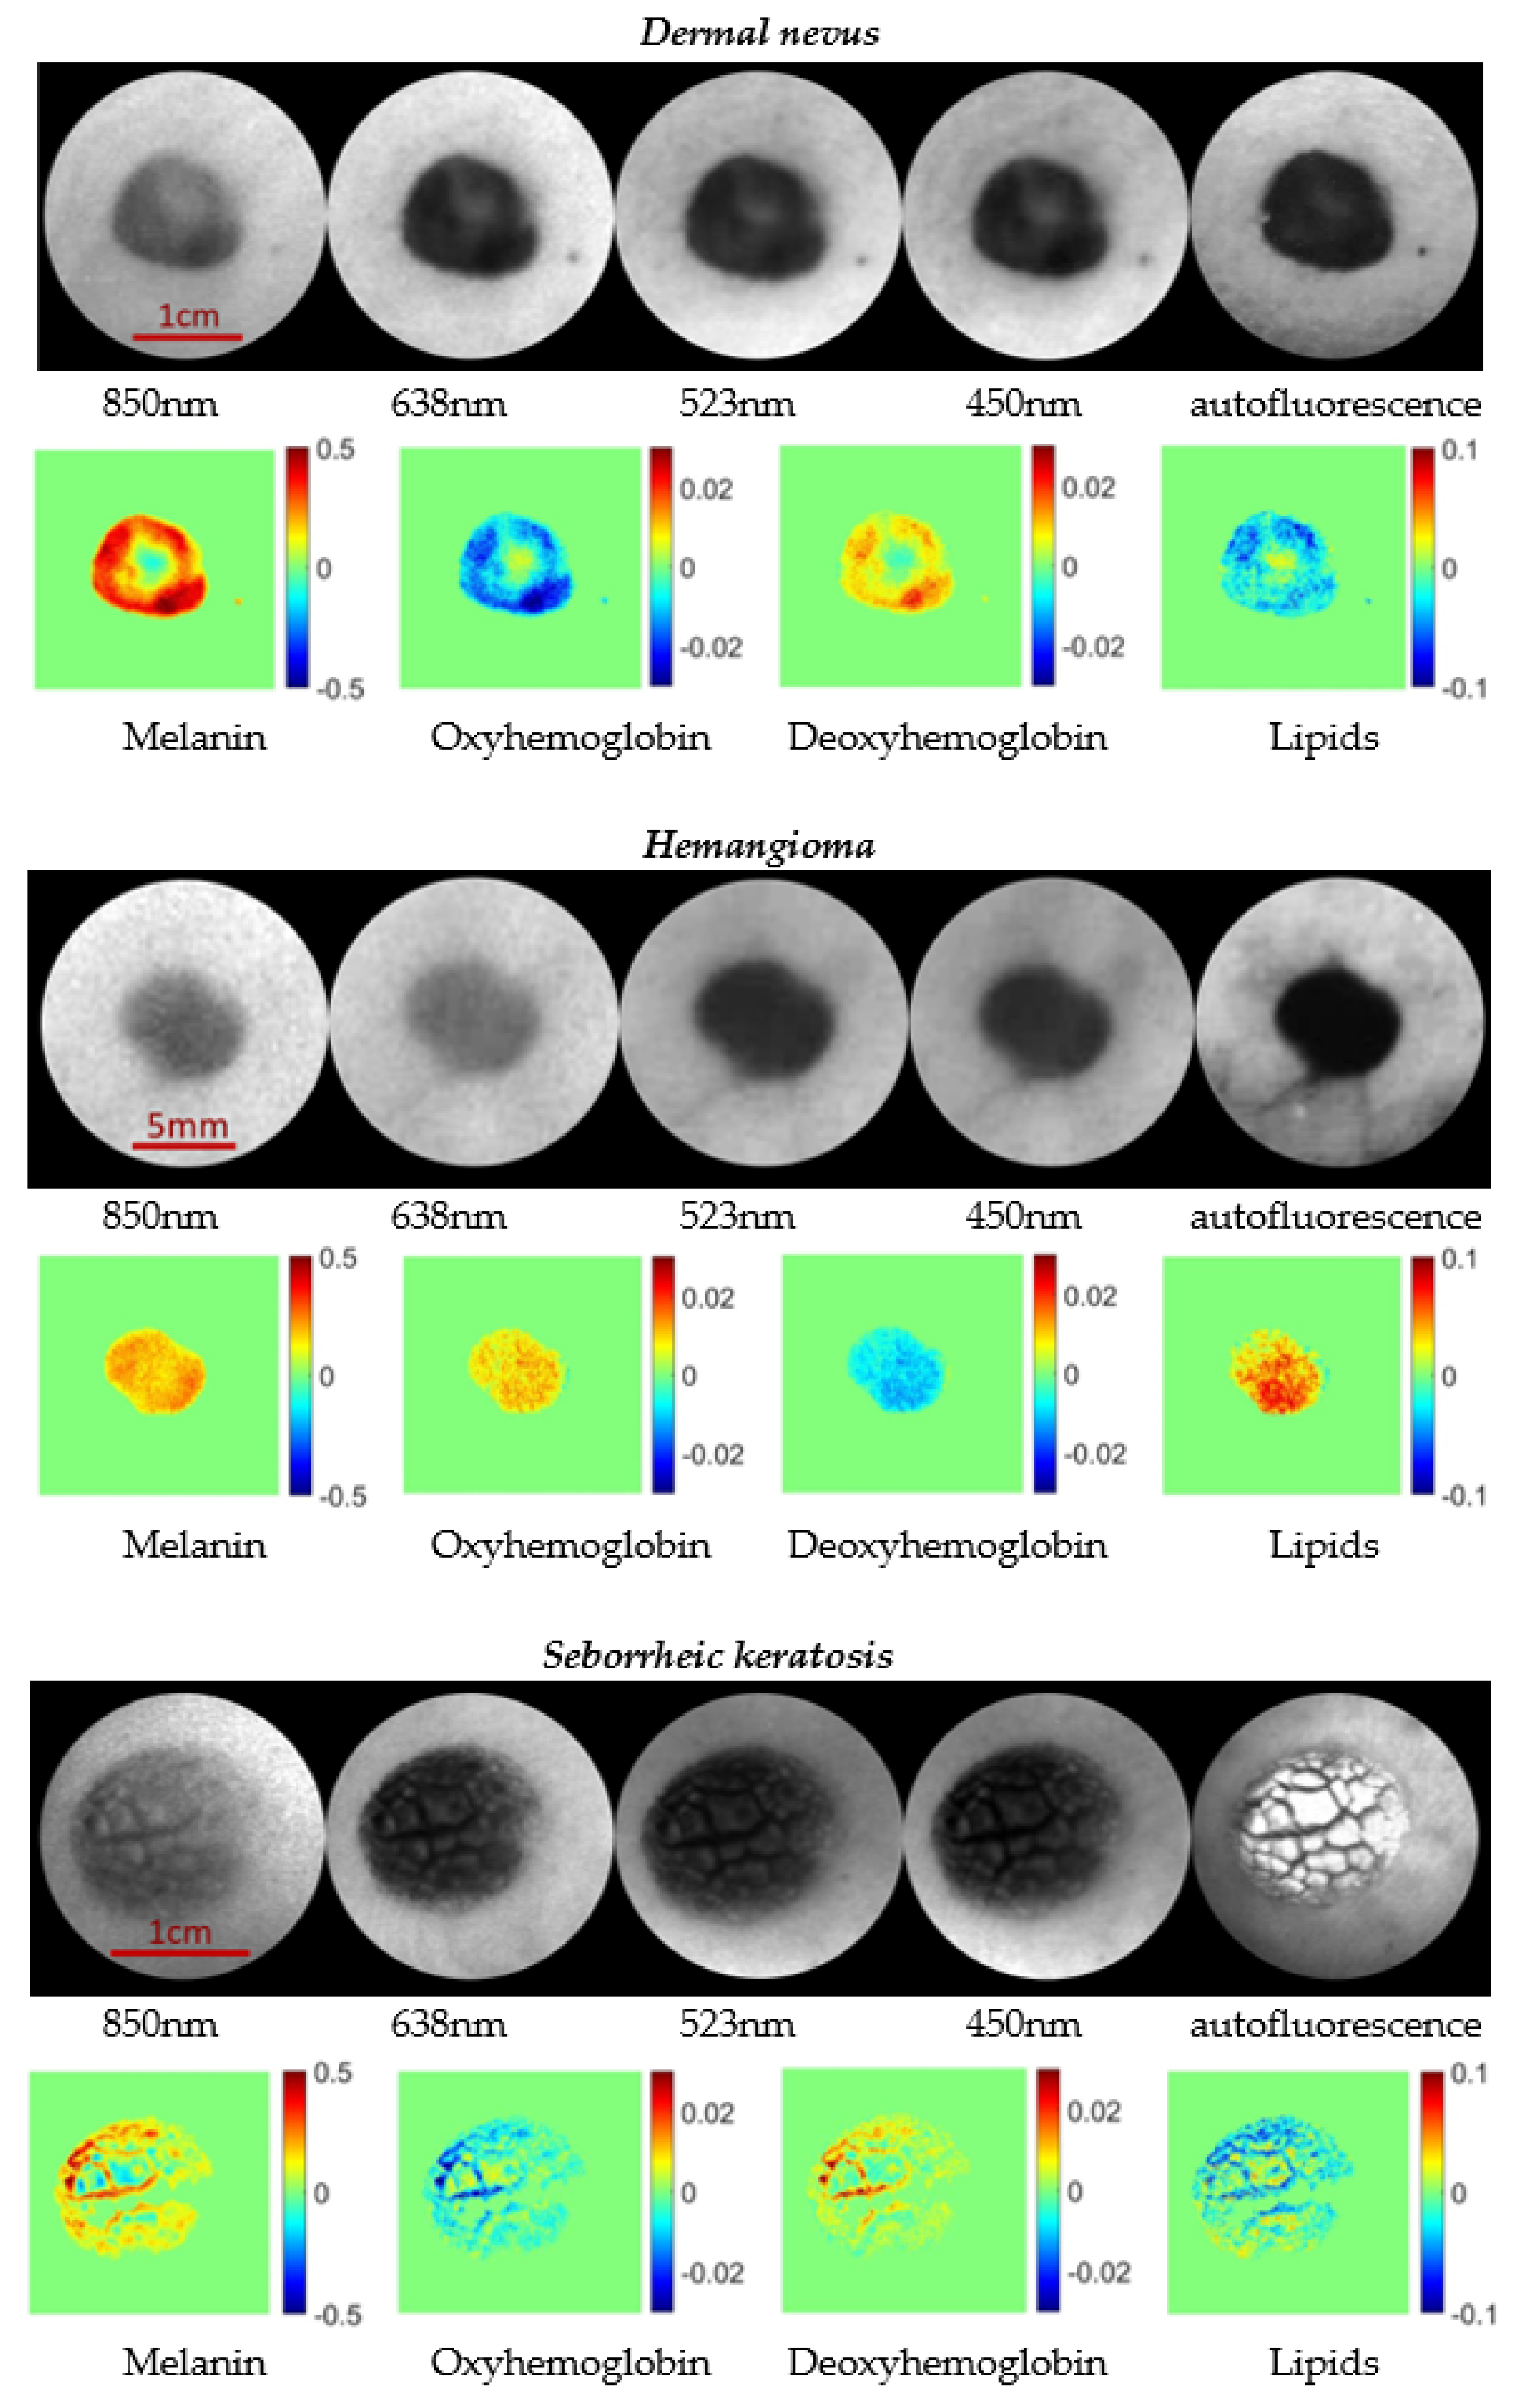
4. The Device Test Results

The device clinical validation was just started, and only two trials have been performed so far. Examples of some captured/extracted spectral line image/autofluorescence image sets are presented in Figure 7. Depending on wavelength, the contrast in the spectral line images changes due to the different penetration depth in skin. In the case of dermal nevus (upper row)—a pigmented lesion located below the epidermal–dermal junction—notably increased melanin content is observed with slight changes in the concentrations of three other chromophores. Hemangioma (middle row) is a vascular malformation where an increased content of oxy-hemoglobin is accompanied with a decreased content of deoxy-hemoglobin (relatively to the surrounding healthy skin). Seborrheic keratosis (lower row) is a pigmented lesion that frequently is misdiagnosed as malignant basalioma or melanoma; it also exhibits increased melanin content. In contrary to the other skin malformations, seborrheic keratosis has a unique feature of brighter autofluorescence (under the 405 nm excitation) than that of the surrounding healthy skin [29]—this is clearly seen if the three presented autofluorescence images are compared.
To conclude, the initial test data are in general agreement with the data obtained in previous multi-spectral skin imaging studies [5,12,23,24] and confirm the potential of the proposed device for non-contact assessment of various skin malformations.

5. Discussion

The above-described device has complemented the family of our previously developed proof-of-concept prototypes for non-contact assessment of in vivo human skin [21,30]. Its design is compact and ergonomic, and it is well-adapted for routine clinical applications. However, several technical problems to be solved in near future still exist. Camera read-out software has to be updated in order to analyze all pixel information—currently, the used manufacturer’s software provides only ¼ of the full image data. The long-pass filter mounted in front of the camera seems to be responsible for some interference artefacts in the spectral line images to be removed in the future. It appears that the cooling system of the device has to be updated, as both the camera and the processing unit are heated up during the operation more than initially expected. The conical nozzles are to be supplemented with soft rings on their tips to enhance the patient comfort and to avoid pressure-caused deformation of the skin area under examination. In addition, the adaptation of illumination intensity for different skin photo-types under Fitzpatrick classification seems to be a future issue, as well as further improvements of the software for the mapping of four chromophore concentration distributions over the malformation area.

6. Patents

Patents [19] and [28] were used in the presented design solution.

Author Contributions

Conceptualization, J.S., M.M., Z.R. and U.R.; methodology, J.S., I.O. and Z.R.; software, U.R. and Z.R.; validation, I.O. and U.R.; writing—original draft preparation, J.S., U.R., Z.R., I.O., M.M.; project administration, J.S. All authors have read and agreed to the published version of the manuscript.

Funding

This research was funded by the Latvian Council of Science, grant number lzp-2018/2-0006 “Advanced spectral imaging technology for skin diagnostics”.

Acknowledgments

Additional support by Institute of Atomic Physics and Spectroscopy, University of Latvia (project # Y9-BO54-ZF-N-109) is highly appreciated.

Conflicts of Interest

The authors declare no conflict of interest.

References

  1. Shah, M.; Heath, R.; Chadwick, S. Abnormal pigmentation within cutaneous scars: A complication of wound healing. Indian J. Plast. Surg. 2012, 45, 403–411. [Google Scholar]
  2. Ngan, V.; Writer, S. Spectrophotometric Analysis of Skin Lesions | DermNet NZ. Available online: https://dermnetnz.org/topics/spectrophotometric-analysis-of-skin-lesions (accessed on 18 October 2020).
  3. Sterenborg, H.J.C.M.; Motamedi, M.; Wagner, R.F.; Duvic, M.; Thomsen, S.; Jacques, S.L. In vivo fluorescence spectroscopy and imaging of human skin tumours. Lasers Med. Sci. 1994, 9, 191–201. [Google Scholar] [CrossRef]
  4. Lihachev, A.; Derjabo, A.; Ferulova, I.; Lange, M.; Lihacova, I.; Spigulis, J. Autofluorescence imaging of basal cell carcinoma by smartphone RGB camera. J. Biomed. Opt. 2015, 20. [Google Scholar] [CrossRef] [PubMed]
  5. Bliznuks, D.; Derjabo, A.; Lihacova, I.; Bolochko, K.; Plorina, E.V.; Lange, M.; Lihachev, A. A method for skin malformation classification by combining multispectral and skin autofluorescence imaging. In Proceedings of the Biophotonics: Photonic Solutions for Better Health Care VI, Strasbourg, France, 23–26 April 2018; Volume 10685, p. 113. [Google Scholar]
  6. Anderson, R.R.; Parrish, J.A. The optics of human skin. J. Invest. Dermatol. 1981, 77, 13–19. [Google Scholar] [CrossRef] [PubMed] [Green Version]
  7. Välisuo, P.; Kaartinen, I.; Tuchin, V.; Alander, J. New closed-form approximation for skin chromophore mapping. J. Biomed. Opt. 2011, 16. [Google Scholar] [CrossRef] [PubMed]
  8. Ruvolo, E.C., Jr.; Bargo, P.R.; Dietz, T.; Scamuffa, R.; Shoemaker, K.; DiBernardo, B.; Kollias, N. Use of spectral imaging for documentation of skin parameters in face lift procedure. In Proceedings of the Photonic Therapeutics and Diagnostics VI, San Francisco, CA, USA, 23–25 January 2010; Volume 7548. [Google Scholar]
  9. Stratis, D.N.; Eland, K.L.; Carter, J.C.; Tomlinson, S.J.; Angel, S.M. Comparison of acousto-optic and liquid crystal tunable filters for laser-induced breakdown spectroscopy. Appl. Spectrosc. 2001, 55. [Google Scholar] [CrossRef]
  10. Randeberg, L.L.; Larsen, E.L.P.; Svaasand, L.O. Characterization of vascular structures and skin bruises using hyperspectral imaging, image analysis and diffusion theory. J. Biophotonics 2010, 3, 53–65. [Google Scholar] [CrossRef] [PubMed]
  11. Yudovsky, D.; Nouvong, A.; Schomacker, K.; Pilon, L. Assessing diabetic foot ulcer development risk with hyperspectral tissue oximetry. J. Biomed. Opt. 2011, 16. [Google Scholar] [CrossRef] [PubMed]
  12. Vasefi, F.; MacKinnon, N.; Saager, R.; Kelly, K.M.; Maly, T.; Booth, N.; Durkin, A.J.; Farkas, D.L. Separating melanin from hemodynamics in nevi using multimode hyperspectral dermoscopy and spatial frequency domain spectroscopy. J. Biomed. Opt. 2016, 21. [Google Scholar] [CrossRef] [PubMed] [Green Version]
  13. Kuzmina, I.; Diebele, I.; Spigulis, J.; Valeine, L.; Berzina, A.; Abelite, A. Contact and contactless diffuse reflectance spectroscopy: Potential for recovery monitoring of vascular lesions after intense pulsed light treatment. J. Biomed. Opt. 2011, 16. [Google Scholar] [CrossRef] [PubMed]
  14. Morimoto, C.; Chellappa, R. Evaluation of image stabilization algorithms. In Proceedings of the International Conference on Acoustics, Speech and Signal Processing, Seattle, WA, USA, 12–15 May 1998; Volume 5, pp. 2789–2792. [Google Scholar]
  15. Jakovels, D.; Rubins, U.; Spigulis, J. RGB imaging system for mapping and monitoring of hemoglobin distribution in skin. In Proceedings of the Imaging Spectrometry XVI, San Diego, CA, USA, 22–23 August 2011; Volume 8158. [Google Scholar]
  16. Kapsokalyvas, D.; Bruscino, N.; Alfieri, D.; de Giorgi, V.; Cannarozzo, G.; Cicchi, R.; Massi, D.; Pimpinelli, N.; Pavone, F.S. Spectral morphological analysis of skin lesions with a polarization multispectral dermoscope. Opt. Express 2013, 21. [Google Scholar] [CrossRef] [PubMed]
  17. Spigulis, J.; Oshina, I.; Potapovs, P.; Lauberts, K. Snapshot multi-spectral-line imaging for applications in dermatology and forensics. In Proceedings of the Imaging, Manipulation, and Analysis of Biomolecules, Cells, and Tissues XVII, San Francisco, CA, USA, 2–7 February 2019; Volume 10881. [Google Scholar]
  18. Spigulis, J.; Oshina, I.; Matulenko, M. Laser illumination designs for snapshot multi-spectral-line imaging. In Proceedings of the 2019 Conference on Lasers and Electro-Optics Europe and European Quantum Electronics Conference, CLEO, Munich, Germany, 23–27 June 2019. [Google Scholar]
  19. Spigulis, J.; Elste, L. Method and Device for Imaging of Spectral Reflectance at Several Wavelength Bands. WO 2013135311 A1, 16 July 2012. [Google Scholar]
  20. Spigulis, J.; Elste, L. Single snapshot RGB multispectral imaging at fixed wavelengths: Proof of concept. In Proceedings of the Multimodal Biomedical Imaging IX, San Francisco, CA, USA, 1–6 February 2014; Volume 8937. [Google Scholar]
  21. Spigulis, J. Multispectral, Fluorescent and Photoplethysmographic Imaging for Remote Skin Assessment. Sensors 2017, 17, 1165. [Google Scholar] [CrossRef] [PubMed] [Green Version]
  22. Oshina, I.; Potapovs, P.; Spigulis, J. Spectral imaging system for money counterfeit detection. In Proceedings of the Optics InfoBase Conference Papers, OSA Technical Digest, Munich, Germany, 24–27 June 2019, ITu3B.3.
  23. Spigulis, J.; Oshina, I. Snapshot RGB mapping of skin melanin and hemoglobin. J. Biomed. Opt. 2015, 20. [Google Scholar] [CrossRef] [PubMed]
  24. Spigulis, J.; Oshina, I.; Berzina, A.; Bykov, A. Smartphone snapshot mapping of skin chromophores under triple-wavelength laser illumination. J. Biomed. Opt. 2017, 22. [Google Scholar] [CrossRef] [PubMed]
  25. Spigulis, J.; Rupenheits, Z.; Matulenko, M.; Oshina, I.; Rubins, U. A snapshot multi-wavelengths imaging device for in-vivo skin diagnostics. In Proceedings of the Multimodal Biomedical Imaging XV, San Francisco, CA, USA, 6–11 March 2020. [Google Scholar]
  26. Prahl, S. Tabulated Molar Extinction Coefficient for Hemoglobin in Water. Available online: https://omlc.org/spectra/hemoglobin/summary.html (accessed on 18 October 2020).
  27. Sarna, T.; Swartz, H.M. The Physical Properties of Melanin. Available online: https://omlc.org/spectra/melanin/eumelanin.html (accessed on 18 October 2020).
  28. Spigulis, J.; Osina, I.; Rupenheits, Z.; Matulenko, M. Device for Uniform Surface Illumination Simultaneously by Several Spectral Lines. Patent LV 15491 B, 20 September 2020. [Google Scholar]
  29. Lihachev, A.; Lihacova, I.; Plorina, E.V.; Lange, M.; Derjabo, A.; Spigulis, J. Differentiation of seborrheic keratosis from basal cell carcinoma, nevi and melanoma by RGB autofluorescence imaging. Biomed. Opt. Express 2018, 9, 1852–1858. [Google Scholar] [CrossRef] [PubMed] [Green Version]
  30. Spigulis, J. Biophotonic technologies for noninvasive assessment of skin condition and blood microcirculation. Latv. J. Phys. Tech. Sci. 2012, 49, 63–80. [Google Scholar]
Figure 1. Absorption features of three main skin chromophores at three fixed wavelengths [24,26,27].
Applsci 10 07472 g001
Figure 2. Block-diagram of the device.
Applsci 10 07472 g002
Figure 3. Design scheme of the prototype device.
Applsci 10 07472 g003
Figure 4. Spectral sensitivities of the used four-band image sensor (manufacturer’s data); dotted lines represent the working wavelengths.
Applsci 10 07472 g004
Figure 5. The user’s interface.
Applsci 10 07472 g005
Figure 6. The prototype device in operation.
Applsci 10 07472 g006
Figure 7. Spectral line and autofluorescence images of three skin malformations taken by the prototype device with the correspondingly calculated chromophore distribution maps. Units of the concentration increase/decrease are mili-moles for the first three chromophores and moles for lipids.
Applsci 10 07472 g007
Publisher’s Note: MDPI stays neutral with regard to jurisdictional claims in published maps and institutional affiliations.

