1. Introduction
The majority of dental and oral imaging is performed by X-ray-based techniques or by digital photography. While panoramic radiographs and computed tomography scans reveal anatomical and pathological structures of the teeth and alveolar bone, they expose the patient to ionizing radiation and possibly to non-risk-free contrast agents. The risks increase the barrier for imaging. Additionally, these imaging methods are suitable for hard tissue only. Soft-tissue diagnostics requires alternate methods. Digital photography is more suitable for soft tissue and avoids these risks while still providing useful diagnostic information, even of hard tissue (although this is limited to surface features).
From data analysis aspect, these methods offer only a limited amount of information. X-ray-based techniques produce intensity graphs of transmitted radiation, i.e., grayscale images, and allow for analysis of spatial structures and their brightness only [
1,
2,
3,
4]. X-ray techniques do not acquire any color information or provide comparable multichannel images. Digital photography has been designed to accommodate human color vision, and therefore acquires only a limited amount of color information. A digital photograph consists of only red, green, and blue color channels designed to approximately match the short-, middle-, and long-wavelength detecting cones of the human eye. The color of an object, however, is a more complex question. An illuminated object reflects different wavelengths at different strengths—it has a wavelength-dependent
reflectance. Accurate evaluation of an object’s color depends on measuring this reflectance spectrum.
Spectral imaging [
5,
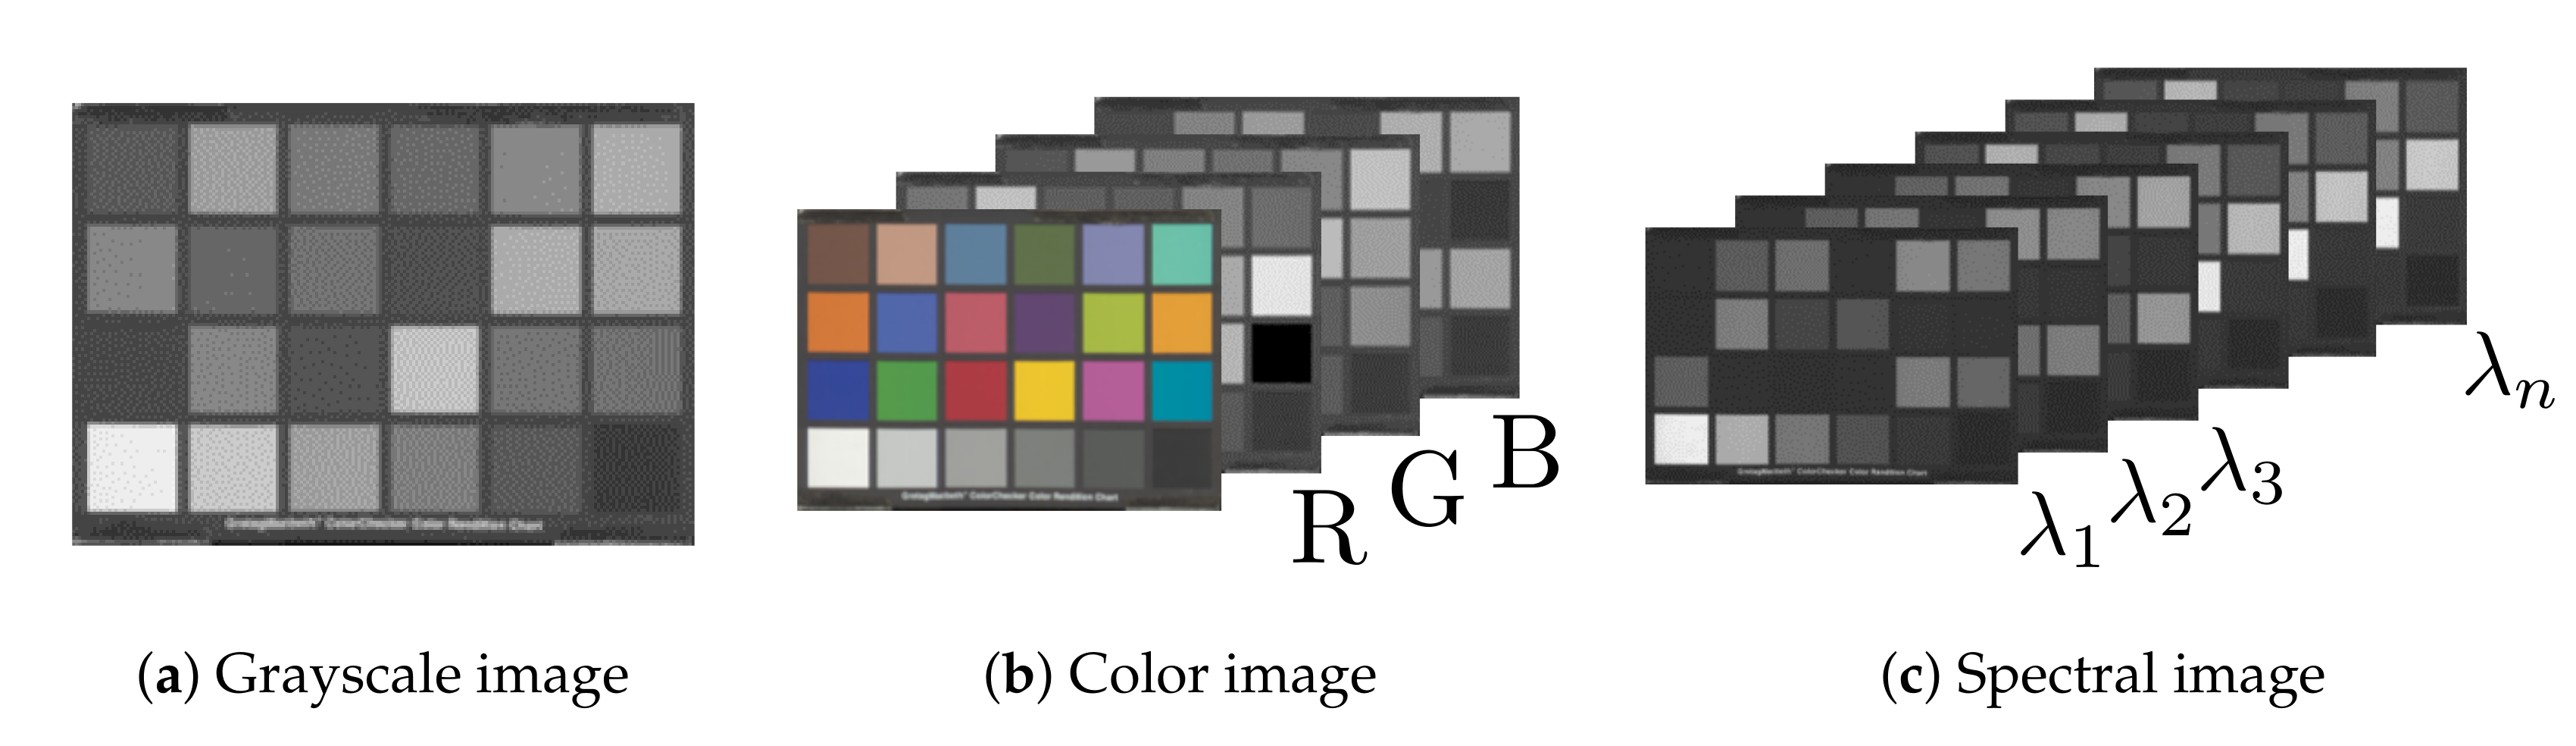
6] increases the number of channels by imaging narrow contiguous wavelength bands, and can thus record the reflection spectrum of a sample. Generally, spectral imaging systems may also extend the data acquisition range outside of the visible range (380–780 nm) to cover parts of the ultraviolet (10–380 nm) and infrared regions (780 nm–1 mm). The data files produced by these methods—X-ray imaging, digital photography, and spectral imaging—can, therefore, be divided into three categories: grayscale, color, and spectral images (
Figure 1). The additional information provided by spectral imaging enables new data analysis and visualization methods compared to grayscale or color images.
In the context of dental and oral imaging, healthy and diseased tissue may exhibit subtle changes in their reflection spectra. Accurate spectral imaging solutions can capture these spectra with high fidelity, while data-analysis methods may be able to differentiate these spectra. Successful data-analysis can allow the design of optimized optical imaging solutions for targeted diagnostic analyses. In the simplest cases, spectral images can be used to design systems that enhance the visibility of a targeted feature, for example, by applying different weights on the bands while computing a color image representation [
7], or by optimizing contrast to produce optimal optical filters [
8,
9]. The selected spectra could also be used in training targeted diagnostic imaging systems, like spectral filter array cameras [
10], or in automatic diagnostic image segmentation based on deep learning [
11].
Medical spectral imaging has been gaining attention, and research in, e.g., retinal disease [
12], breast [
13] and tongue [
14] cancer diagnosis has shown promising results. Despite the amount of research performed and the rise in open-access principles, freely and publicly available medical spectral imaging datasets are still relatively rare. Examples of the few public medical spectral image datasets include images of brain [
15,
16] and retinal [
17] tissue. These publicly available image sets require contacting the authors for access.
Using modern spectral cameras, we have collected a novel database of oral and dental spectral images as part of our DIGIDENT-project. The project aimed to research the suitability of spectral imaging in oral dental diagnostics. Our dental and oral spectral image database—ODSI-DB—contains 316 spectral images from human test subjects. The front-view and the occlusal surfaces of lower and upper teeth, oral mucosa, and face surrounding the mouth were imaged from all test subjects. Other features of interest were imaged on a case-by-case basis. When possible, additional medically relevant information was collected from the test subjects—pulse, blood pressure, and blood oxygen saturation—both before and after the imaging session. The database comes with annotations marking the features of interest. The annotations were made by dental experts, who used an annotation tool built for the project. We have successfully used the database to develop a prototype optical imaging system based on partially negative filters derived from principal component analysis of healthy and diseased tissue [
9], and in automatic image segmentation and classification based on a convolutional neural network [
11].
To the best of our knowledge, our oral and dental spectral image database is the first of its kind to be made publicly available under a permissive license for the research community. The database is available online at the following address:
https://sites.uef.fi/spectral/odsi-db/.
2. Materials and Methods
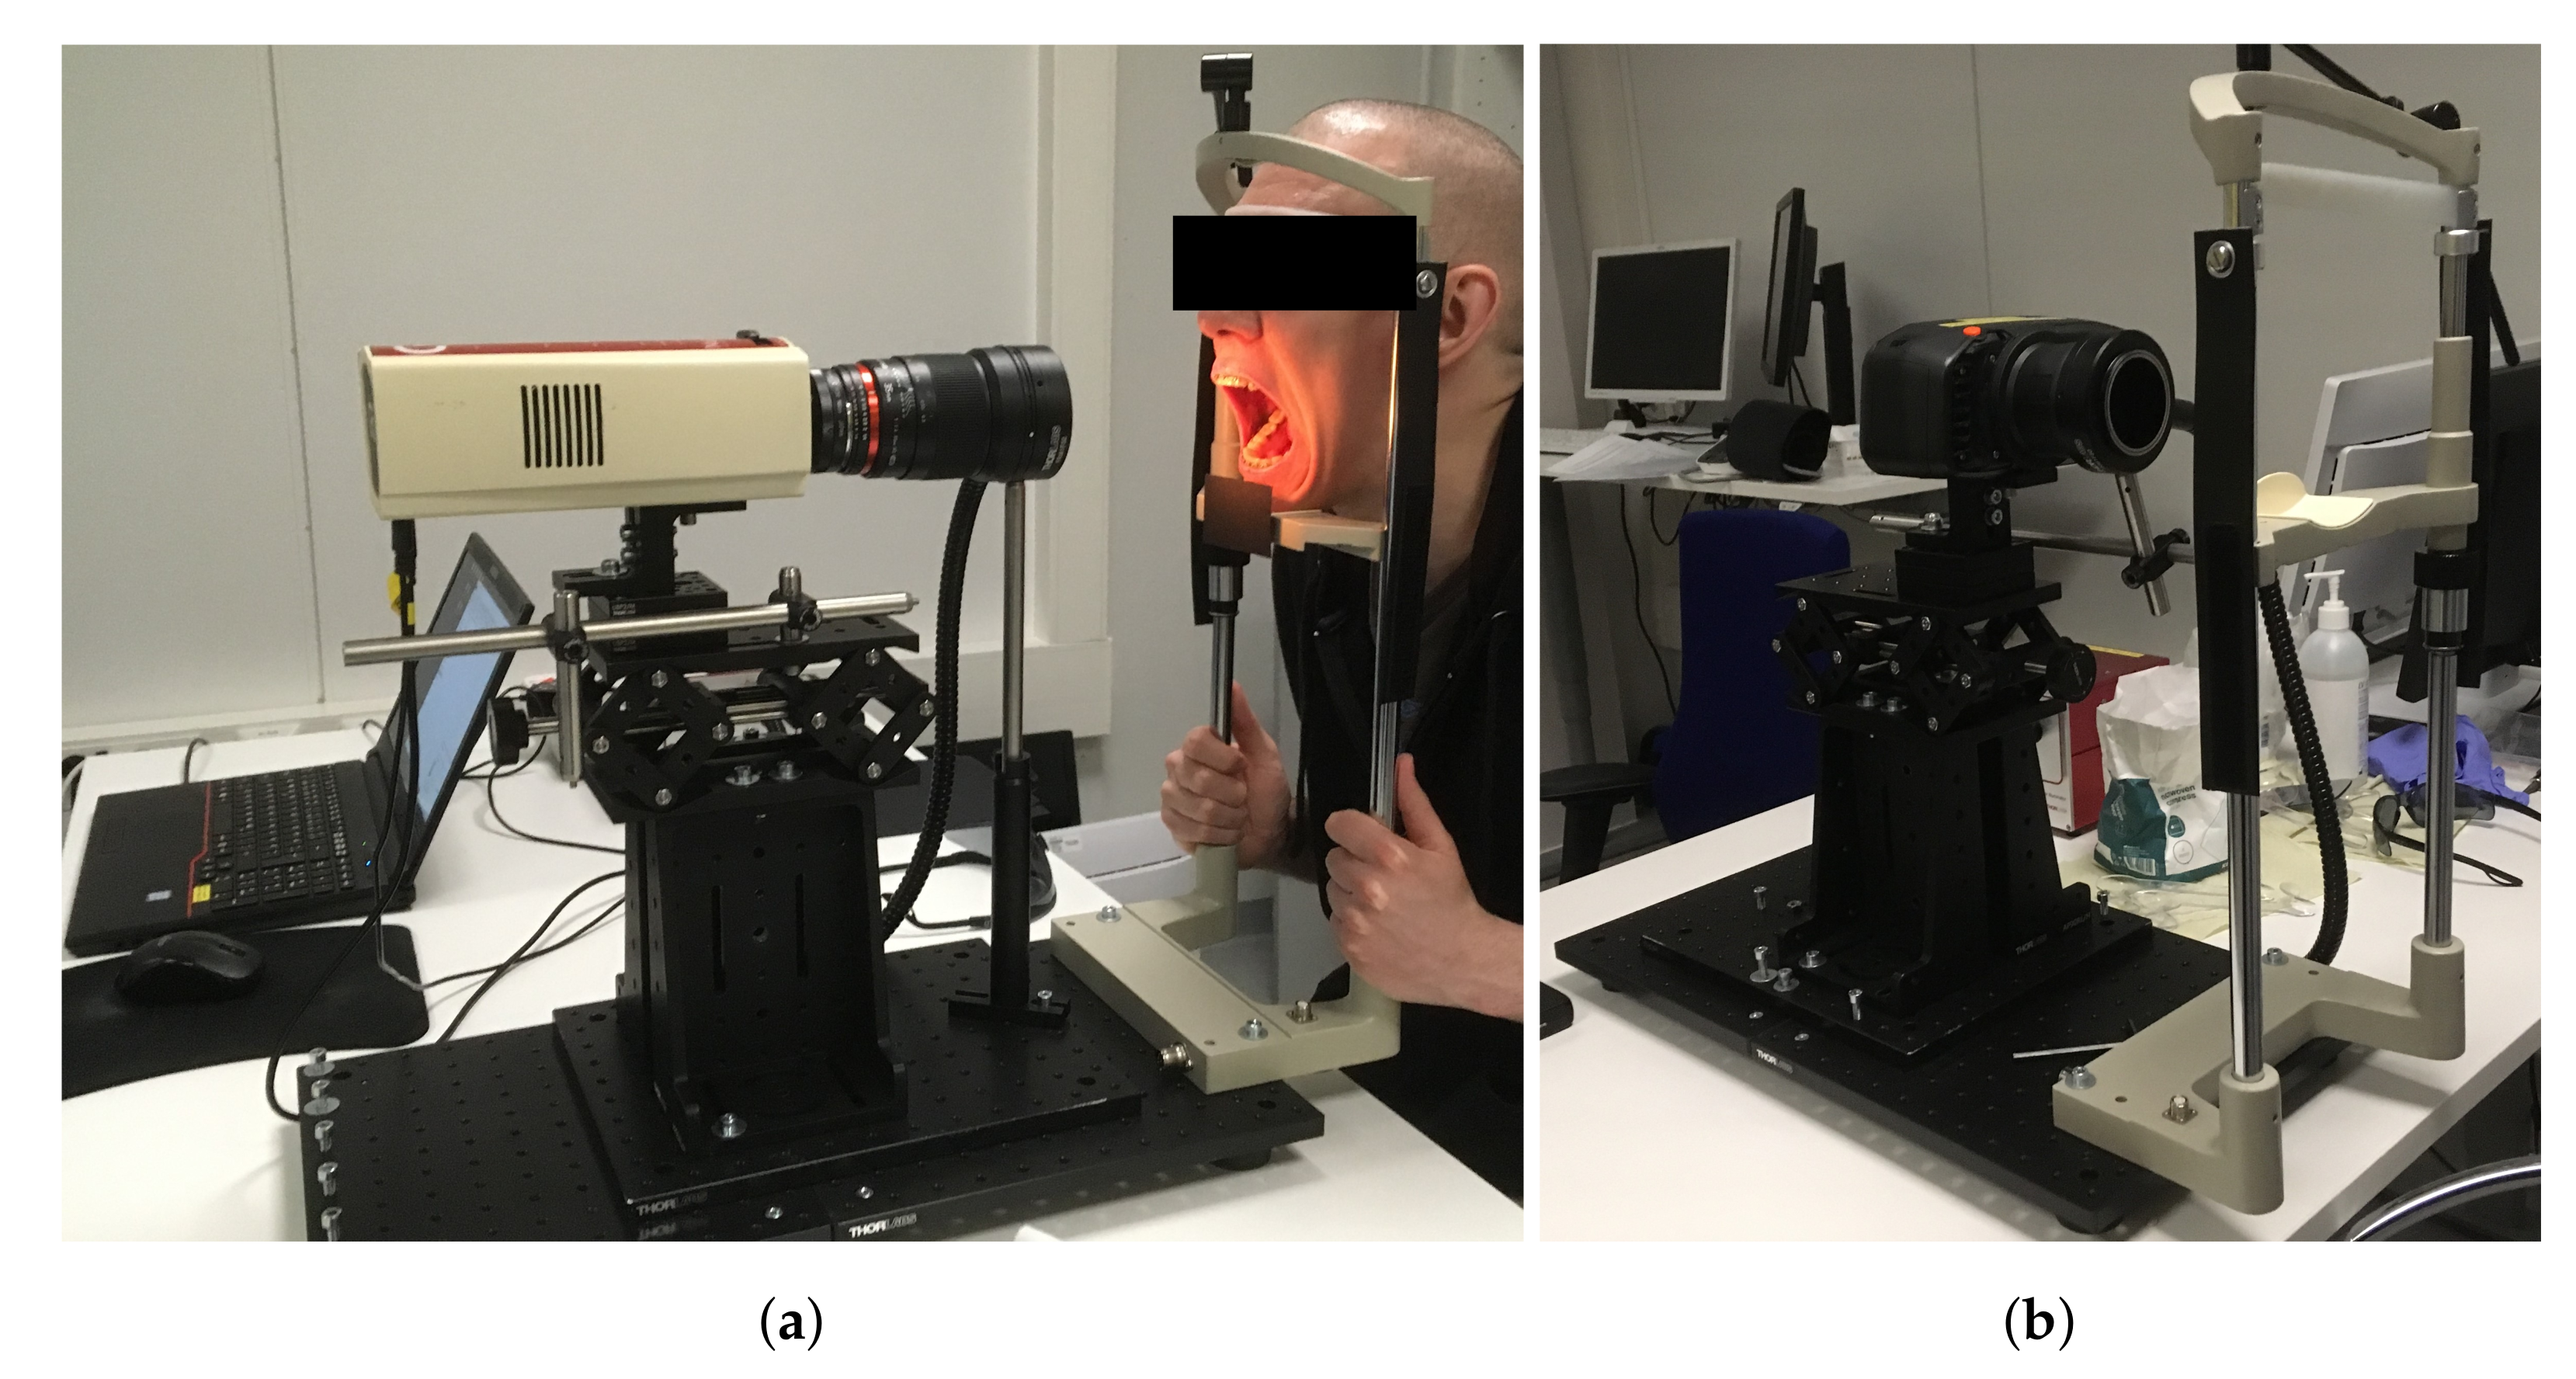
The optical imaging system built for dental and oral imaging consisted of a spectral camera, a ring illuminator (FRI61F50, Thorlabs Inc., Newton, NJ, USA), a halogen light source (Thorlabs OSL2, Thorlabs Inc., Newton, NJ, USA) with an extended IR-range light bulb (OSL2BIR, Thorlabs Inc., Newton, NJ, USA), and a chin–forehead rest, all mounted on a platform, making the system mobile, see
Figure 2.
Initially, the spectral camera chosen was the Nuance EX (CRI, PerkinElmer, Inc., Waltham, MA, USA). The camera allows imaging at 1392 × 1040 pixel spatial resolution and has spectral resolution in the range 450–950 nm with 10 nm bands (51 bands in total). The Nuance EX spectral camera was subsequently replaced with Specim IQ (Specim, Spectral Imaging Ltd., Oulu, Finland). The Specim IQ spectral camera has a lower spatial resolution (512 × 512 pixels), but the spectral resolution has an increased range of 400–1000 nm with approximately 3-nm steps (204 bands in total). Both spectral cameras have 12-bit sensors. Switching the camera simplified the imaging significantly: Nuance EX camera requires two runs per one imaging, once to determine optimal integration times for the spectral bands and a second run to perform the actual image capture. Specim IQ is a line-scanning camera with a constant integration time over the band images.
The chin–forehead rest was used to reduce the involuntary head movements during imaging and was connected to the main platform of the optical setup. The ring illuminator and the camera were mounted on another platform that was allowed to freely slide over the main platform to allow optimal imaging geometry in relation to the test subject.
For image normalization purposes (see below), we imaged a reference sample with a known reflectance spectrum during the imaging process. The reference sample used was a matt diffuse gray ceramic sample (“Matt Diff Grey”, Ceram Research, Ltd., Lucideon, Ltd., Stoke-on-Trent, UK) instead of a white plate. White references were found to give over-saturated responses, while the corresponding sample remained under-exposed.
The Institute of Dentistry of University of Eastern Finland (UEF) recruited the test subjects at the UEF’s Dental School Clinic (Kuopio, Finland) and the UEF’s School of Computing recruited test subjects in Joensuu, Finland. Ethical permission for the research was granted by The Hospital District of Northern Savo, Kuopio, Finland (413/2016). The volunteering test subjects were fully informed about the research and gave their written consent prior to spectral imaging. A total of 30 test subjects were recruited for the spectral imaging.
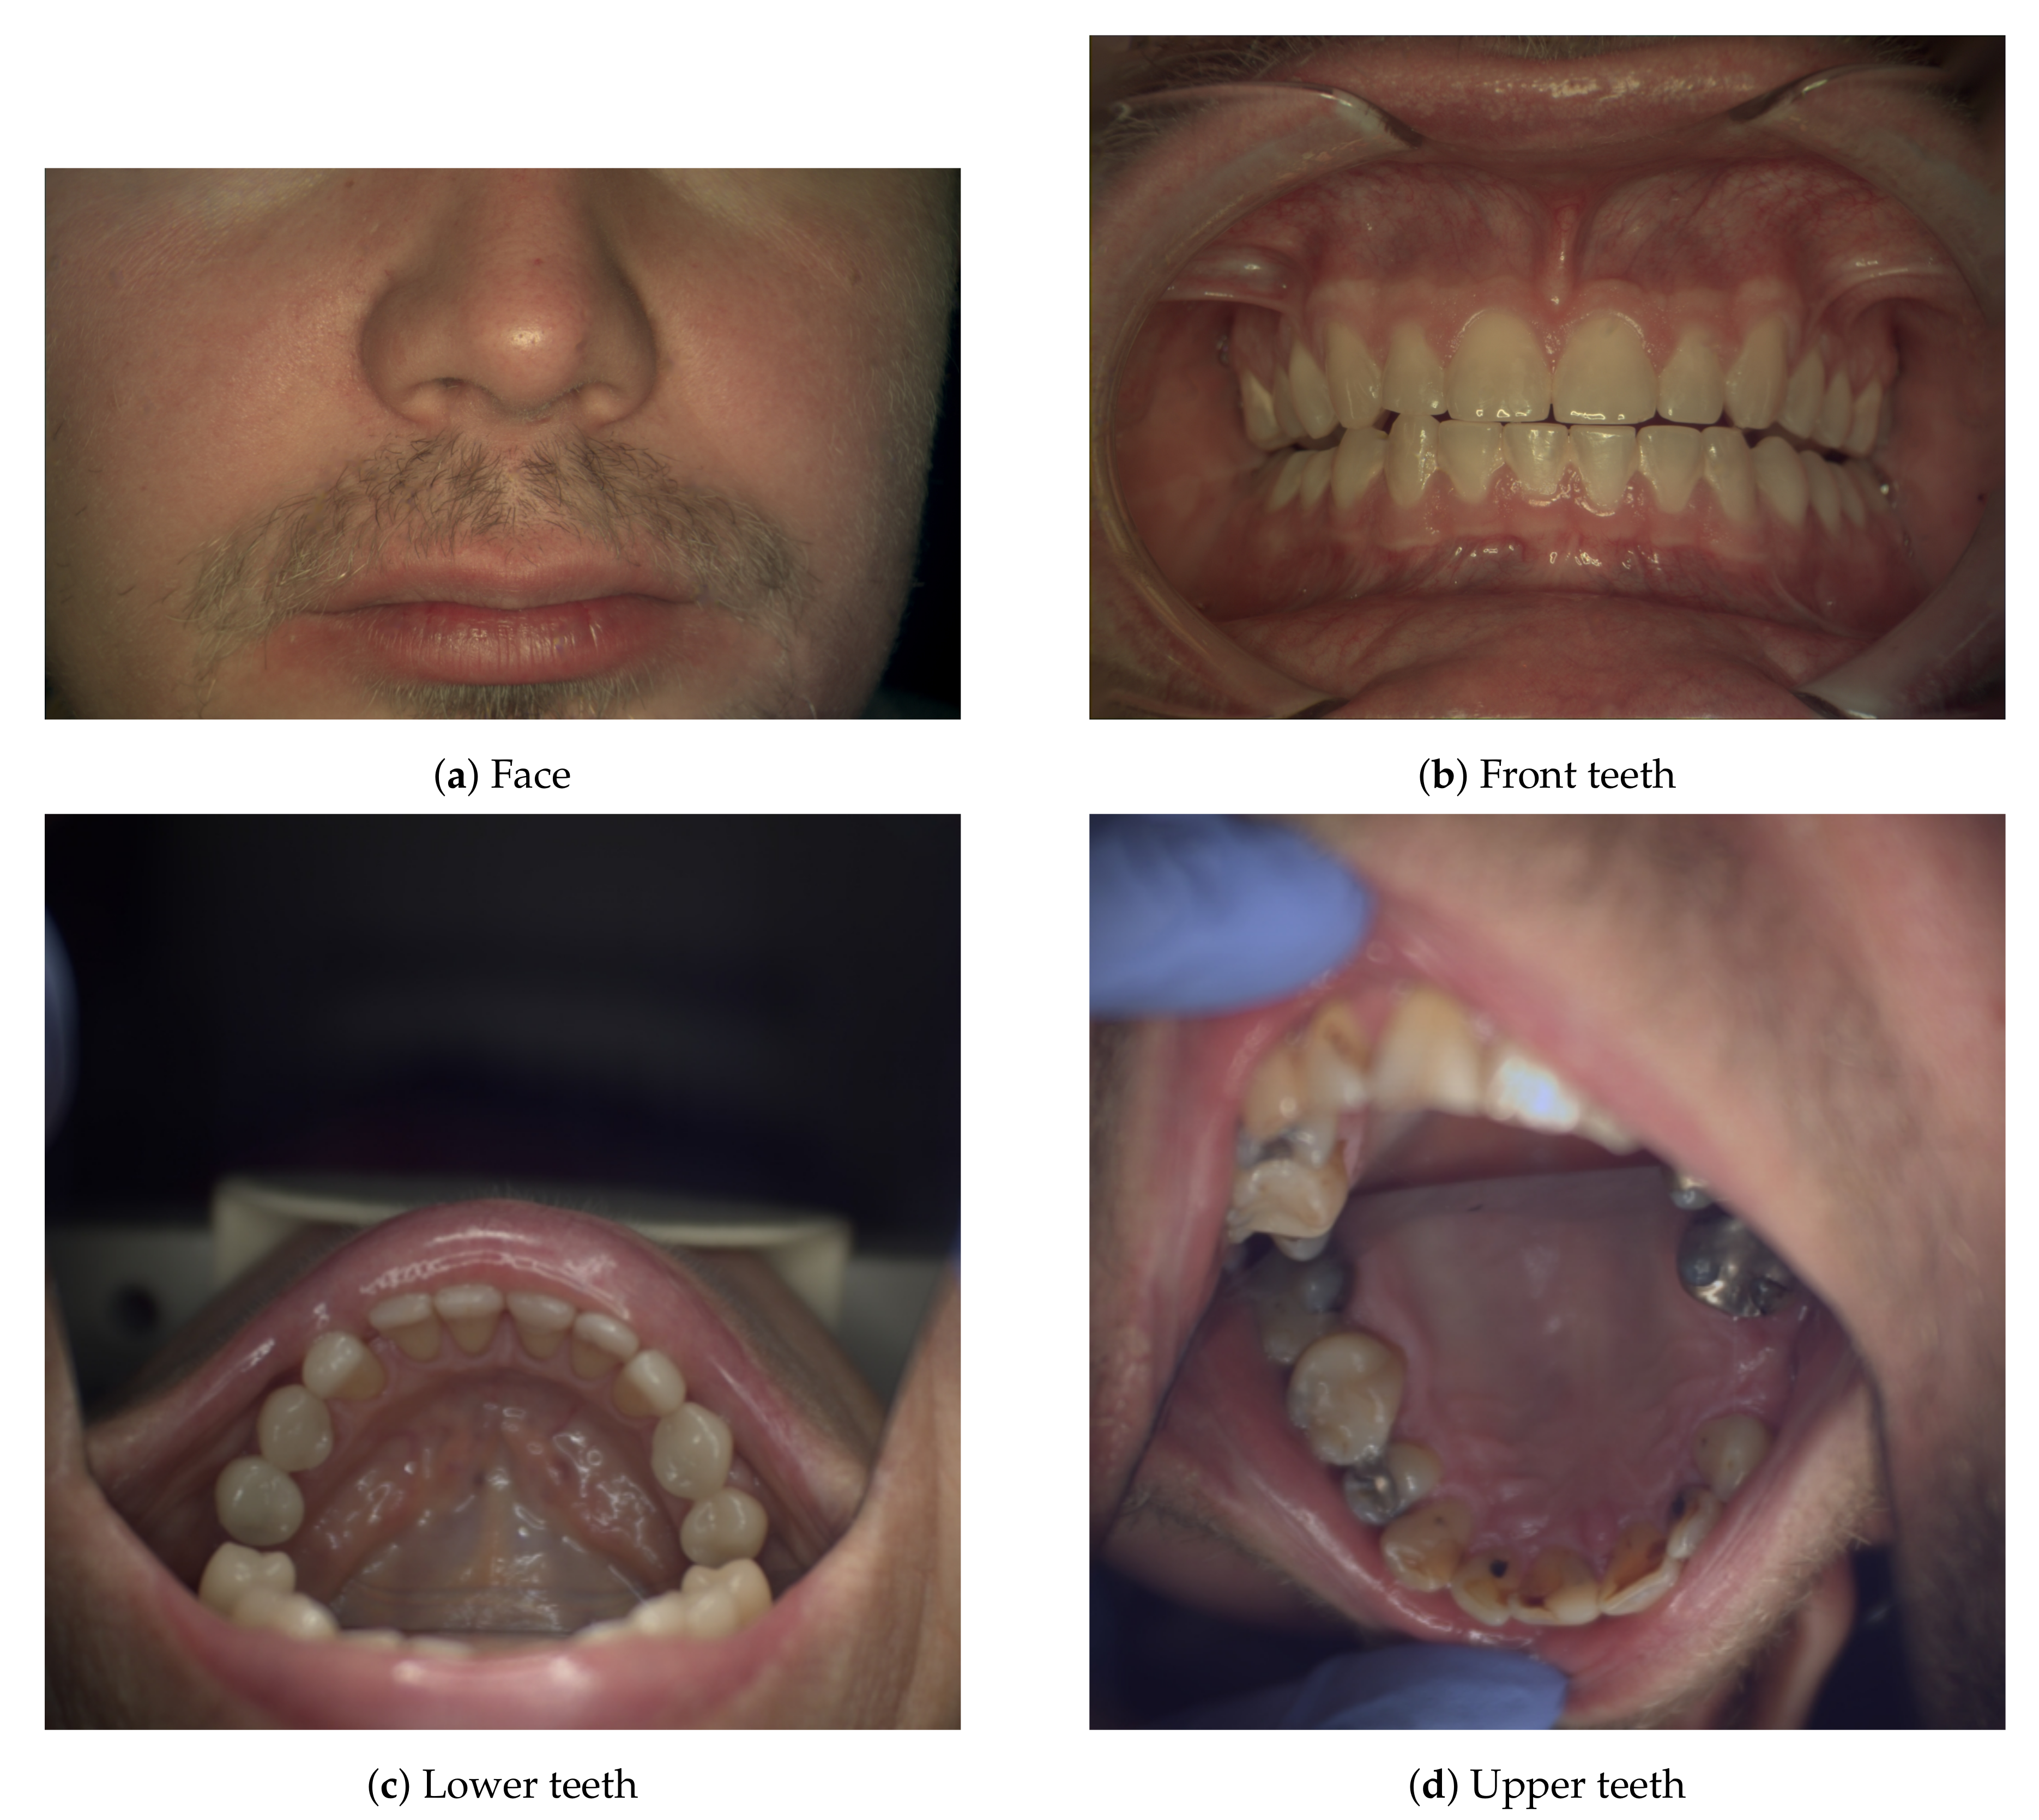
The spectral imaging process started with imaging the facial skin around the mouth area (
Figure 3a), followed by imaging a gray reference tile positioned at approximately at the same location as the face, thus retaining the imaging geometry. Next, the system is moved closer to the patient and dental imaging is performed: the front teeth are imaged bitten together (
Figure 3b), the lower and upper teeth’s occlusal surfaces (
Figure 3c,d) are imaged most of the time by using a dental mirror or lip retractors. The dental mirror posed a compositional challenge: there was little time to pose the scene optimally as the mirror fogs quickly when the patient needs to breath. A dental expert handled the patient, and the dental mirror, and helped to expose the areas of interest for spectral imaging. If the patient had other features of interest (such as infection sites or pigmentation changes), they were imaged also. The gray reference sample was imaged as needed anytime the imaging geometry changed significantly. When Nuance EX was used, the reference and dark-current images had to be measured every time the integration times were recalculated. Specim IQ saved dark-current images automatically during a spectral image capture.
The reflectance spectral images
were normalized with flat-field correction from a sample measurement
as
where
is the measurement from a reference sample,
is the measured dark-current,
and
are the integration times of the sample and reference, respectively, and finally
is the known spectral reflectance of the reference sample.
The reference measurement was averaged from a small, well-lit rectangular area of full tile . This was done because the relatively small reference tile could not cover the whole imaging area, nor did the physical shapes of the reference (flat tile) and the sample (oral cavity, teeth) match. Since the physical shapes of the imaged samples and the flat reference tile are different, the reflectance values in the spectral reflectance image cannot be expressed in the range 0–100%. Instead, the relative values in the spectral image are scaled to the range 0–1. It is important to notice that the flat-field correction does not affect the shape of the spectra.
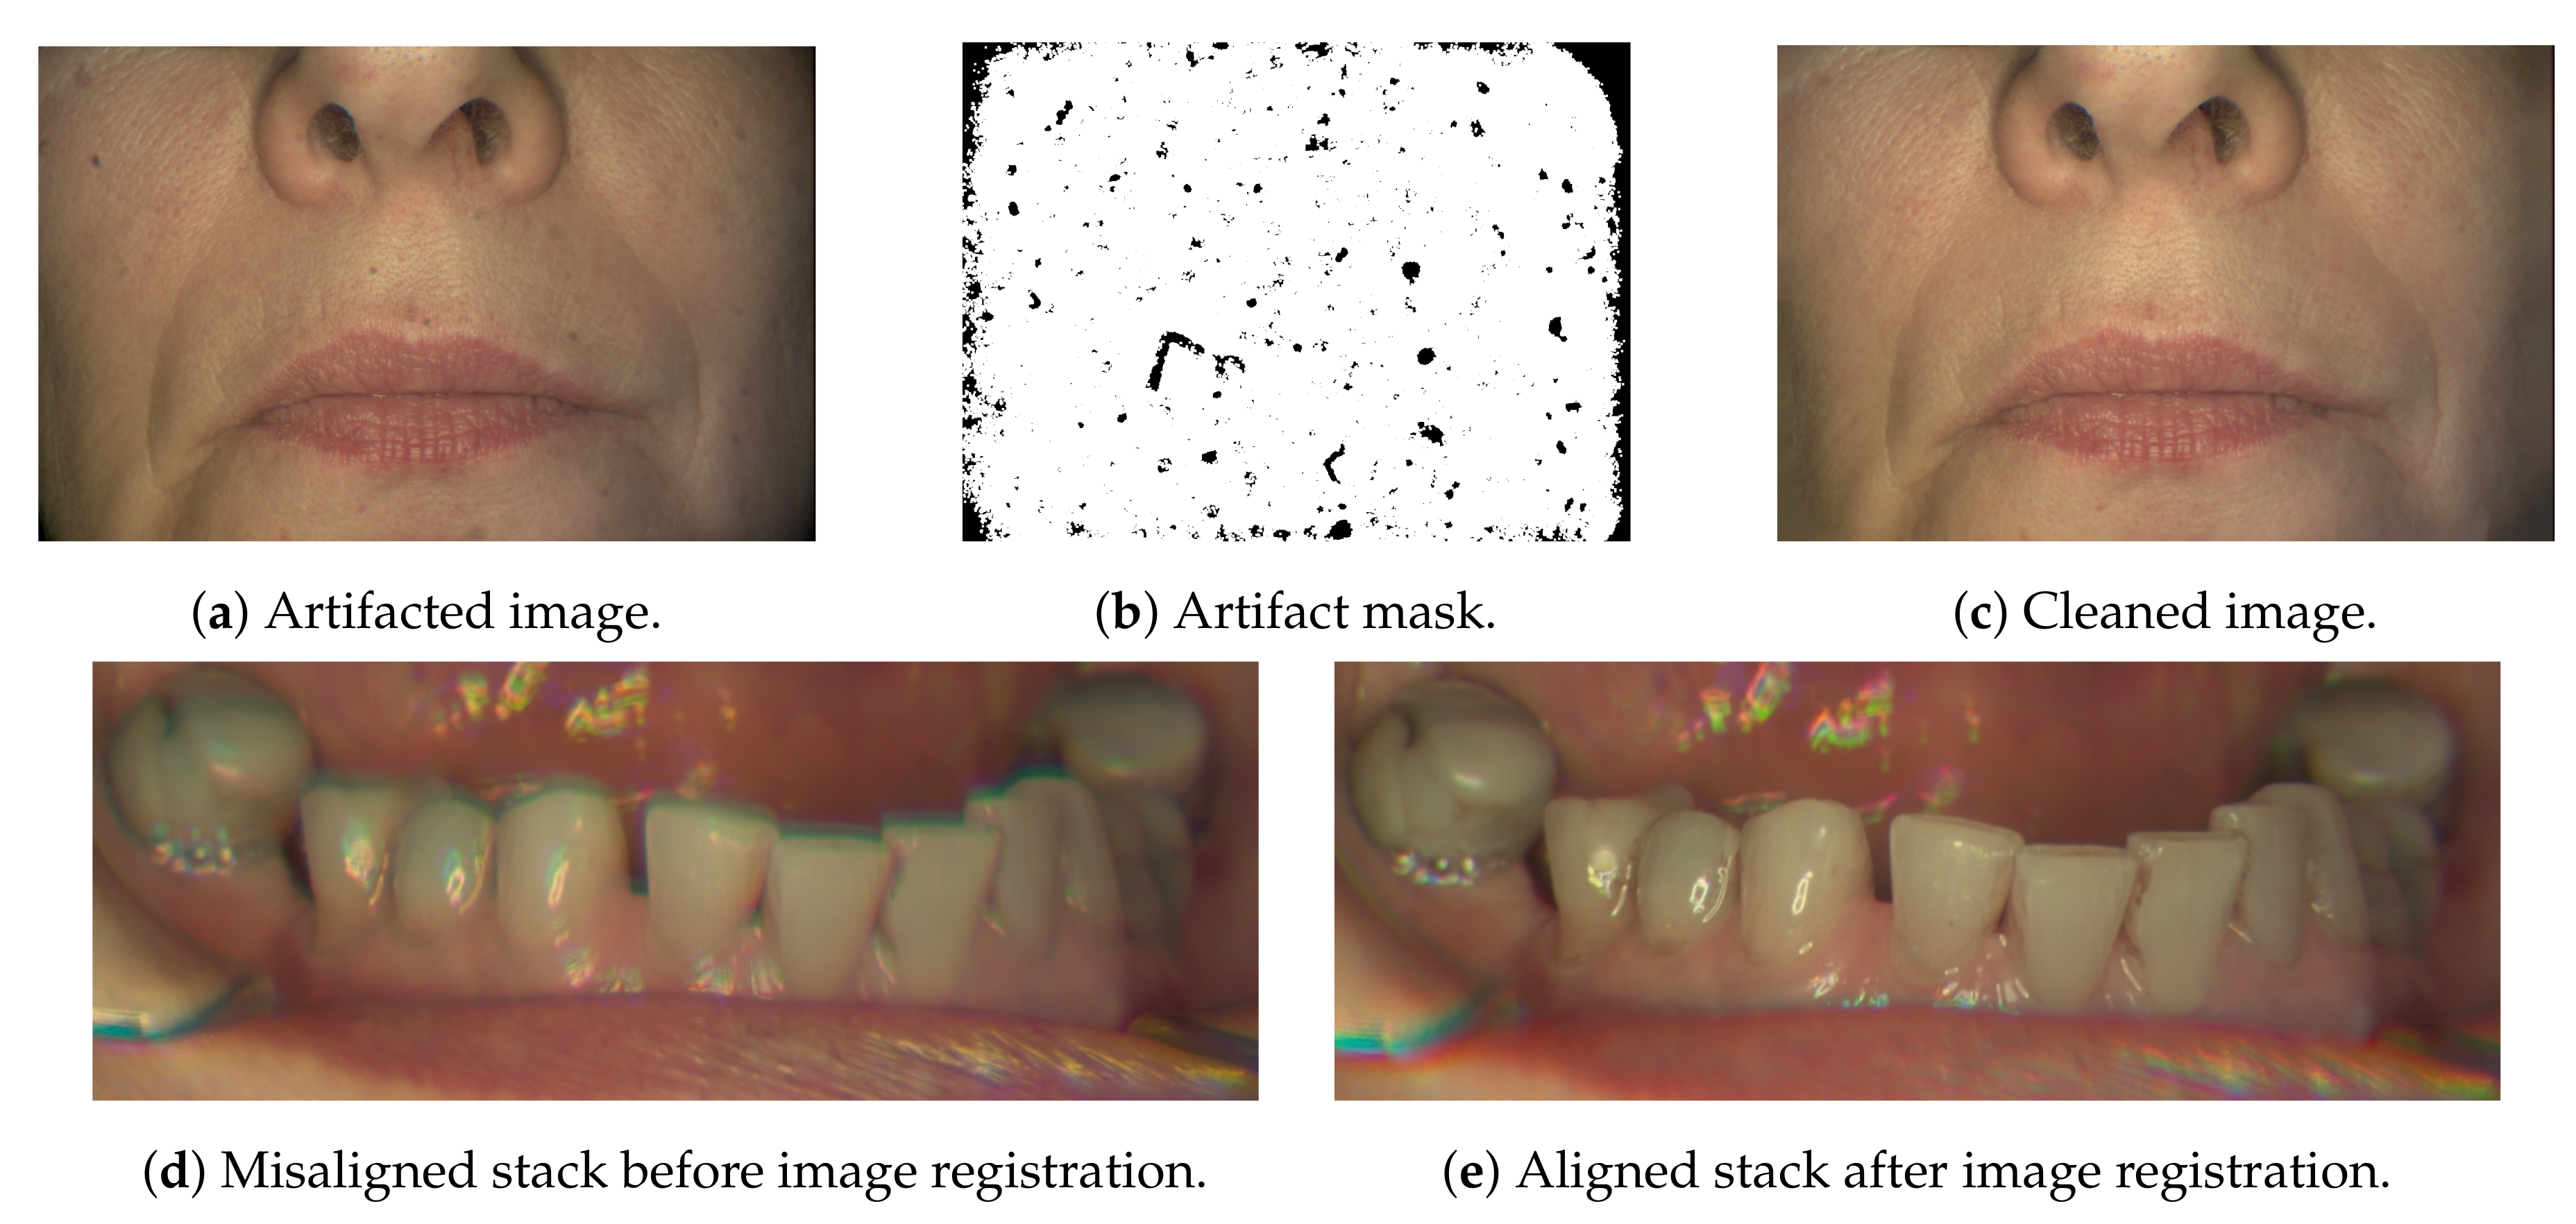
Camera-specific image post-processing was needed. The Nuance EX camera contained some dust particles in its internal optics, producing dark artifacts in the images (
Figure 4a). Artifact removal was done by imaging a white reference plate (
cm, diffuse reflectance target, Edmund Optics Inc., Barrington, NJ, USA) covering the whole image area and creating an artifact mask (
Figure 4b). The mask was used to mark areas for digital inpainting with OpenCV’s
inpaint-function (Navier-Stokes-based inpainting) [
18], see
Figure 4c. The Nuance EX spectral camera operates in the band-sequential mode [
6] capturing the spectral image one spectral band at a time. Integration time for an individual band image can be as long as 5 s, meaning that technically the longest possible acquisition time per spectral image is 4 min 15 s. The camera system determines the optimal integration times automatically. In practice, the full acquisition took 1–2 min only. The involuntary movements of the test subject cause the individual spectral band images to be misaligned with respect to each other. We utilized generalized dual bootstrap iterative closest point (GDB-ICP) image registration [
19] to align the band images. The GDB-ICP-tool provided by Yang et al. performs image registration on a pair of images only. To handle the 51 bands in Nuance EX spectral images, we chose the middle band image (700 nm) as the reference and performed the image registration of the other band images against this reference band. As the algorithm can choose the comparison points automatically, occasionally the image registration did not perform adequately. In these cases, a mask image was used to guide the process to concentrate on aligning the teeth. The need for these post-processing steps were a major motivation factor for switching the spectral camera to Specim IQ.
Specim IQ is a line scanning system [
6,
20]. The integration time is therefore per line and it is impossible to adjust per band integration times. On average, the line integration times were 5.4 ± 3.4 ms, meaning the spectral image acquisition time is only seconds. The camera, however, uses relatively long time—1 min—preparing and finishing the image acquisition. As the whole spectrum is acquired at once, involuntary movements do not affect individual bands of the spectrum. In most cases, the movements were subtle enough not to cause noticeable discontinuities between the captured lines. The tongue was a noticeable exception, but this did not matter in dental images. When the tongue or some part of it was of interest, it was held in place during imaging. Specim IQ spectral images were therefore not processed with image registration (nor digital inpainting). No further image editing, aside from what has been described above, was performed on the spectral images.
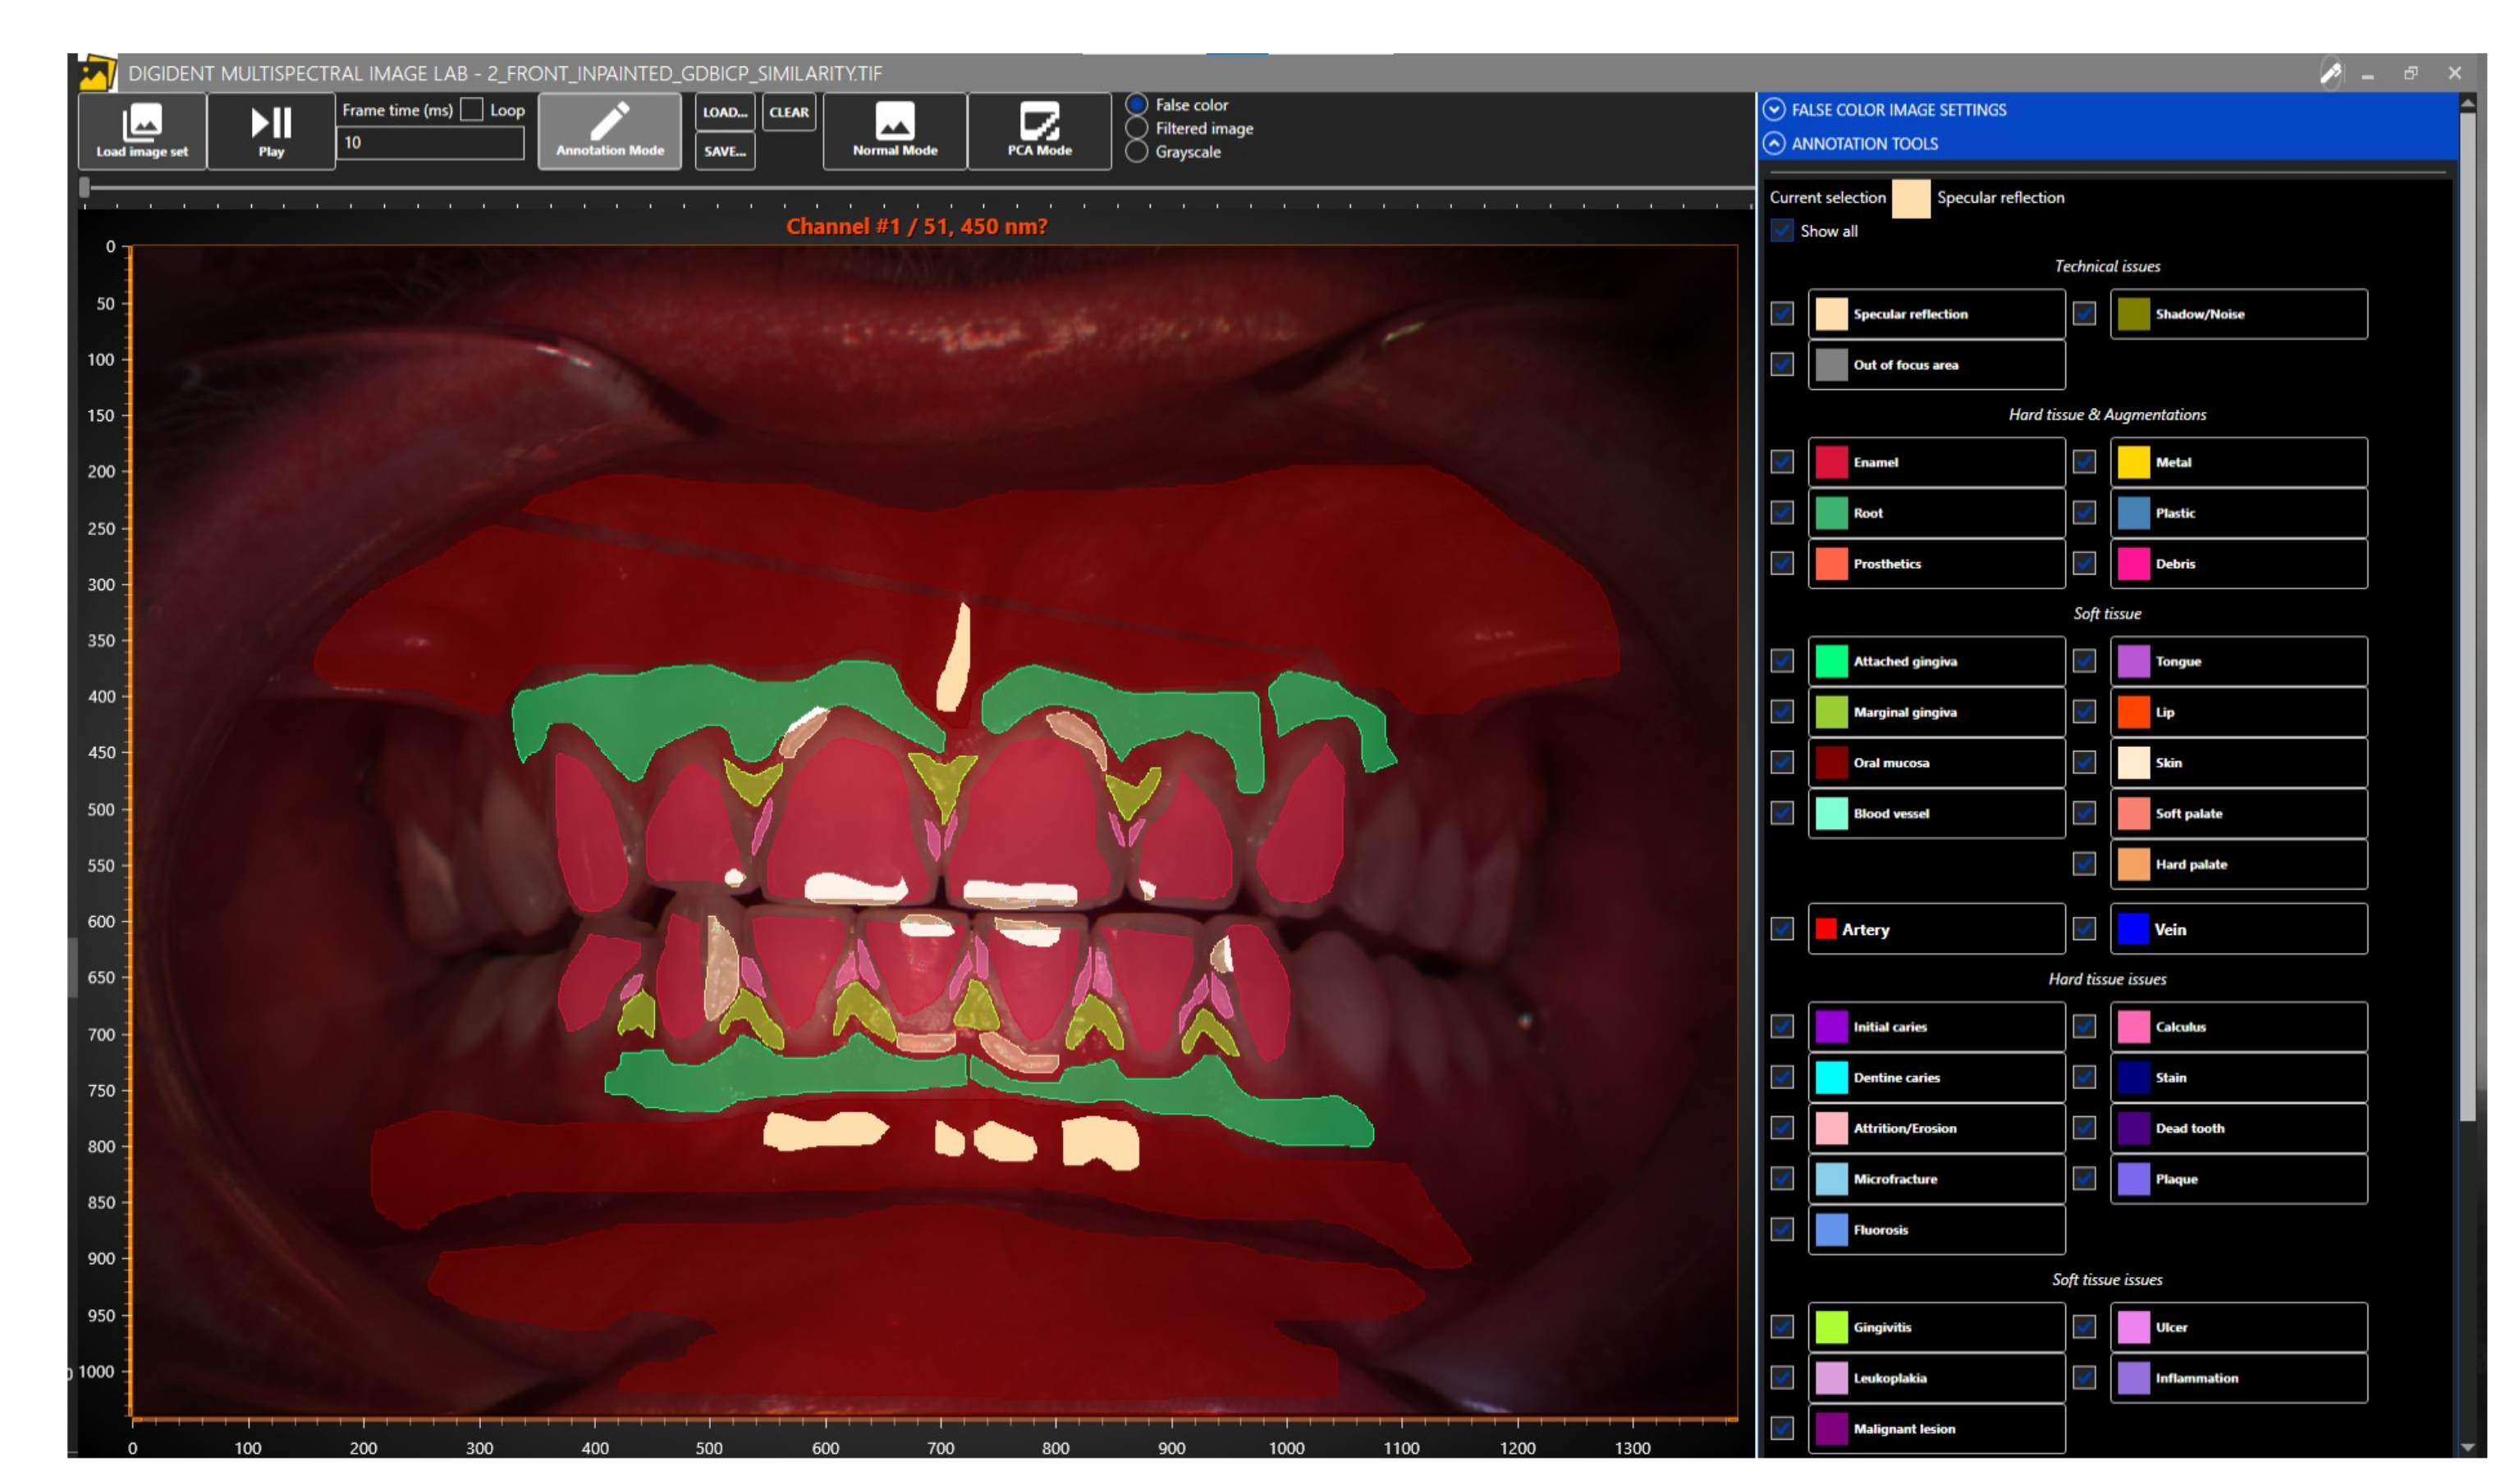
Dental experts at the Institute of Dentistry (University of Eastern Finland, Kuopio, Finland) annotated the dental and oral reflectance spectral images with software specifically designed for the annotation of dental and oral images (
Figure 5). The tool allows users to view the spectral image one band image at a time or by generating a false-color image of user-chosen three bands, the default choices being 700, 546, and 435 nm for the red, green, and blue bands, respectively. Our publicly available dataset contains 316 reflectance spectral images, of which 215 are annotated.
3. Results and Discussion
The results of our work are an oral and dental database of spectral images and their manually segmented annotations. The storage formats used in the database, annotation process and its caveats, and the resulting collections of labeled spectra all require special attention and are explained below.
3.1. Data Availability
The database—oral and dental reflectance spectral images, their annotations and metadata —are immediately available at the University of Eastern Finland’s Computational Spectral Imaging research group’s website
https://sites.uef.fi/spectral/odsi-db/ under Creative Commons Attribution–NonCommercial–ShareAlike 4.0 International License (CC BY–NC–SA 4.0) [
21].
3.2. Data File Formats
The relative reflectance spectral images were saved as Tiff image files. The format supports various image types, multi-page datasets and custom tags. Our spectral image Tiffs contain an RGB preview image of the spectral image on the first page, followed by a grayscale band image sequence starting from the second page. For the RGB-render, a CIE D65 light source and CIE 1931 2 Standard Observer were used. The image data are accompanied by a list of center wavelengths of the spectral bands in a custom tag 65,000, as a list of 32-bit floats. Tag 65,111 contains a free-form ASCII string of metadata. The metadata in our oral and dental spectral image dataset include the camera used, the objective lens used, light source and settings, imaging date, and the miscellaneous measurement data, such as the blood pressure and oxygen saturation before and after the imaging. The following pattern is used for all metadata strings:
Spectral camera: Nuance EX (CRi, Inc., USA).
Illumination: Thorlabs OSL2 halogen light source (100% power) + Thorlabs Ring
              Illuminator.
Objective lens: Samyang 35mm f/1.4.
Aperture: f/11.
Reference sample used: Matt diffuse gray sample ("Matt Diff Grey", Ceram Research,
                       Ltd., UK).
Blood pressure and pulse (before imaging): 165/80, 77
Blood oxygen saturation (before imaging): 95%
Blood pressure and pulse (after imaging): 164/80, 72
Blood oxygen saturation (after imaging): 97%
Spectral data: spectral reflectance.
Note: Values have been scaled to range [0,1] due to flat reference sample.
Date of spectral image capture: 2018/05/28.
The filenames of the spectral images are in following format
group “_” set ( “_” take | “_inpainted”? “_GDBICP_similarity”? ) “.tif”
where group is an image grouping number, set is one of face, front, bottom, top, or a specific feature of interest, take is a number for images where the focal point is changed between takes. String inpainted is present in the name when the image has been digitally inpainted, while GDBICP_similarity is present if image registration has been performed. One or both of the two strings are present always and only in spectral images that have been acquired with Nuance EX spectral camera, and never in images acquired with Specim IQ.
The annotation tool (
Figure 5) created for the project creates polygonal markings. These polygons are saved in a semicolon-separated text file. Each line defines an individual marking and follows the format
Annotation label; R, G, B; X1, Y1; X2, Y2; …; Xn, Yn;
where R, G, and B are the sRGB color coordinates in 0–255 range, and pixel coordinates
,
describe the polygon vertices. The coordinate system’s origin is at the top-left corner, positive X-axis leads to the top-right corner, and a positive Y-axis to the bottom-left corner of a spectral image. Since this text-based annotation format is relatively inconvenient for practical use, the oral and dental spectral image dataset contains annotations as bi-level mask images saved in multi-page Tiff files. The mask labels are stored in tag 65,001 as an ASCII-string on each mask image page. The multi-page Tiff solution was chosen due to the annotation tool allowing for overlapping annotation markings. A single image solution would have necessitated encoding the annotation labels in pixel values, requiring static numeric representations for the labels. Using the Tiff tag to save the label allows free-form strings without fixing labels with numeric values.
The spectral images and the related annotations have been cropped to ensure the anonymity of the test subjects participating in the research.
3.3. Annotations
The annotation labels are categorized as either
technical issues,
hard tissue and augmentations,
hard tissue issues,
soft tissue,
soft tissue issues, or
miscellaneous. The labels themselves are listed in
Table 1, including the pixel counts (number of spectra) for each annotation label. Since the spatial resolution of Specim IQ spectral camera is approximately
of Nuance EX spectral camera, the pixel counts per label per image are lower in Specim IQ acquired spectral images.
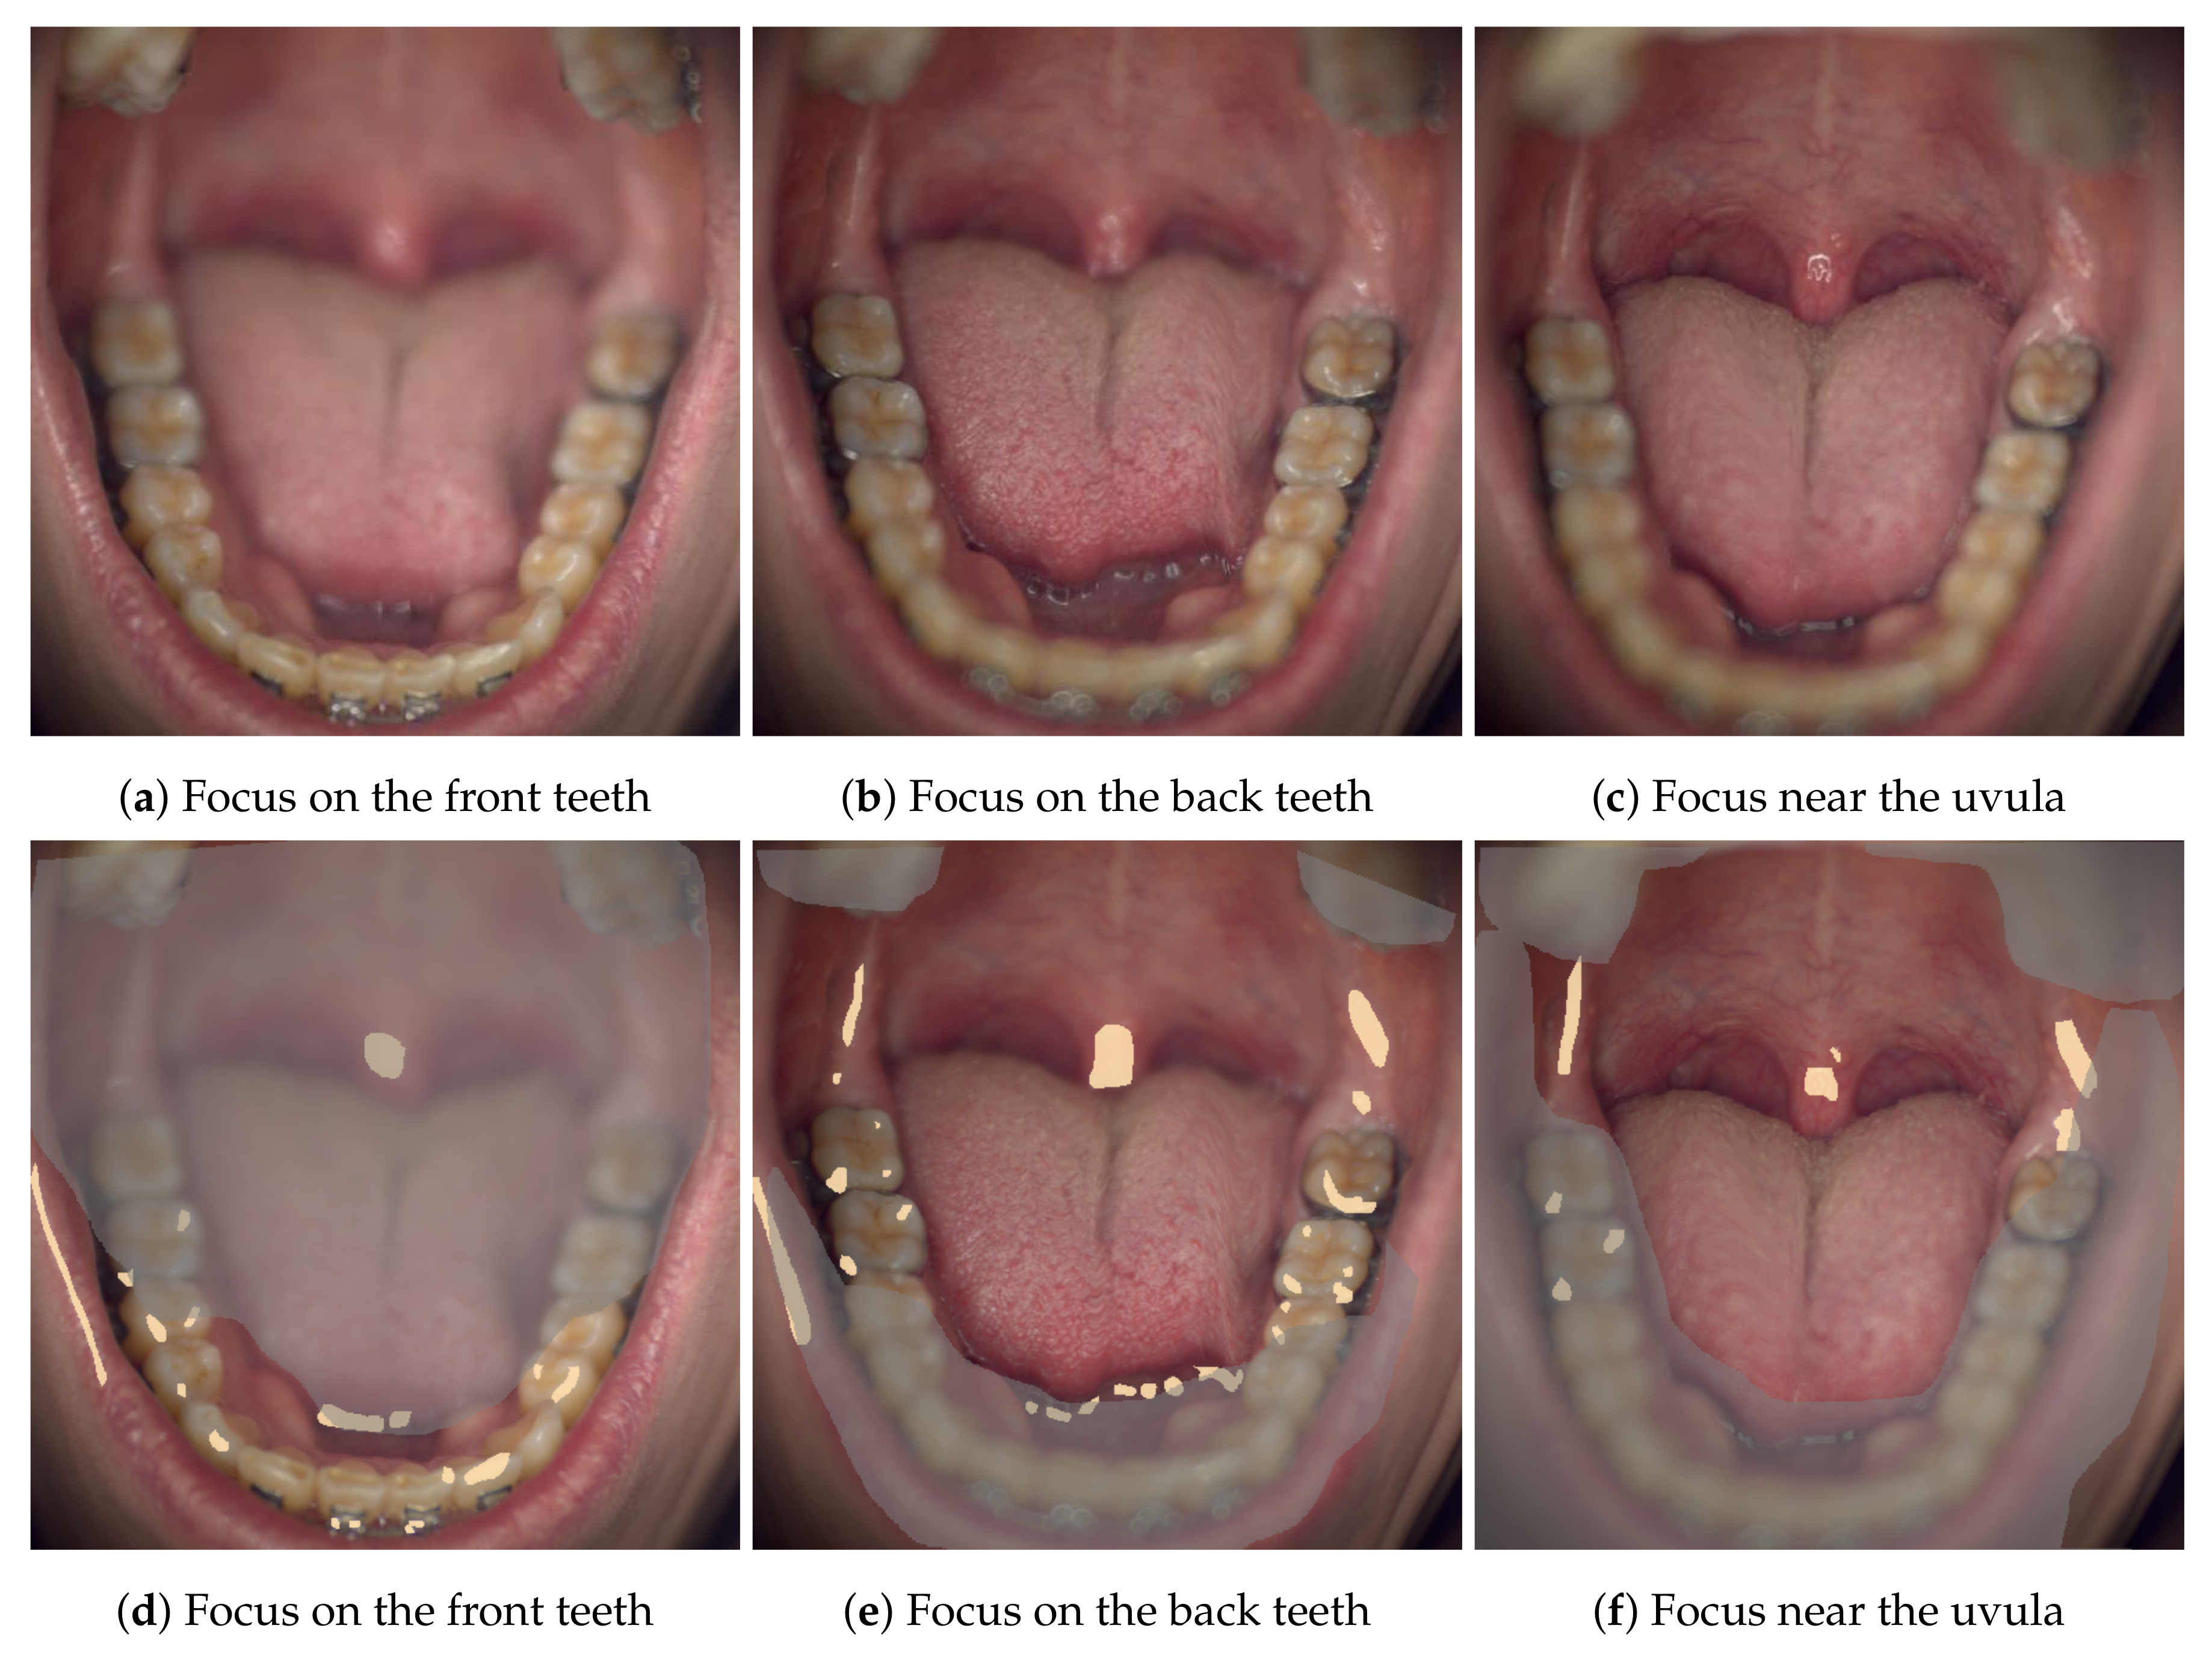
The technical annotation labels mark areas that should be excluded from data analysis. For example, specular reflections do not contain any meaningful information, the spectra on these areas may be oversaturated and these areas should be masked off of any other mask. Shadow/noise label is mainly used to denote areas that are either poorly lit or fall outside of the sample area (originally, the manual image segmentation was intended to apply a label on all pixels in an image; this was later found to be overly rigorous). The Specim IQ spectral camera has a fairly short depth of field, the overly blurry areas are thus labeled as out-of-focus areas (see
Figure 6). A pixel in the blurry out-of-focus area may be experiencing strong spectral mixing with the nearby pixels depending on the level of the blur.
The miscellaneous-category (
Table 1b) contains labels that did not seem to fit other categories. Label
hair is another exclusion label like the technical annotations. This label is used to mark hairy areas — not individual strands of hair—so that shadows in the hairy bushes and any possibly visible skin underneath are thus also labeled as hair. Makeup, when clearly present, is annotated as such.
Mole and
pigmentation labels accurately mark features of interest and can be used in analysis as is.
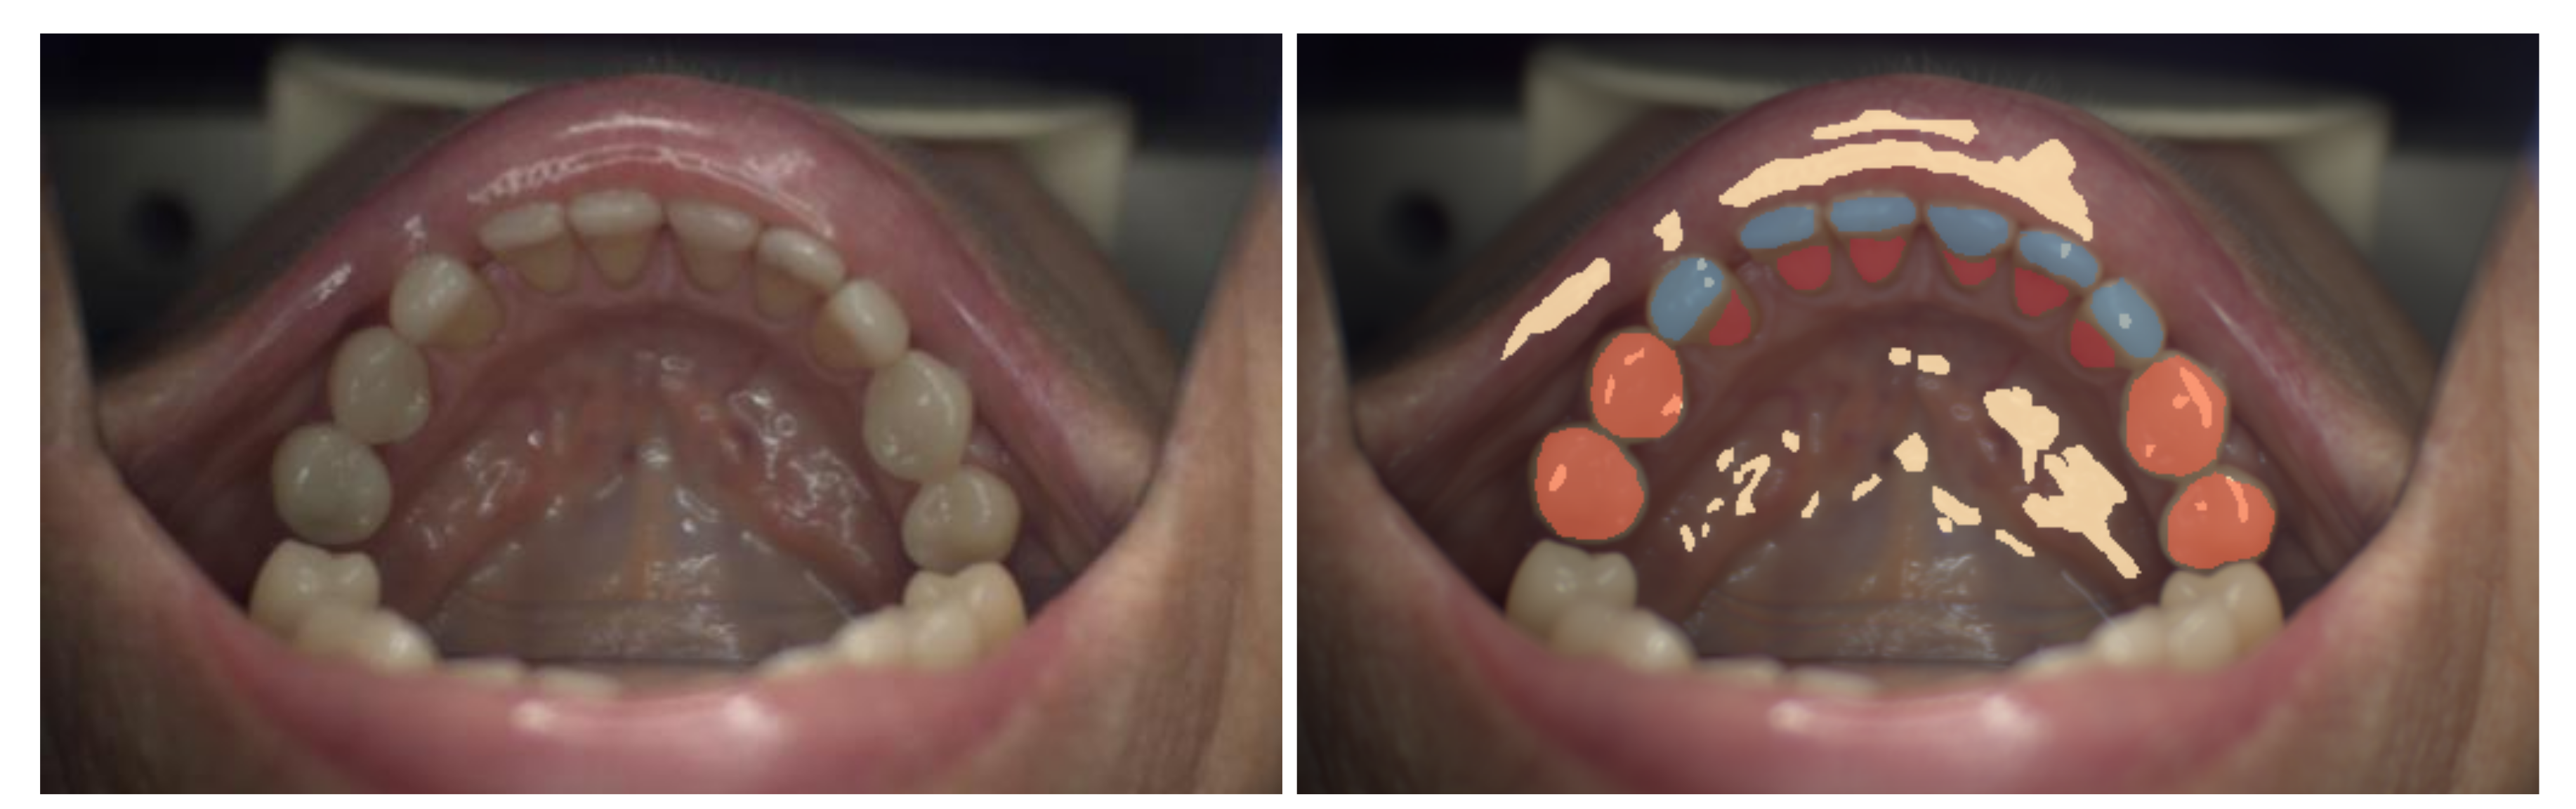
In the the hard-tissue and augmentations -category (
Table 1c) the meanings of the labels
enamel, and
root are self-evident, but the distinction between
prosthetics and the materials
metal and
plastic may be less so (
Figure 7). The former is used to mark artificial structures, and the latter two to mark repaired parts of a tooth, and in case of
metal, also dental braces. In the hard-tissue issue -category (
Table 1e) labels
attrition/erosion and
microfracture mark the site of the find and some surrounding
enamel.
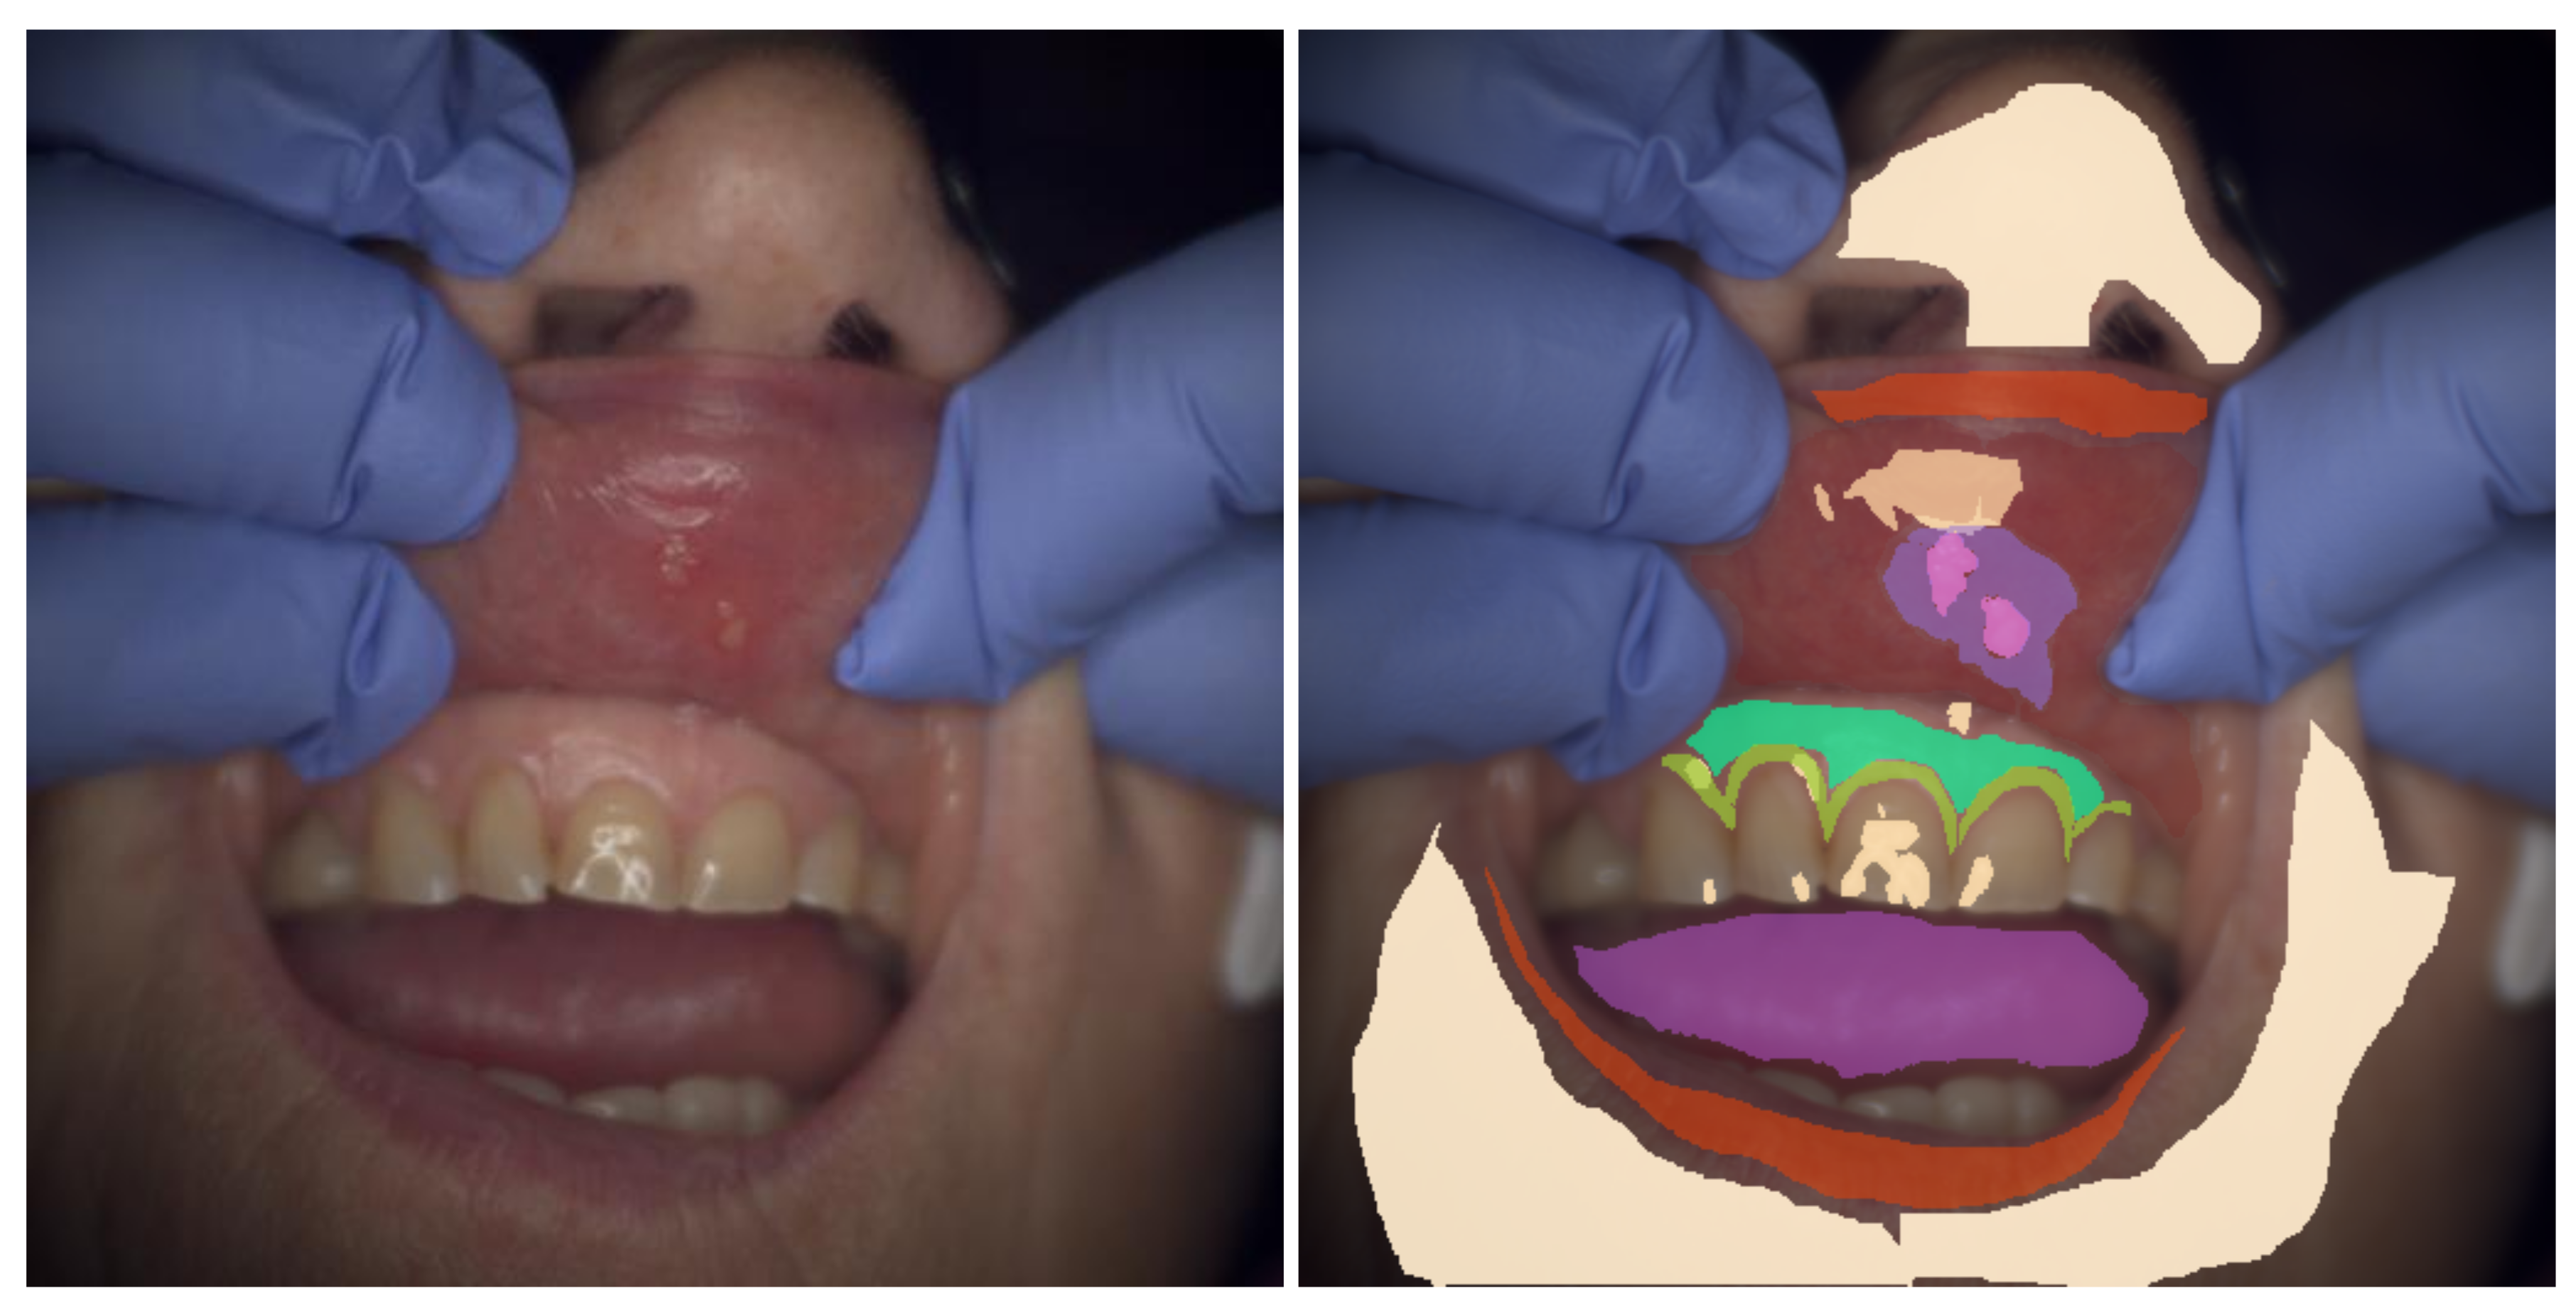
The meanings of the soft-tissue labels (
Table 1d) and the labels of the related lesions (
Table 1f) should be evident from their names (see example
Figure 8). There are, however, some vital details that must be known before using some of these masks. The number of segmented pixels for label
blood vessel is fairly low. This is caused by two main factors related to the fact that blood vessels are a fine detail in the images: they are very prone to image stack misalignments in cases where the Nuance EX spectral camera has been used, possibly leading to broken spectra, and the annotation tool was developed to draw polygons. The latter issue could have been fixed by adding a line-drawing tool with an adjustable width into the annotation tool. Consequently, only sufficiently large blood vessels are annotated. Similarly, the
tongue label should be used with caution as the tongue is the single most difficult organ to image due to its involuntary movements. In the Nuance EX images, the image registration was often unable to fix these movements as the emphasis has been on aligning the image stack by the locations of the teeth, leaving the spectra on tongue pixels compromised. The tongue spectra on the Specim IQ -images should remain non-compromised, but the spatial shapes of the tongue can be peculiar due to the line-scanning nature of the camera—see
Figure 6b, where the right side of the tongue has moved during image acquisition.
3.4. Reflections on Specular Reflections
As can be seen in
Figure 7 and
Figure 8, specular reflections may be significant and reduce the analyzable areas of the spectral images. In
Figure 7, the lip and oral mucosa of the area under the tongue are shown with many specular reflection markings that should be excluded from lip and oral mucosal analyses. Glossiness of the dental enamel can also cause notable specular reflections: in
Figure 8, a front tooth has the majority of its surface segmented as specularly reflecting.
Our imaging setups did not contain technical solutions for controlling specular reflections besides using a ring illuminator instead of a spotlight from a liquid light guide. This illumination choice provided a more uniform lighting overall, but the specular reflections became circular loops. These loops can be seen in
Figure 6c on uvula, in
Figure 7 on the lip, and in
Figure 8 on a front tooth. It may be possible to reduce specular reflections in case they are polarized by utilizing a linear polarizer in front of the ring illuminator and the spectral camera. This, however, would also reduce the intensity of the illumination and of the reflected light reaching the imaging sensor, leading to unwanted longer image acquisition times. Any longer acquisition times—especially in the case of Nuance EX—would have been unacceptable. It is also important to remember that the spectral cameras themselves may have polarizers. The Nuance EX spectral camera is based on a liquid crystal tunable filter (LCTF). These filter devices rely on parallel linear polarizers enveloping a liquid crystal stack [
22]. A linear polarizer attached to the imaging setup would need to be aligned with these internal linear polarizers, as the illumination would still need to be polarized. This would, in turn, mean that finding an optimal angle for the polarizers to minimize specular reflections would require rotating the linear polarizer and the spectral camera together simultaneously. We did not have the tools to implement this, and therefore did not entertain this idea of using polarizers any further.
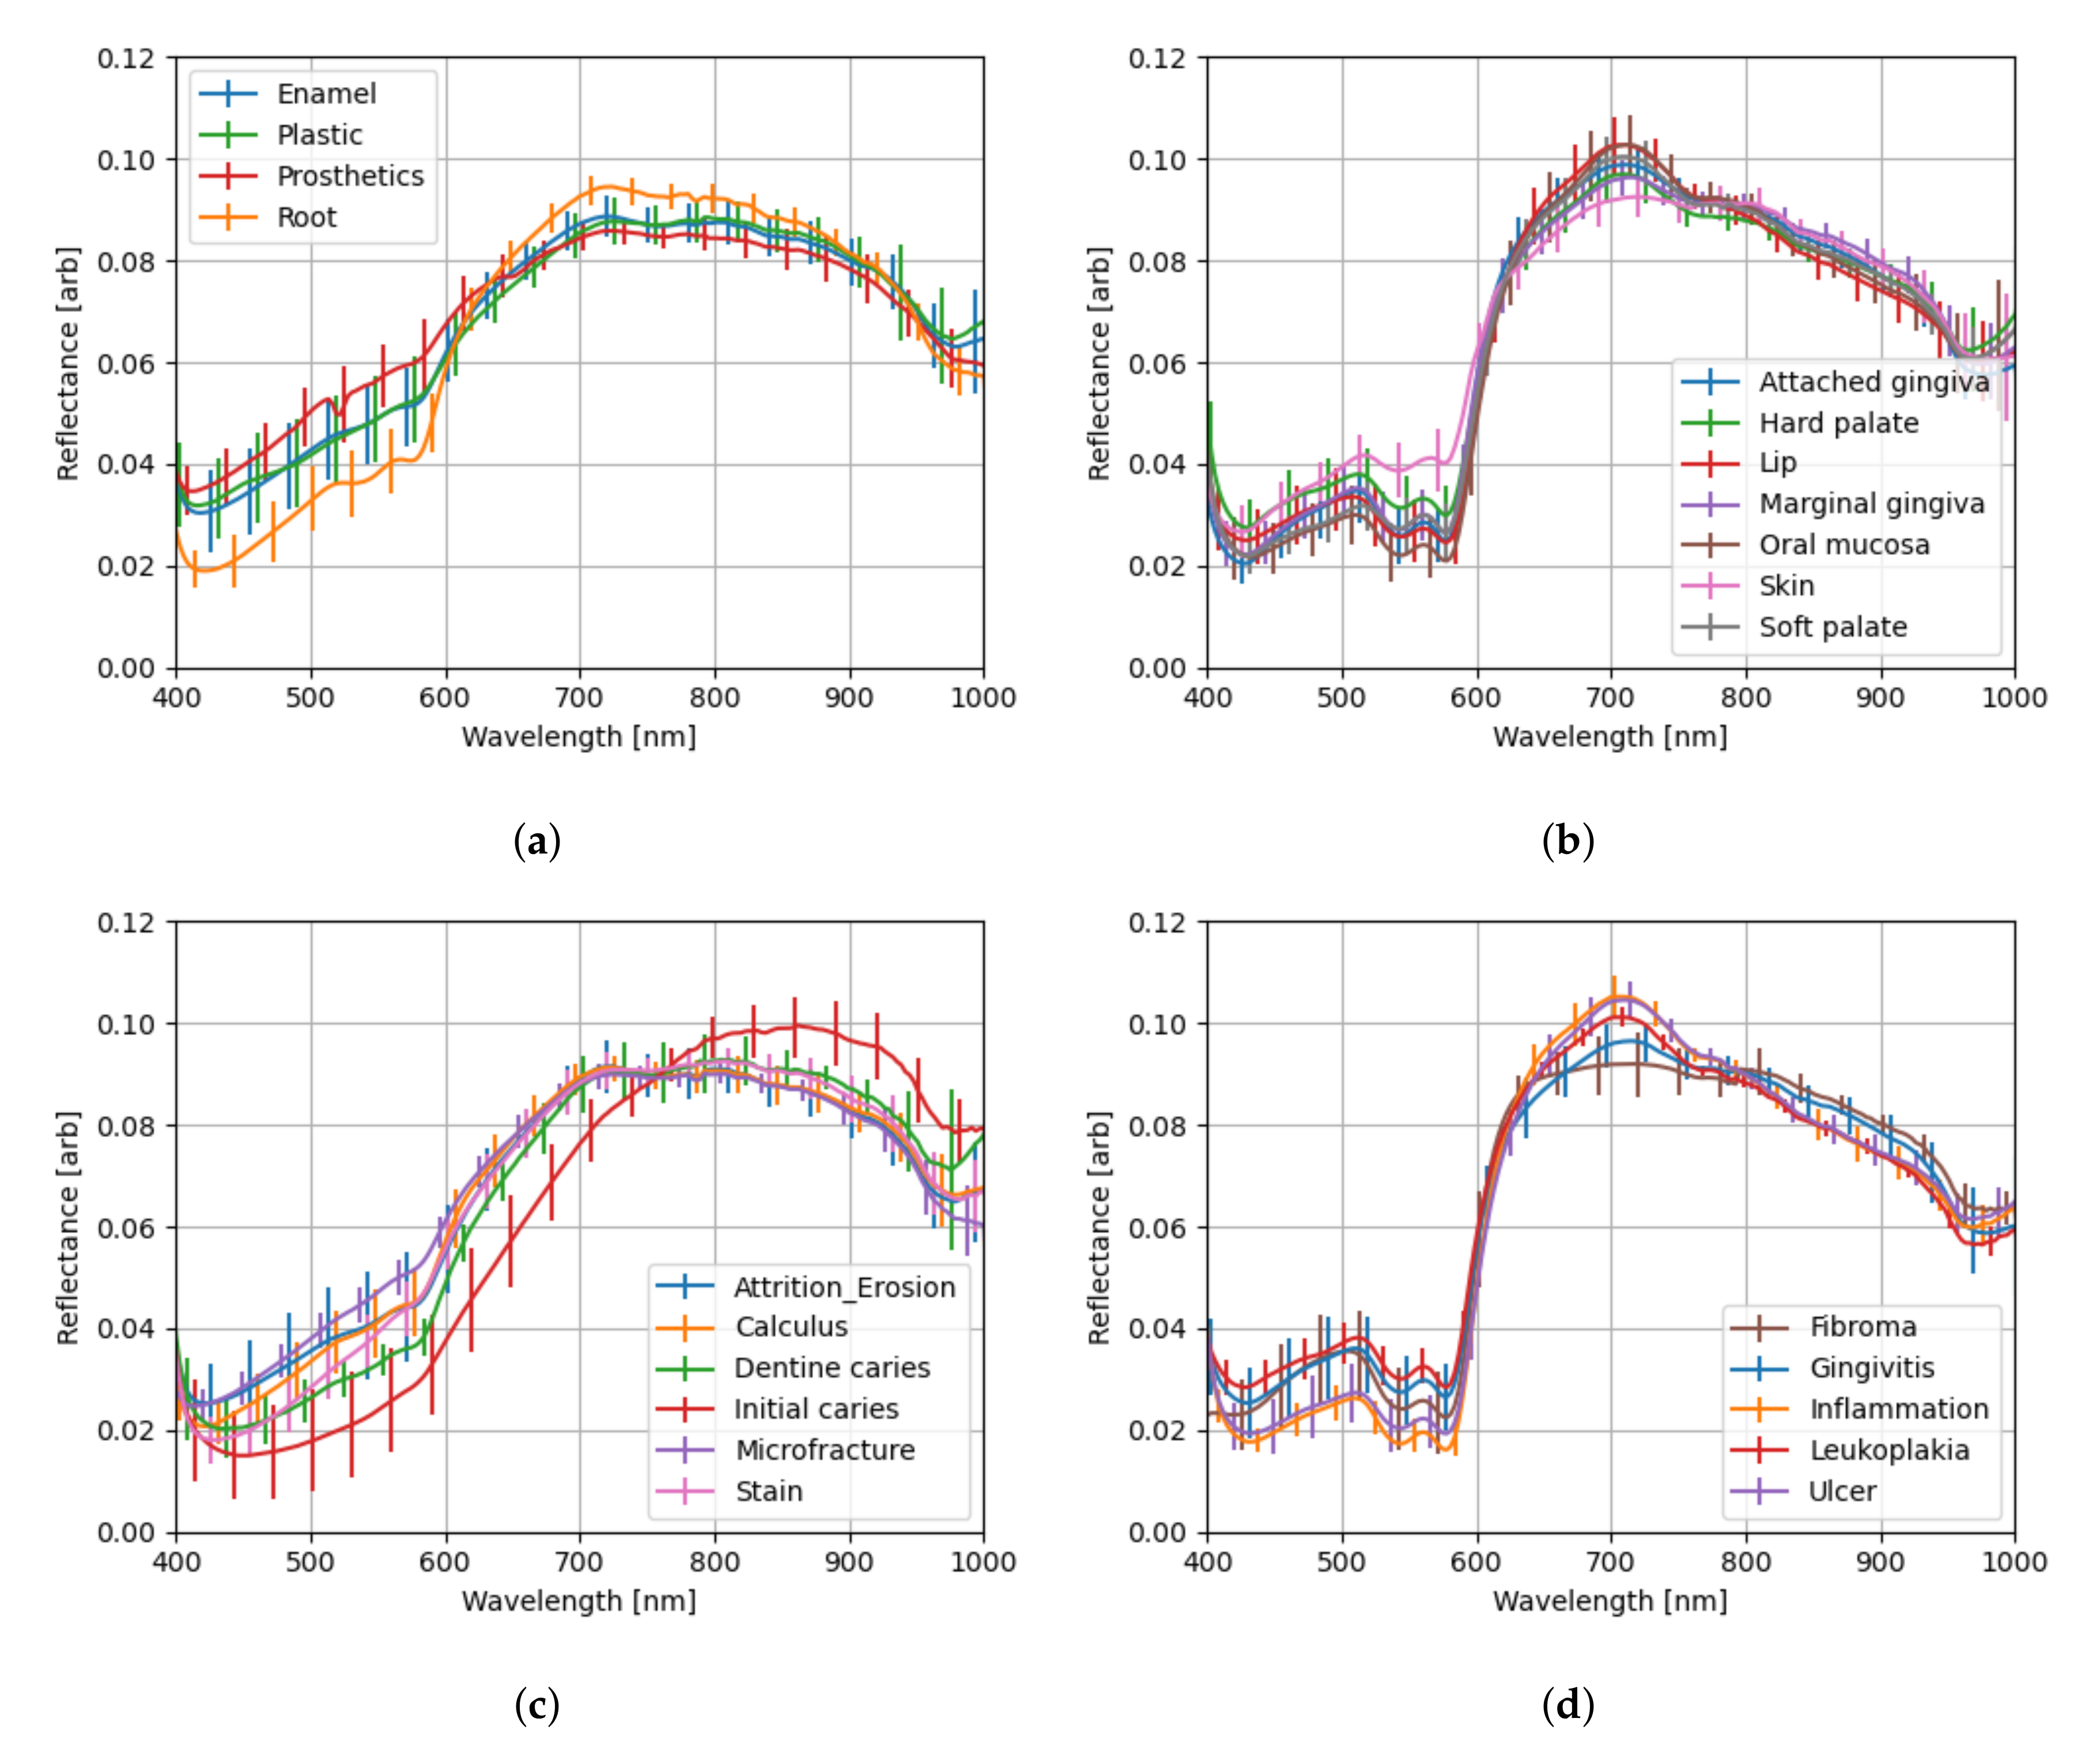
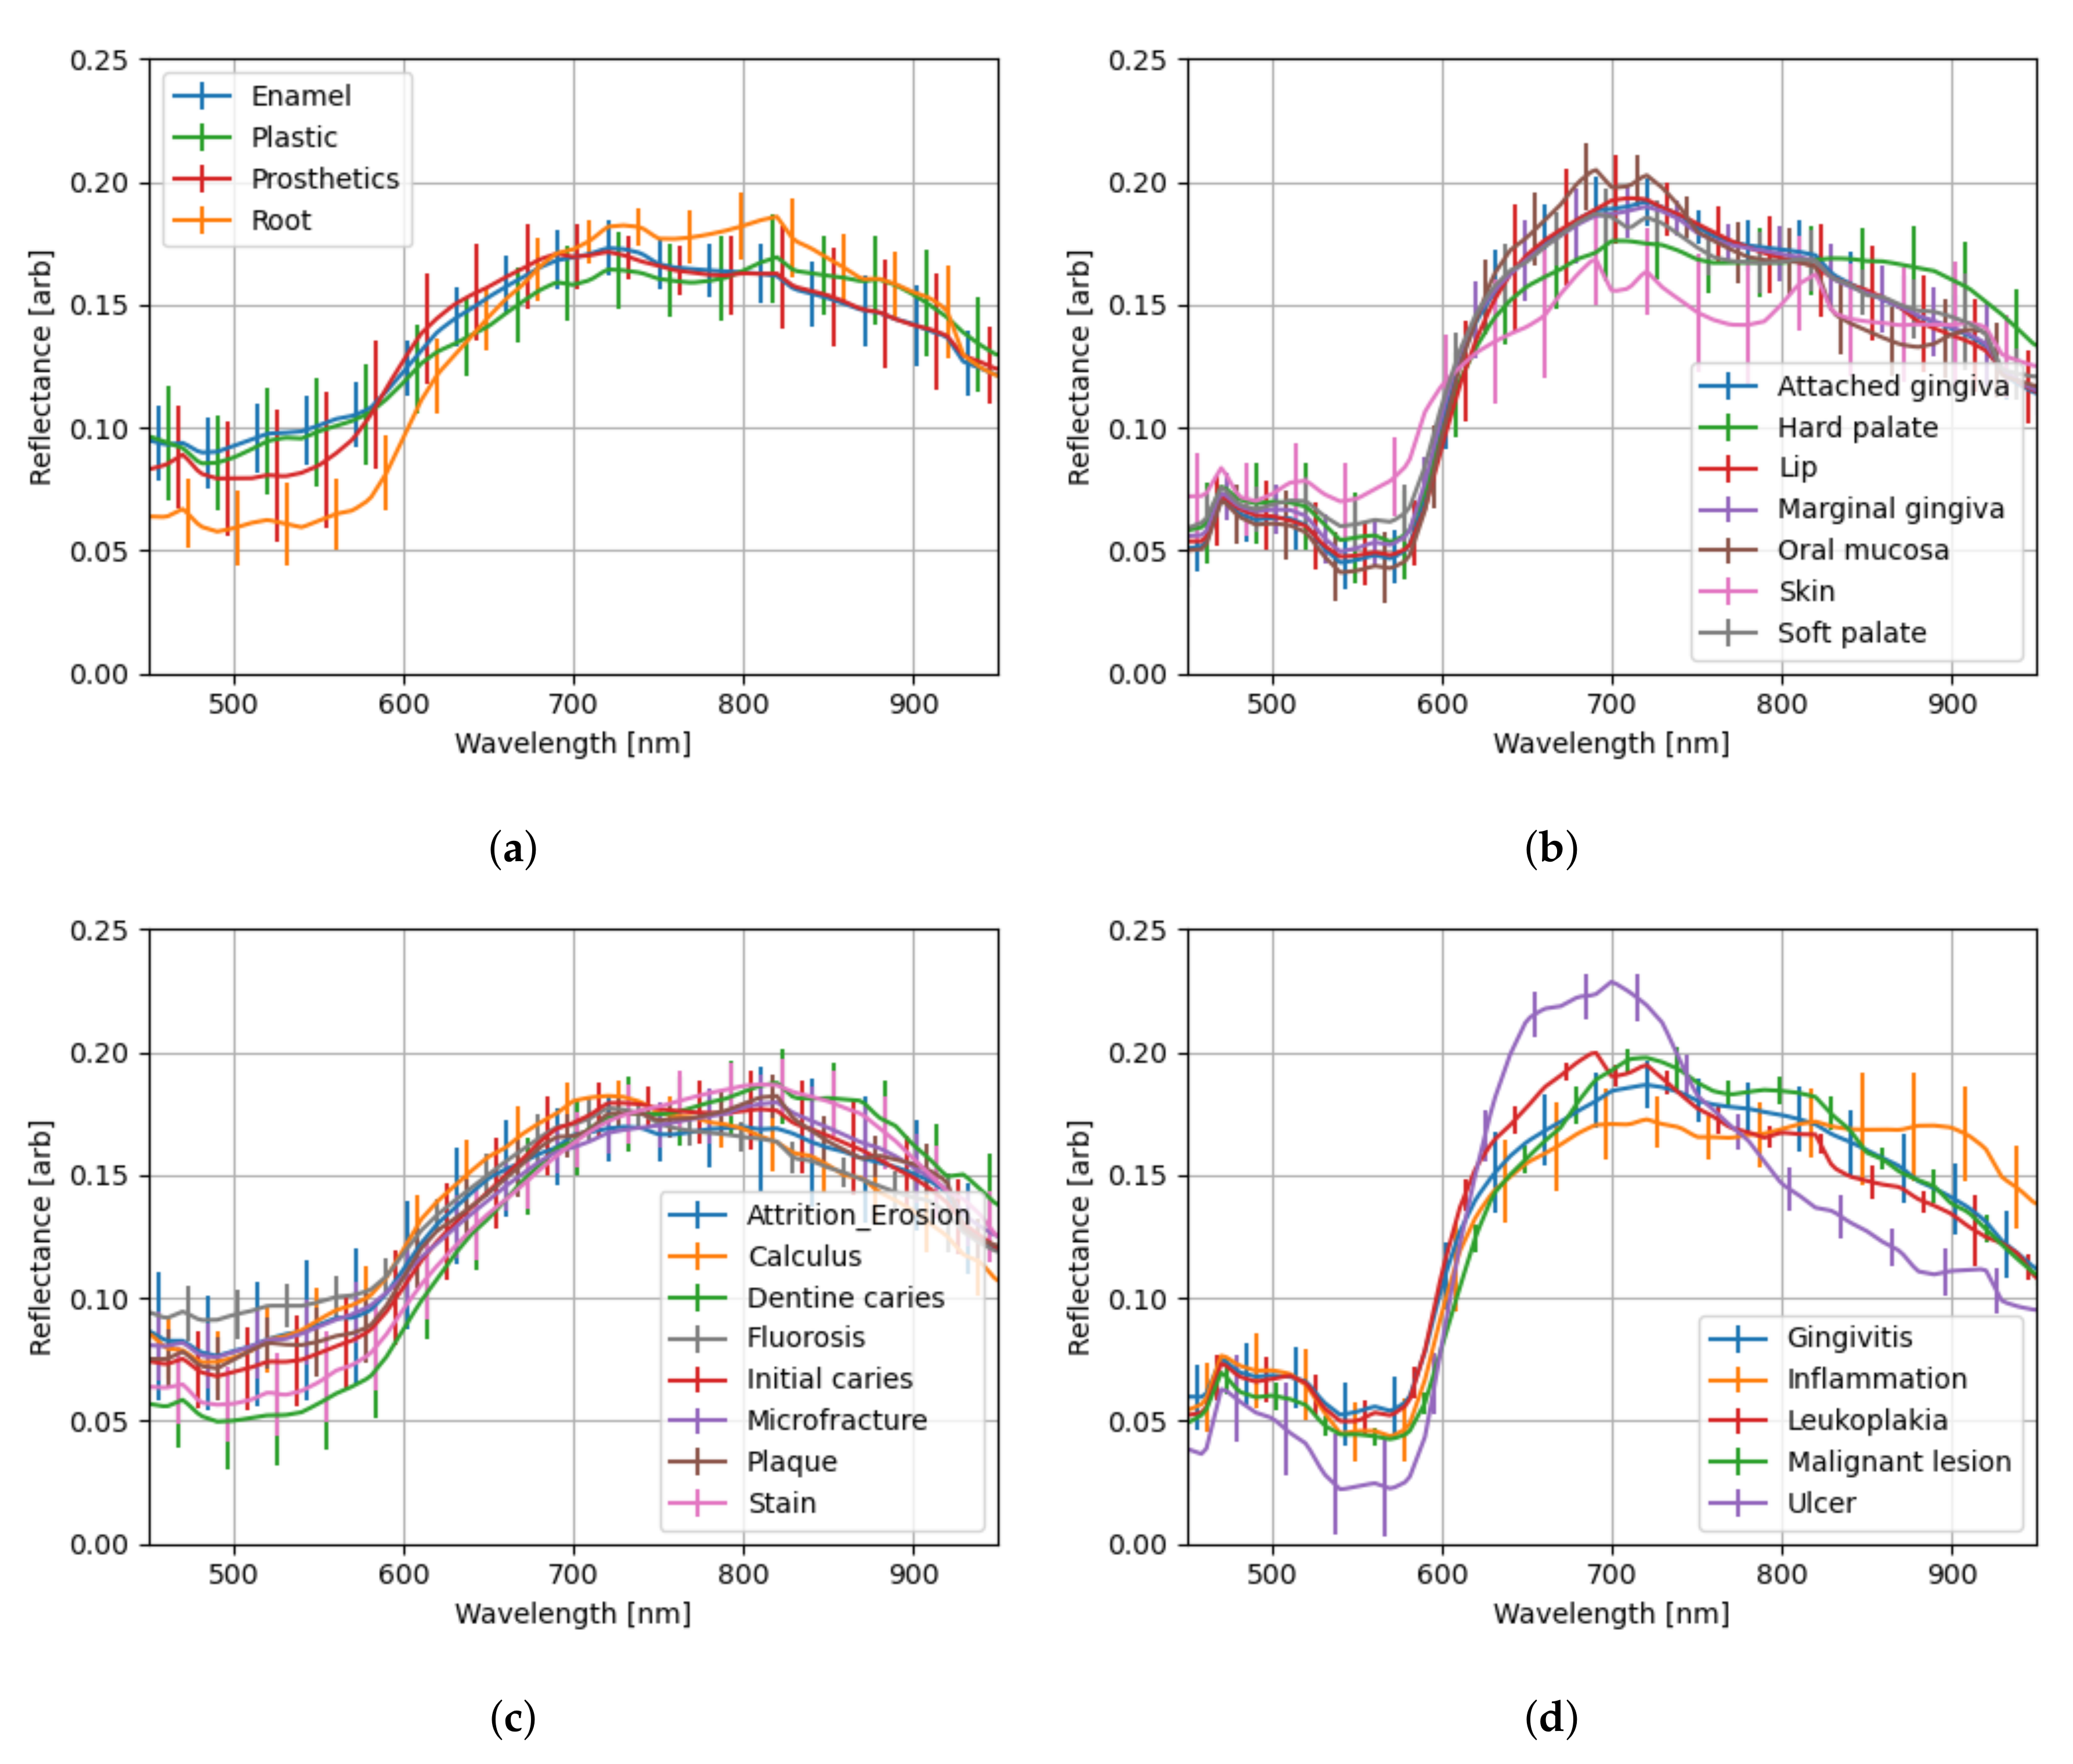
3.5. Spectral Profiles
Due to the non-flat nature of the imaged samples, extracting and combining the segmented spectra from the spectral images will have wide variations. As a preprocessing step, the spectra have been
-normalized prior to calculating their mean and standard deviation in the spectral profile plots shown in
Figure 9 and
Figure 10. The spectra acquired with Specim IQ spectral camera have a common feature at the beginning and at the end of the wavelength range—a slope. The specifications of the light bulb [
23] show that the normalized intensity at 400–430 nm range is approximately 10% of the maximum at 925 nm. This slope, therefore, is likely caused by poor illumination. Additionally, the specification seems to suggest the light bulb is unstable in the 950–1000 nm wavelength range, possibly explaining the slope at the end of the spectrum.
As might be expected, the enamel and plastic share exceedingly similar spectra in
Figure 9a and
Figure 10a. Interestingly, prosthetics differ in large part (400–600 nm) of the visible range (400–780 nm), but then follow enamel and plastic closely in the red and infrared regions—the latter being invisible to human eyes. Exposed tooth roots, on the other hand, differ remarkably in the 400–600 nm and 700–800 nm regions.
The initial caries spectrum calculated from Specim IQ -acquired spectra (
Figure 9c) stands out and differs significantly from the one calculated from Nuance EX -acquired spectra (
Figure 10c). The standard deviation is also larger than on the other Specim IQ-based spectra. A skewed result is expected as the number of Specim IQ-acquired spectra for initial caries is only 1138, with 891 coming from a single test subject (when the technical masks are applied). The number of spectra with Nuance EX is, in total, 20,862 spectra with a median of 1225 per test subject (12 test subjects).
The soft tissue spectra in
Figure 9b all seem to blend in within their error margins, with skin being more reflective in the 500–600 nm regions. While it may seems like some skin segmentation in spectral images acquired with Nuance EX has an issue—as suggested by
Figure 10b, where the skin spectrum has a very large error margin in 600–800 nm region with a questionable spectrum shape—this is likely not the case. Our test subject pool included people of different skin colors, but this was not taken into account in segmentation labeling. The 685 nm band, in particular, seems to have anthropological significance [
24] in relation to skin color. Another notable feature is that all soft-tissue spectra (
Figure 9b,d and
Figure 10b,d) exhibit a dip in reflectance approximately at 540 and 575 nm wavelength bands. These dips match the absorption spikes of oxygenated hemoglobin [
25].
Like the initial caries earlier, the ulcer spectrum in Nuance EX -acquired spectra exhibits notable individualism in comparison to the other soft-tissue lesion spectra in
Figure 10d. In this case, all 1030 spectra forming the normalized mean spectrum for ulcer originate from a single test subject. On the Specim IQ side,
Figure 9d, the spectrum originates from three test subjects, each contributing a medium of 1656 spectra.


