Article

Optimal Outage Management Model Considering Emergency Demand Response Programs for a Smart Distribution System

1
Clinical-Laboratory Center of Power System & Protection, Faculty of Intelligent Systems Engineering and Data Science, Persian Gulf University, Bushehr 7516913817, Iran
2
Center for Energy Informatics, The Maersk Mc-Kinney Moller Institute, University of Southern Denmark, 5230 Odense, Denmark
*
Author to whom correspondence should be addressed.
Appl. Sci. 2020, 10(21), 7406; https://doi.org/10.3390/app10217406
Submission received: 18 September 2020 / Revised: 7 October 2020 / Accepted: 18 October 2020 / Published: 22 October 2020

Abstract

:
In this paper, a novel smart outage management system considering Emergency Demand Response Programs (EDRPs) and Distributed Generations (DGs) denoted as S O M S D G s E D R P s is proposed. The EDRPs are provided to decrease the cost of load shading in a time of emergency. The objective function of the problem is proposed to minimize the load shading cost, the DG dispatch cost, the demand response cost and the repair dispatch time for crews. The S O M S D G s D E R P s solves an optimization problem that is formulated as Mixed Integer Linear Programming (MILP) taking into account the grid topology constraints, EDRP constraints, DG constraints and crew constraints. The MILP formulation was demonstrated in the GAMS software and solved with the CPLEX solver. The proposed method was tested on the IEEE 34 bus test system as well as an actual Iranian 66 bus power distribution feeder. The results show that the EDRPs and DGs can be effective in decreasing the outage cost and increasing the served load of the distribution power system in a crisis time.

1. Introduction

1.1. Motivation

Power distribution grids are becoming more intelligent due to the opportunities that are provided by today’s information and communication technologies [1]. These so-called smart grids consist of several parts, features and functions. A smart outage management system is an essential part of smart power distribution grids [2]. Distributed Generations (DGs) play an important role in outage management. In a time of crisis, the outage management system can effectively use the output power of the DGs to restore the power more effectively, to minimize the affected area and, consequently, to decrease the cost of the outage. For this, the output power of DGs should be dispatched by the outage management system considering economic aspects. Moreover, the integrated distribution system is divided into multiple areas [3]. In some areas, the customers’ demand is not satisfied with the output power of DGs. Consequently, the Distribution System Operator (DSO) is inevitably forced to choose load shading to balance the generation and demand of consumers. The load shading is costly; therefore, DSOs prefer not to go for such a solution unless it is necessary. In this regard, if the sum of the generation power capacity is lower than the sum of the demand of each area, then load shedding is chosen.
To address this issue, the Emergency Demand Response Program (EDRP) contract can be used to decrease the load shading cost by the DSO [4]. The EDRP is an incentive type of demand response program. There are three types of demand response, namely, an emergency demand response, economic demand response and ancillary service demand response. An emergency demand response is employed to avoid involuntary service interruptions during times of supply scarcity (such as outages in the power system). An economic demand response is employed to allow electricity customers to curtail their consumption when the productivity or convenience of consuming that electricity is worth less to them than paying for the electricity. An ancillary service demand response consists of a number of specialty services that are needed to ensure the secure operation of the transmission grid and which have traditionally been provided by generators. In summary, the demand response programs can be implemented in optimal energy management or other operation problems without any outage occurrence in the power system.
The EDRPs can be an effective solution for reducing the operation cost of the power system when the energy market price of the deregulated power market is high [4]. Furthermore, the main target of the EDRP contracts is in crisis times.
In a crisis time, crews of each depot try to repair the outages of the distribution system. The operation performance of each crew affects the load restoration time and the value of the pickup loads. The topology of the power system will be changed in each repair time interval. Furthermore, the optimal output power of each DG and the number of EDRPs in each load point and repair time interval depend on the performance of the crews. Hence, an optimal outage management system is needed to integrate the DG dispatch problem, reduce the EDRP cost, minimize the operation time of crews and minimize the load shading cost.

1.2. Literature Review

A smart power distribution system consists of different units such as a smart protection unit [5], a smart energy management unit [6], a demand response aggregator unit [7] and a smart outage management unit [8]. The smart outage management unit is one of the important units in the smart power distribution system. Many papers are published in the field of outage management. In [9], a smart outage management system based on probabilistic and fuzzy membership functions has been provided. In [10], the role of the outage management system in the reliability index of the multi-microgrid system has been investigated. In [11], a hierarchical outage management scheme to enhance the resilience of a smart distribution system comprised of multi-microgrids against unexpected disaster events has been proposed.
Several algorithms have been presented providing solutions for outage management problems, including heuristic techniques [12], dynamic programming [13] and multi-agent systems [14].
Recent studies show that the DG and the Micro Grids (MGs) have some potential to increase the flexibility of the outage management systems. The authors in [3] believe that the sectionalizing of the smart power distribution system into the smart MGs is a useful option for increasing the stability of the power system in crisis times. In this paper, DGs have an important role in the proposed outage management system. Although [3] proposes an interesting method for increasing the reliability of the MGs, the EDRPs, as an essential part of the smart microgrid, have been neglected.
Demand Response Programs are used to reduce the cost of operation of the smart microgrids. In [15], a Demand Response Program model has been provided for use in energy management. In this paper, the role of Demand Response Programs in the self-healing smart microgrid is addressed. One type of Demand Response Program is the Emergency EDRP that is usually used when the power distribution system faces a natural disaster and outage [16]. In [17], it is shown that the EDRP can reduce the line congestion index in the smart distribution system. This is a valuable effect of the EDRP for times of crisis.
In [18], a safe and reliable framework for normal operation and self-healing MGs (with multiple DGs and EDRPs) has been proposed. In this study, two-layer communication between each MG and the common bus is considered. In the initial state, all the MGs are in the normal mode (self-supply). In crisis times, all the MGs are connected to a common bus. This paper investigates the outage management system considering the EDRPs and DGs; however, it has not provided a plan for the crews to repair the outages.
Some recent papers propose a framework to integrate repair and restoration in the power system. In [19], a Mixed Integer Linear Programming (MLIP) model is proposed for post-hurricane outage management without routing the crews. In this paper, a three-stage framework is developed such that in the first stage, the outage is modeled to indicate the impact of hurricanes on power system components, and in the second stage, a stochastic pre-hurricane crew mobilization is provided for managing resources before the event; further, in the third stage, a deterministic post-hurricane recovery is presented for managing resources after the event. In [20], the Routing Repair Crew (RRC) problem in the transmission system has been discussed. In this paper, a four-stage model based on constraint injection has been proposed. This approach decouples the power-restoration and vehicle-routing optimizations.
Combining the RRC problem with distribution system power flow results in a complex optimization problem. To remedy this, one way is to consider them as two independent problems [21]. However, considering the RRC problem and distribution problem as two independent problems cannot provide an optimal solution because the mentioned problems are not independent of each other. The authors in [8] propose a framework to integrate the RRC problem and restoration problem. In this paper, the DG dispatch, crew dispatch and reconfiguration problem have been considered to reduce the time and size of a system outage. In [22], a two-stage stochastic program is developed to manage the smart MG operation and repair crew routing for outage restoration after extreme weather events. In this paper, the uncertain demand and the repair time have been considered to increase the reality of the problem, but the EDRP cost and the load shading cost have been neglected.

1.3. The Proposed Approach and Contributions

The EDRP and DGs help the DSOs in a crisis time. Since the power system topology in each repair time interval is changeable, the optimal values of the DGs and EDRPs in each load point will be changed. Unfortunately, this has not been addressed in previous studies. In this paper, a novel smart outage management system considering EDRPs and DGs denoted by S O M S D G s E D R P s is proposed. The S O M S D G s E D R P s works in a two-stage process. In the first stage, the optimization problem is solved to cluster the outages in each depot. In this stage, the ability of each crew, the capacity of each crew vehicle, the limitations of the depot resource and the distance between the outages and depots are considered. In the second stage, the multi-objective cost function is provided to optimize the DG cost, EDRP cost, load shading cost and RRC time. In summary, the contributions of this paper are the following:
  • A novel two-stage multi-objective optimization is provided for outage management.
  • The EDRP, as an essential program to decrease the cost of an outage in a smart distribution system, has been considered.
  • The combination of the RRC problem, DG dispatch problem and EDRPs considering topological power system constraints are investigated.
  • The proposed method is tested on an IEEE 34 bus test system as well as an actual Iranian 66 bus power distribution feeder.

1.4. Paper Organization

The rest of the paper is organized as follows. The EDRP concepts and effects on the outage management problem are described in Section 2. The framework of S O M S D G s E D R P s is presented in Section 3. The formulation of the proposed framework is provided in Section 4. The numerical studies on the IEEE 34 bus test system and the actual Iranian 66 bus power distribution feeder are provided in Section 5. Finally, the conclusion is presented in Section 6.

2. The Role of EDRPs in the SOMS DGs EDRPs Program

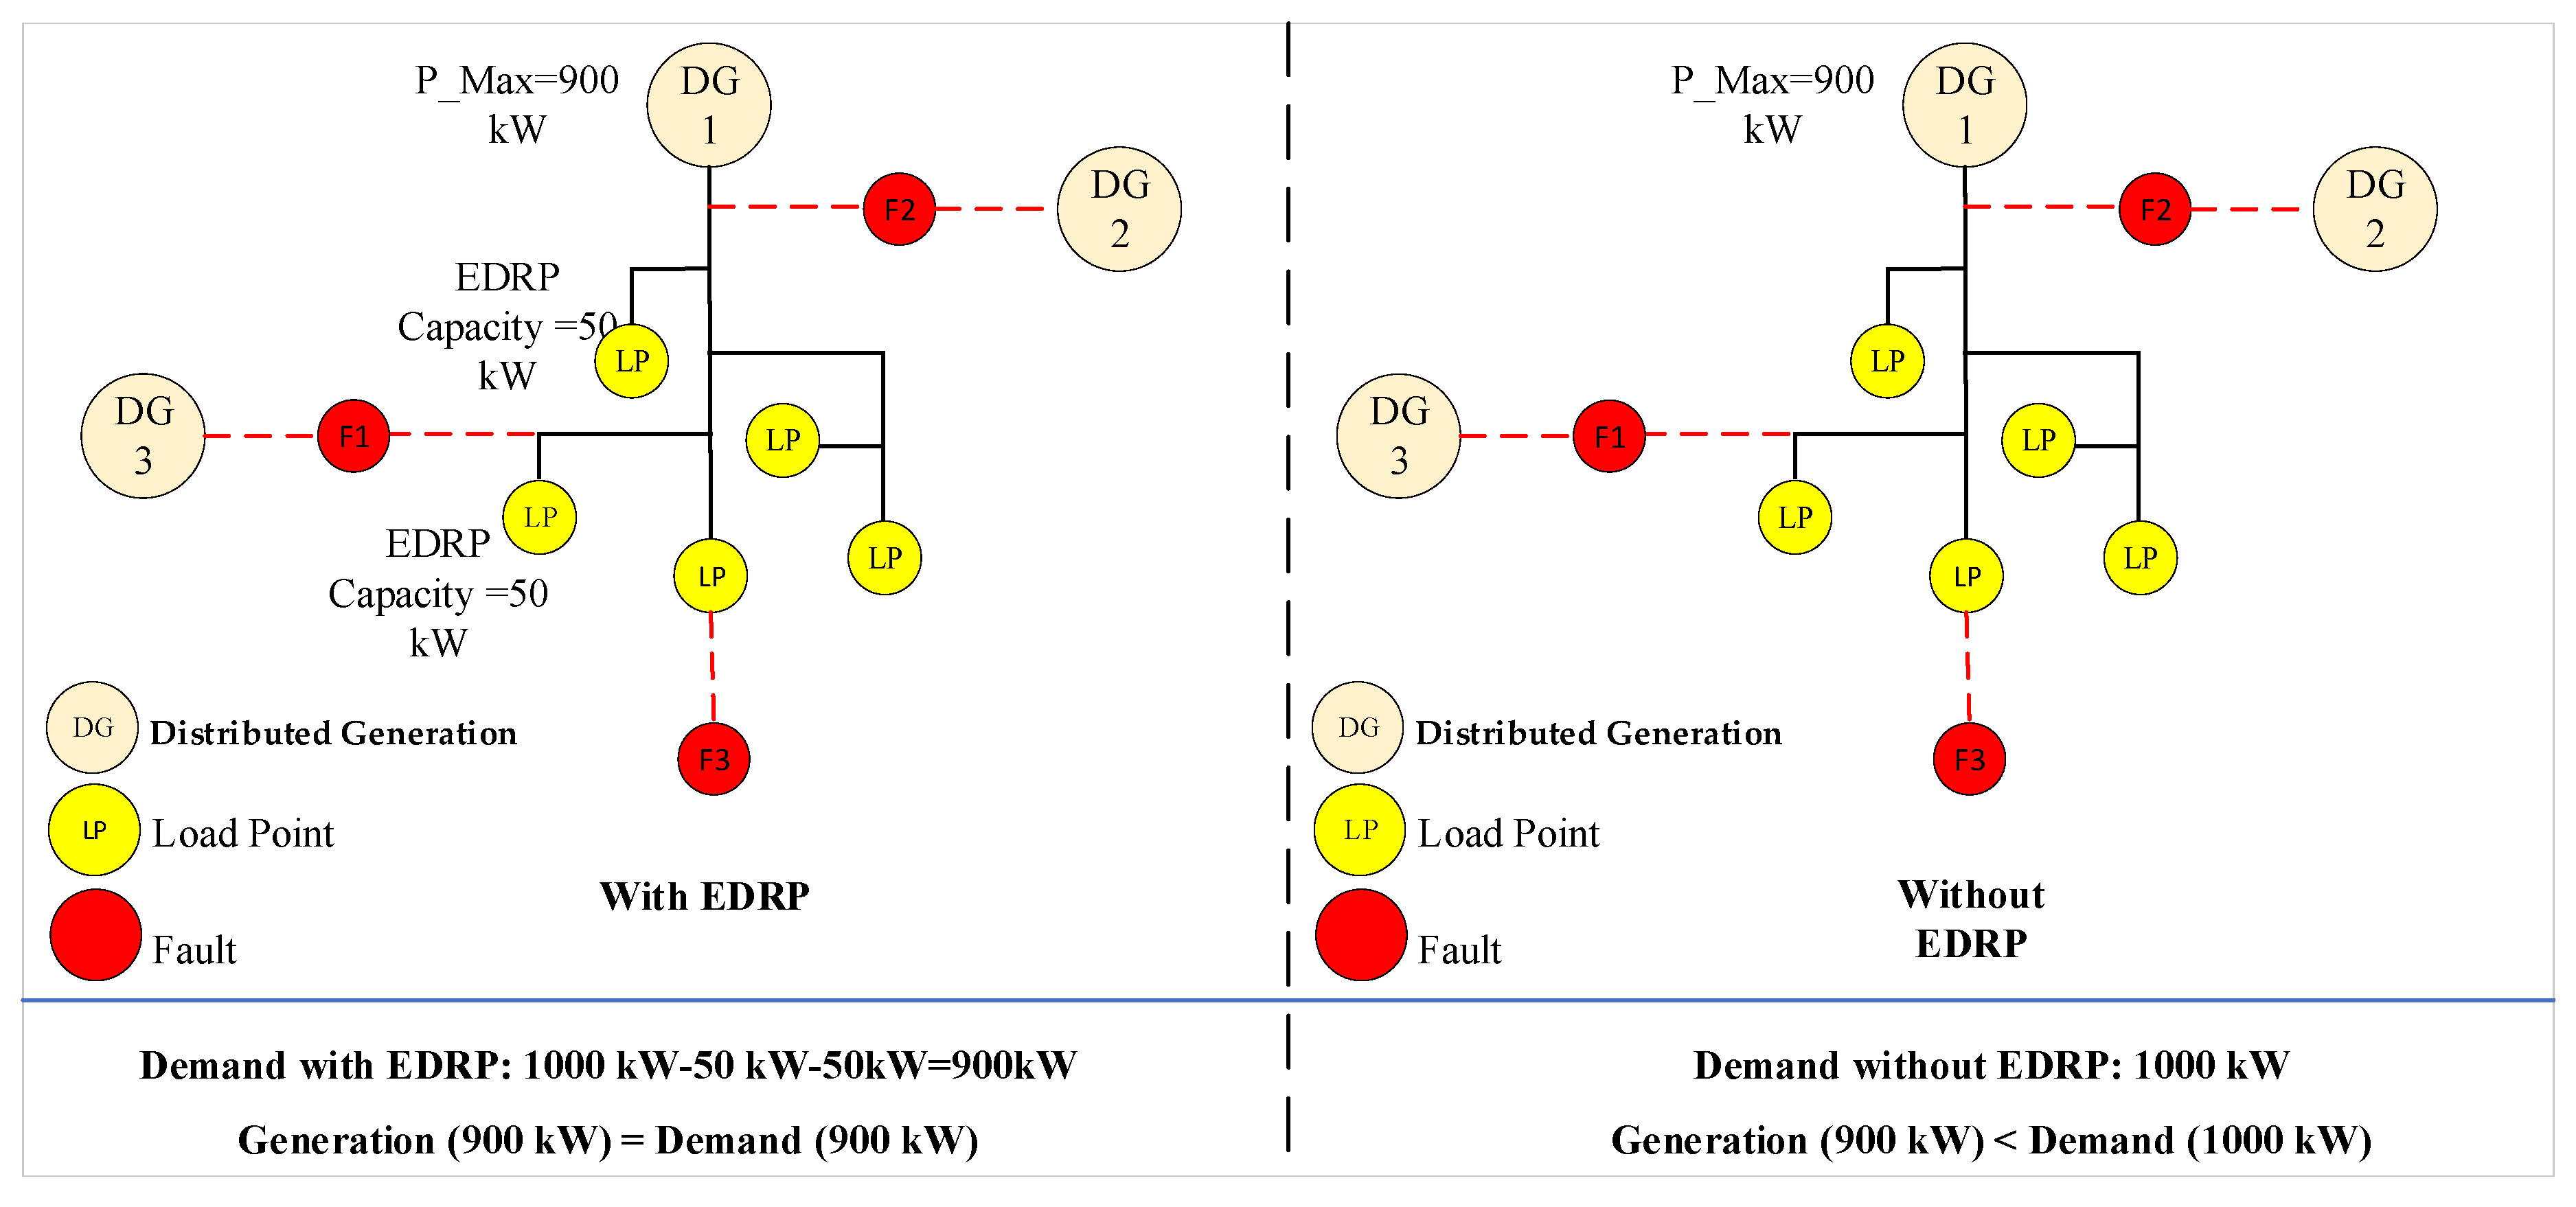
The EDRP can play an important role in a time of crisis when the power system has been damaged by storms and floods. In the EDRP, the DSO should sign contracts with subscribers before the crisis. Usually, the incentive cost of the EDRP, which is paid to the customers, is much lower than the outage penalty cost that is paid by the DSO to customers when the DSO is forced to implement load shedding. In the following, an example is provided to show the potential of EDRP in a crisis. A sample section of the power system that is affected by faults is shown in Figure 1.
In Figure 1, the loads are included in demand response loads and constant loads, and three faults occurred in the right and left sides of the distribution system. The value of each load is assumed to be 250 kW, and the variable loads in each demand response point are considered to be 50 kW. The maximum capacity of the microturbine generator at the top of the distribution system is assumed to be 900 kW.

2.1. Decreasing the Outage Cost

In the example, the summation of the generation is lower than the loads (without the EDRP). In this situation, the EDRP is used by the DSO to meet the demand. Furthermore, the DSO pays incentives to customers that have an EDRP contract with the DSO for reducing 50 kW of electrical demand. The incentive value in the EDRP is lower than the penalty factor (in the load shading).

2.2. Increasing the Served Load

In Figure 1, Faults 1, 2 and 3 isolate the section of the distribution system. In this situation, line congestion has occurred, and the constant loads are turned off. However, the EDRP is a very effective program that can help in retaining the loads in the system by decreasing the partial value of demand considering the capacity of the lines.

3. SOMS Framework

In this section, the SOMS framework is described and the important features of the proposed structure are presented. The important goals of the proposed structure for outage management system are:
  • To classify the outages optimally according to the depots and crews’ constraints.
  • To reduce the outage cost of the distribution system.
  • To reduce the DG cost of the distributed energy resources.
  • To reduce the EDRP cost of the smart distribution system.
  • To reduce the RRC’s time to obtain the health of the power distribution system.
Usually, the optimization problems have some constraints. In this paper, the important constraints that are considered are as follows:
  • The capacity limit of crews’ vehicles and the limits of the resources in each depot.
  • The operation limits such as the power flow limit of the distribution system, EDRP limits and DG limits.
  • The RRC limit.
  • The repair of damaged components.
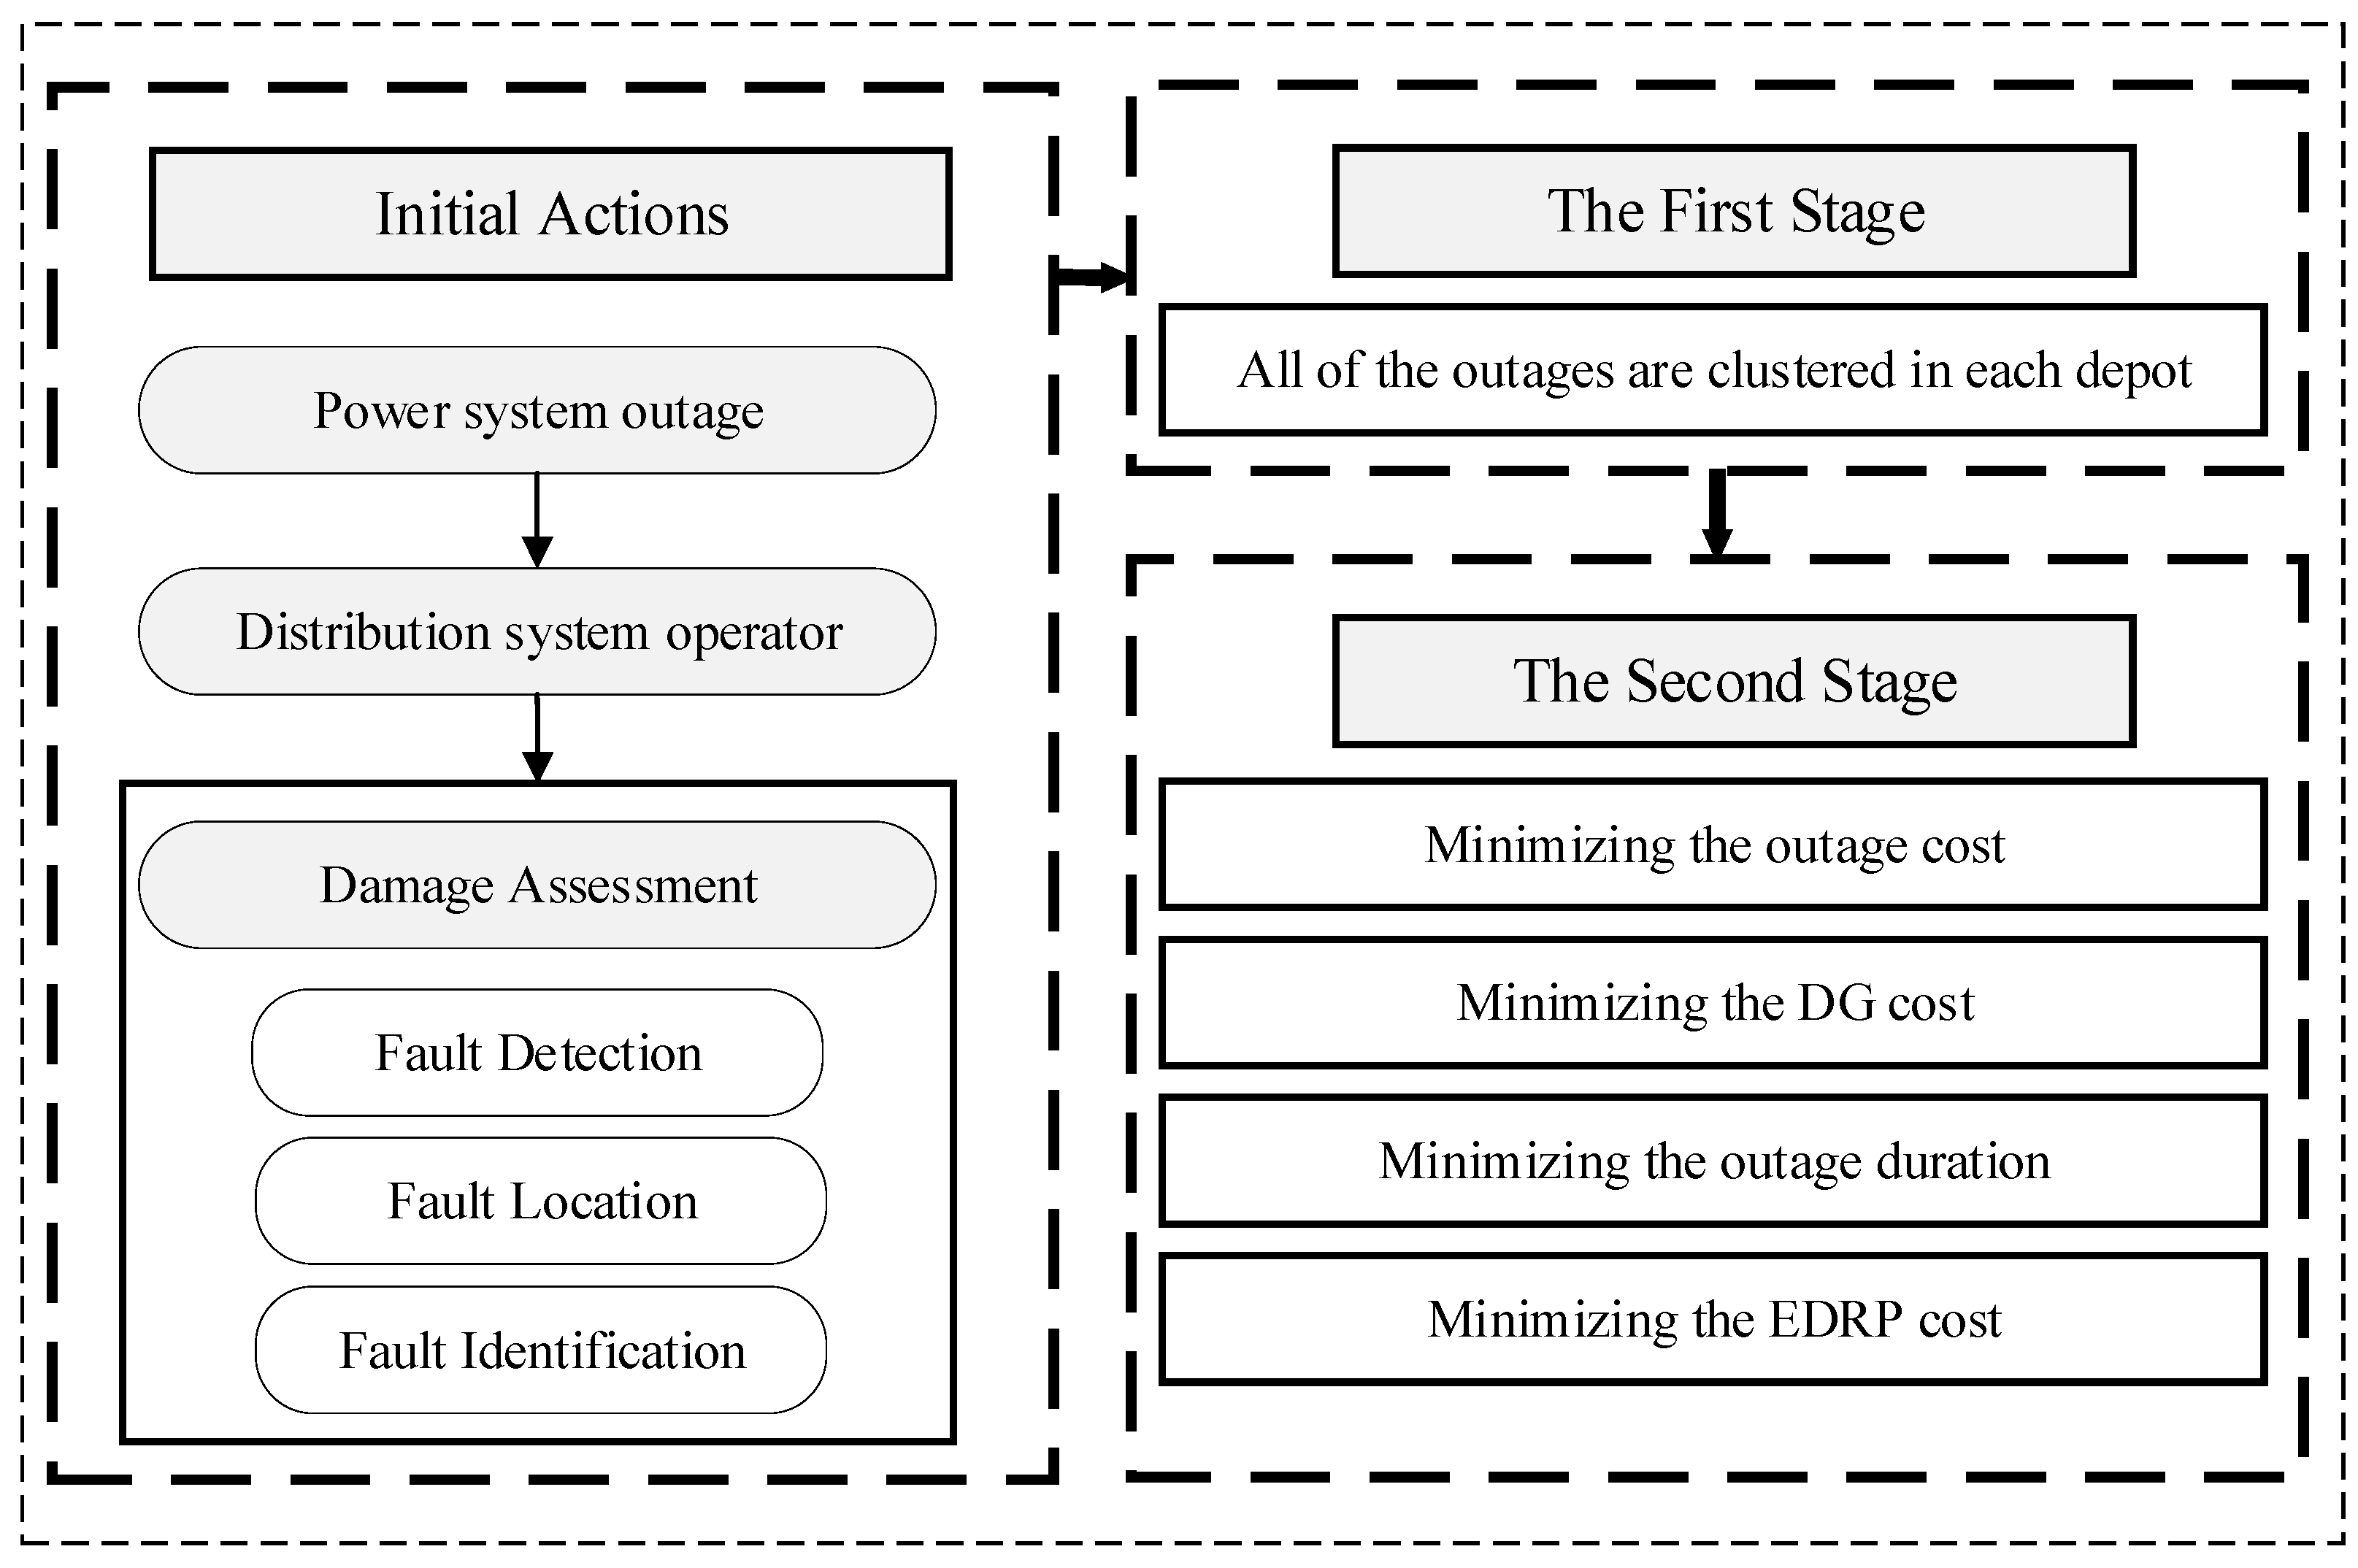
The proposed outage management system should be an integrated system considering all the goals and constraints. The proposed structure of the outage management system is shown in Figure 2.
As shown in Figure 2, the proposed structure for system outage management is categorized into two stages. In the first stage, all the outages are clustered considering the distance between depots and the damaged component. In this stage, all the above-mentioned constraints are addressed. This clustering causes a decrease in the processing time for the DSOs in crisis times. The first-stage results are very important in the case studies where the numbers of outages and depots are high. In the second stage, the multi-objective function is provided to optimize the outage cost, DG cost, EDRP cost and RRC time.
This paper considers some novel aspects of the outage management problem (in comparison with previous work) that are mentioned as follows:
  • The load shedding cost is considered in the objective function of the proposed framework:
    Previous work only considered the maximum served load in the outage management problem. However, this paper considers the load shedding cost in the novel structure. Additionally, the load importance is considered, to prioritize high-priority loads.
  • The EDRP costs are considered in the proposed framework:
    The role of the EDRP was not considered in previous work in the smart outage management field.
  • The dispatch cost for the DGs is considered in the objective function of the proposed problem:
    DGs plays an important role in the smart outage management system. The operation cost for the DGs was not considered in previous work.

4. SOMS Framework

In this section, the mathematical formulation of S O M S D G s D R P s is presented. The mathematical formulation for the first stage and the second stage is described in the following sections.

4.1. The First Stage

Outage clustering is the main target in the first stage of the proposed structure. The basic and main idea of outage clustering is relating the outage to the nearest depot. However, each outage should be clustered in only one cluster (depot). Additionally, the constraints of the resources and the proficiency of each depot should be considered. The input data of the first stage are as follows:
  • The estimated distance between the outages and each depot.
  • The number of resources in each depot.
  • The required resources for outage clearing.
  • The proficiency of each depot.
This stage causes a decrease in the processing time for the problem. The objective function of the first stage is defined as Equation (1):
m i n   σ m d ( d e p σ , m )   s ( σ , m )
In Equation (1), the variable s ( σ , m ) is defined to decide which outage m is assigned to the depot σ . Additionally, d ( d e p σ , m ) is the distance between the outages and each depot.
The main target of the objective function is to assign the outages to their closest depots. After solving Stage One, all the outages should be clustered into one depot using Equation (2):
σ s ( σ , m ) = 1
It is clear that each damaged component needs some equipment for repair. Regarding the issue, Equation (2) shows that the damaged component (outage) should be clustered into the depot that has adequate equipment for repairing the outage.
R e s ( σ , p ) m R e s N ( m )   s ( σ , m )
In Equation (3), the parameter R e s ( σ , p ) and R e s N ( m ) indicates the number of resources in each depot and required resources for outage clearing, respectively.
Furthermore, Equation (4) shows that each outage should be assigned to a depot that has proficiency in repairing the damaged component:
T D ( σ , m ) s ( σ , m )
In Equation (4), the parameter T D ( σ , m ) shows the proficiency of each depot in clearing the outages. In this equation, the binary parameter T D ( σ , m ) is considered higher than the clustering binary variable s ( σ , m ) . Therefore, if the amount of T D ( σ , m ) is considered equal to zero, then the amount of s ( σ , m ) is determined as equal to zero. Therefore, the intended outage will not be clustered in a depot that does not have adequate proficiency.

4.2. The Second Stage

The objective function of the first stage is defined as Equation (5):
M i n   { a 1 × b N b t N t ( ( 1 q ( b , t ) ) × P d ( b , t ) × P e n ( b ) ) + a 2          × m N m t N t H m × f ( m , t ) × T ( t ) + a 3 × i N i t N t v ( i ) × P D G ( i , t ) + a 4          × L N L b N b t N t P D R ( L , b , t ) × C D R ( L ) }
In Equation (5), the first section is defined to consider the cost of load shedding and system outage. In this regard, the parameter P e n ( b ) is defined to show the difference between various buses. The second section is provided to decrease the RRC time. Moreover, the third term is considered to minimize the DG cost in crisis times, and the final section of the objective function is presented to minimize the demand response cost. In Equation (5) a 1 , a 2 , a 3 and a 4 are defined as coefficient parameters for the objective function. One of the important constraints in the power system is the balance of generations and loads, which is defined in Equation (6):
i N i P D G ( i , t ) + b N b S u s ( b , b p ) × ( δ ( b , t ) δ ( b p , t ) )          = q ( b , t ) × P d ( b , t ) L N L P D R ( L , b , t )
S u s ( b , b p ) indicates the susceptance between bus b and bp. Additionally, δ ( b , t ) shows the angle of the bus b in time t.
Equation (6) shows that the sum of the DG output power and transmission power should be equal to the demand in each time interval. The capacity of the distribution lines is limited to P L i n e m a x . Therefore, Equation (7) is introduced as:
u ( m , t ) × P L i n e m a x b N b S u s ( b , b p ) × ( δ ( b , t ) δ ( b p , t ) ) u ( m , t ) × P L i n e m a x
where the variable Z ( m , t ) is defined as the status of the damaged component after the crews visit and fix the damaged component. The status of the damaged component at each time is lower than or equal to Z ( m , t ) , which is introduced in Equation (8):
u ( m , t ) Z ( m , t )
In Equation (9), the power of each DG is forced to be lower than or equal to P D G m a x .
0 P D G ( i , t ) P D G m a x
If a load is energized, it should be remain energized, which is enforced by Equation (10):
q ( b , t ) q ( b , t + 1 )
Equation (11) shows that if a crew cth visiting an outage leaves it after finishing the repair, then [8]:
n N σ \ { m } x ( m , n , c , σ ) n N σ \ { m } x ( n , m , c , σ ) = 0
Equations (12) and (13) force all crews to start from the depot and, after the finishing task, return to the depot [8].
m N σ \ { 0 } x ( 0 , m , c , σ ) m N σ \ { 0 } x ( m , 0 , c , σ ) = 1
m N σ \ { d p } , c R C σ x ( m , d p , c , σ ) = n c ( σ )
Equation (14) guarantees that an outage is repaired by only one crew, to ensure that no crew visits a fixed component [22].
c R C σ y ( m , c , σ ) = 1
If the cth crew is moved from a damaged component m to n , then y ( m , c , σ ) = 1. Equation (15) relates the binary variables y ( m , c , σ ) and x ( m , n , c , σ ) :
y ( m , c , σ ) = n N σ \ { 0 , m } x ( m , n , c , σ )
Crews have different abilities and specialties for repairing the damaged components. Regarding the expertise, crews that cannot fix the damaged component should not visit that component. The mentioned issue is addressed in Equation (16) as follow:
y ( m , c , σ ) = 0
The sum of the damaged components that crew c visits should be lower than or equal to the number of pieces of equipment that are assigned to crew c by using Equation (17) [8]:
R E C c ( c ) m N σ R E S N ( m ) × y ( m , c , σ )
The sum of the resources that are assigned to crew c in depot σ should be lower than or equal to the resources of the depots according to Equation (18):
c R E C c ( c ) R E S P ( σ )
The capacity of the crew vehicle is limited to C A P ( c ) according to Equation (19):
R E C c ( c ) C A P ( c )
Equation (20) addresses the time of arrival of a crew at the damaged component. From Equation (20), when a crew arrives at an outage area m at the time A T ( m , c ) , they spend time r ( m , c ) to fix the outage and then take time t r ( m , n , c ) to reach the next outage n . The big M technique is used to separate times to reach the m and n components if the crew does not travel through the x ( m , n , c , σ ) path [22].
A T ( m , c ) + r ( m , c ) + t r ( m , n , c ) A T ( n , c ) ( 1 x ( m , n , c , σ ) ) M
Crews visit the outage area to repair the components, and the binary variable f ( m , t ) is equal to 1 when m is fixed at the time t by using Equation (21):
t f ( m , t ) = 1
In Equations (22) and (23), the outage repair time is defined. If crew c does not repair the mth damaged component, the time of arrival and the time of repair for this crew should not affect Equations (22) and (23), so A T ( m , c ) = 0 by applying Equation (24) [8].
t t f ( m , t ) c R C σ ( A T ( m , c ) + r ( m , c ) y ( m , c , σ )
t t f ( m , t ) c R C σ ( A T ( m , c ) + r ( m , c ) y ( m , c , σ ) + 1 ε
0 A T ( m , c ) r ( m , c ) M
If the damaged component m is repaired by crew c in time t, this section (or repaired component) is available in time t + 1 according to Equation (25) [8].
z ( m , t ) τ = 1 t 1 f ( m , τ )

5. Implementation and Results

In this section, the implementation of the proposed model and the results are presented. The problem of the first and the second stages is modeled as a MILP problem. The proposed model is solved by the CPLEX solver in the GAMS software [23]. It should be mentioned that the main advantage of the GAMS platform in comparison with other heuristic algorithms is finding the most optimal solution, while heuristic algorithms do not guarantee finding the optimal solution. Furthermore, all the reported results in this section are the most optimal ones, and the “Absolut Gap” of the solutions is obtained as equal to “zero”, which shows the preferability of the GAMS solver in comparison with heuristic solvers. The solver is used to find the solution until the “Absolut Gap” is obtained as equal to zero and lasts for a few minutes. It should be mentioned that a computer (Intel Core I5 2.8 GHz, 6 GB RAM) was utilized to solve the proposed framework.
In the following, the implementation of the proposed framework in the IEEE 34 bus test system and an actual Iranian power distribution feeder, which has 66 buses, are presented.

5.1. IEEE 34 Bus Test System

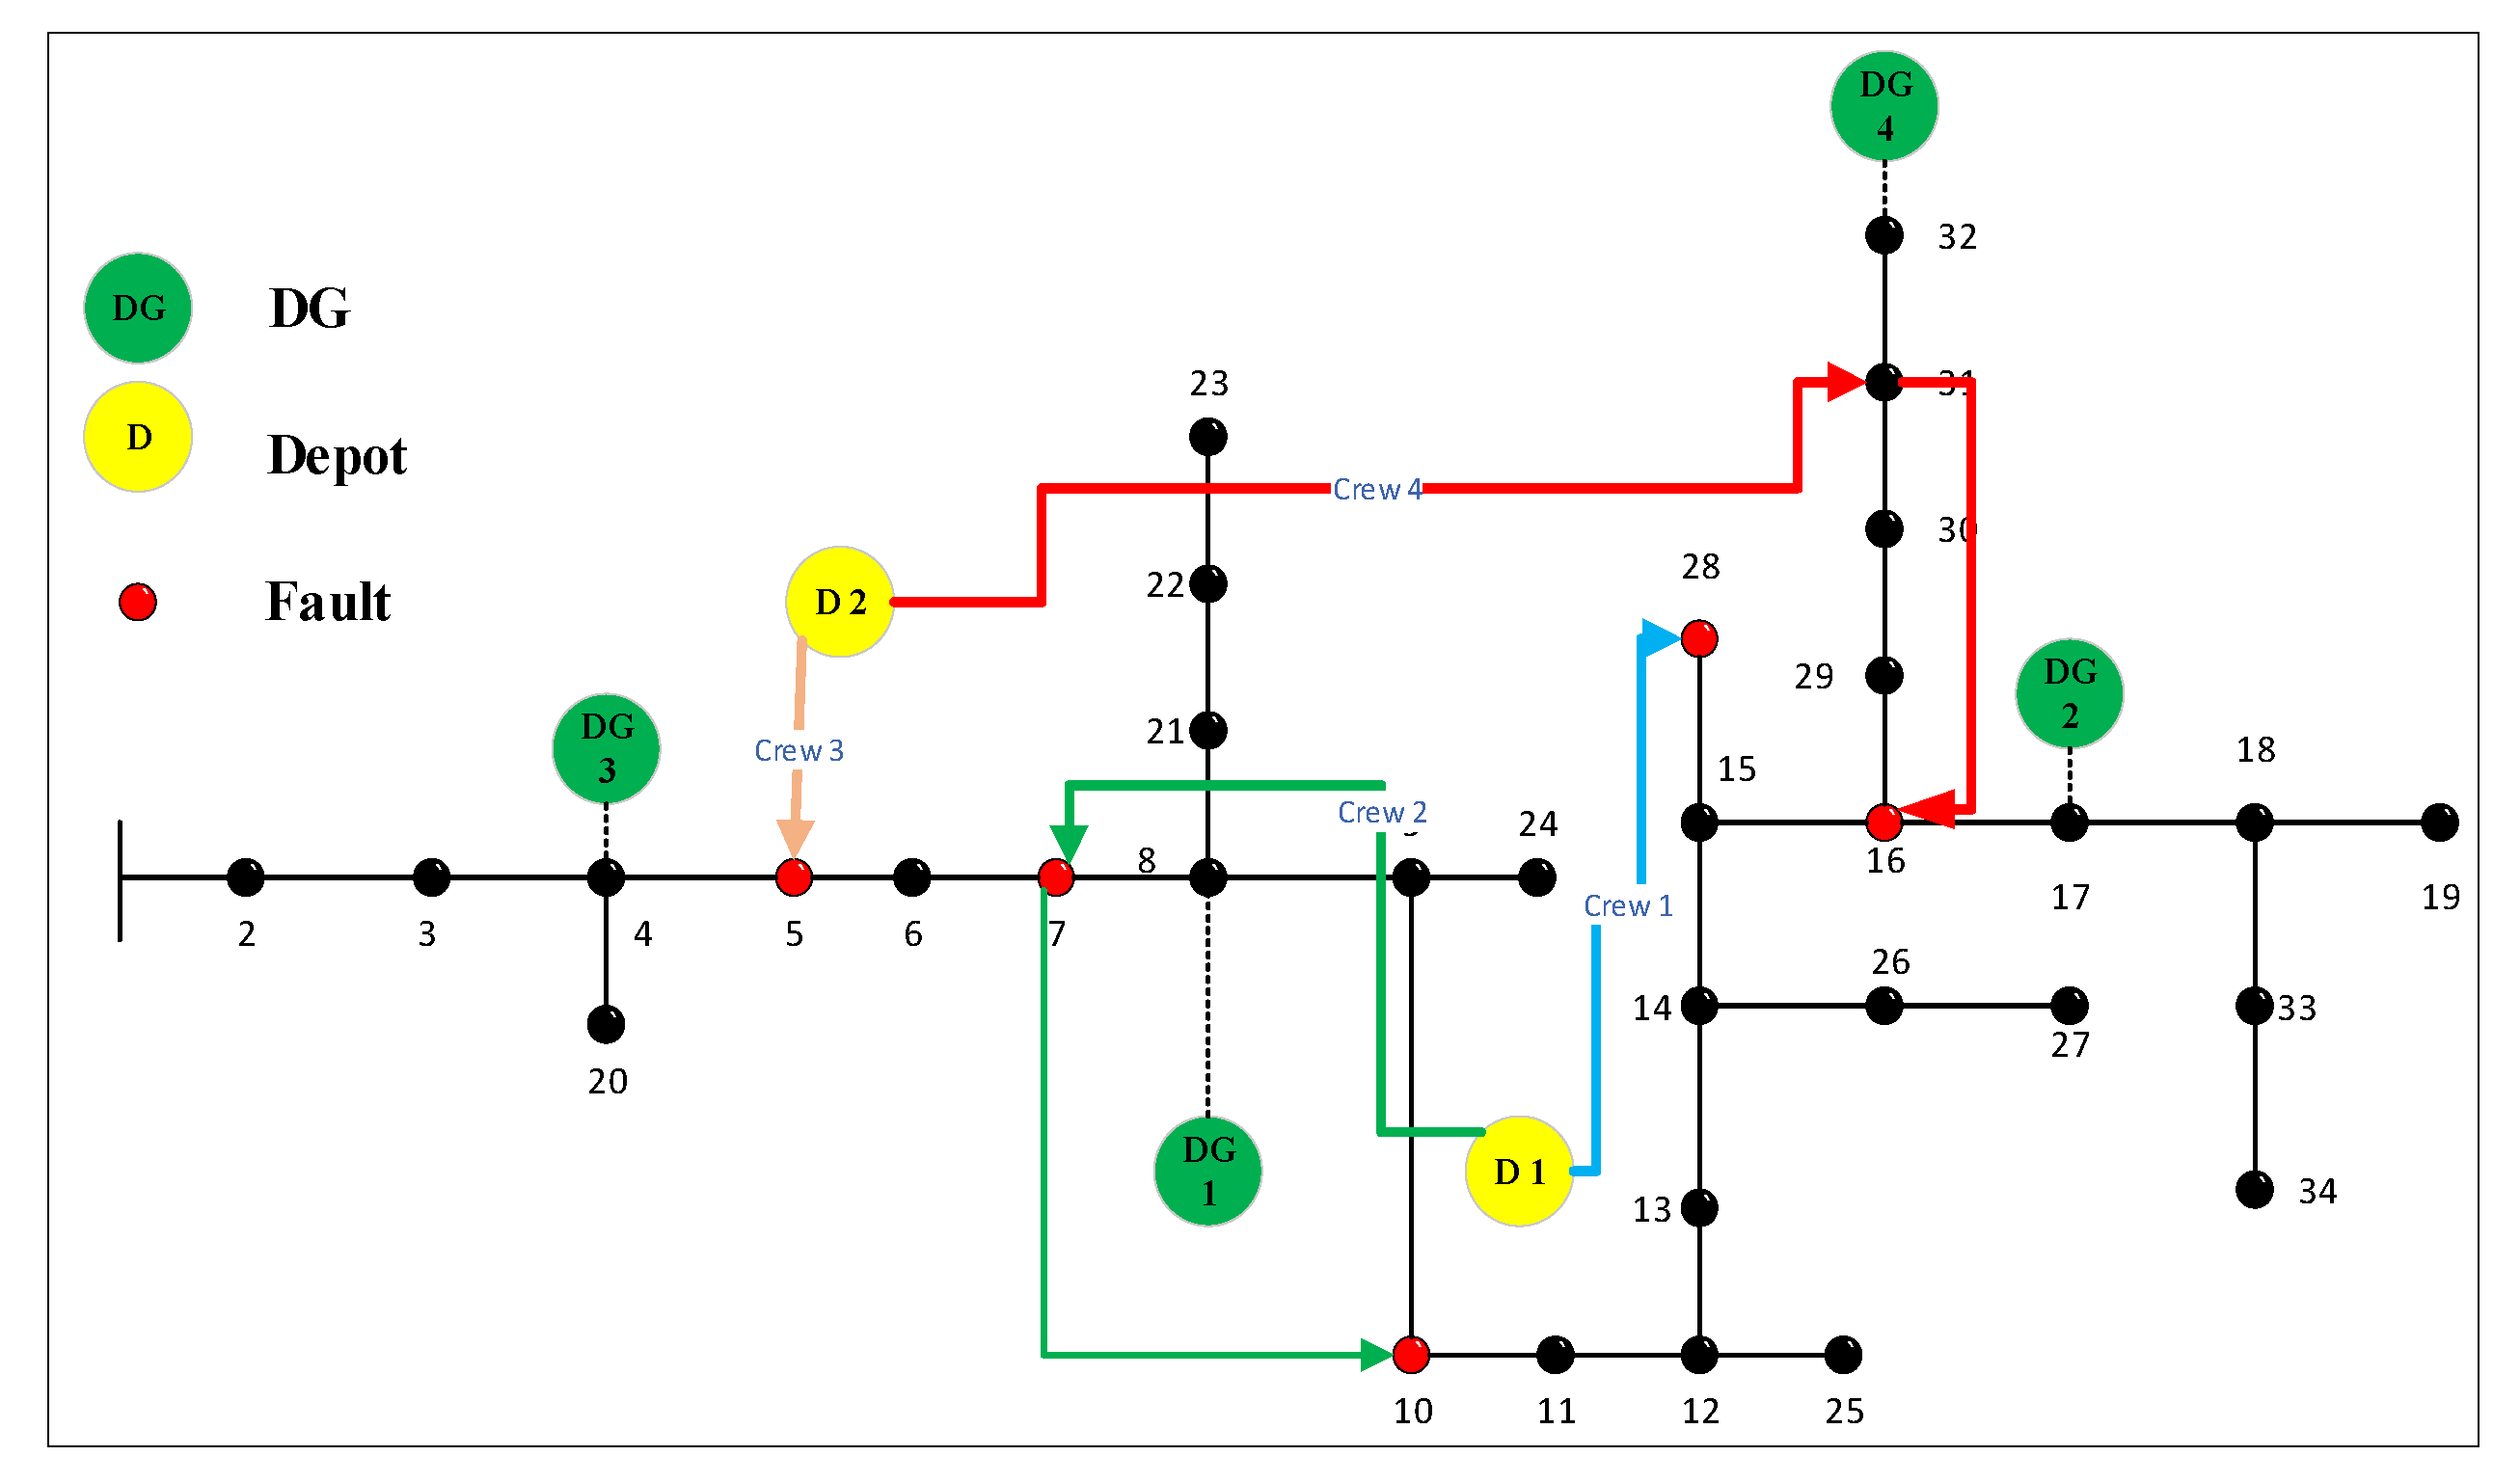
In this case study, seven faults are assumed in the IEEE 34 bus test system. The structure of the IEEE 34 bus test system is shown in Figure 3. In this case, two depots (each depot has two crews) are considered.
As shown in Figure 3, four DGs are considered in the case study. The important parameters of the DGs are presented in Table 1.
Regarding the load type, the penalty factor for the load shading programs and unwilling outages for each load point is assumed to be between 10 and 14 USD/kWh. Electricity supply interruptions have financial and social impacts on customers that can vary by season, time of day, customer type and customer load. Furthermore, it can be said that industrial customers are very sensitive customers from an economic point of view in comparison with other types of customers. In this regard, the penalty factor for industrial-load-type supply interruption was considered to be equal to 14 USD/kWh. Additionally, the penalty factor for commercial and residential loads was considered to be equal to 12 and 10 USD/kWh, respectively. The indexes of public hazard for Outages 2 and 7 are assumed to be 2 and for other outages are considered to be 1. The resources and time to repair the outages are listed in Table 2.
The capacity of Crews 1, 2, 3 and 4 to carry the resources is assumed to be 20, 20, 30 and 20, respectively. In this paper, the EDRP cost was considered in four steps. The step cost of the EDRP is shown in Table 3.
The total maximum capacity of the demand response in each demand response bus is assumed to be 30% of each demand response load. The maximum travel time between damaged components (outages) is considered to be 2.3 (time step). In this case study, the first stage of the proposed framework is neglected because the numbers of outages and buses are low.
One of the important outputs of the implementation of the outage management system is the RRC scheduling, which is shown in Figure 4.
Regarding Figure 4, four crews are dispatched in the distribution system to repair the damaged components, and all of them start from depots and are returned to the depots. The optimal RRC problem is a very effective problem for decreasing the time and cost of the system outages. According to the ability of the crews for repairing the outages, the resource capacity of the vehicle crews and the other constraints, the RRC problem is provided. Figure 5 shows sensitivity analyses of the effects of the number of faults and location in the routing process. In this figure, the number of outages and the location of them are different from the base assumptions. The result shows that the proposed outage management system changes the tasks of crews to access the optimal solution.
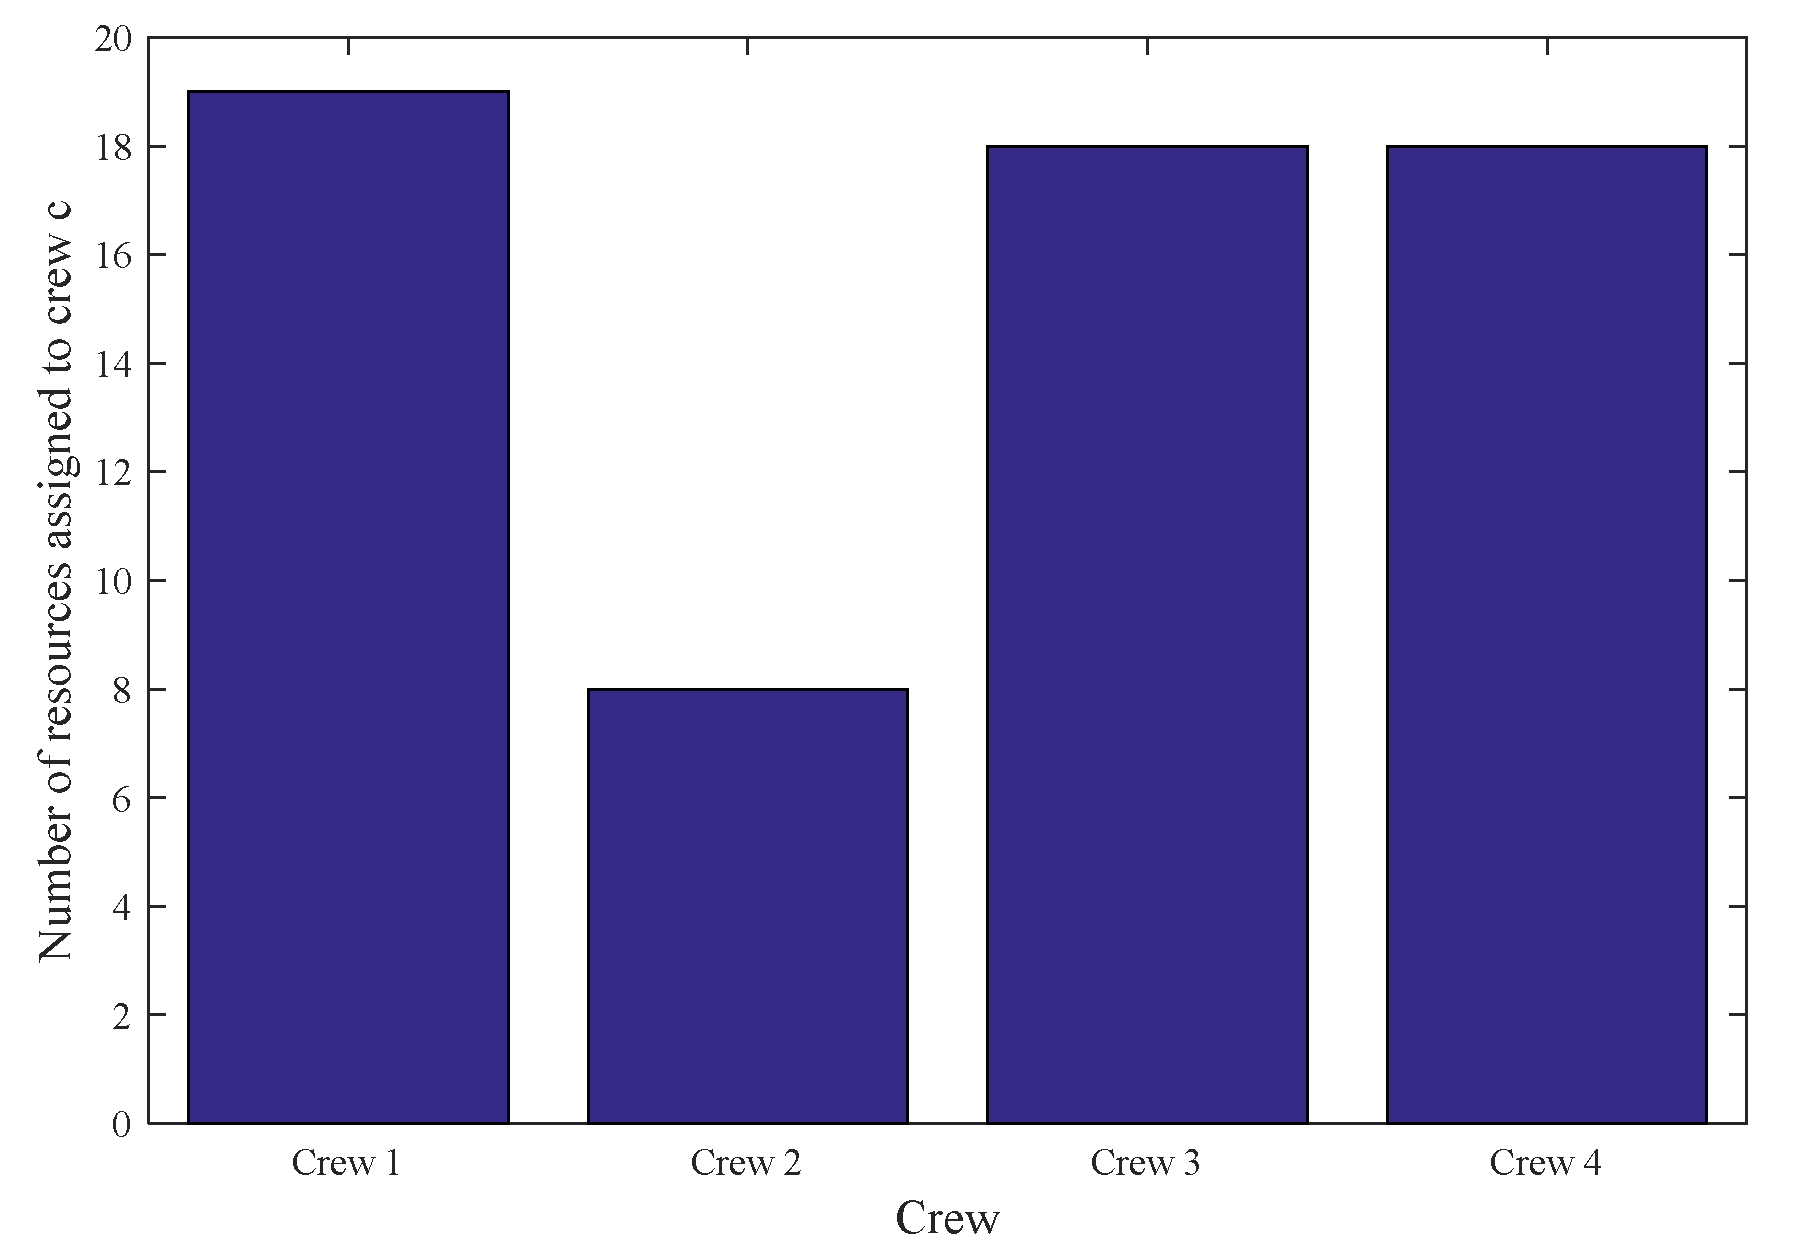
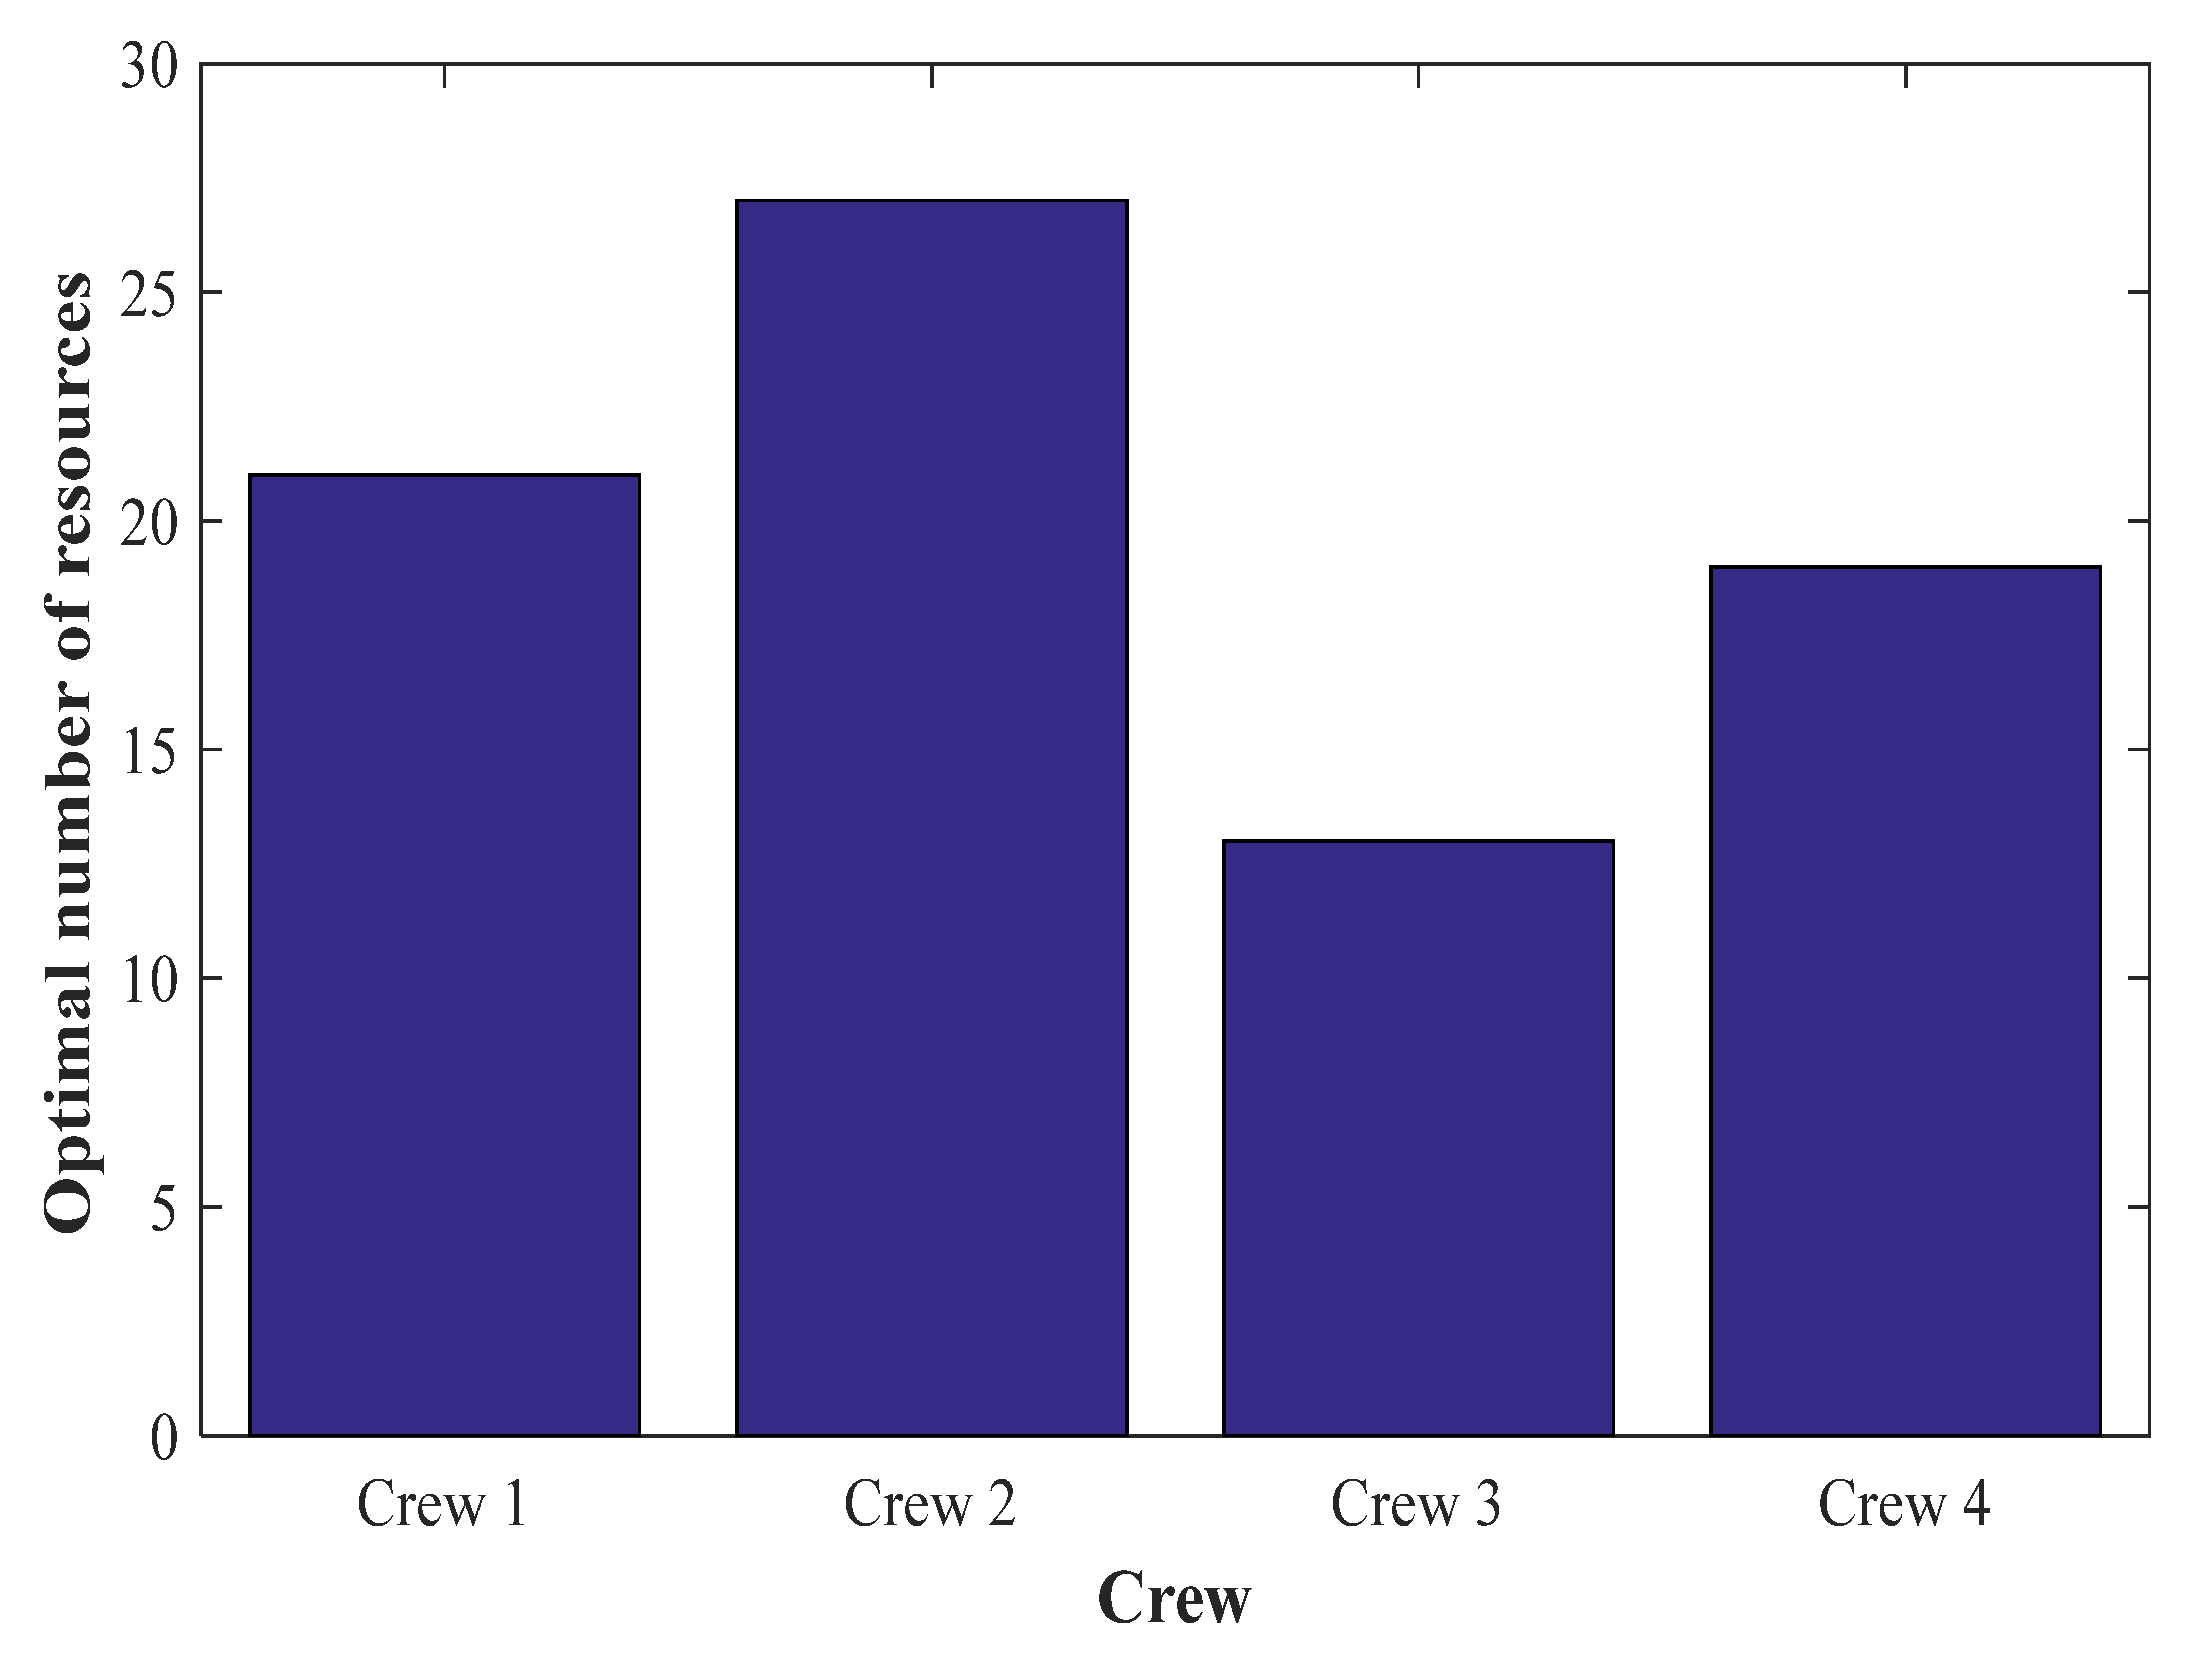
One of the important problems in a time of crisis is the problem of the assignment of the optimal resource number to each crew for repairing the damaged component in the distribution system. The optimal resource number for each crew is shown in Figure 6. The results show that the tasks of Crew 2 are very low. Hence, a lower number of resources is assigned to Crew 2.
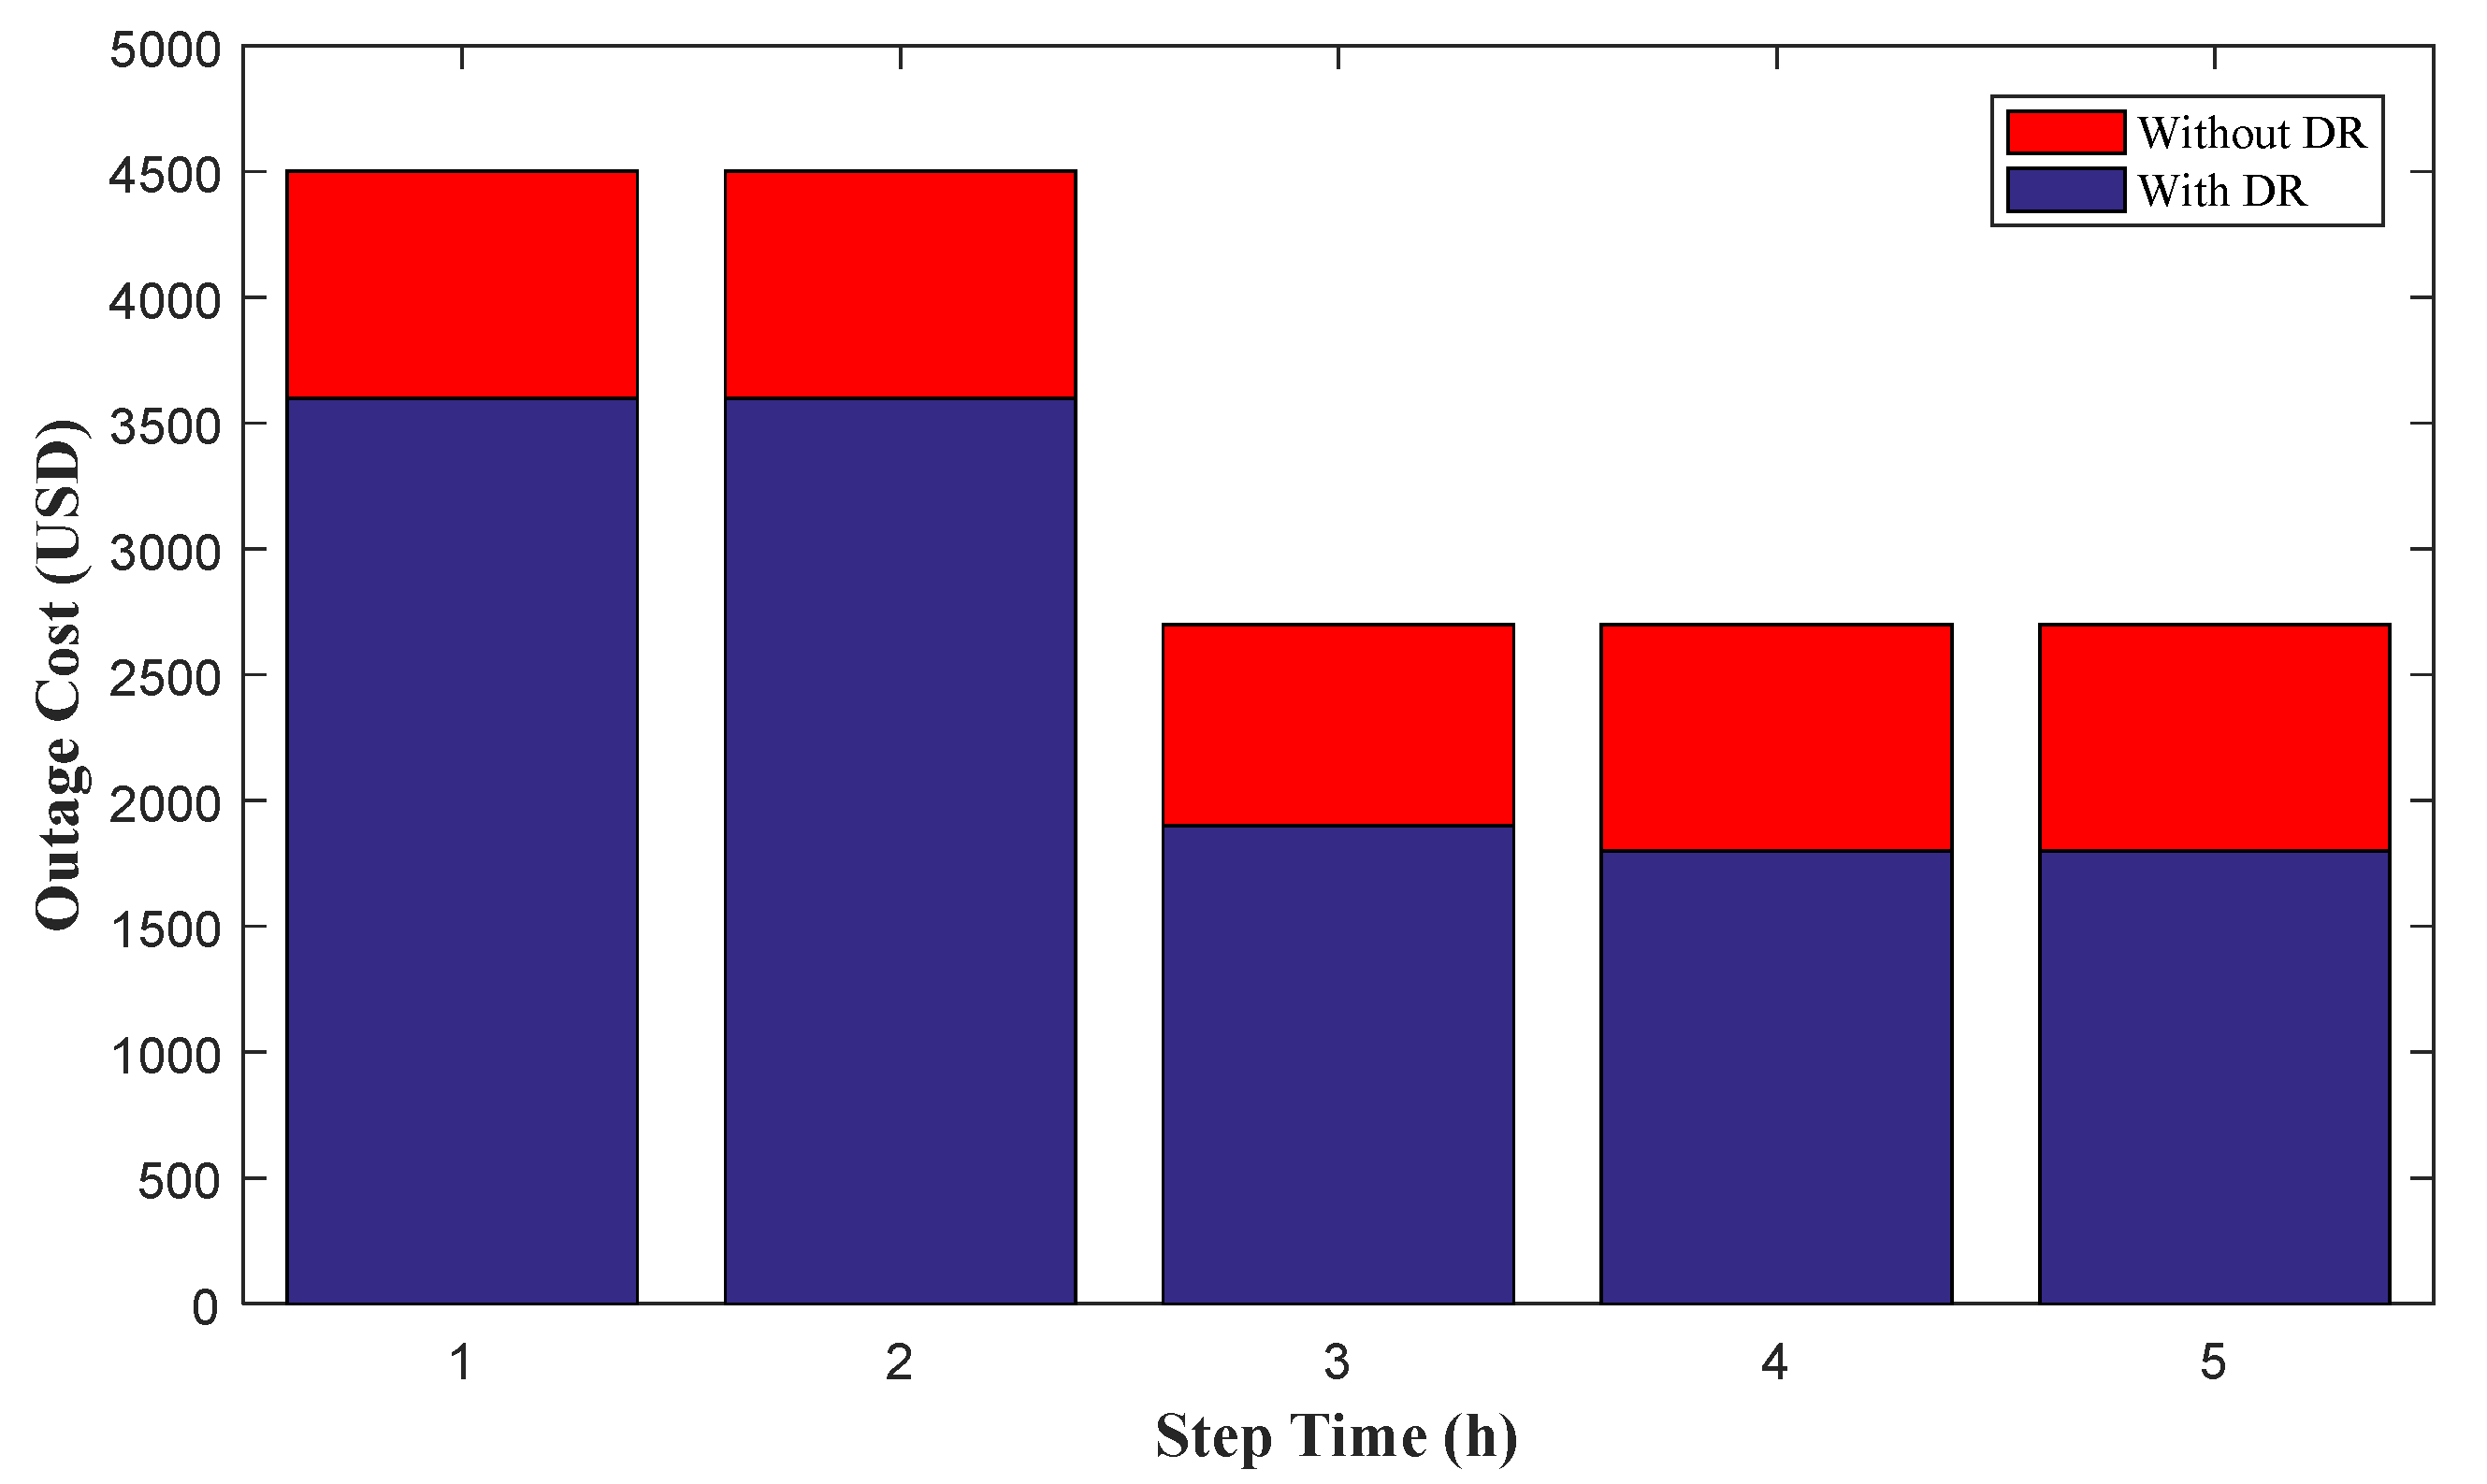
Regarding Section 2, the EDRP can effectively reduce the outage cost in the outage management problem. In this paper, the effects of the EDRP on the outage management problem were investigated, and the results are compared with each other. The results for the outage management cost with and without the EDRP are shown in Figure 7.
Referring to Figure 7, the outage cost of the distribution system is affected by the EDRP, and the outage cost is significantly decreased. In this study, the outage load points that are directly affected by faults are not considered in the EDRP. Some damage components are repaired by crews, and the load points in that area are permitted to contribute to the EDRP. According to this fact, the comparison of with- and without-EDRP scenarios shows that the decrease in outage cost in Step Times 4 and 5 is much higher than that in Step Times 1, 2 and 3.
An important goal of the outage management system is to return outage loads to the grid. The served load in each time step is shown in Figure 8. Referring to Figure 8, it can be concluded that the EDRP is a very effective program for increasing the served load.
The optimal priority list of the damaged components for repair by crews is shown in Table 4.
Referring the Table 4, crews can’t repair any outage in the first step time (This is shown by “*” in the first row of Table 4). Also, M4 is the priority damaged component that is repaired, and, in the end, all the faults are cleared from the distribution power system.

5.2. Iranian 66 Bus Power Distribution Feeder

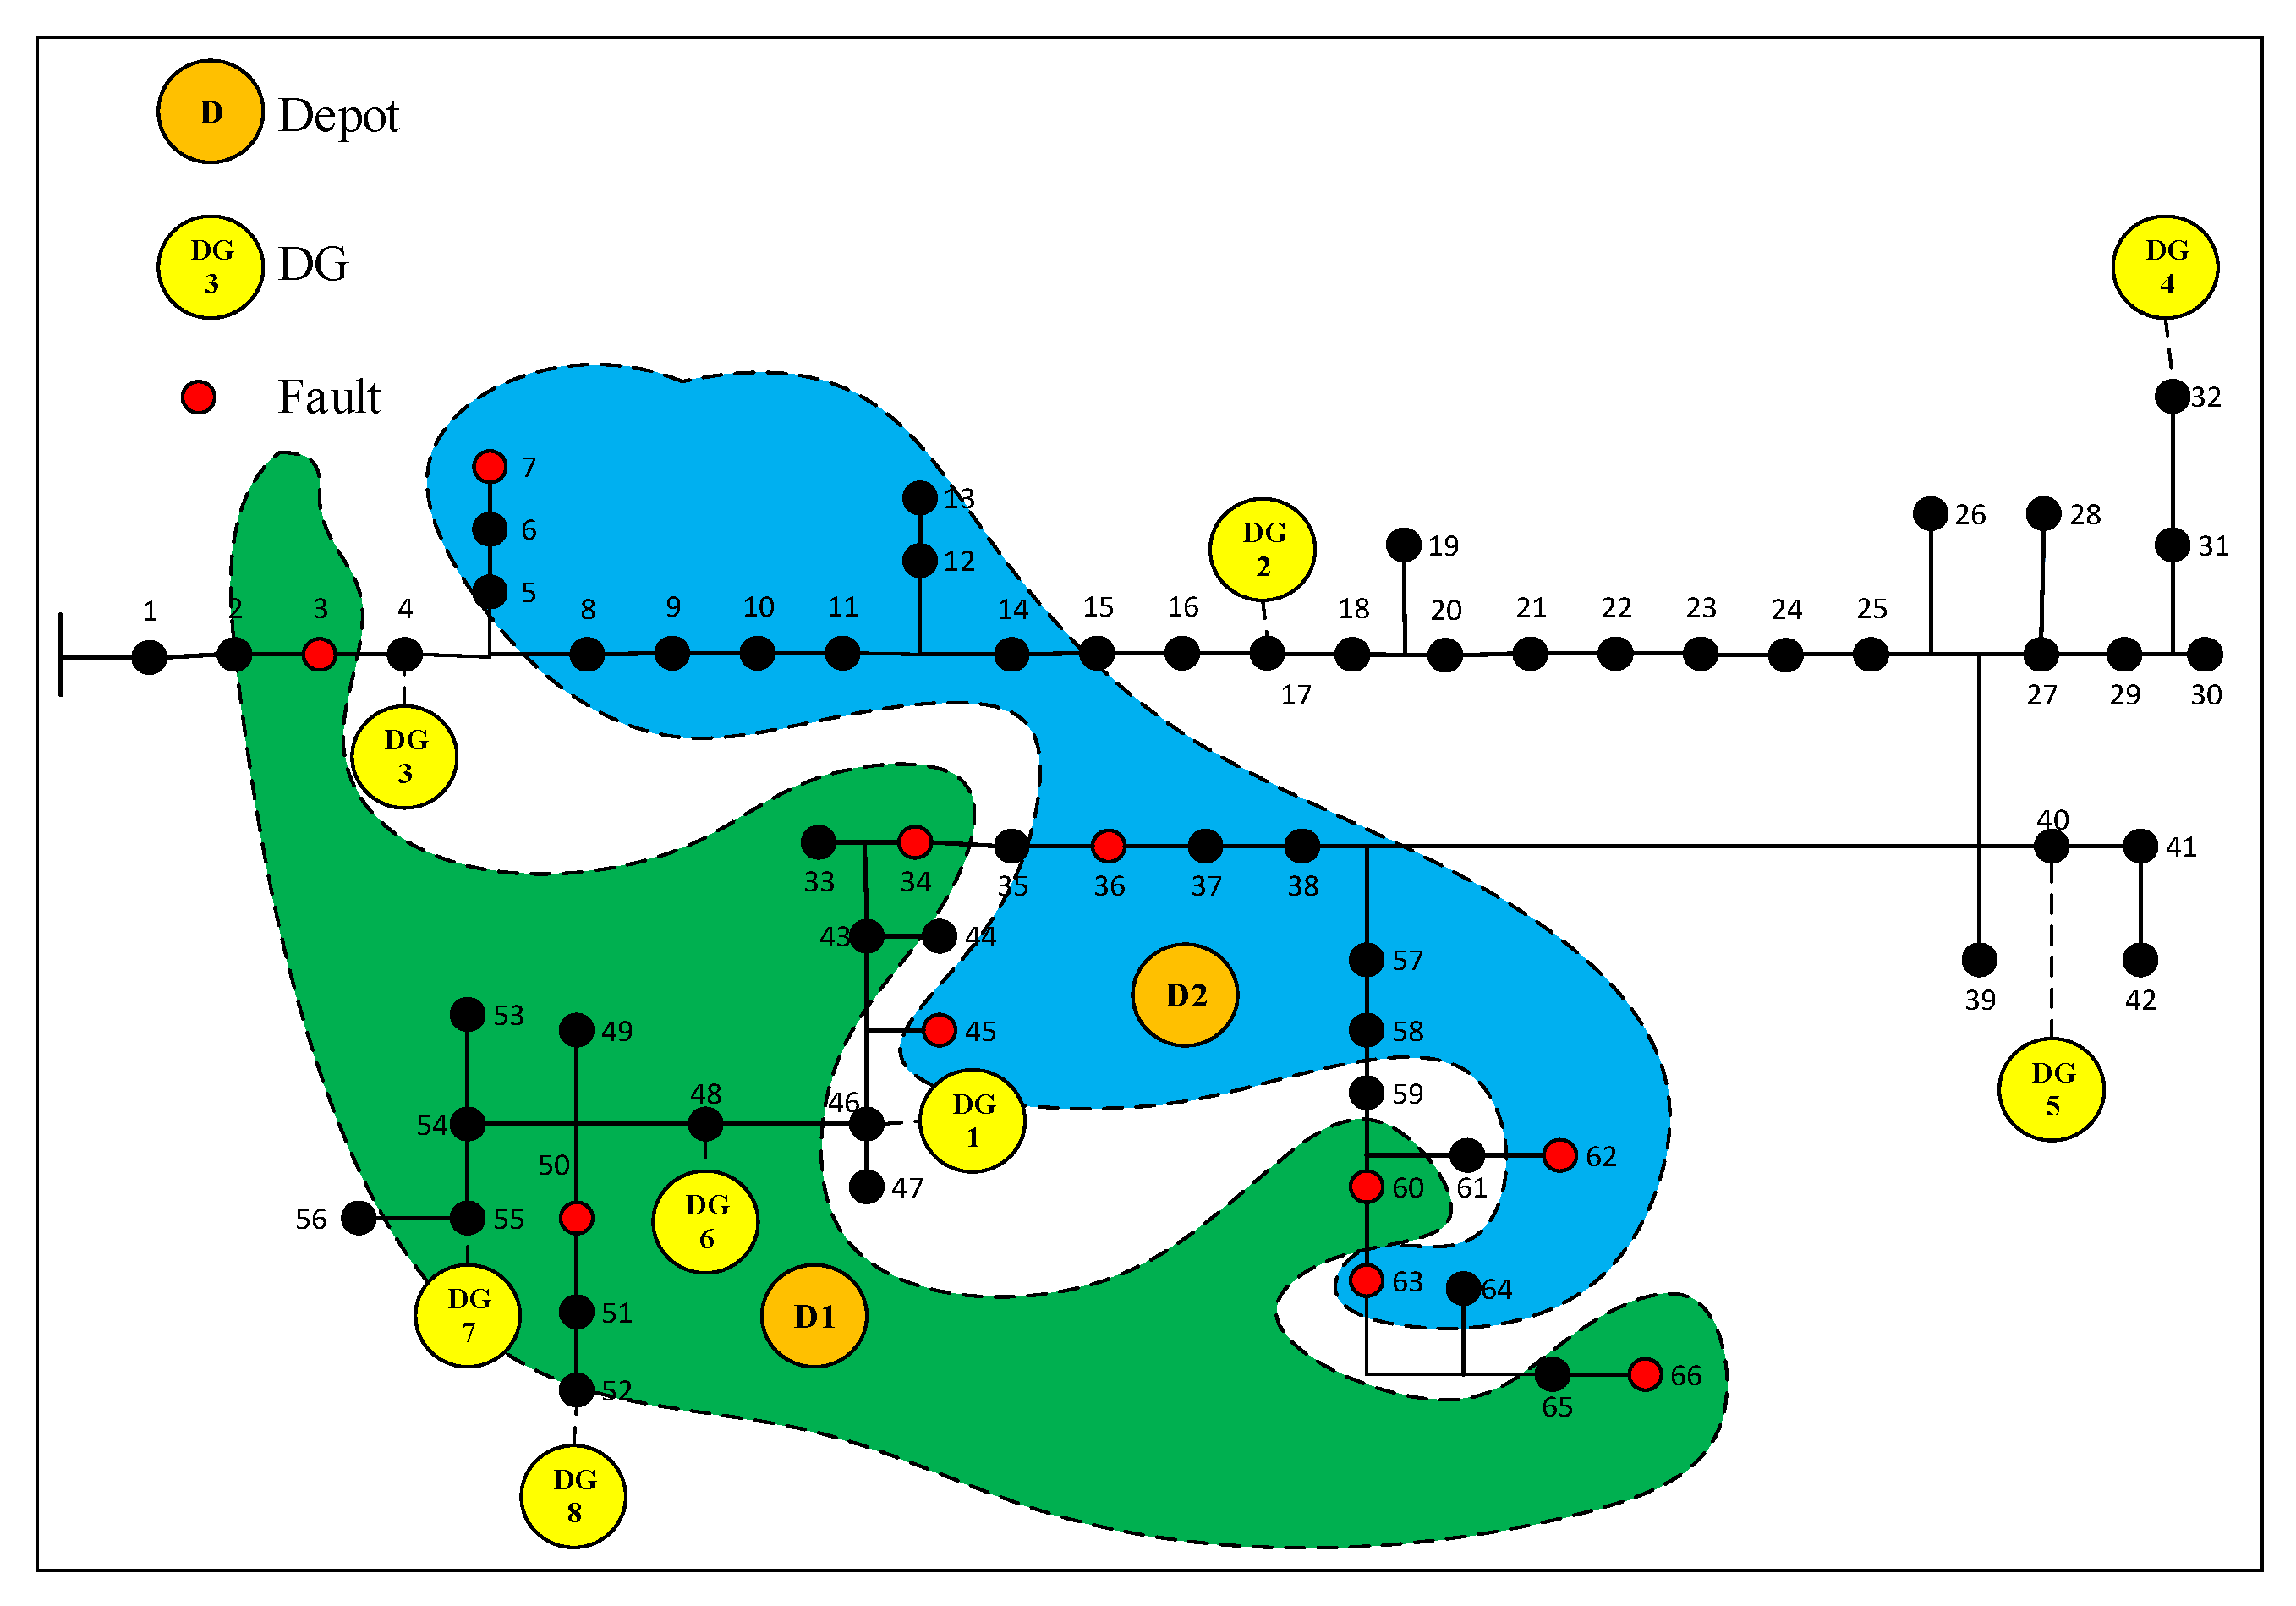
In this section, the proposed framework for outage management is implemented on the Iranian 66 bus power distribution feeder. The topology of the Iranian distribution feeder is shown in Figure 9. In Figure 9, two depots and ten faults are considered. Furthermore, eight DGs are provided in the power distribution feeder. The important parameters of the DGs are presented in Table 5.
The minimum and maximum of the penalty factor are considered for load shading programs like the first case study. The indexes of public hazard for Outages 2 and 7 are assumed to be 2 and for other outages are considered to be 1. The resources and time to repair the outages are listed in Table 6. The capacity of Crews 1, 2, 3 and 4 to carry the resources are assumed to be 30, 40, 30 and 30, respectively. The total maximum capacity of the demand response in each demand response bus and the step cost of the EDRP are assumed to be similar to in the first case. The maximum travel time between damaged component (outages) is considered to be 2.6 (step time).
In this case study, the bus numbers and outages are high, and the first-stage optimization is important. The results of the outage clustering are shown in Figure 10.
According to Figure 9, the outages are clustered into two groups. Groups 1 and 2 are shown by green and blue, respectively. The important target of this stage is clustering the nearest outage to the depot. This target is considered besides the resources and expertise limitations of the crews. The results of the first stage are provided to the second stage to solve the S O M S D G s D R P s problem.
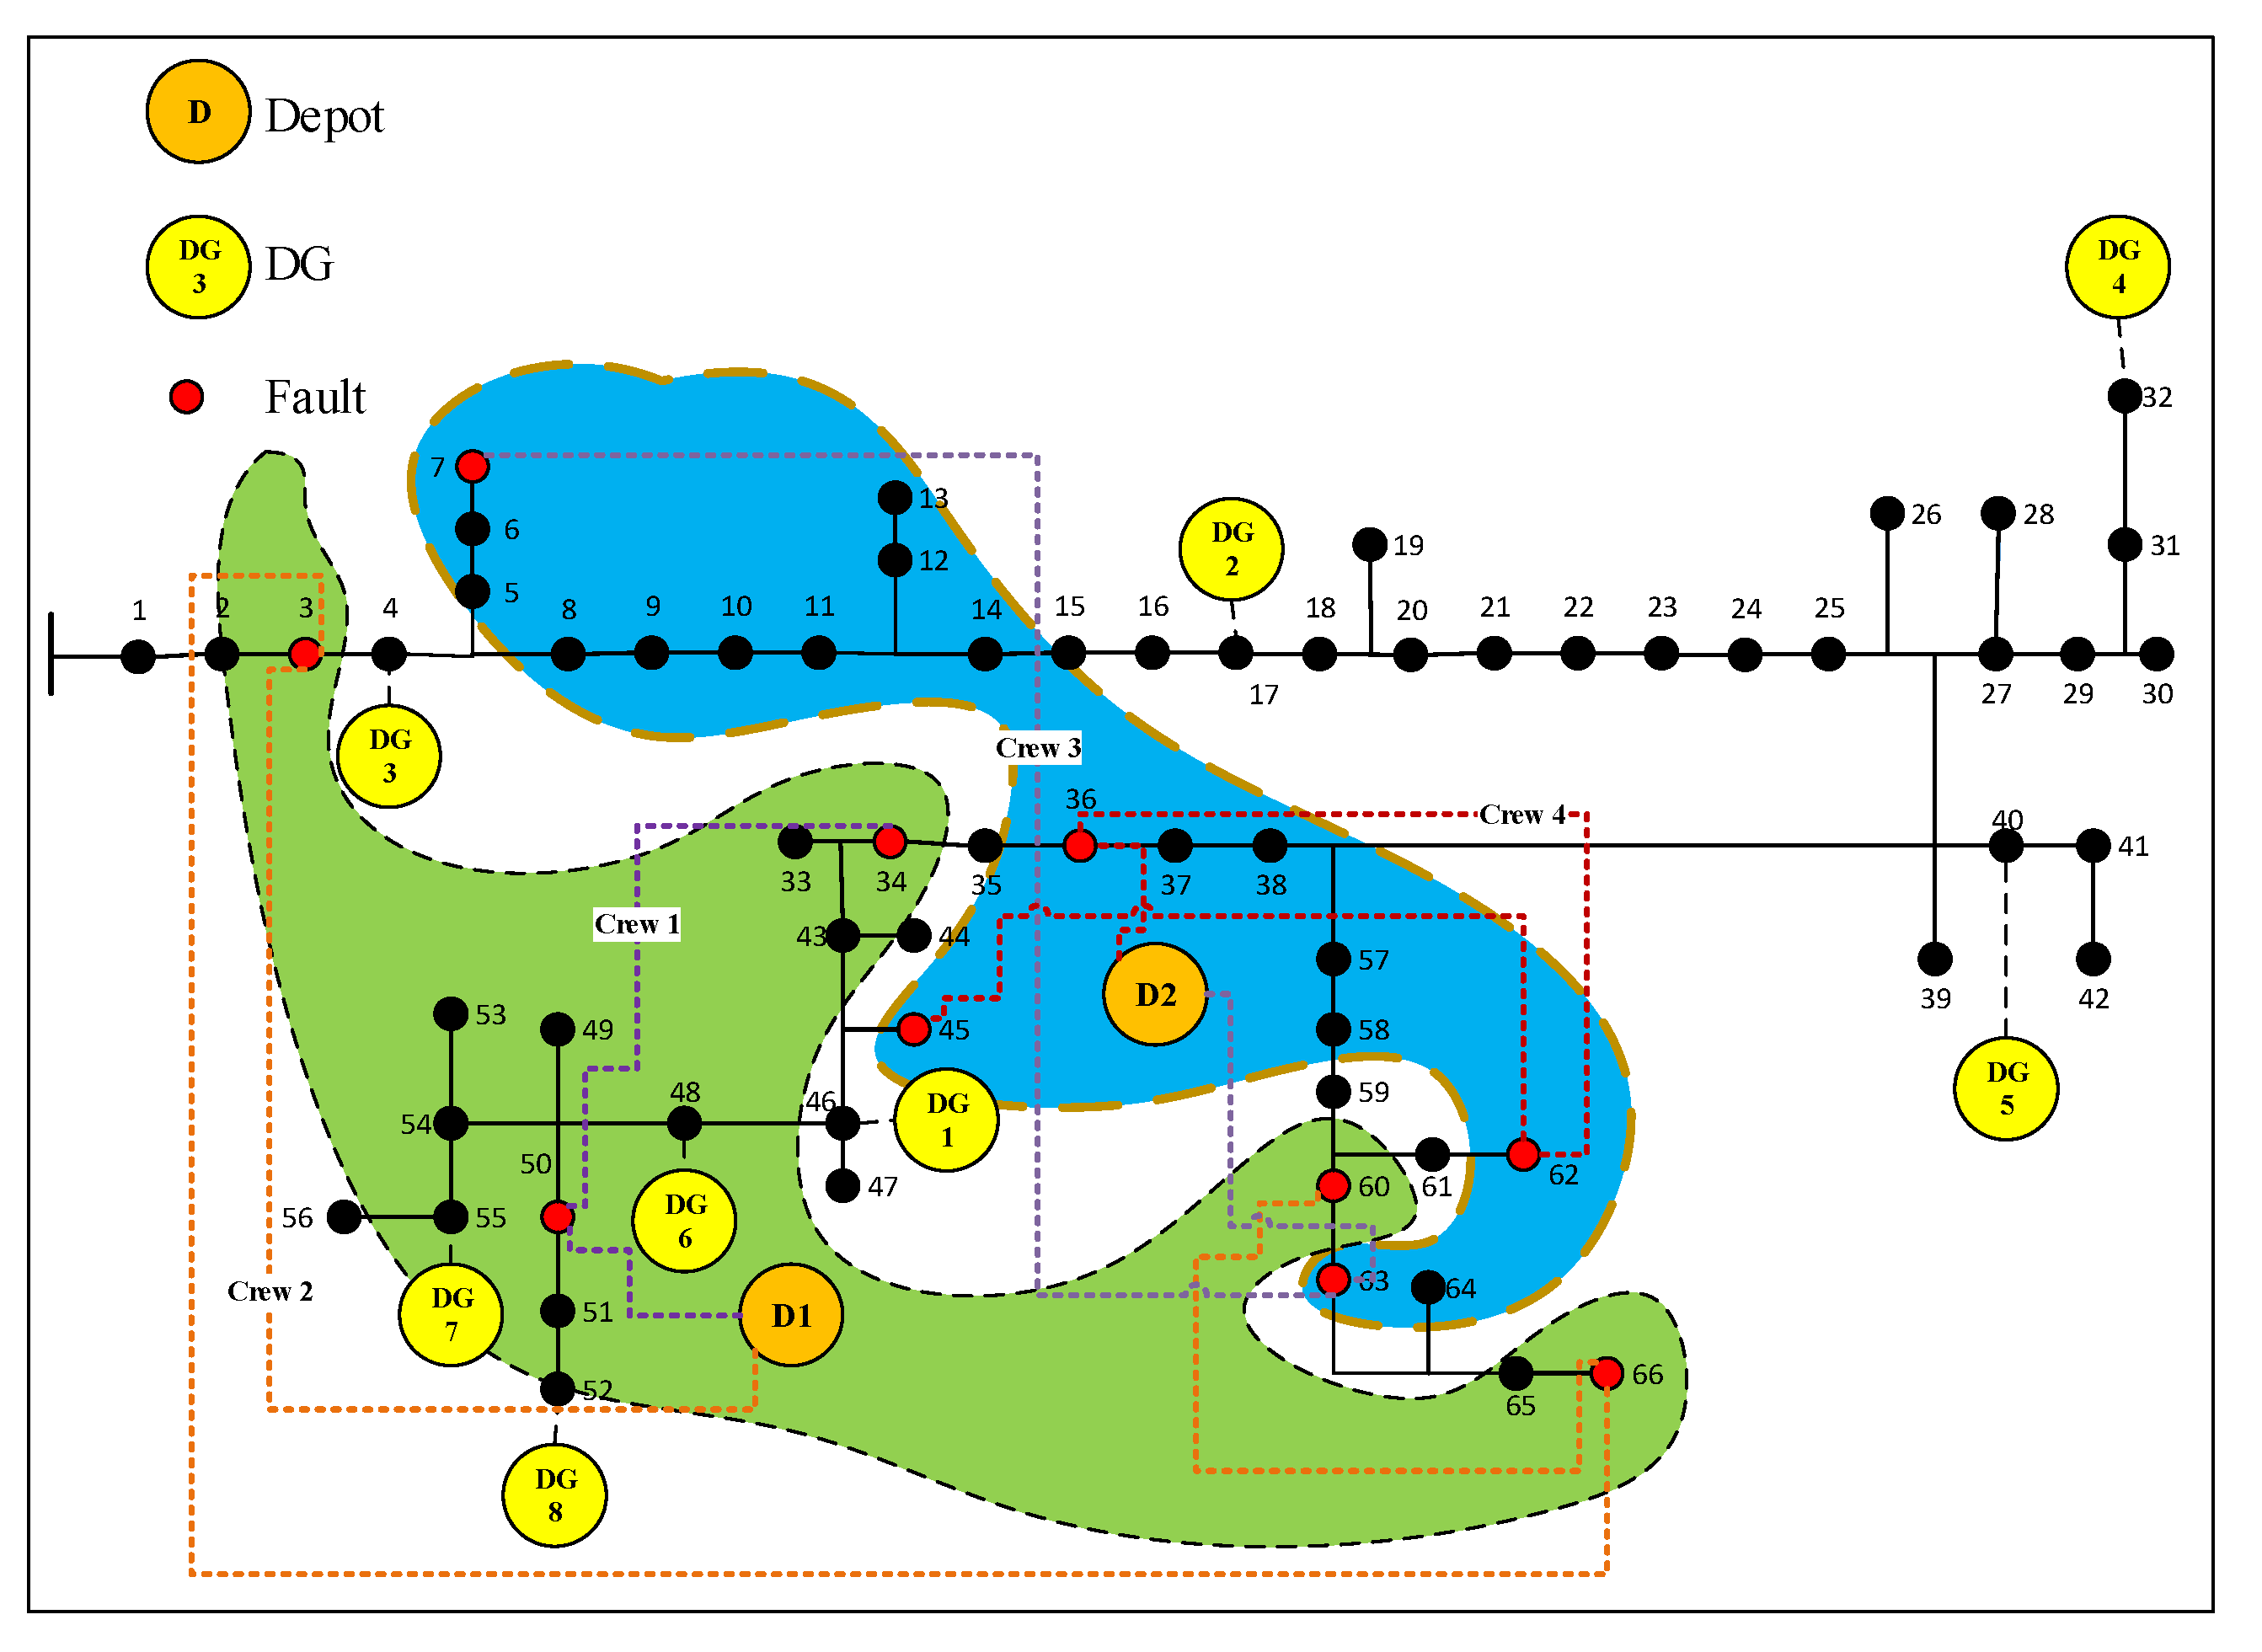
In the first stage, the S O M S D G s D R P s optimization problem is solved to minimize the RRC time, DG cost, load shedding cost and EDRP cost. Furthermore, each cluster of the Iranian distribution feeder (green and blue color) is related to one depot. In this case study, two crews are assumed in each depot and the outages in each cluster should be repaired by crews of the targeted depot. The results of the RRC problem are shown in Figure 11.
According to Figure 10, each fault is assigned to only one crew. The optimal dispatch of the tasks has been performed, and the outages in bus 50 and 34 are assigned to Crew 1. Additionally, the outage in buses 3, 60 and 66 are referred to Crew 2. Furthermore, Crews 3 and 4 should repair the outage in buses 7, 36, 45, 62 and 63. The priority of the faults for repairing is determined by the public hazard value of the fault, the fault location, the number of loads that are affected by the fault, the crew expertise and other parameters and indexes.
As mentioned in the above case study, the optimal number of resources that is assigned to each crew is important in the distribution system. Furthermore, assigning numerous resources to the crews is not a good strategy and causes the optimal crew performance to decrease. Therefore, the optimal number of resources to assign to each crew is shown in Figure 12.
One of the important outputs of the model is the priority list of the outages for repair by crews. The priority list of the outages is listed in Table 7.
Referring the Table 4, crews can’t repair any outage in the first step time (This is shown by “*” in the first row of Table 4).
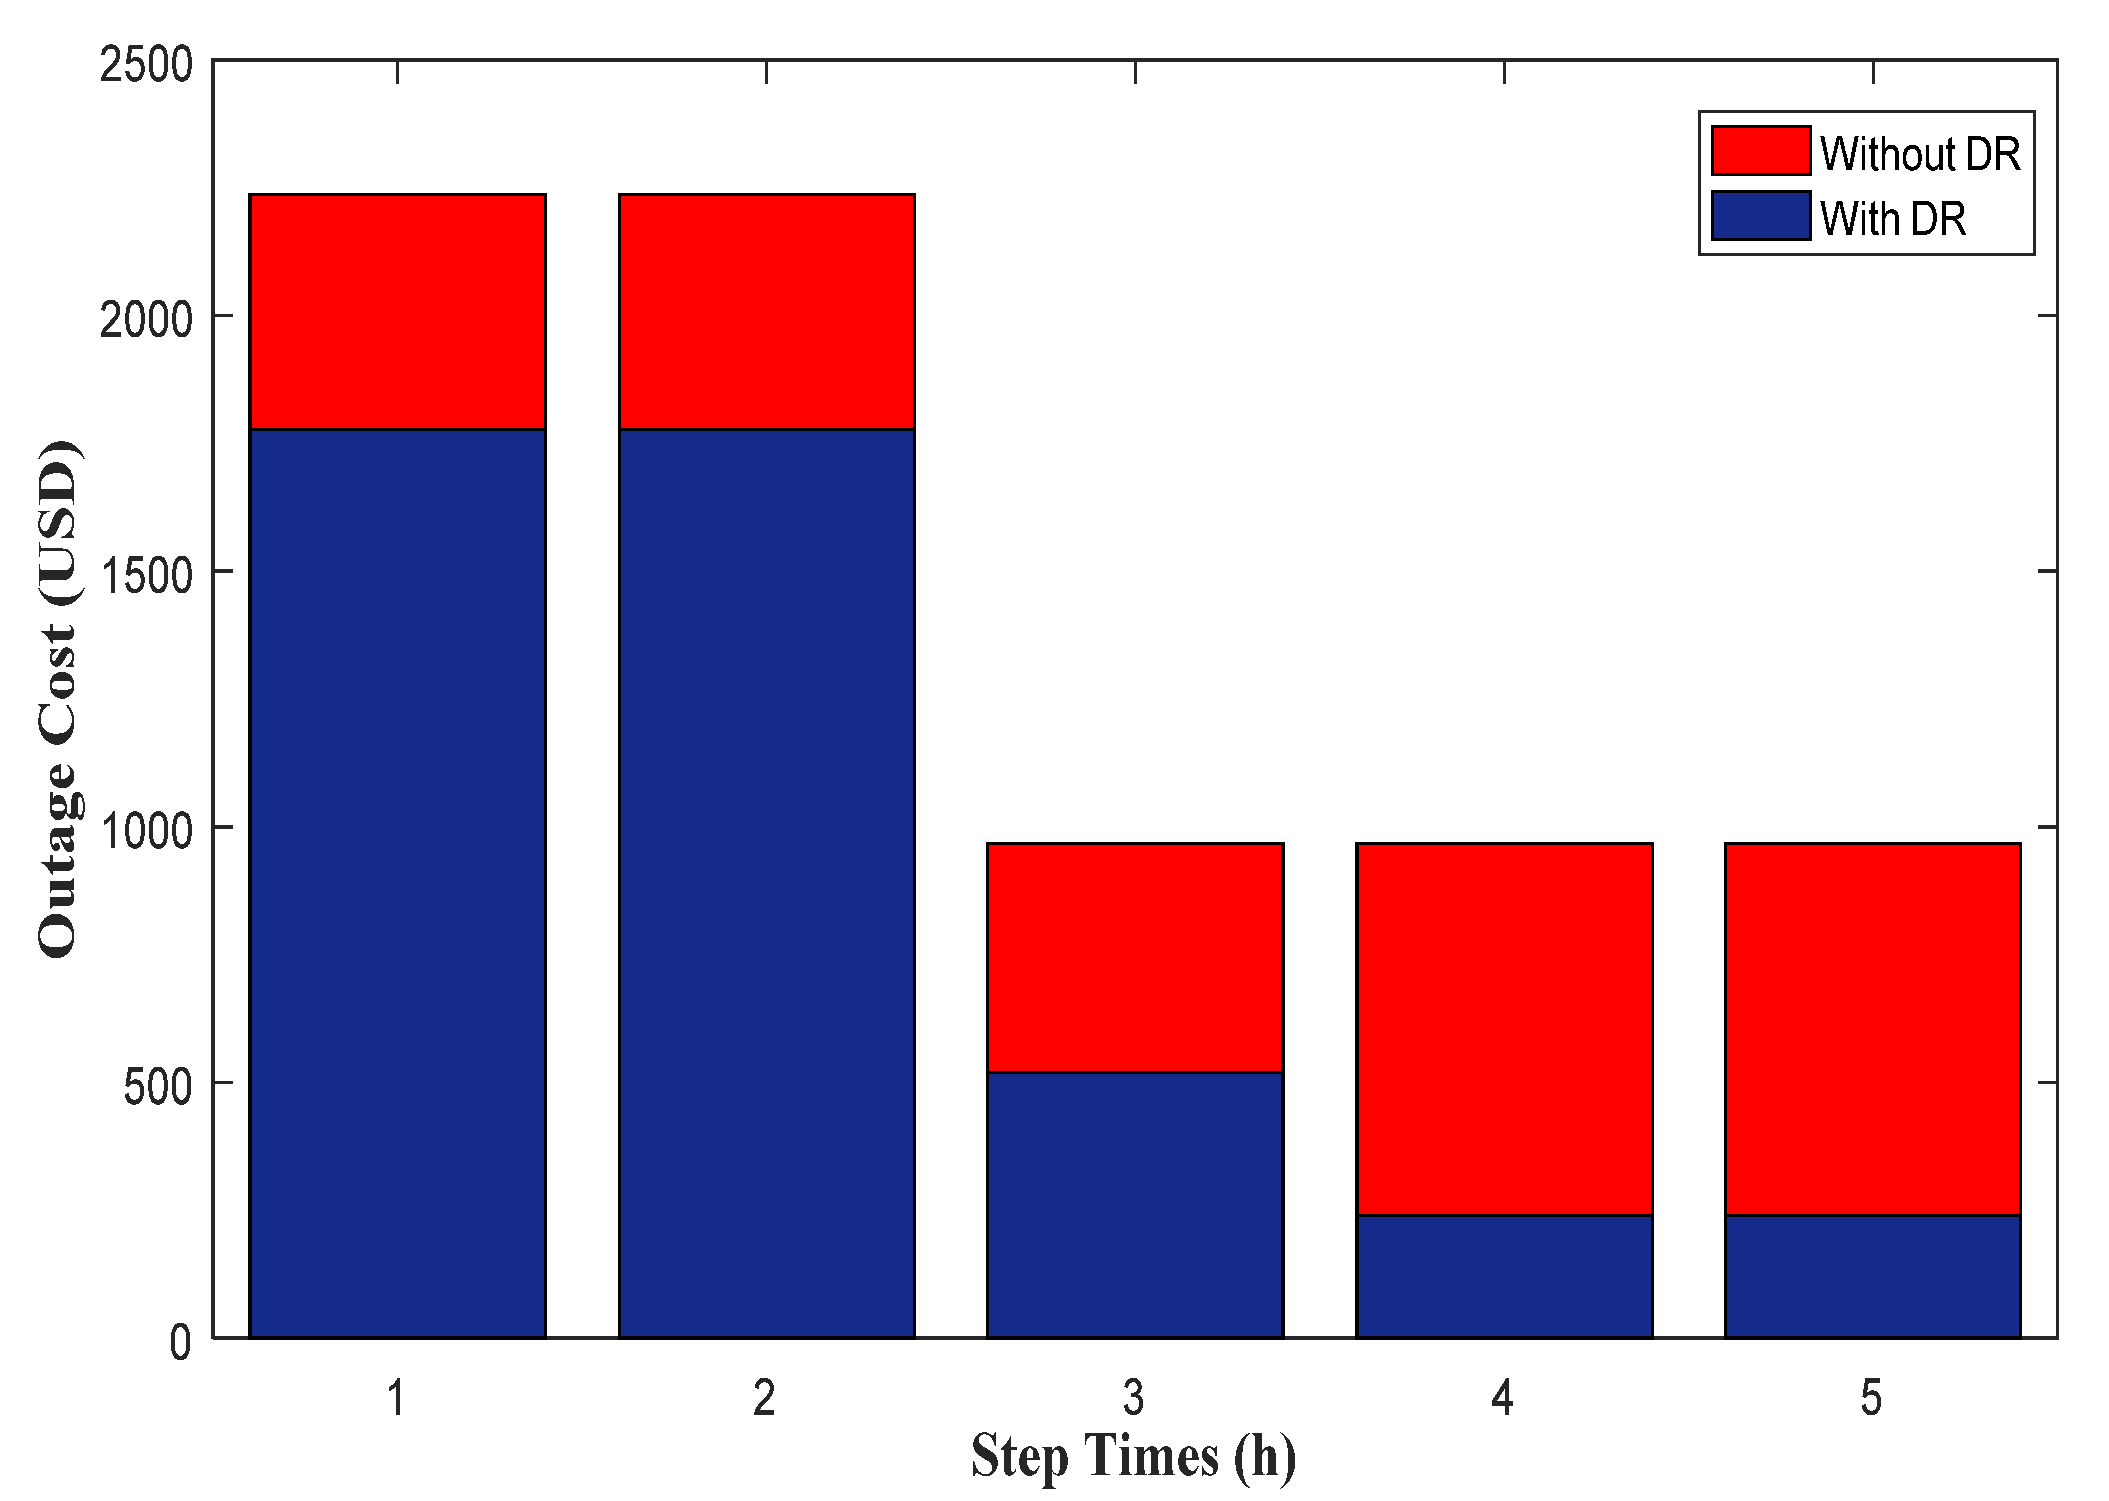
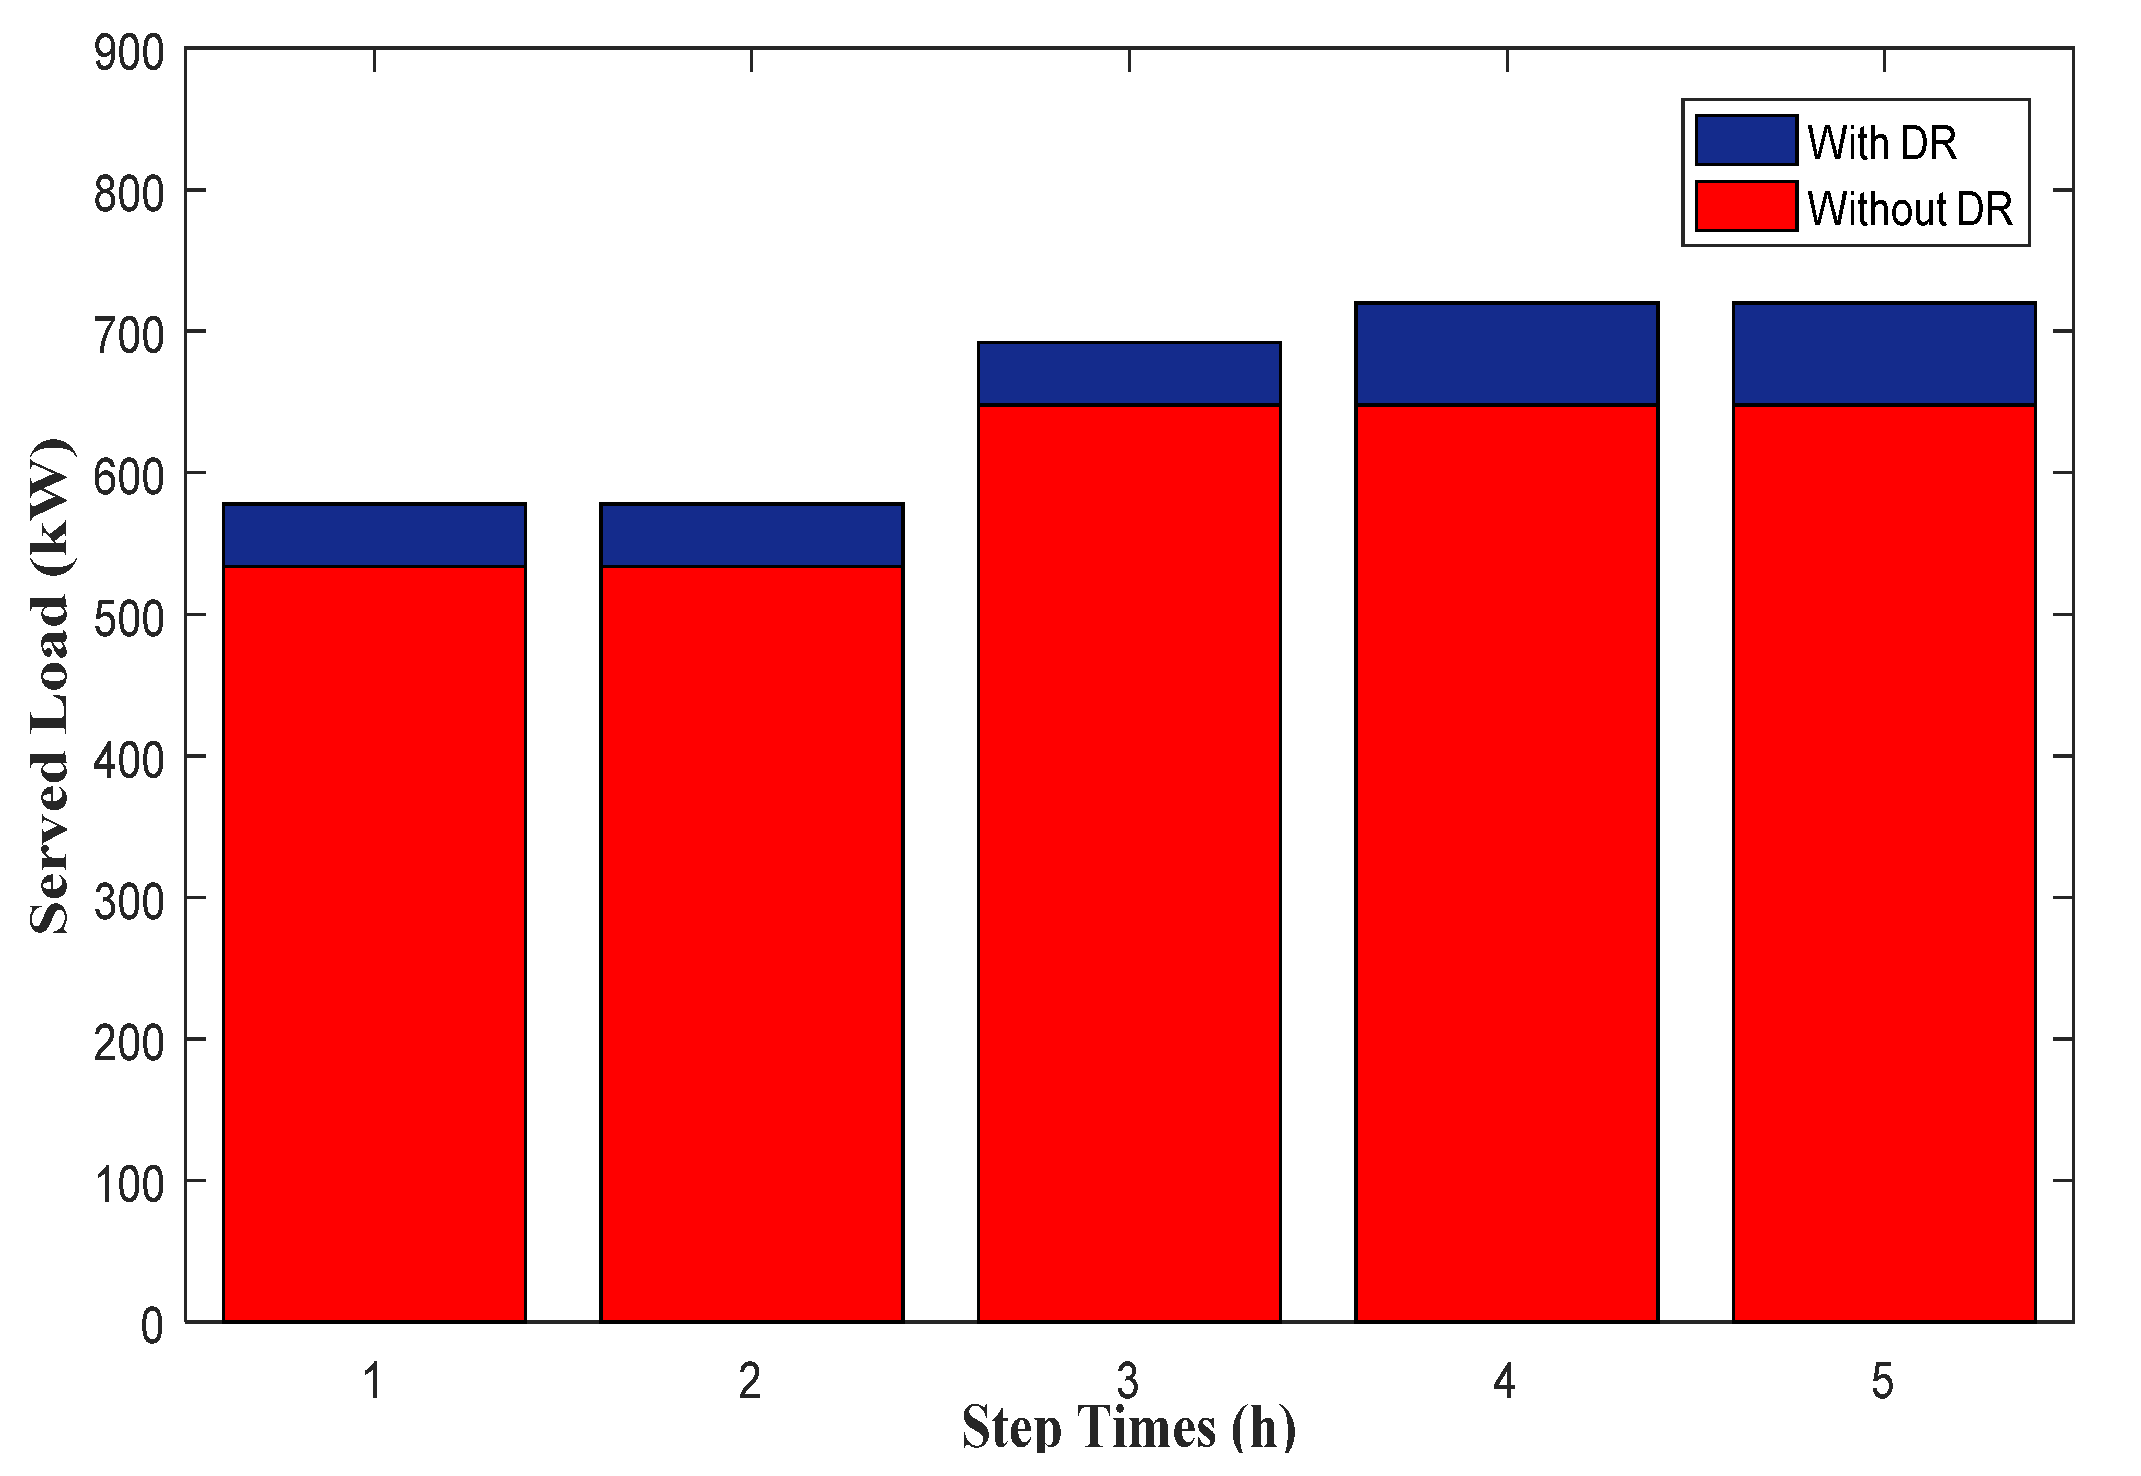
As mentioned above, the DSO should pay the penalty price to customers affected by the outage. Furthermore, in this paper, the EDRP solution has been suggested to reduce the outage cost of the load shading program and forced outage loads from faults. This suggestion is tested in the outage management framework. Consequently, in a crisis time, optimal outage management causes a decrease in the outage cost of the power system. The effects of the EDRP on the decrease in the outage cost are shown in Figure 13. In each time step, the outages are repaired and the outage cost and the served load value are affected. The served load in each time step is shown in Figure 14.
According to Figure 13 and Figure 14, the served load is increased, and consequently, the outage cost is reduced in each step time. Furthermore, the outage cost is decreased impressively in the demand response scenario compared to without the demand response program scenario. Referring to Figure 14, it can be said that the EDRP causes an increase in the social welfare of the customers by increasing the served load value.

6. Conclusions

In this paper, a new smart outage management system denoted by S O M S D G s E D R P s is provided. The EDRPs and the DGs are considered in the proposed framework to optimize the operation of the outage management system. In the first stage of the proposed framework, the clustering method is used to cluster the outages. In the second stage, the multi-objective function is provided to optimize the RRC time, the outage cost and the EDRP cost. Two case studies were used to show the efficiency of the proposed framework: the IEEE 34 bus test system and an actual Iranian 66 bus power distribution feeder. The results show that the outage clustering method is an effective solution for clustering the outage into each depot. Furthermore, the processing time is a very important parameter in a crisis time, and also, the outage clustering in the first stage causes a decrease in the optimization time. Additionally, the results show that the optimal operation of the crews (the output of the model) decreases the outage cost and increases the served load in each time interval. Furthermore, it can be concluded that the EDRP is a very effective program for decreasing the outage cost of the distribution system. Additionally, the EDRP is a useful problem for increasing the served load, and consequently, social welfare is increased. One of the important outputs of the proposed framework is the priority list of the outages for repair by crews. The priority of the outages is dependent on various factors such as the distance, needed resources and public hazard. Furthermore, the results show that the location of the outage is a very important feature for prioritization by the proposed framework to clear. In this regard, the importance of the outage location, which causes the highest impact on customers, is more than that of others. Additionally, the results show that the location of the load point demand response contracts plays an important role in the proposed outage management system. Therefore, EDRP contract allocation based on the probability of a crisis occurring in a location is an interesting topic for future research in the smart outage management system research field.

Author Contributions

Conceptualization, S.D., R.D. and H.R.S.; Methodology, S.D.; Supervision, R.D. and H.R.S.; Validation, R.D.; Visualization, S.D.; Writing—original draft, S.D.; Writing—review & editing, R.D. and H.R.S. All authors have read and agreed to the published version of the manuscript.

Funding

This research received no external funding.

Conflicts of Interest

The authors declare no conflict of interest.

Nomenclature

Acronyms
EDRPEmergency Demand Response Program
DGDistributed Generation
MILPMixed Integer Linear Programming
DSODistribution System Operator
MGsMicro Grids
RRCsRouting Repair Crews
Set and Indexes
σ Index of each depot
m / n Index of an outage and damaged component
b Index of bus
t Index of time
N b Number of buses
N t Number of times
Parameters
R E S P ( σ ) Existing equipment in each depot
R e s N ( m ) Required component for repairing outage m
a 1 , a 2 , a 3 , a 4 Cost function coefficients
d ( d e p σ , m ) The distance between outage and depot
P d ( b , t ) Load of bus b in time t
P e n ( b ) Penalty factor (USD/kW)
H m Public hazard index
T D ( σ , m ) The binary parameter that shows the ability of each crew to repair the outage m
S u s ( b , b p ) Susceptance of lines
P L i n e m a x Maximum power flow in lines
P D G m a x Maximum power of each DG
n c ( σ ) Number of crews in depot σ
C A P ( c ) The crew vehicle capacity
r ( m , c ) Repair time for outage m
t r ( m , n , c ) Traveling time between outage m and n
Variables
P D G ( i , t ) Power of DG i in time t
s ( σ , m ) A binary variable that shows the clustering of the outages
δ ( b , t ) The angle of the bus
u ( m , t ) Status of lines and DGs
Z ( m , t ) Availability of damaged component m
x ( m , n , c , σ ) The binary variable showing when crew c moves from outage m to n
y ( m , c , σ ) The binary variable showing when the crew c visits the outage m
R E C c ( c ) Number of pieces of equipment assigned to crew c
A T ( m , c ) Arrival time of crew c at outage m
q ( b , t ) A binary variable that shows the status of each load bus
f ( m , t ) Indicates the time that outage m is repaired

References

  1. Honarmand, M.E.; Ghazizadeh, M.S.; Hosseinnezhad, V.; Siano, P. Reliability modeling of process-oriented smart monitoring in the distribution systems. Int. J. Electr. Power Energy Syst. 2019, 109, 20–28. [Google Scholar] [CrossRef]
  2. Xie, K.; Zhang, H.; Singh, C. Reliability forecasting models for electrical distribution systems considering component failures and planned outages. Int. J. Electr. Power Energy Syst. 2016, 79, 228–234. [Google Scholar] [CrossRef]
  3. Wang, Z.; Wang, J. Self-Healing Resilient Distribution Systems Based on Sectionalization into Microgrids. IEEE Trans. Power Syst. 2015, 30, 3139–3149. [Google Scholar] [CrossRef]
  4. Imani, M.H.; Niknejad, P.; Barzegaran, M. The impact of customers’ participation level and various incentive values on implementing emergency demand response program in microgrid operation. Int. J. Electr. Power Energy Syst. 2018, 96, 114–125. [Google Scholar] [CrossRef]
  5. Eissa, M.M. New protection principle for smart grid with renewable energy sources integration using WiMAX centralized scheduling technology. Int. J. Electr. Power Energy Syst. 2018, 97, 372–384. [Google Scholar] [CrossRef]
  6. Dorahaki, S.; Dashti, R.; Shaker, H.R. Optimal energy management in the smart microgrid considering the electrical energy storage system and the demand-side energy efficiency program. J. Energy Storage 2020, 28, 101229. [Google Scholar] [CrossRef]
  7. Dorahaki, S.; Rashidinejad, M.; Mollahassani-Pour, M.; Bakhshai, A. An efficient hybrid structure to solve economic-environmental energy scheduling integrated with demand side management programs. Electr. Eng. 2019, 101, 1249–1260. [Google Scholar] [CrossRef]
  8. Arif, A.; Wang, Z.; Wang, J.; Chen, C. Power Distribution System Outage Management with Co-Optimization of Repairs, Reconfiguration, and DG Dispatch. IEEE Trans. Smart Grid 2017, 9, 4109–4118. [Google Scholar] [CrossRef]
  9. Kumar, G.; Pindoriya, N.M. Outage management system for power distribution network. In Proceedings of the 2014 International Conference on Smart Electric Grid (ISEG), Guntur, India, 19–20 September 2014; pp. 1–8. [Google Scholar] [CrossRef]
  10. Farzin, H.; Fotuhi-Firuzabad, M.; Moeini-Aghtaie, M. Role of Outage Management Strategy in Reliability Performance of Multi-Microgrid Distribution Systems. IEEE Trans. Power Syst. 2017, 33, 2359–2369. [Google Scholar] [CrossRef]
  11. Farzin, H.; Fotuhi-Firuzabad, M.; Moeini-Aghtaie, M. Enhancing Power System Resilience through Hierarchical Outage Management in Multi-Microgrids. IEEE Trans. Smart Grid 2016, 7, 2869–2879. [Google Scholar] [CrossRef]
  12. Figueroa-Candia, M.; Felder, F.A.; Coit, D.W. Resiliency-based optimization of restoration policies for electric power distribution systems. Electr. Power Syst. Res. 2018, 161, 188–198. [Google Scholar] [CrossRef] [Green Version]
  13. Perez-Guerrero, R.; Heydt, G.T.; Jack, N.J.; Keel, B.K.; Castelhano, A.R. Optimal Restoration of Distribution Systems Using Dynamic Programming. IEEE Trans. Power Deliv. 2008, 23, 1589–1596. [Google Scholar] [CrossRef]
  14. Solanki, J.M.; Khushalani, S.; Schulz, N.N. A Multi-Agent Solution to Distribution Systems Restoration. IEEE Trans. Power Syst. 2007, 22, 1026–1034. [Google Scholar] [CrossRef]
  15. Wang, Y.; Huang, Y.; Wang, Y.; Zeng, M.; Li, F.; Wang, Y.; Zhang, Y. Energy management of smart micro-grid with response loads and distributed generation considering demand response. J. Clean. Prod. 2018, 197, 1069–1083. [Google Scholar] [CrossRef]
  16. Aghaei, J.; Alizadeh, M.-I.; Siano, P.; Heidari, A. Contribution of emergency demand response programs in power system reliability. Energy 2016, 103, 688–696. [Google Scholar] [CrossRef]
  17. Tabandeh, A.; Abdollahi, A.; Rashidinejad, M. Reliability constrained congestion management with uncertain negawatt demand response firms considering repairable advanced metering infrastructures. Energy 2016, 104, 213–228. [Google Scholar] [CrossRef]
  18. Wang, Z.; Chen, B.; Wang, J.; Chen, C. Networked Microgrids for Self-Healing Power Systems. IEEE Trans. Smart Grid 2016, 7, 310–319. [Google Scholar] [CrossRef]
  19. Arab, A.; Khodaei, A.; Han, Z.; Khator, S.K. Proactive Recovery of Electric Power Assets for Resiliency Enhancement. IEEE Access 2015, 3, 99–109. [Google Scholar] [CrossRef]
  20. Russell Bent, C.C.; van Hentenryck, P. Vehicle routing for the last mile of power system restoration. In Proceedings of the 17th Power Systems Computation Conference, Stockholm, Sweden, 22 August 2011. [Google Scholar]
  21. Laporte, G. Fifty Years of Vehicle Routing. Transp. Sci. 2009, 43, 408–416. [Google Scholar] [CrossRef]
  22. Arif, A.; Ma, S.; Wang, Z.; Wang, J.; Ryan, S.M.; Chen, C. Optimizing Service Restoration in Distribution Systems with Uncertain Repair Time and Demand. IEEE Trans. Power Syst. 2018, 33, 6828–6838. [Google Scholar] [CrossRef] [Green Version]
  23. GAMS Platform. General Algebraic Modeling System. Available online: http://www.gams.com/ (accessed on 20 October 2020).
Figure 1. The power distribution system with and without Emergency Demand Response Program (EDRP).
Applsci 10 07406 g001
Figure 2. The proposed structure of the system outage management.
Applsci 10 07406 g002
Figure 3. IEEE 34 bus test system.
Applsci 10 07406 g003
Figure 4. IEEE 34 bus Routing Repair Crew (RRC) schedule.
Applsci 10 07406 g004
Figure 5. Sensitivity analysis on IEEE 34 bus RRC schedule.
Applsci 10 07406 g005
Figure 6. The optimal number of resources is assigned to each crew in the 34 bus case.
Applsci 10 07406 g006
Figure 7. The effect of EDRP on the outage cost in the 34 bus case.
Applsci 10 07406 g007
Figure 8. The effect of EDRP on the served load in the 34 bus case.
Applsci 10 07406 g008
Figure 9. Iranian 66 bus power distribution feeder.
Applsci 10 07406 g009
Figure 10. Outage clustering in Iranian 66 bus power distribution feeder.
Applsci 10 07406 g010
Figure 11. RRC schedule for Iranian 66 bus power distribution feeder.
Applsci 10 07406 g011
Figure 12. The optimal number of resources is assigned to each crew in the 66 bus case.
Applsci 10 07406 g012
Figure 13. The effect of the EDRP on the outage cost in the 66 bus case.
Applsci 10 07406 g013
Figure 14. The effect of the EDRP on the served load in the 66 bus case.
Applsci 10 07406 g014
Table 1. Parameters of DG.
DGsMin (kW)Max (kW)Operation Cost for DGs per kW (USD/kW)
DG 102005
DG 202107
DG 301208
DG 402209
Table 2. Needed resources and time for damage.
DamageRepair Time (30 min Step)Needed Resources
Crew 1Crew 2Crew 3Crew 4
M 12.51.21.11.110
M 232.32.12.28
M 31.71.41.529
M 412.11.216
M 521.211.38
M 61.32.12.1112
M 711.11.5210
Table 3. EDRP step cost.
StepDemand Response Price Block (USD/kW)
10
21
32
43
Table 4. The optimal priority list of the damaged components in the 34 bus case.
Step TimesDamaged Component
1*
2M4
3M1-M3
4M2-M5-M6
5M7
Table 5. Parameters of DGs.
DGsMin (kW)Max (kW)Operation Cost of DGs per kW (USD/kW)
DG 101004
DG 204003
DG 301005
DG 402004
DG 501006
DG 601009
DG 702006
DG 801003
Table 6. Needed resources and time for damage.
DamageRepair Time (30 min Step)Needed Resources
Crew 1Crew 2Crew 3Crew 4
M 12.51.21.11.110
M 232.32.12.28
M 31.71.41.529
M 412.11.216
M 521.211.38
M 61.32.12.1112
M711.11.5210
M 822.12.515
M 921.41.525
M1011.22.517
Table 7. The optimal priority list of the damaged components in the 66 bus case.
Step TimeDamaged Component
1*
2M4-M6-M9
3M1
4M8-M10
5M2-M3-M5-M7
Publisher’s Note: MDPI stays neutral with regard to jurisdictional claims in published maps and institutional affiliations.