Assessment of Hybrid Wind-Wave Energy Resource for the NW Coast of Iberian Peninsula in a Climate Change Context

 ,
, 
 ,
,  ,
,  ,
,  and
and 
Abstract
1. Introduction
2. Data and Methods
2.1. Wind Data
2.2. Wave Data
2.3. Methods
2.3.1. Wind Power Resource
2.3.2. Wave Power Resource
2.3.3. Assessment of Future Wind Energy Resource
2.3.4. Assessment of Future Wave Energy Resource
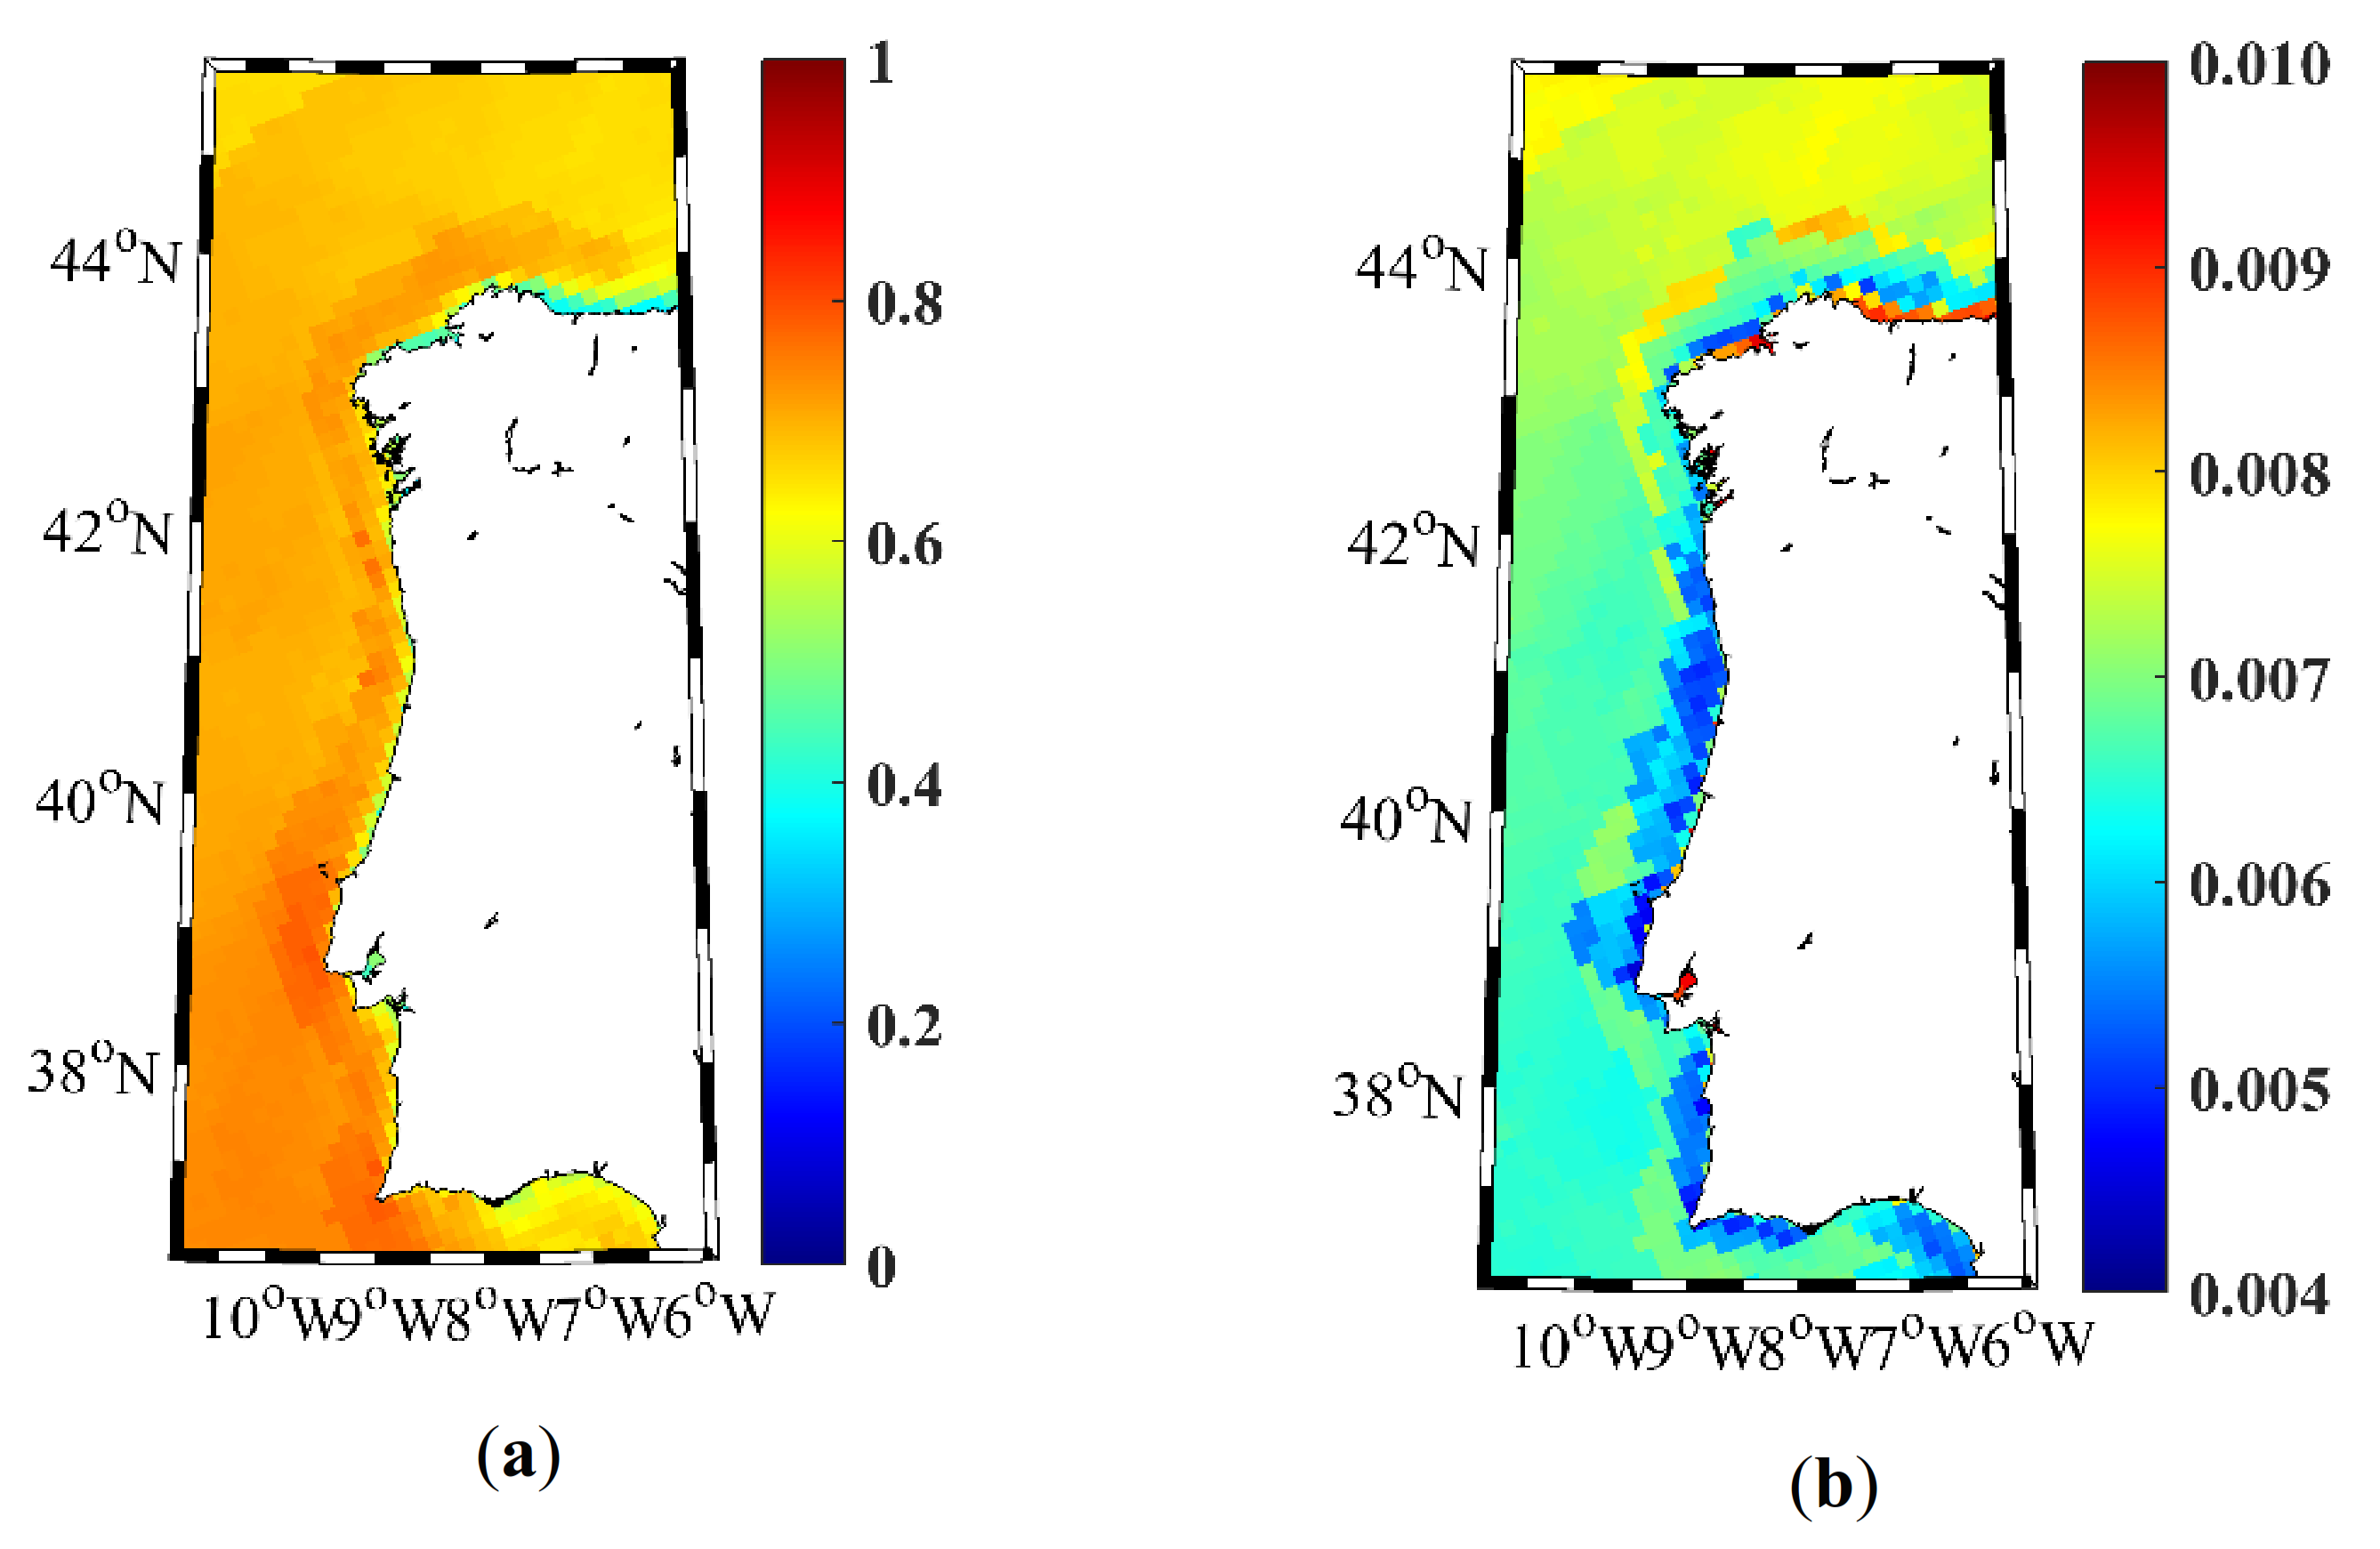
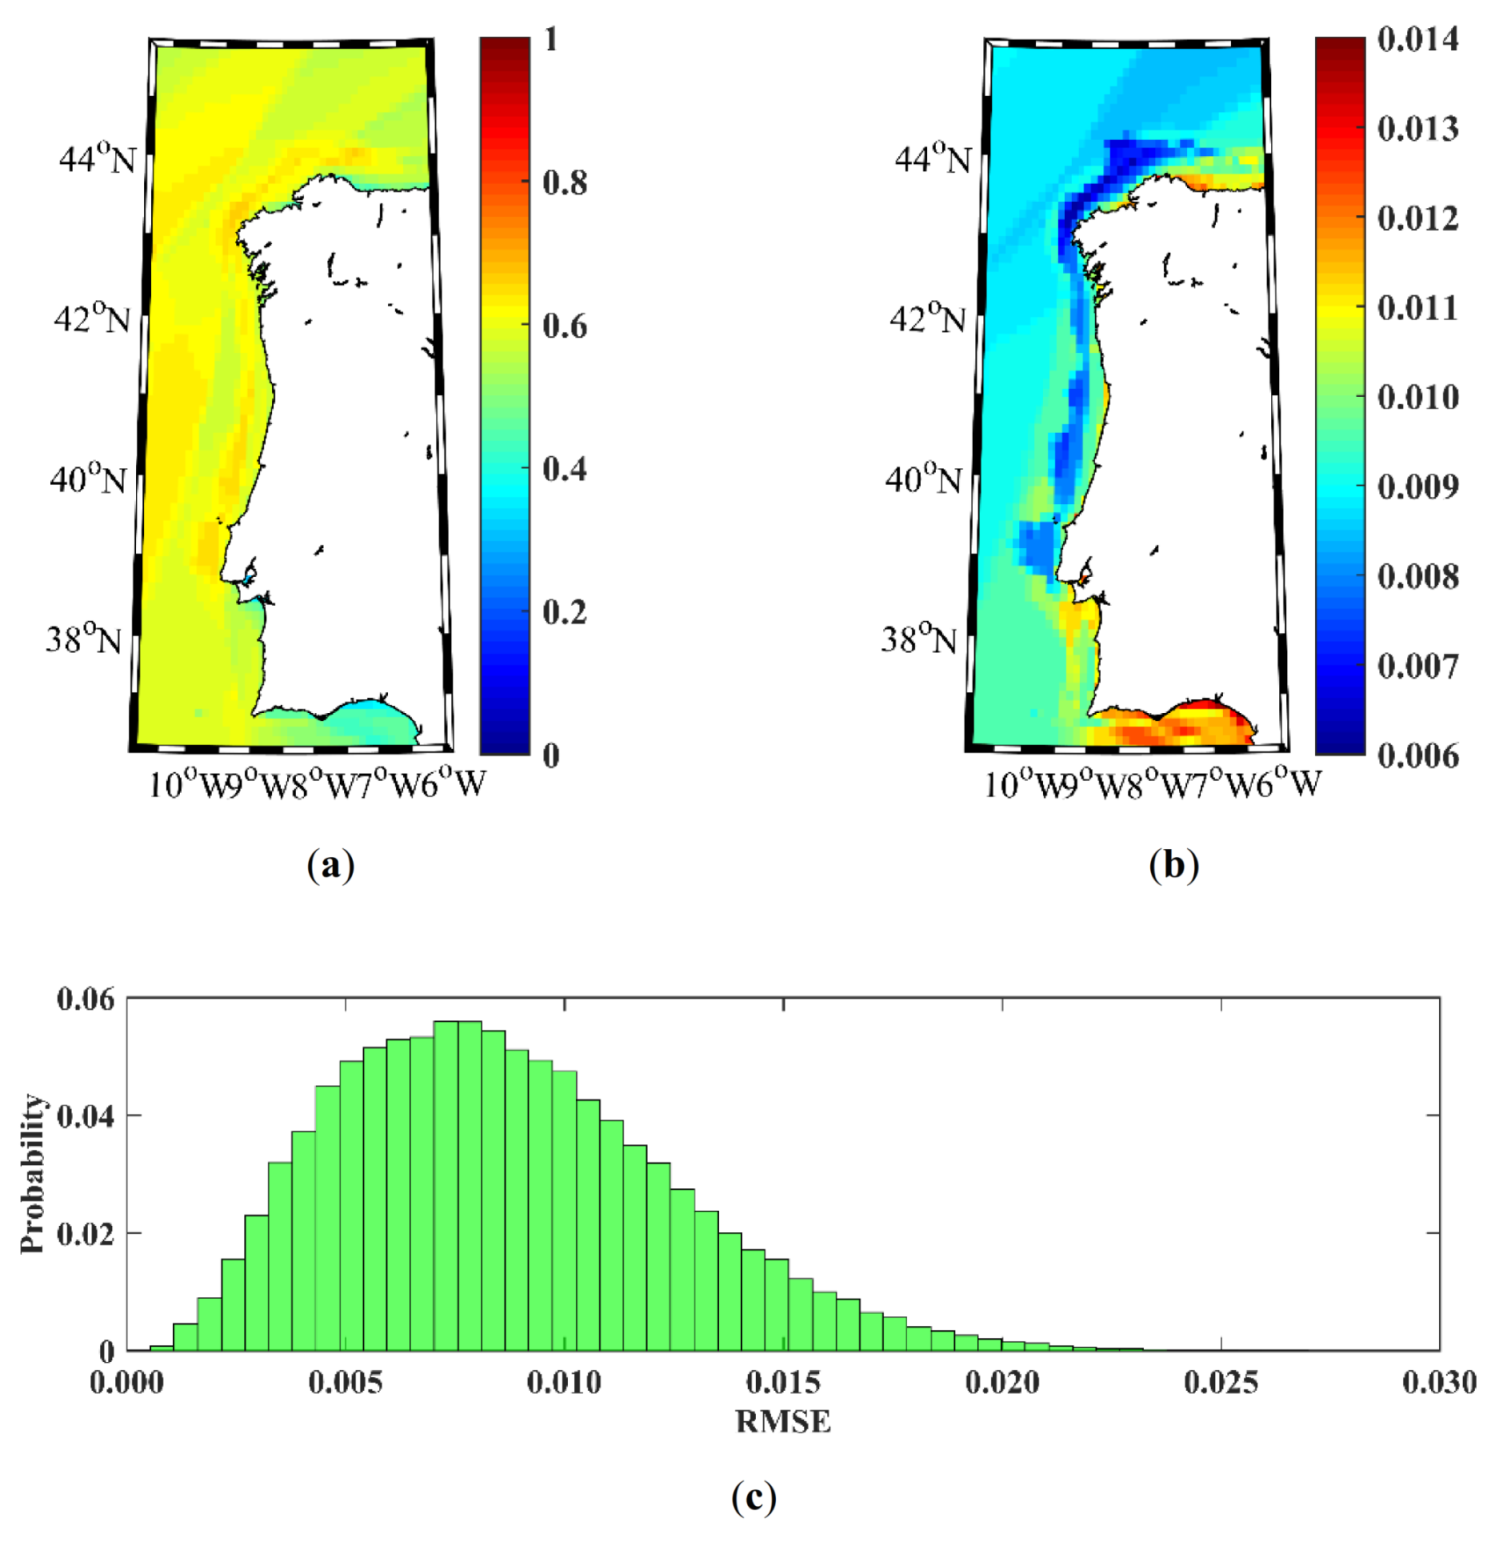
2.3.5. Sensitivity Test of the Energy Resource Parameters
- Renormalization. Before the random variation, weights were normalized in such a way that
- The classification indices were recalculated using the new weightswhere the subscript (j) refers to the different realizations of the Monte Carlo approach. In particular, j = 100,000 realizations will be considered in the present analysis.
- The RMSEk associated to each pixel was calculated between the reference index () and the different realizations, .
- In a similar way, the RMSEj associated to each realization was calculated aswhere Np is the number of pixels.
- The mean value of the classification index was calculated as the average of all realizations by using the following expression
3. Results and Discussion
4. Conclusions
Author Contributions
Funding
Conflicts of Interest
References
- United Nations—Climate Action. Available online: https://www.un.org/en/climatechange/ (accessed on 11 September 2020).
- European Comission. Regulation Of The European Parliament And Of The Council Establishing The Framework For Achieving Climate Neutrality And Amending Regulation (EU) 2018/1999 (European Climate Law); European Comission: Brussels, Belgium, 2020. [Google Scholar]
- ETIPOCEAN. Strategic Research and Innovation Agenda for Ocean Energy; Ocean Energy Europe: Brussels, Belgium, 2020. [Google Scholar]
- SET-Plan. Temporary Working Group Ocean Energy; European Comission: Brussels, Belgium, 2018. [Google Scholar]
- Ocean Energy Forum. Ocean Energy Strategic Roadmap: Building Ocean Energy for Europe; European Comission: Brussels, Belgium, 2016. [Google Scholar]
- Ocean Energy Systems. Annual Report: An overview of Ocean Energy Activities in 2019; Ocean Energy Systems: Lisbon, Portugal, 2020. [Google Scholar]
- Maisondieu, C.; Healy, M. The impact of the MARINET initiative on the development of Marine Renewable Energy. Int. J. Mar. Energy 2015, 12, 77–86. [Google Scholar] [CrossRef][Green Version]
- SET-Plan. Offshore Wind Implementation Plan. Available online: https://setis.ec.europa.eu/offshore-wind-implementation (accessed on 11 September 2020).
- Watson, S.; Moro, A.; Reis, V.; Baniotopoulos, C.; Barth, S.; Bartoli, G.; Bauer, F.; Boelman, E.; Bosse, D.; Cherubini, A.; et al. Future emerging technologies in the wind power sector: A European perspective. Renew. Sustain. Energy Rev. 2019, 113, 109270. [Google Scholar] [CrossRef]
- The European Offshore Wind Industry. Key Trends and Statistics. 2019. Available online: https://windeurope.org/about-wind/statistics/offshore/european-offshore-wind-industry-key-trends-statistics-2019/ (accessed on 11 September 2020).
- ETIPOCEAN. EU-Funded Ocean Energy Projects. Framework Programme 7 & Horizon2020; European Comission: Brussels, Belgium, 2018. [Google Scholar]
- SET-Plan. Ocean Energy-Implementation Plan. Available online: https://setis.ec.europa.eu/system/files/set_plan_ocean_implementation_plan.pdf (accessed on 11 September 2020).
- SET-Plan. Towards an Integrated Strategic Energy Technology (SET) Plan: Accelerating the European Energy System Transformation; European Comission: Brussels, Belgium, 2015. [Google Scholar]
- SET-Plan. Secretariat Initiative for Global Leadership in Offshore Wind; European Comission: Brussels, Belgium, 2015. [Google Scholar]
- Magagna, D.; Uihlein, A. 2014 JCR Ocean Energy Status Report; European Comission: Brussels, Belgium, 2014. [Google Scholar]
- International Renewable Energy Agency. Renewable Power Generation Costs in 2019; International Renewable Energy Agency: Abu Dhabi, UAE, 2020. [Google Scholar]
- Pérez-Collazo, C.; Greaves, D.; Iglesias, G. A review of combined wave and offshore wind energy. Renew. Sustain. Energy Rev. 2015, 42, 141–153. [Google Scholar] [CrossRef]
- Astariz, S.; Vazquez, A.; Iglesias, G. Evaluation and comparison of the levelized cost of tidal, wave, and offshore wind energy. J. Renew. Sustain. Energy 2015, 7, 053112. [Google Scholar] [CrossRef]
- Zanopol, A.T.; Onea, F.; Rusu, E. Evaluation of the coastal influence of a generic wave farm operating in the romanian nearshore. J. Environ. Prot. Ecol. 2014, 15, 597–605. [Google Scholar]
- Rusu, E.; Guedes Soares, C. Coastal impact induced by a Pelamis wave farm operating in the Portuguese nearshore. Renew. Energy 2013, 58, 34–49. [Google Scholar] [CrossRef]
- Silva, D.; Rusu, E.; Guedes Soares, C. The Effect of a Wave Energy Farm Protecting an Aquaculture Installation. Energies 2018, 11, 2109. [Google Scholar] [CrossRef]
- Nassar, W.M.; Anaya-Lara, O.; Ahmed, K.H.; Campos-Gaona, D.; Elgenedy, M. Assessment of Multi-Use Offshore Platforms: Structure Classification and Design Challenges. Sustainability 2020, 12, 1860. [Google Scholar] [CrossRef]
- Serri, L.; Sempreviva, A.-D.; Pontes, T.; Murphy, J.; Lynch, K.; Airoldi, D. Resource Data and GIS Tool for Offshore Renewable Energy Projects in Europe; Hydraulics & Maritime Research Centre: Cork, Ireland, 2012. [Google Scholar]
- Loukogeorgaki, E.; Vagiona, D.; Vasileiou, M. Site Selection of Hybrid Offshore Wind and Wave Energy Systems in Greece Incorporating Environmental Impact Assessment. Energies 2018, 11, 2095. [Google Scholar] [CrossRef]
- Veigas, M.; Iglesias, G. A Hybrid Wave-Wind Offshore Farm for an Island. Int. J. Green Energy 2015, 12, 570–576. [Google Scholar] [CrossRef]
- Rusu, E.; Onea, F. A parallel evaluation of the wind and wave energy resources along the Latin American and European coastal environments. Renew. Energy 2019, 143, 1594–1607. [Google Scholar] [CrossRef]
- Stoutenburg, E.D.; Jenkins, N.; Jacobson, M.Z. Power output variations of co-located offshore wind turbines and wave energy converters in California. Renew. Energy 2010, 35, 2781–2791. [Google Scholar] [CrossRef]
- Bosserelle, C.; Reddy, S.; Krüger, J. Waves and Coasts in the Pacific—Cost Analysis of Wave Energy in the Pacific; Pacific Community: Nouméa, New Caledonia, 2015; ISBN 978-982-00-0944-8. [Google Scholar]
- Chan, D.; Mo, J. Life Cycle Reliability and Maintenance Analyses of Wind Turbines. Energy Procedia 2017, 110, 328–333. [Google Scholar] [CrossRef]
- Ribeiro, A.S.; DeCastro, M.; Rusu, L.; Bernardino, M.; Dias, J.M.; Gomez-Gesteira, M. Evaluating the Future Efficiency of Wave Energy Converters along the NW Coast of the Iberian Peninsula. Energies 2020, 13, 3563. [Google Scholar] [CrossRef]
- Harrison, G.P.; Wallace, A.R. Sensitivity of wave energy to climate change. IEEE Trans. Energy Convers. 2005, 20, 870–877. [Google Scholar] [CrossRef]
- López-Ruiz, A.; Bergillos, R.J.; Ortega-Sánchez, M. The importance of wave climate forecasting on the decision-making process for nearshore wave energy exploitation. Appl. Energy 2016, 182, 191–203. [Google Scholar] [CrossRef]
- deCastro, M.; Costoya, X.; Salvador, S.; Carvalho, D.; Gómez-Gesteira, M.; Sanz-Larruga, F.J.; Gimeno, L. An overview of offshore wind energy resources in Europe under present and future climate. Ann. N. Y. Acad. Sci. USA 2019, 1436, 70–97. [Google Scholar] [CrossRef]
- Moemken, J.; Reyers, M.; Feldmann, H.; Pinto, J.G. Future Changes of Wind Speed and Wind Energy Potentials in EURO-CORDEX Ensemble Simulations. J. Geophys. Res. Atmos. 2018, 123, 6373–6389. [Google Scholar] [CrossRef]
- Staffell, I.; Pfenninger, S. Using bias-corrected reanalysis to simulate current and future wind power output. Energy 2016, 114, 1224–1239. [Google Scholar] [CrossRef]
- EURO-CORDEX—Coordinated Downscaling Experiment—European Domain. Available online: https://www.euro-cordex.net/ (accessed on 23 June 2020).
- Zheng, C.W.; Xiao, Z.N.; Peng, Y.H.; Li, C.Y.; Du, Z.B. bo Rezoning global offshore wind energy resources. Renew. Energy 2018, 129, 1–11. [Google Scholar] [CrossRef]
- Astariz, S.; Iglesias, G. The collocation feasibility index—A method for selecting sites for co-located wave and wind farms. Renew. Energy 2017, 103, 811–824. [Google Scholar] [CrossRef]
- Martínez-Asensio, A.; Tsimplis, M.N.; Marcos, M.; Feng, X.; Gomis, D.; Jordà, G.; Josey, S.A. Response of the North Atlantic wave climate to atmospheric modes of variability. Int. J. Climatol. 2016, 36, 1210–1225. [Google Scholar] [CrossRef]
- Chen, G.; Chapron, B.; Ezraty, R.; Vandemark, D. A Global View of Swell and Wind Sea Climate in the Ocean by Satellite Altimeter and Scatterometer. J. Atmos. Ocean. Technol. 2002, 19, 1849–1859. [Google Scholar] [CrossRef]
- Woolf, D.K. Variability and predictability of the North Atlantic wave climate. J. Geophys. Res. 2002, 107, 3145. [Google Scholar] [CrossRef]
- Jiang, H.; Chen, G. A Global View on the Swell and Wind Sea Climate by the Jason-1 Mission: A Revisit. J. Atmos. Ocean. Technol. 2013, 30, 1833–1841. [Google Scholar] [CrossRef]
- Chen, G. A new look at the zonal pattern of the marine wind system from TOPEX measurements. Remote Sens. Environ. 2002, 79, 15–22. [Google Scholar] [CrossRef]
- Clément, A.; McCullen, P.; Falcão, A.; Fiorentino, A.; Gardner, F.; Hammarlund, K.; Lemonis, G.; Lewis, T.; Nielsen, K.; Petroncini, S.; et al. Wave energy in Europe: Current status and perspectives. Renew. Sustain. Energy Rev. 2002, 6, 405–431. [Google Scholar] [CrossRef]
- Rusu, L.; Onea, F. The performance of some state-of-the-art wave energy converters in locations with the worldwide highest wave power. Renew. Sustain. Energy Rev. 2017, 75, 1348–1362. [Google Scholar] [CrossRef]
- deCastro, M.; Salvador, S.; Gómez-Gesteira, M.; Costoya, X.; Carvalho, D.; Sanz-Larruga, F.J.; Gimeno, L. Europe, China and the United States: Three different approaches to the development of offshore wind energy. Renew. Sustain. Energy Rev. 2019, 109, 55–70. [Google Scholar] [CrossRef]
- Palha, A.; Mendes, L.; Fortes, C.J.; Brito-Melo, A.; Sarmento, A. The impact of wave energy farms in the shoreline wave climate: Portuguese pilot zone case study using Pelamis energy wave devices. Renew. Energy 2010, 35, 62–77. [Google Scholar] [CrossRef]
- Mahajan, V.; Linstone, H.A.; Turoff, M. The Delphi Method: Techniques and Applications. J. Mark. Res. 1976, 13. [Google Scholar] [CrossRef]
- Costoya, X.; DeCastro, M.; Santos, F.; Sousa, M.C.; Gómez-Gesteira, M. Projections of wind energy resources in the Caribbean for the 21st century. Energy 2019, 178, 356–367. [Google Scholar] [CrossRef]
- Costoya, X.; deCastro, M.; Carvalho, D.; Gómez-Gesteira, M. On the suitability of offshore wind energy resource in the United States of America for the 21st century. Appl. Energy 2020, 262, 114537. [Google Scholar] [CrossRef]
- Gibbons, J.D.; Chakraborti, S. Nonparametric Statistical Inference, 5th ed.; CRC Press: Boca Raton, FL, USA, 2011; ISBN 9781420077612. [Google Scholar]
- Costoya, X.; Rocha, A.; Carvalho, D. Using bias-correction to improve future projections of offshore wind energy resource: A case study on the Iberian Peninsula. Appl. Energy 2020, 262, 114562. [Google Scholar] [CrossRef]
- Santos, F.; Gómez-Gesteira, M.; DeCastro, M.; Añel, J.A.; Carvalho, D.; Costoya, X.; Dias, J.M. On the accuracy of CORDEX RCMs to project future winds over the Iberian Peninsula and surrounding ocean. Appl. Energy 2018, 228, 289–300. [Google Scholar] [CrossRef]
- SWAN. SWAN User Manual Version 41.31; Delft University of Technology, Environmental Fluid Mechanics Section: Delft, The Netherlands, 2019; p. 143. [Google Scholar]
- International Electrotechnical Commission. Marine Energy—Wave, Tidal and Other Water Current Converters—Part 201: Tidal Energy Resource Assessment And Characterization; International Electrotechnical Commission: Geneva, Switzerland, 2015. [Google Scholar]
- Durrant, T.; Hemer, M.; Trenham, C.; Greenslade, D. CAWCR Wave Hindcast 1979–2010. v8; Commonwealth Scientific and Industrial Research Organisation: Canberra, Australia, 2012. [Google Scholar]
- Hemer, M.; Trenham, C.; Durrant, T.; Greenslade, D. CAWCR Global Wind-Wave 21st Century Climate Projections. v2; Commonwealth Scientific and Industrial Research Organisation: Canberra, Australia, 2015. [Google Scholar]
- Perkins, S.E.; Pitman, A.J.; Holbrook, N.J.; McAneney, J. Evaluation of the AR4 climate models’ simulated daily maximum temperature, minimum temperature, and precipitation over Australia using probability density functions. J. Clim. 2007, 20, 4356–4376. [Google Scholar] [CrossRef]
- Pastor, J.; Liu, Y. Wave Energy Resource Analysis for Use in Wave Energy Conversion. J. Offshore Mech. Arct. Eng. 2015, 137, 011903. [Google Scholar] [CrossRef]
- Elliott, D.L.; Holladay, C.G.; Barchet, W.R.; Foote, H.P.; Sandusky, W.F. Wind Energy Resource Atlas of the United States. DOE/CH 10093-10094; Pacific Northwest National Laboratory: Richland, WA, USA, 1986.
- Zheng, C.; Pan, J. Assessment of the global ocean wind energy resource. Renew. Sustain. Energy Rev. 2014, 33, 382–391. [Google Scholar] [CrossRef]
- Kamranzad, B.; Hadadpour, S. A multi-criteria approach for selection of wave energy converter/location. Energy 2020, 204, 117924. [Google Scholar] [CrossRef]
- Kamranzad, B.; Etemad-Shahidi, A.; Chegini, V. Developing an optimum hotspot identifier for wave energy extracting in the northern Persian Gulf. Renew. Energy 2017, 114, 59–71. [Google Scholar] [CrossRef]
- Reeve, D.E.; Chen, Y.; Pan, S.; Magar, V.; Simmonds, D.J.; Zacharioudaki, A. An investigation of the impacts of climate change on wave energy generation: The Wave Hub, Cornwall, UK. Renew. Energy 2011, 36, 2404–2413. [Google Scholar] [CrossRef]
- Iglesias, G.; Carballo, R. Choosing the site for the first wave farm in a region: A case study in the Galician Southwest (Spain). Energy 2011, 36, 5525–5531. [Google Scholar] [CrossRef]
- Rusu, E.; Guedes Soares, C. Numerical modelling to estimate the spatial distribution of the wave energy in the Portuguese nearshore. Renew. Energy 2009, 34, 1501–1516. [Google Scholar] [CrossRef]
- Gaetani, M.; Vignati, E.; Monforti-Ferrario, F.; Huld, T.; Dosio, A.; Raes, F. Climate Modelling and Renewable Energy Resource Assessment; European Comission: Brussels, Belgium, 2015. [Google Scholar]


| GCM | RCM | INSTITUTE |
|---|---|---|
| CNRM-CM5 | CCLM4-8-17 | CLMcom |
| CNRM-CM5 | RCA4 | SMHI |
| EC-EARTH | RACMO22E | KNMI |
| IPSL-CM5A-MR | RCA4 | SMHI |
| IPSL-CM5A-MR | WRF331F | INERIS |
| MPI-ESM-LR | CCLM4-8-17 | CLMcom |
| MPI-ESM-LR | REMO2009 | MPI-CSC |
| Normalized. | RLO (%) | DWNT (%) | Cv | Mv | EWS (ms−1) |
|---|---|---|---|---|---|
| 0/9 | <10 | <10 | >1.9 | >2.5 | >27 |
| 1/9 | 10–20 | 10–20 | 1.7–1.9 | 2.25–2.5 | 25.5–27.0 |
| 2/9 | 20–30 | 20–30 | 1.5–1.7 | 2.0–2.25 | 24.0–25.5 |
| 3/9 | 30–40 | 30–40 | 1.3–1.5 | 1.75–2.0 | 22.5–24.0 |
| 4/9 | 40–50 | 40–50 | 1.1–1.3 | 1.5–1.75 | 21.0–22.5 |
| 5/9 | 50–60 | 50–60 | 0.9–1.1 | 1.25–1.5 | 19.5–21.0 |
| 6/9 | 60–70 | 60–70 | 0.7–0.9 | 1.0–1.25 | 18.0–19.5 |
| 7/9 | 70–80 | 70–80 | 0.5–0.7 | 0.75–1.0 | 16.5–18.0 |
| 8/9 | 80–90 | 80–90 | 0.3–0.5 | 0.5–0.75 | 15.0–16.5 |
| 9/9 | >90 | >90 | <0.3 | <0.5 | <15.0 |
| WD (m) | DC (deg) |
|---|---|
| >500 | >4 |
| 100–500 | 3–4 |
| 50–100 | 2–3 |
| 25–50 | 0.5–2 |
| 0–25 | <0.5 |
| Richness | Variability | Risk | Cost | ||||
|---|---|---|---|---|---|---|---|
| Wann | RLO | DWNT | Cv | Mv | EWS | WD | DC |
| 0.22 ± 0.02 | 0.10 ± 0.01 | 0.22 ± 0.02 | 0.10 ± 0.01 | 0.05 ± 0.01 | 0.14 ± 0.01 | 0.07 ± 0.01 | 0.10 ± 0.02 |
| Normalized | WP (kWm−1) | DWNT (%) | Cv | Mv | EWH (m) |
|---|---|---|---|---|---|
| 0/9 | <10 | <10 | >1.9 | >2.5 | >21 |
| 1/9 | 10–20 | 10–20 | 1.7–0.9 | 2.25–2.5 | 20–21 |
| 2/9 | 20–30 | 20–30 | 1.5–1.7 | 2.0–2.25 | 19–20 |
| 3/9 | 30–40 | 30–40 | 1.3–1.5 | 1.75–2.0 | 18–19 |
| 4/9 | 40–50 | 40–50 | 1.1–1.3 | 1.5–1.75 | 17–18 |
| 5/9 | 50–60 | 50–60 | 0.9–1.1 | 1.25–1.5 | 16–17 |
| 6/9 | 60–70 | 60–70 | 0.7–0.9 | 1.0–1.25 | 15–16 |
| 7/9 | 70–80 | 70–80 | 0.5–0.7 | 0.75–1.0 | 14–15 |
| 8/9 | 80–90 | 80–90 | 0.3–0.5 | 0.5–0.75 | 13–14 |
| 9/9 | >90 | >90 | <0.3 | <0.5 | <13 |
| Richness | Variability | Risk | Cost | |||
|---|---|---|---|---|---|---|
| WP | DWNT | Cv | Mv | EWH | WD | DC |
| 0.44 ± 0.05 | 0.10 ± 0.02 | 0.10 ± 0.01 | 0.05 ± 0.01 | 0.14 ± 0.01 | 0.07 ± 0.02 | 0.10 ± 0.01 |
Publisher’s Note: MDPI stays neutral with regard to jurisdictional claims in published maps and institutional affiliations. |
© 2020 by the authors. Licensee MDPI, Basel, Switzerland. This article is an open access article distributed under the terms and conditions of the Creative Commons Attribution (CC BY) license (http://creativecommons.org/licenses/by/4.0/).
Share and Cite
Ribeiro, A.; Costoya, X.; de Castro, M.; Carvalho, D.; Dias, J.M.; Rocha, A.; Gomez-Gesteira, M. Assessment of Hybrid Wind-Wave Energy Resource for the NW Coast of Iberian Peninsula in a Climate Change Context. Appl. Sci. 2020, 10, 7395. https://doi.org/10.3390/app10217395
Ribeiro A, Costoya X, de Castro M, Carvalho D, Dias JM, Rocha A, Gomez-Gesteira M. Assessment of Hybrid Wind-Wave Energy Resource for the NW Coast of Iberian Peninsula in a Climate Change Context. Applied Sciences. 2020; 10(21):7395. https://doi.org/10.3390/app10217395
Chicago/Turabian StyleRibeiro, Americo, Xurxo Costoya, Maite de Castro, David Carvalho, Joao Miguel Dias, Alfredo Rocha, and Moncho Gomez-Gesteira. 2020. "Assessment of Hybrid Wind-Wave Energy Resource for the NW Coast of Iberian Peninsula in a Climate Change Context" Applied Sciences 10, no. 21: 7395. https://doi.org/10.3390/app10217395
APA StyleRibeiro, A., Costoya, X., de Castro, M., Carvalho, D., Dias, J. M., Rocha, A., & Gomez-Gesteira, M. (2020). Assessment of Hybrid Wind-Wave Energy Resource for the NW Coast of Iberian Peninsula in a Climate Change Context. Applied Sciences, 10(21), 7395. https://doi.org/10.3390/app10217395