Article

An Approach to Human Walking Analysis Based on Balance, Symmetry and Stability Using COG, ZMP and CP

School of Science and Technology, Keio University, Yokohama 223-8522, Kanagawa, Japan
*
Author to whom correspondence should be addressed.
Appl. Sci. 2020, 10(20), 7307; https://doi.org/10.3390/app10207307
Submission received: 6 September 2020 / Revised: 9 October 2020 / Accepted: 16 October 2020 / Published: 19 October 2020
(This article belongs to the Special Issue Biorobotics: Challenges, Technologies, and Trends)

Abstract

:
The parameters of walking have been studied from the viewpoints of joint rotation and translation of body. The balance and symmetry of walking are indispensable features to understand for healthy walking, while also being a personal characteristic. However, quantification has not been easy to carry out in the case of the conventional gait parameters COG (center of gravity) and ZMP (zero moment point). In this approach, the CP (crossing point) is proposed to quantify the concept of symmetry and balance by comparing it to the COG and ZMP. The CP is estimated based on the intersection between the hip line and the ankle line. While the hip line is fixed on the upper body where the COG is, the ankle line is altered depending on the each footfall, where the ZMP is. Therefore, the values of COG, ZMP, and CP have similar or different tendencies in terms of whether balanced walking results in symmetry or not. The validity of this is verified by carrying out a simulation with robot walking, and an experiment using human walking. Through additional experiments, it was noticed that the CP was able to improve the role of COG and ZMP in terms of not only stability, but also its relationship with the movement range of the lower limbs.

1. Introduction

Researchers who study human walking have attempted the quantitative evaluation of various factors, including stride velocity, stride length, step information (length, width, angle, and time), joint angles, muscle force, and so on. Muro-de-la-Herran et al. [1] described the categorization of gait parameters based on clinical application, sport, and recognition. Of these, clinical application requires the greatest number of gait parameters, because gait disorders affect a large percentage of the world’s population. Clinical application or rehabilitation has been focused on walking parameters related to balance, stability, symmetry, etc., for the purpose of recovering healthy gait. These factors include the trajectory of joints, the symmetry of left and right, COG (center of gravity), COP (centre of pressure), ZMP, and so on. The mentioned indices are extremely important as individual walking features, but one index alone is not enough to judge personal walking. Therefore, many researchers have studied the use of one or more indices for the analysis of human walking [2,3,4,5,6,7,8,9,10,11,12,13,14].
Prior to discussing the various indices, it is important to understand the two basic models of human walking. The first is an earlier and dominant perspective. From this view of point, walking is described as a continuous sequence of cyclic joint rotations of limbs and the trunk [15,16,17,18,19,20]. This concept is typically applied to robot systems to mimic human walking motion with left and right symmetry. Additionally, the stability index is always estimated by monitoring whether the expected performance remains stable. Imitation of walking, however, is restricted by the complexity of the body structure and its controls. On the other hand, a less widely held viewpoint is that walking can be defined as the forward translation of the body system through a total locomotion. This movement results from the compositive interplay between gravity, inertia, joint rotations, and the cyclic contraction of numerous muscles [21,22,23]. Thus, above all, walking balance and symmetry are regarded as important for maintaining walking translation performed by individual parts of body. However, it has been difficult to produce a quantitative index to describe balance and symmetry, even though many studies have been performed in this area.
In fact, walking balance can be defined as any condition in which all acting forces are cancelled out by each other, resulting in a stable balance system [24]. The concept of balance in walking is, generally, projected onto the COG and ZMP in order to judge the stability state by considering forces such as gravity and inertial forces. Here, COG is defined as a hypothetical point at which the force of gravity works on the human body. When the COG falls outside the BOS (base of support), a reaction is essential in order to stay balanced. The BOS refers to the area beneath the robot or person, including every point of contact between the robot or person and the ground, where the ZMP is determined. Meanwhile, Patterson et al. [25] evaluated two kinds of walking. The first was the symmetrical gait of 80 healthy people, and the other was the asymmetrical gait of 141 stroke patients. The method for analyzing symmetry and asymmetry is based on the comparison of five spatiotemporal parameters, including step length, swing time, stance time, DS time and SW/ST by using ratio (a symmetry ratio), SI (symmetry index), GA (gait asymmetry), SA (symmetry angle). As a result, only the ratio affects the easy analysis, while the other symmetry indices show no obvious advantages for the defined analysis. This research is limited to quantifying the symmetry feature as indices, although left and right symmetry in walking is described by the detected data. Thus, we tried to find a numerical index that connotes symmetry, balance, and side effects, together with the conventional stability indices, the COG and the ZMP.
When the walking body does not reach a comfortable pose, the walker will feel unwell and may become easily exhausted, while also requiring additional force in some parts to maintain walking balance. It cannot be predicted when or where this force will be generated. Therefore, it is preferable to pose the structural body to feel comfortable, while simultaneously, the force should be at work where it is appropriate. In addition, then, to maintain the motility of walking, the total force of the body should comply with body balance. In other words, the COG quickly moves towards being over the BOS in order to secure stability; the movement of the COG causes the generation of force, guaranteeing stability. The analysis of human walking begins here by detecting the parameters after own force and balance have played their part in walking motion. To this end, this paper focuses on the detection of stability, symmetry, and balance using the COG, ZMP, and CP during natural human walking. The CP is proposed to estimate the symmetry and the balance, and its values are verified by a validation of the relationship in comparison to the values of COG and the ZMP in the simulation and the experiment. In the discussion, the effect of CP is described, and the difference values between the COG, ZMP, and CP are compared to each other on the basis of SD (standard deviation) and RMSE (root-mean-square error).

2. Stability Indices in Walking

The major factors influencing the stability index are the height of the COG, the size of the BOS where the ZMP is, and body weight. Concretely, the lower the height of the COG is above a wider BOS, the greater the increase in walking stability. Based on the concept of stability indices, which consider force, patients can observe whether their walk is stable or unstable, and notice whether their present walking could be connected with falling down or not. Moreover, in terms of the locomotion of the body, an interesting concept known as CP is proposed by involving walking symmetry, due to the significance of continuous balance.
Before describing the various indices, a consideration of human walking modeling will help to understand how the indices work in walking motion.

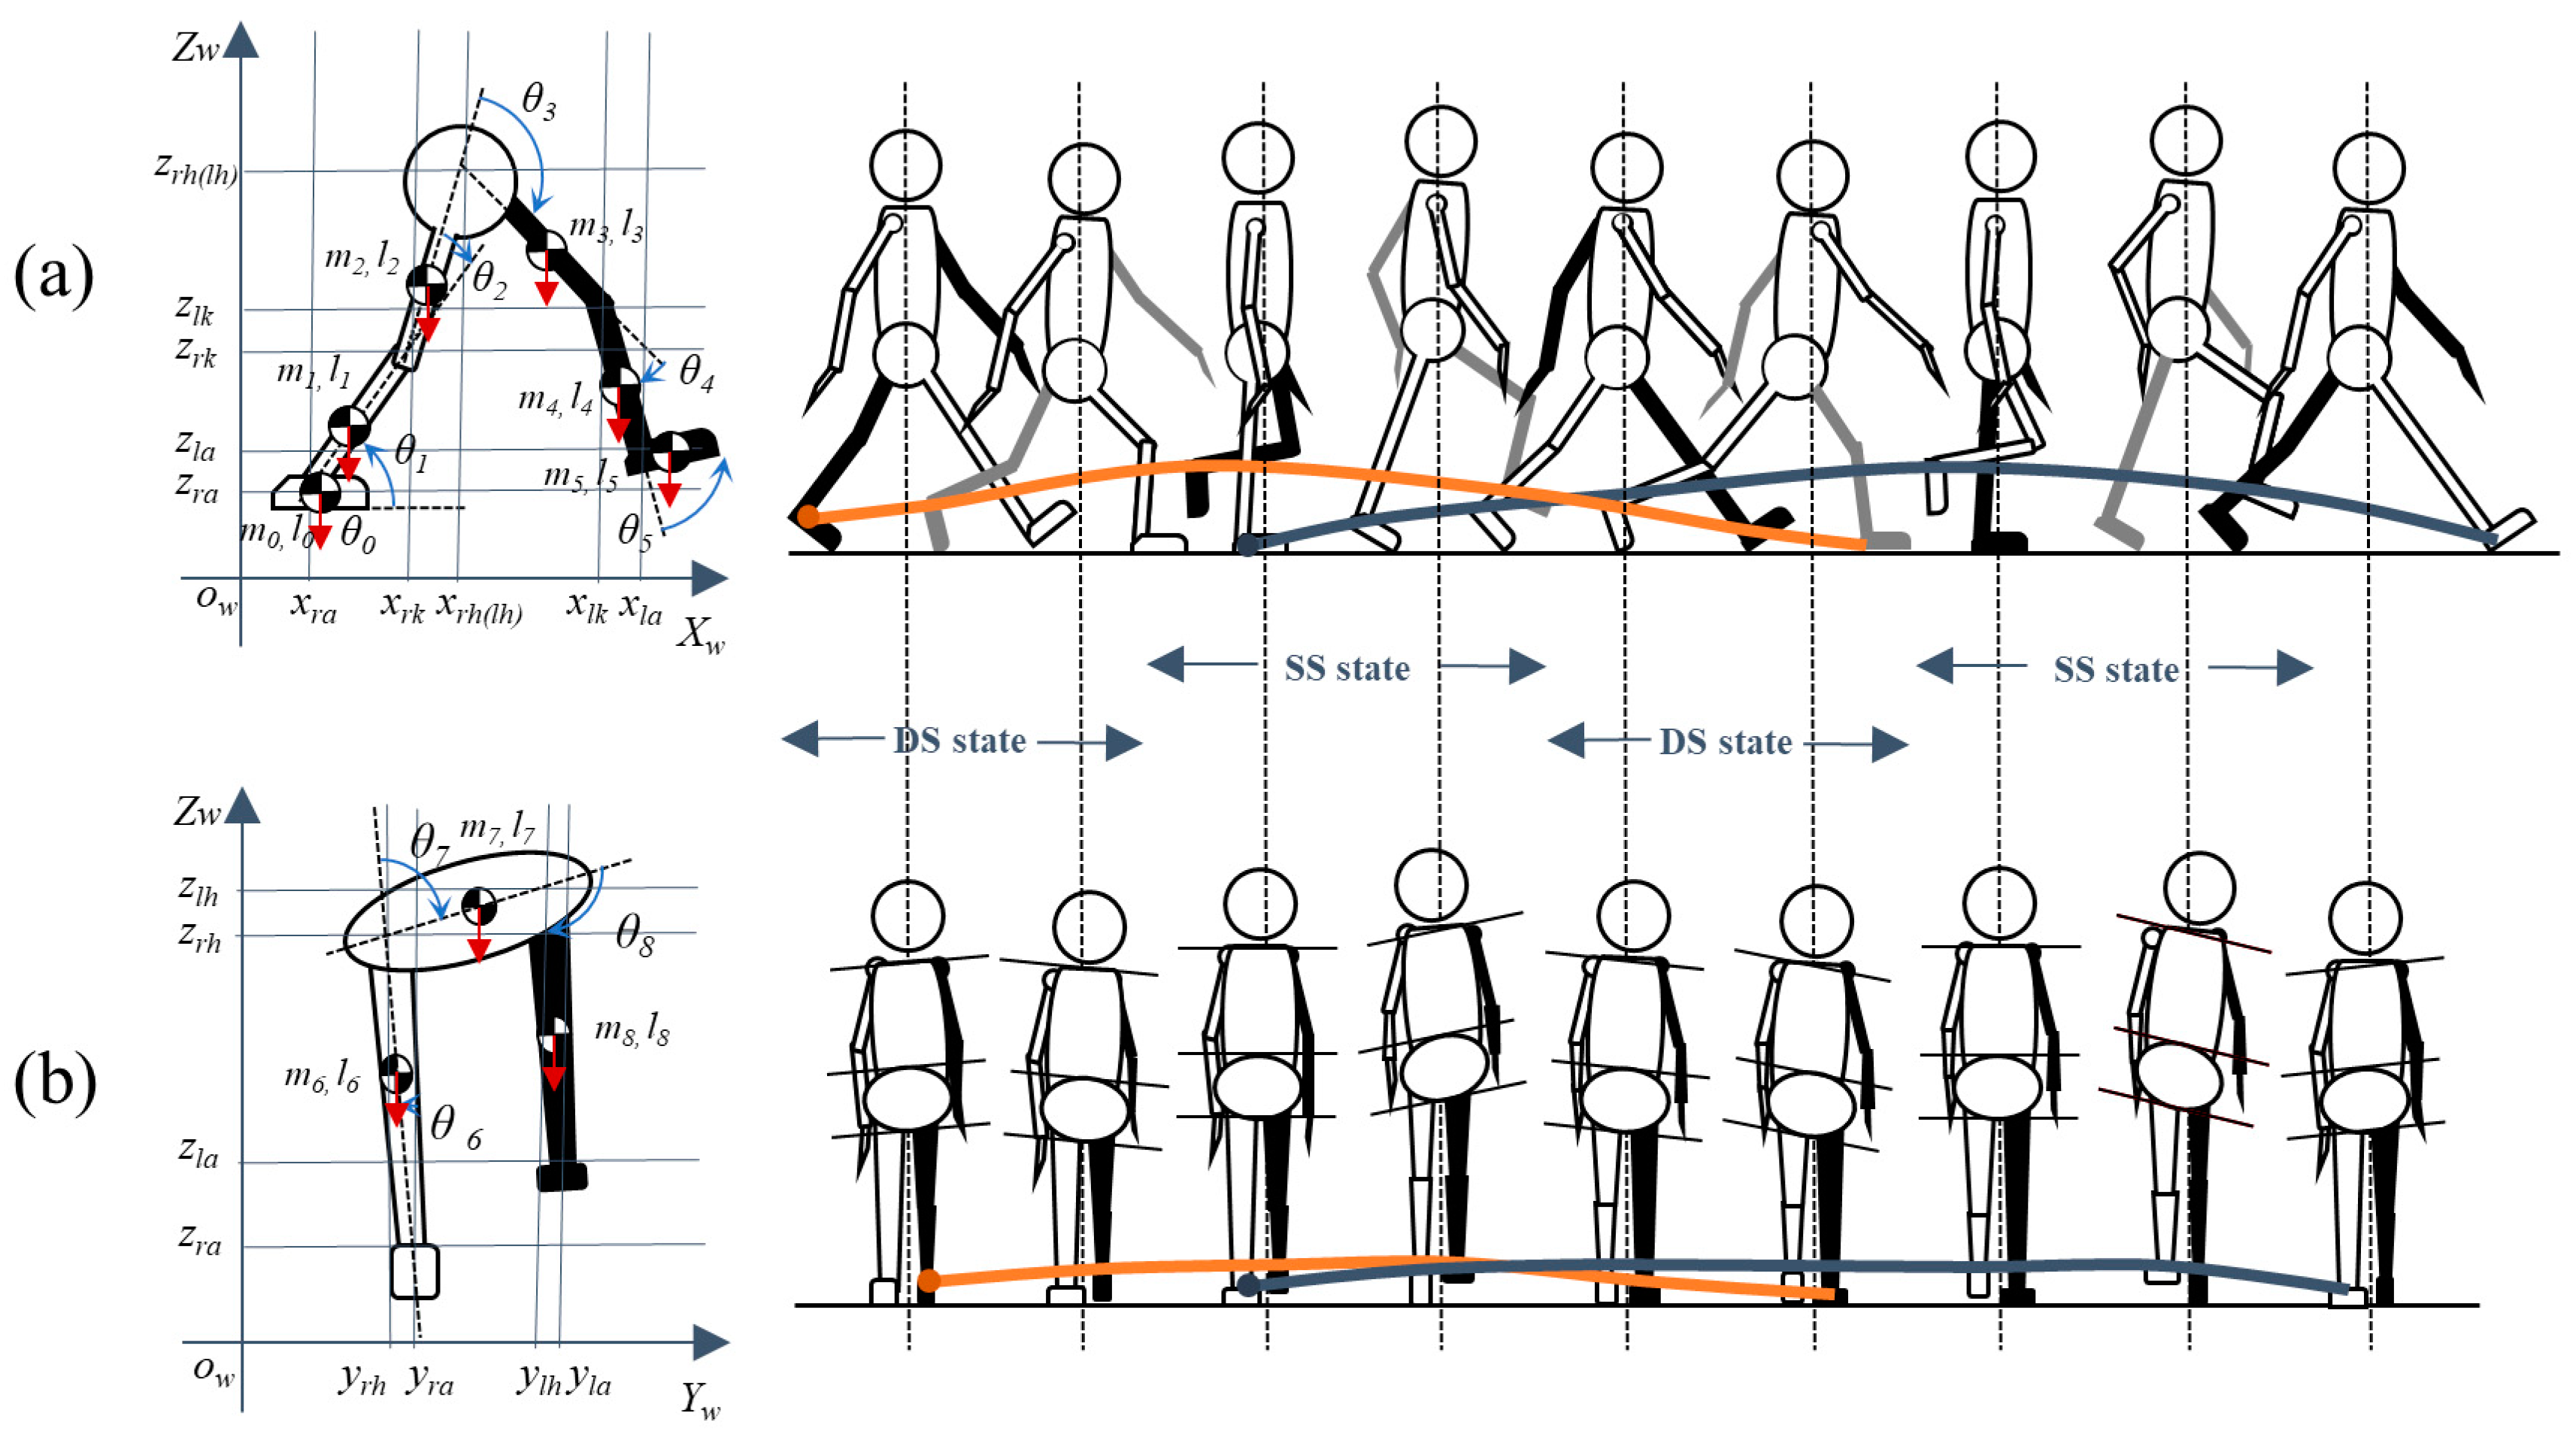
2.1. Human Walking Modeling

A human walking model is composed of six links to define the lower limbs. In each step, the first foot joint of the stance foot is regarded as the starting joint for calculating the dynamics of the walking limbs. Therefore, the fixed point on the ground alternates between the left and right foot depending on which one is playing the stance role. The structure of the walking model and the dynamics information are shown in Figure 1. Here, when one foot is playing the stance role, the other foot works as a swing that draws a parabolic orbit.
In the sagittal plane, the body joints are organized as a hip, an ankle, and knees, as shown in Figure 1a. The torque of each joint is represented as in (1) and (2), with τ = [τ0 τ1 τ2 τ3 τ4]T and τ = [τ5 τ4 τ3 τ2 τ1]T corresponding to the right stance state and the left stance state, respectively. In the transverse plane, the limb joints consist of one ankle and two hips, as given in Figure 1b. The torque of each joint is described as in (1) and (2) by τ = [τ6 τ7 τ8]T and τ = [τ8 τ7 τ6]T according to the stance leg.
L = K P ,
τ i ( j ) = d d t ( L θ ˙ i ( j ) ) L θ i ( j ) ( i = 0 , 1 , 2 , 3 , 4 , 5 ,   j = 6 , 7 , 8 ) ,

2.2. Stability Index

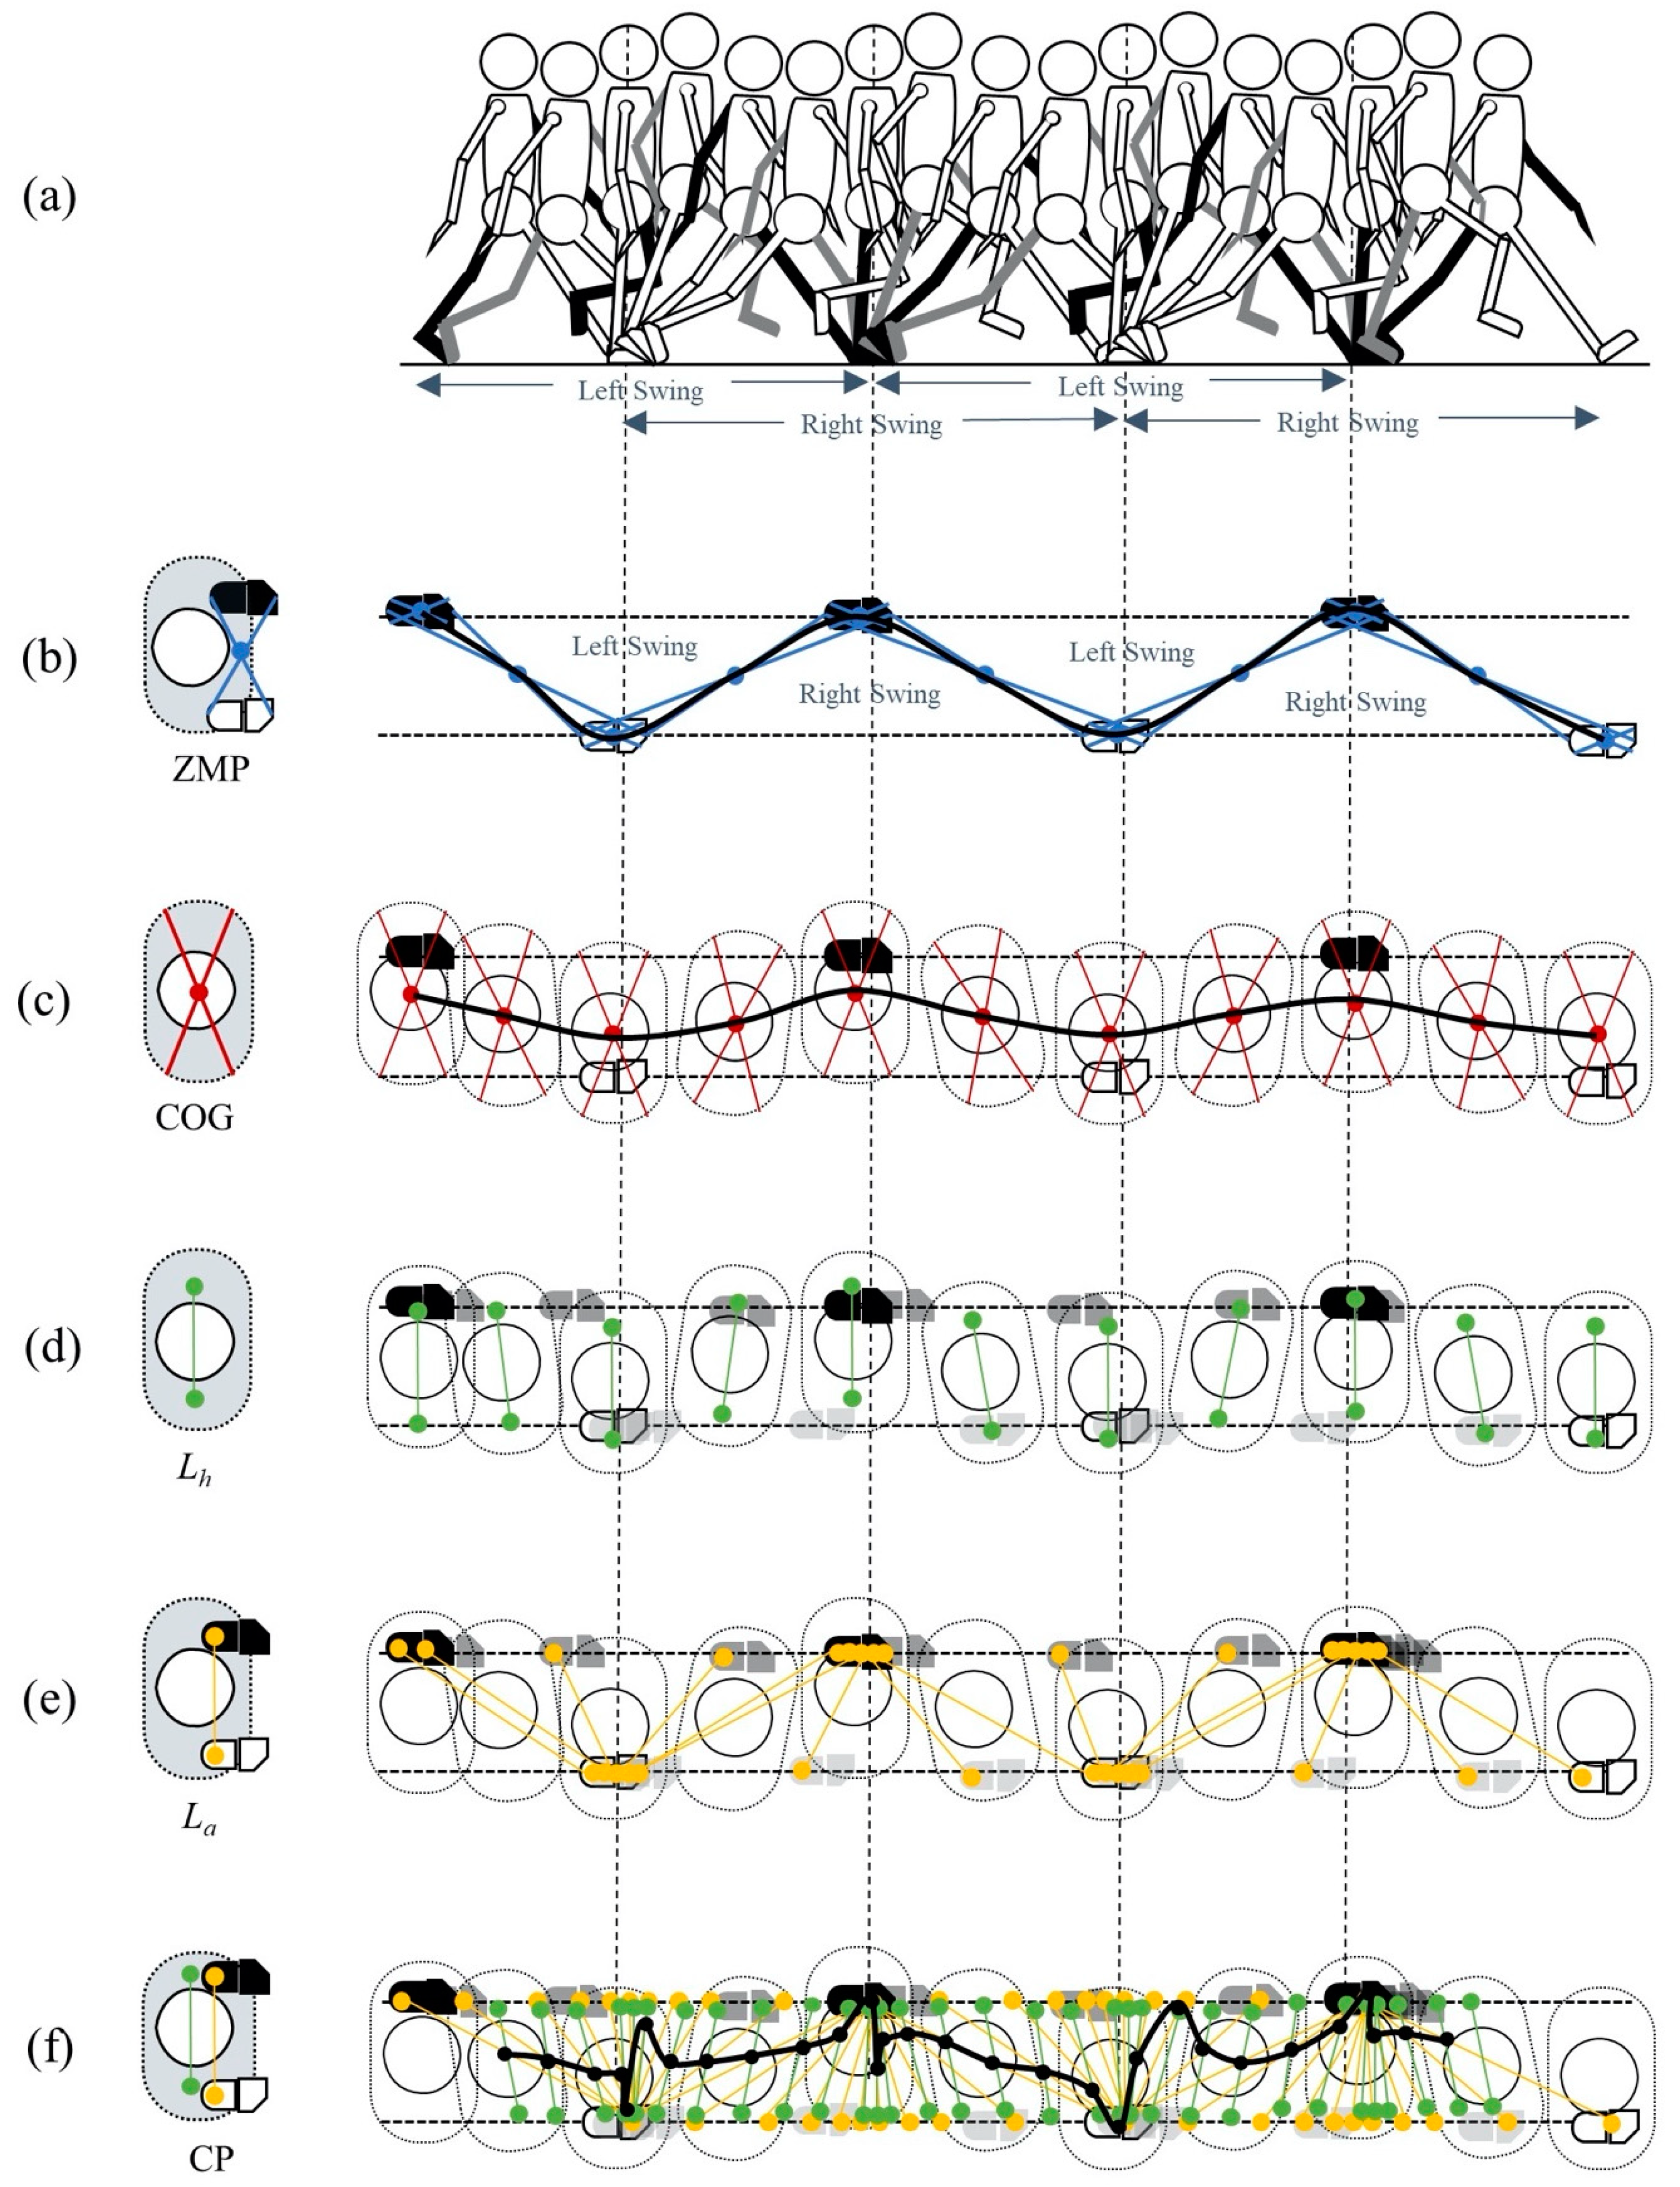
2.2.1. Conventional COG and ZMP
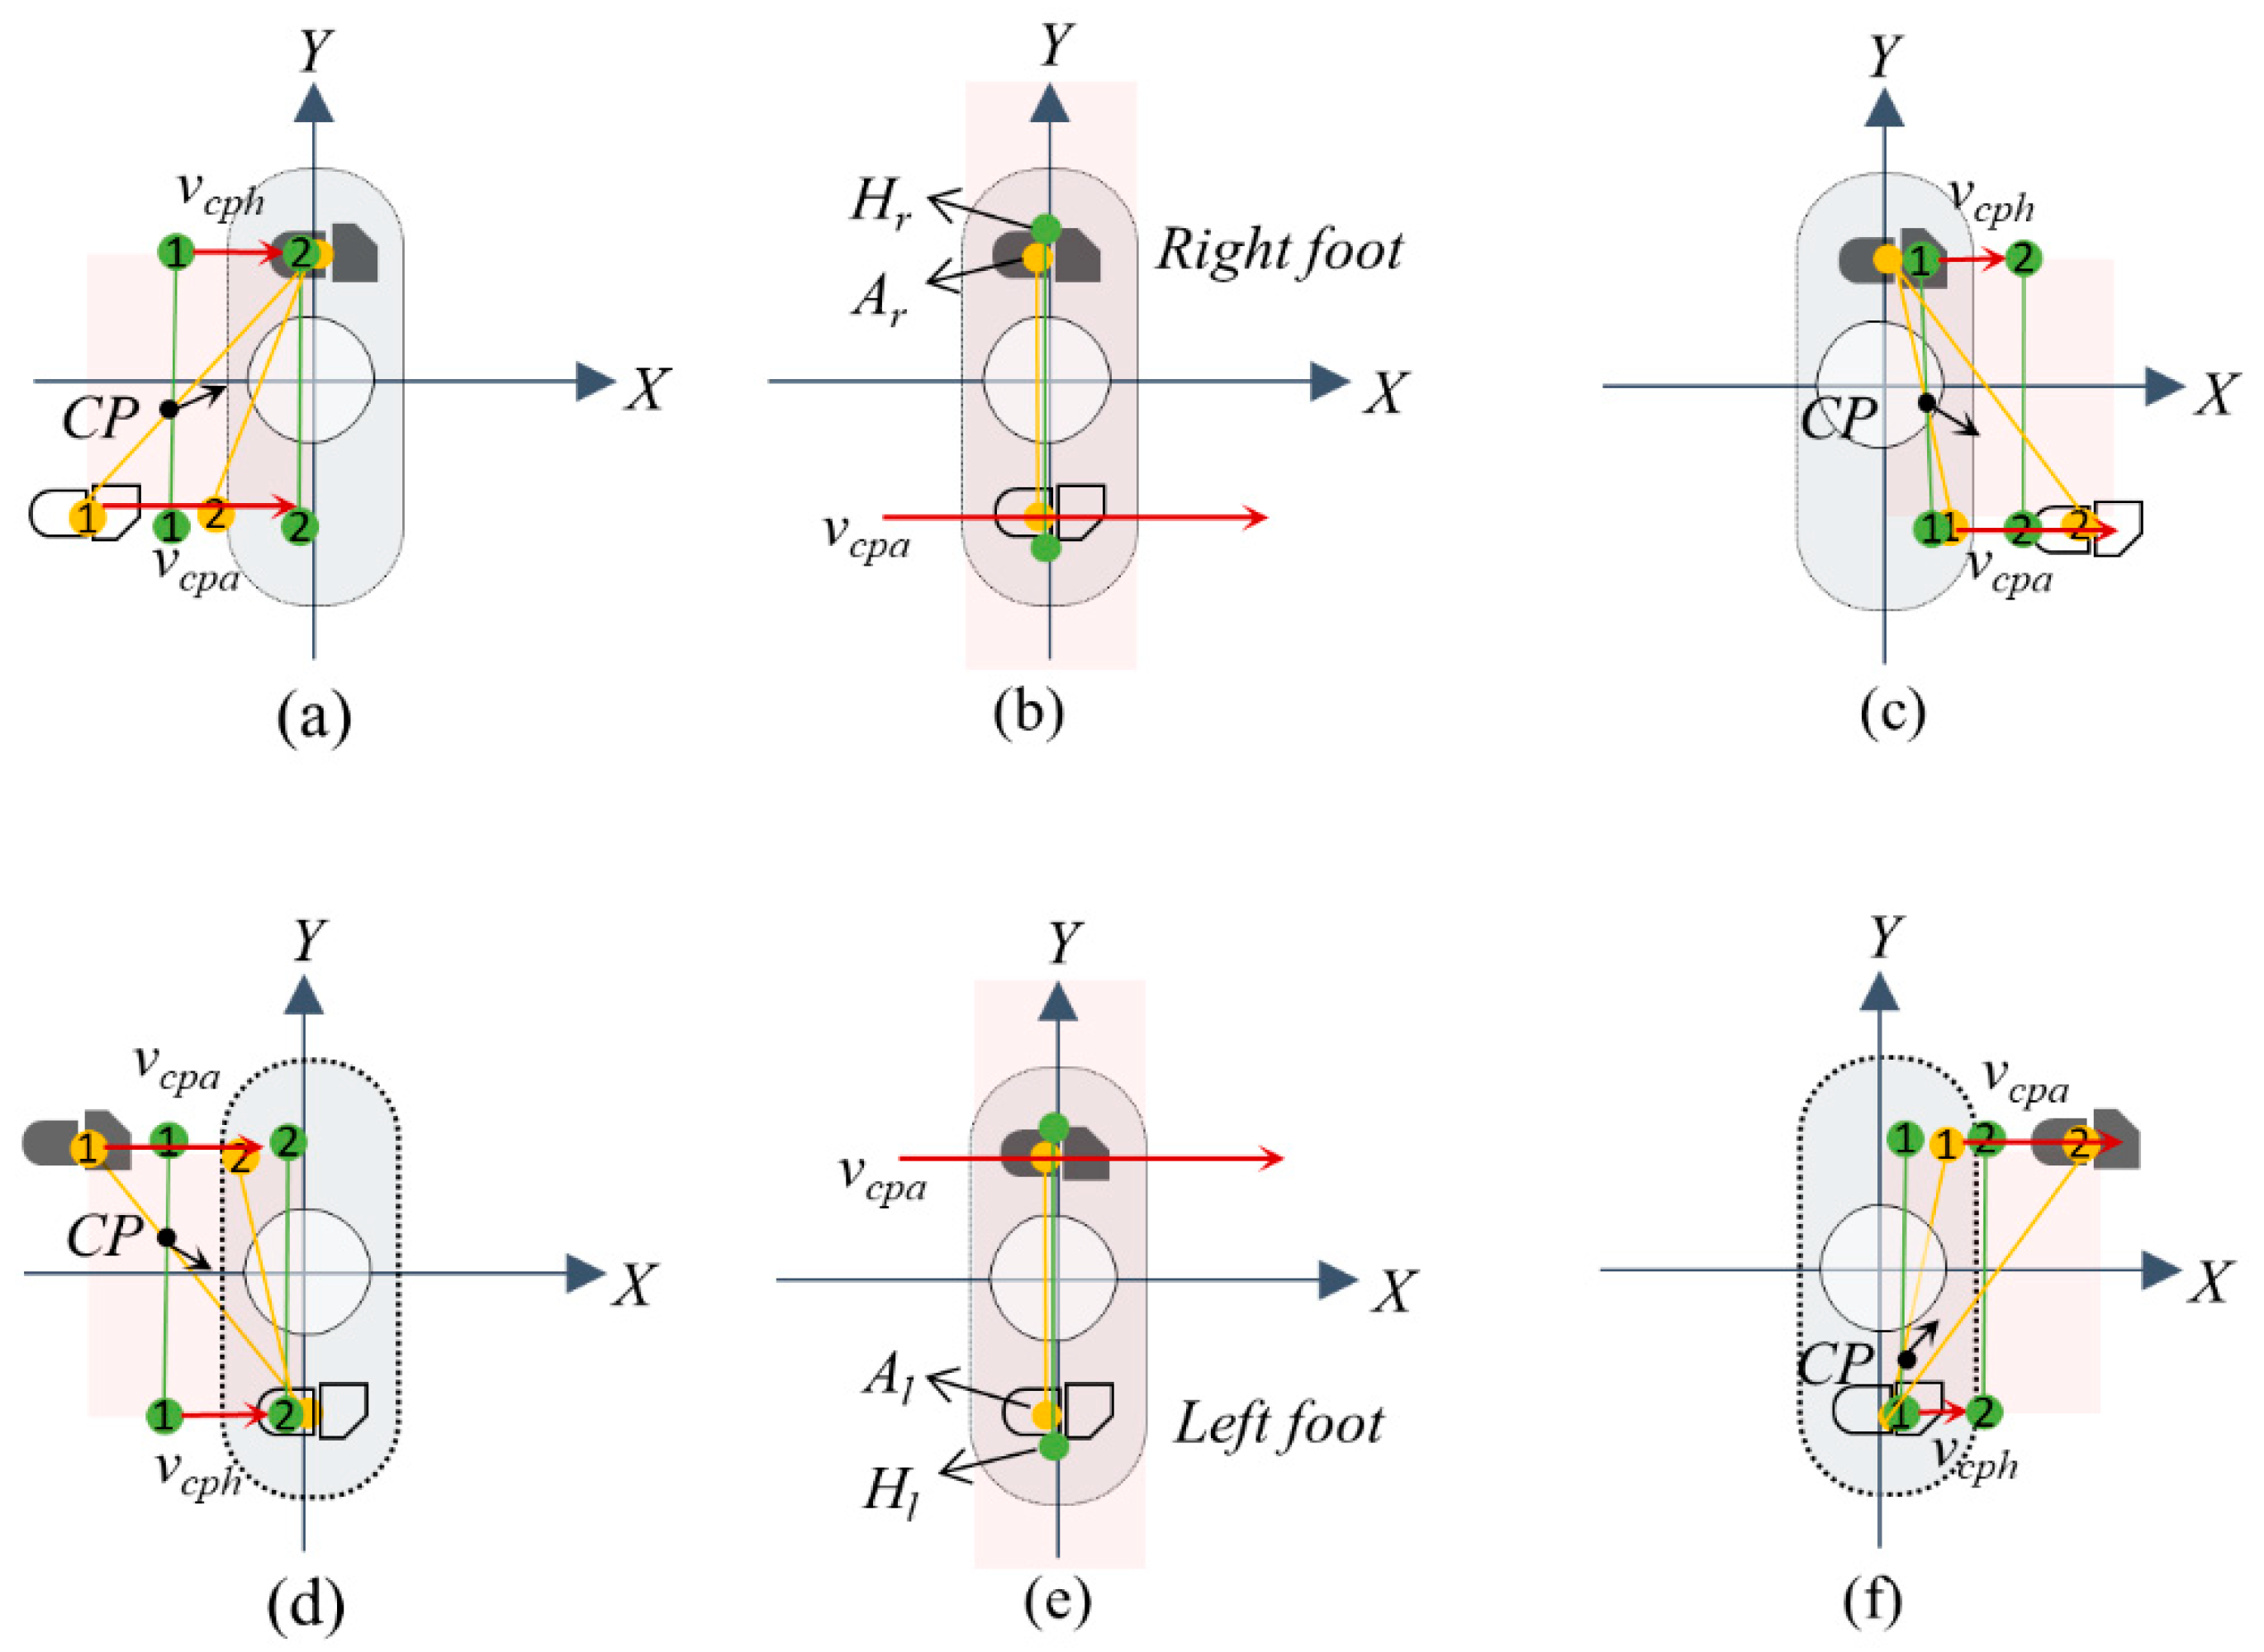
The COG is the point at which the distribution of weight is equal in all directions, and depends on gravitational field. The COG value is calculated in the x-axis, y-axis, and z-axis according to the respective axes in (3), (4) and (5). Here, mi is the mass of each link, and i and ci in the subscript indicates the center of each segment link.
x c o g = i m i x c i i m i   ,
y c o g = i m i y c i i m i   ,
z c o g = i m i z c i i m i   ,
The ZMP is the point on the ground at which the tipping moment equals zero. The tipping moment is defined by the component of the moments that is tangential to the supporting surface [26]. The ZMP values on the x-axis and y-axis are generally estimated by considering each mass of the multi-body, as given in (6) and (7), respectively, where n is the number of body links and i is each joint number, m is the mass of the link, g is gravity acceleration, I is the moment of inertia, and θ is the rotation angle.
x z m p = i n m i x i ( z ¨ i + g ) i n m i x ¨ i z i i n I i y θ ¨ i y i n m i ( z ¨ i + g ) ,
y z m p = i n m i y i ( z ¨ i + g ) i n m i y ¨ i z i i n I i x θ ¨ i x i n m i ( z ¨ i + g ) ,
The calculation of COG and ZMP is the traditional method; however, it is additionally complex in practical walking models that are made up of many segment links. Additionally, it is rarely possible to estimate the fluctuating value of the moment of inertia in accordance with the segment links at each and every moment.

2.2.2. Proposed CP

The crossing point, named the CP, refers to a virtual point between the hip line Lh and the ankle line La, with each line connected to left and right, respectively, with respect to the hip joints and ankle joints, as written in (8). The estimation of CP is described on an xy-plane, only, based on the intersection between Lh and La as given by (9), although Lh and La are mostly in a skew position in space.
L h = H r H l L a = A r A l
C P = I n t e r sec t i o n ( L h , L a ) ,
In (8), Hr(l) indicates the joint position of the right(left) hip, and Ar(l) indicates the joint position of the right(left) ankle.
Figure 2 displays the potential area in which CP might be, depending on the displacement of Hr(l) and Ar(l) and the expected direction of CP’s route. It is assumed that the length of Lh is constant, and the torsional movement of the hip is not considered, whereas the length and the incline of La are changeable at every footstep. Thus, Lh is assumed to move forward in parallel from ① to ② at random speeds in Figure 2. In the right stance phase, the Ar is fixed, and the Al changes continuously in parallel with Lh, as shown in Figure 2a. The remarkable point is that vcph (speed of Lh) is faster than vcpa (speed of La), and Lh leads the phase of La in the direction of the x-axis. Therefore, CP is expected to be toward the right foot when walking forward. Figure 2d shows the case of the left stance phase. Its expected results are that the CP is toward the left stance, based on the same reasoning as that in Figure 2a. However, the tracking of CP might lose continuity when the La is almost overlaid with Lh, as shown in Figure 2b,e. In this stage, the CP is usually outside the BOS when two lines have a contact point with similar inclines. Additionally, the direction of the CP tack changes in increased to decreased inclines of ycp based on an inverted stance phase. This overlapping stage can distinguish whether the swing limb works to the back or the front of the COG in the direction of x-axis. This point is useful for judging the influential area based on body weight and BOS. Figure 2c,f shows that the swing limb passes the stance side limb. It is assumed that the vcph is slower than vcpa because the body still remains around the Ar or Al, depending on which side the stance limb is, and the La leads the phase of Lh in the direction of the x-axis. Thus, the CP is expected to be toward the left foot or right foot in the case of the right stance and the left stance state, respectively.
Figure 3 shows a simple diagram for easily understanding the stability indices and the CP along with the dynamics of walking. The characteristics of the walking indices are indicated as mentioned above, depending on the swing phase side.

3. Simulation

3.1. Robot Design and Controller

In the simulation part, a computer-aided simulation based on MATLAB Simulink was carried out in imitation of a human walking. This walking robot is designed using a linear inverted pendulum model (3D-LIPM) based on the cart model and contact modeling [27,28,29,30,31]. Walking motion, in particular, is implemented using Model Predictive Control (MPC) to solve the time complexity. This means that the output for the ZMP tracking control must be calculated based on the future input in walking design control [27]. In robot walking, the ZMP is estimated based on the average value of the force sensors, as given in (10) and (11) corresponding to on the x-axis and y-axis, respectively. Here, n is the number of sensors on a sole, and fj means each sensor of numbering j.
x z m p W = j n x j f j j n f j ,
y z m p W = j n y j f j j n f j   ,

3.2. Results of Robot Walking

3.2.1. Joint Torque with NF

A normal force, called NF in this paper, is detected on the robot’s foot; additionally, the torques at the robot’s hip, knee, or ankle are determined. In fact, the NF (NF = fNormal + fExternal = mg + fExternal) is affected by mass (m), the acceleration of gravity (g), and the external force (fExternal). By comparing the torques at the joints with the NF, we are able to surmise which joints correspond to high percentages among the torques at joints and in which direction.
Figure 4 shows the simulation results for the NF and the torques in the right limb. The non-gray area indicates the swing period; meanwhile, the gray area shows the stance period, when the NF value is sensed from the right foot. In the right stance state, the value of fNormal oscillates quickly after the moment at which the value of τHip starts to increase, as shown by Figure 4a,b. This instant is designated as a transition moment, in which the leading limb changes from one side to the other side during a step. In Figure 4a, the torques at the hip and ankle are drawn on the yz-plane (of pitch rotations) with the NF. Equally, these torques are related to left and right walking movement. In the stance period, τHip and τAnkle are dramatically increased, and the largest absolute value of τHip is at work in the swing period. It was observed that this value occurs at the transition moment. In Figure 4b, the torques at the hip, knee and ankle are described with respect to roll angles (in xz-plane) with NF. In the stance period, all torque values—τHip, τKnee and τAnkle—begin to change greatly when fNormal becomes an oscillating wave following the transition moment. As a consequence of the torque values, it is noted that walking forward is made possible specifically by the knee torque; however, the ultimate cause of walking motion is the hip torque, in particular.

3.2.2. Stability Indices and CP

Figure 5 shows the results for the stability indices and the CP of the robot walking, where the shadow areas indicate the right stance state. As shown in Figure 5a, the COG and ZMP have a phase difference between them, and CP seems distant from the COG and ZMP as a result of being out of cycle. To show the specific details of the data with time, Figure 5b,c shows the stability indices and the CP on the x-axis and in y-axis, respectively. In Figure 5b, high values on the x-axis denote the forward direction of walking. As shown in Figure 5b, the value of CP overlaps with the value of COG, while it has an overshooting period in each step, which is caused by the fast crossing velocity. Additionally, the values of COG and CP are always higher than the value of ZMP, because the upper body is leaning forward in the robot’s posture. In Figure 5c, positive values in the y-axis indicate the left side of walking, and negative values indicate the right side of walking. As shown in Figure 5c, the COG is drawn inside the ZMP trajectory. This means that the COG well follows the BOS, including the ZMP; in other words, the stability is consistently guaranteed. However, the trace of CP is located outside of the COG and the ZMP, because the walking robot was designed based on the cart model, and the body moves forward without moving up and down, which causes more rotation in limb joints. The values regarding to the CP are predominantly affected by the rotation angles of the hip and ankle in the sagittal and transverse plane, according to the designed robot modelling and its motion control in various environments.
In summary of simulation, the xCP resembles the xCOG in the sagittal plane excepting for the sharp rising period of value. This sharp increasing period is caused by the radical changeable speed of swing limb. In the transverse plane, the yCP is different from the yCOG, since it is affected by the altered speed and trace of swing limb and the changeable rotation in the hip joints.

4. Experiment

To verify the validation of the CP, the value of CP is compared with the values of the COG and the ZMP in human walking. Foot pressure is detected by attaching four force sensors (TSND151), which are arranged on the left and right anterior (toe) and posterior (heel). In addition, joint information on the hip and ankle are sensed using a Kinect 2 based on the depth camera. The test subject is an adult female with a height of 166 cm and a foot length of 23 cm. The experimental environment considered the following assumptions:
  • The total distance for the test walk is 4 m, which is a valid length of detection for the Kinect.
  • The subject does not step on the line drawn in advance at 40 cm intervals based on the width of the subject’s average stride.

4.1. CP with Foot Pressure

The results of yCP are closely related to the results of foot pressure. This is because the foot pressure over time indicates forward movement by walking; furthermore, the value of yCP is changes dramatically when the leading limb is transmitted in walking. Figure 6 displays the relation between CP and foot pressure. The blue area refers to the right limb stance, while the red area denotes the left limb stance. The solid black line is the force value on the anterior, and the dotted line is the force value on the posterior.
The results of CP and foot pressure are shown in Figure 6a,b. With time, it is noticed that the pressure on the anterior occurs in the wake of decreasing pressure on the posterior. That is to say, the acting point of force moves from the posterior to the anterior as a result of walking forward. Furthermore, the duration of the stance in the posterior is far shorter than the duration of the stance in the anterior. When compared with the foot pressure, the point of great inversion in yCP is almost analogous to the moment at which the acting point of force is transferred from the heel into the toe.

4.2. Stability Indices with CP

The results of stability indices and CP detected from human walking are shown in Figure 7. In Figure 7a, the trajectory of CP is similar to the COG and the ZMP in the xy-plane. The inversion point of the incline of CP is at nearly the same position as the stance moment of ZMP in a single foot. Furthermore, the phase of ZMP leads the phase of COG, unlike the order in the simulation. This is because the upper body in the human is straighter than the upper body of the designed robot. In Figure 7b,c, the blue and red areas refer to the SSR (right single-stance) and the SSL (left single-stance), respectively; additionally, the area between the SSR state and the SSL state indicates the DS (double stance). Figure 7b displays the x values of CP and COG altered up and down for xZMP with time; moreover, xCP generally overlaps with xCOG. In the middle of the step, xCP occasionally possesses unsmooth points caused by the crossing speed of the leading limb when one side limb passes the other side limb. From the comparison, it can be seen that xZMP is always smaller than xCOG and xCP in the DS state. Figure 7c shows the y values for left and right, along with the positive and the negative directions with time. The yCOG is drawn inside of yZMP, as in the simulation results; however, the results for yCP are different from the simulation. The shape of yCP seems similar to the form of yCOG except for the peak point, where the direction of the slope of yCP changes dramatically. In summary, the CP results resemble the COG values overall, with the exception of the moment of inversion in CP. Additional discussion regarding experiment results and the relationship between the COG, ZMP, and CP is provided in the Discussion section.

5. Discussion

5.1. Symmetry, Balance, and Stability between Indices

In this approach, the kinematics of the swing limb is defined with the acting point being set at the hip and the end point at the ankle; as the result, footprints are made on walking route when the swinging limb touches the ground. Therefore, when the motion of the hip and ankle joints is performed symmetrically, the footprints should exhibit a symmetrical result, as shown in Figure 7. The results of CP resembled those of COG and ZMP, which were estimated by including force in the simulation and the experiment, even though the inferred CP does not directly involve the force concept. Nevertheless, the COG and the ZMP should be considered for the stability index in human walking. Because the sources of the values are different between the stability indices (COG and ZMP) and CP, the attribution of COG and ZMP can change as a result of the influence of force, which can originate from any part of the body in order to maintain stability so that the person walking does not collapse. In contrast, CP is defined based on geometrical factors, i.e., the symmetrical left and right hip and ankle joints; therefore, CP is only dependent on physical posture. Consequently, when the CP is in harmony with the conventional stability indices, it is expected that symmetry and balance in walking will be competently maintained.

5.2. Comparison between Stability Indices and CP

To cover the CP numerically, difference values were used with the COG and the ZMP. Even though the difference values between the COG and the ZMP indicate the stable states in [5], the difference values between the COG, ZMP and CP provide far more information than the binary results showing whether walking is in a stable state or not.

5.2.1. Classification of Walking State

The difference values between the COG, ZMP and CP are estimated as given in Figure 8 based on the experimental data. On the x-axis, the difference values between the COG ZMP, and CP are calculated as shown in Figure 8a. Significantly, C-Z and CP-C form a cyclic triangular wave, and CP-Z is almost constant, with the exception of some points. Two footsteps, left and right, can be interpreted as follows:
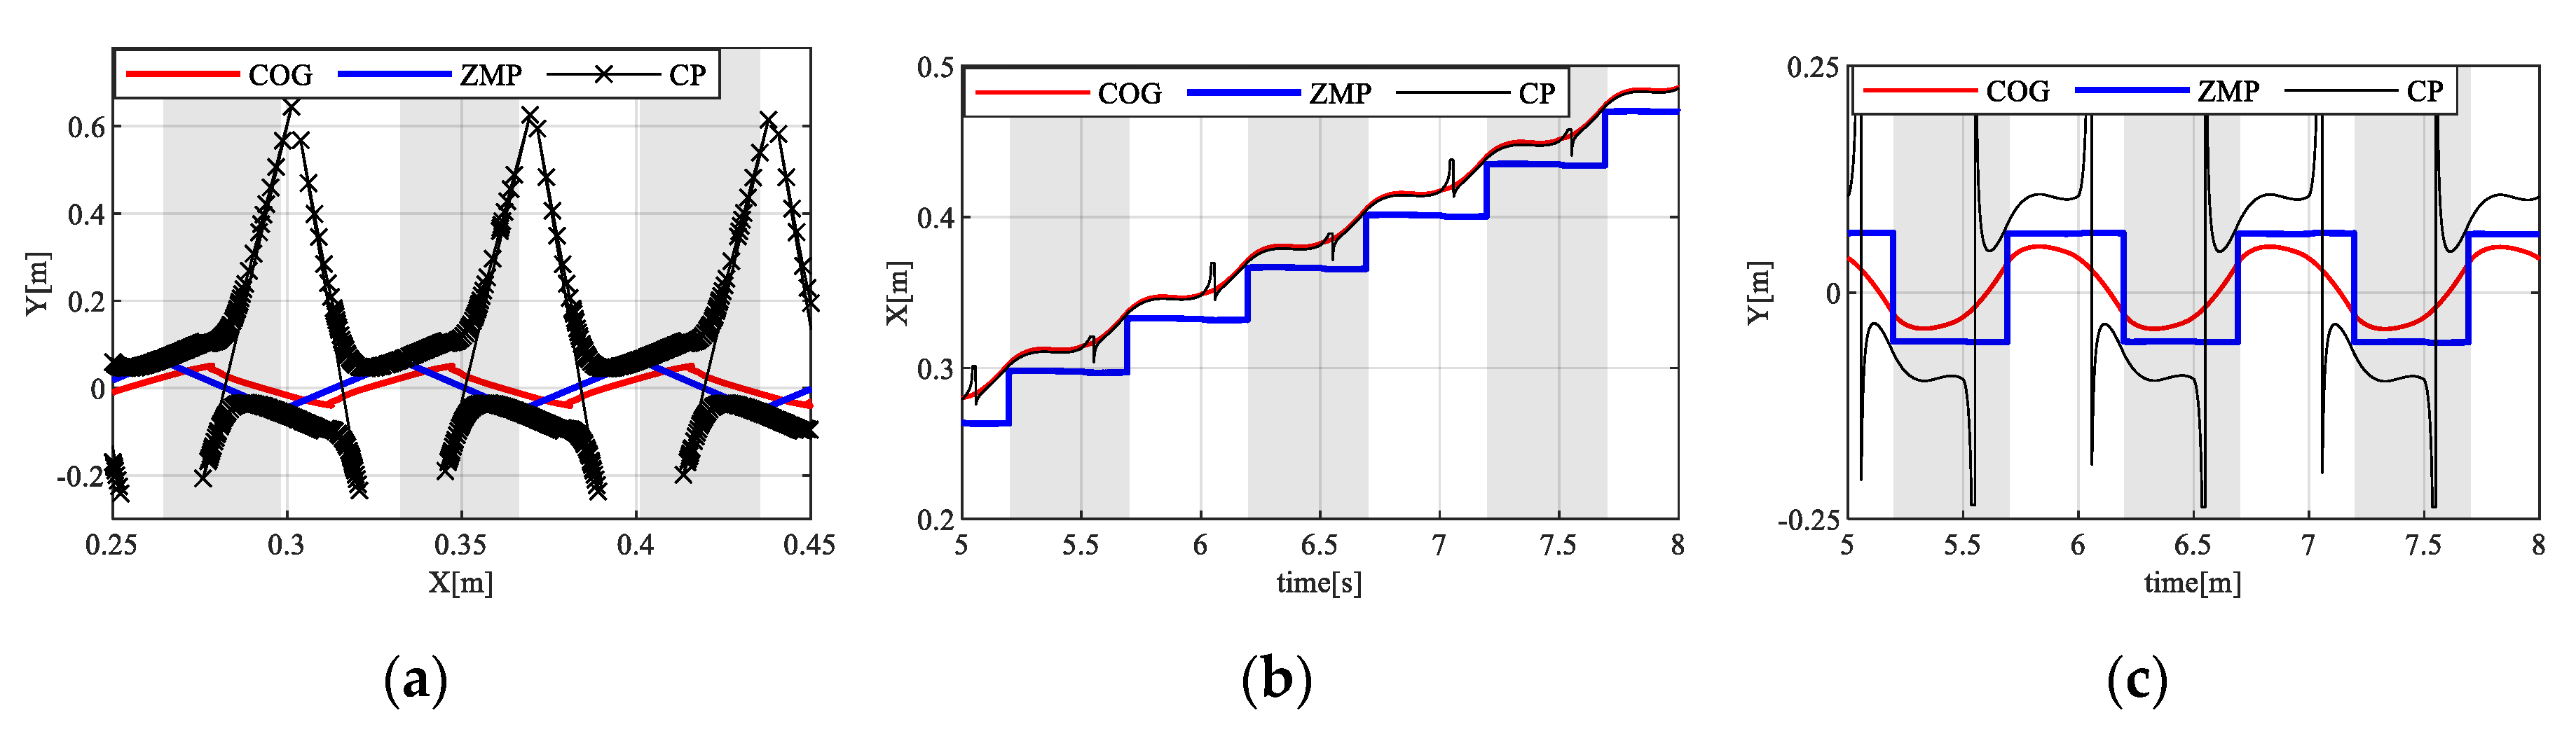
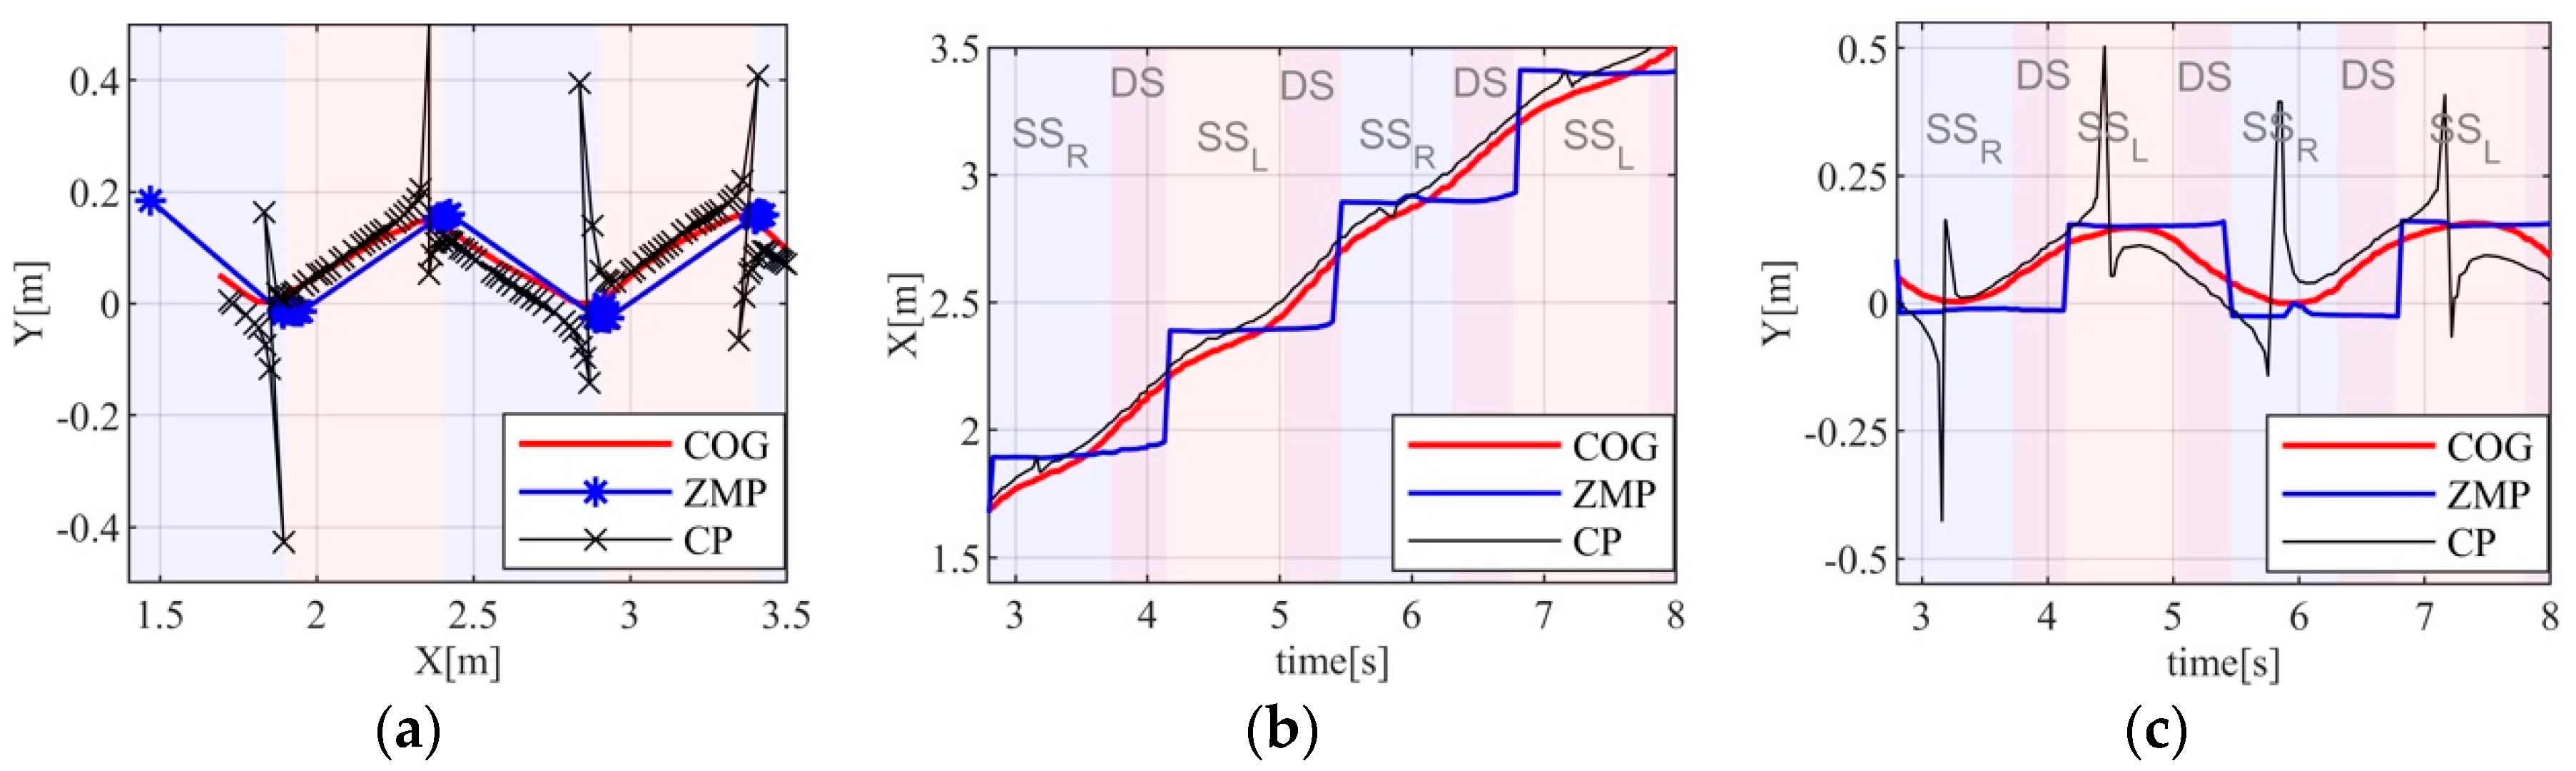
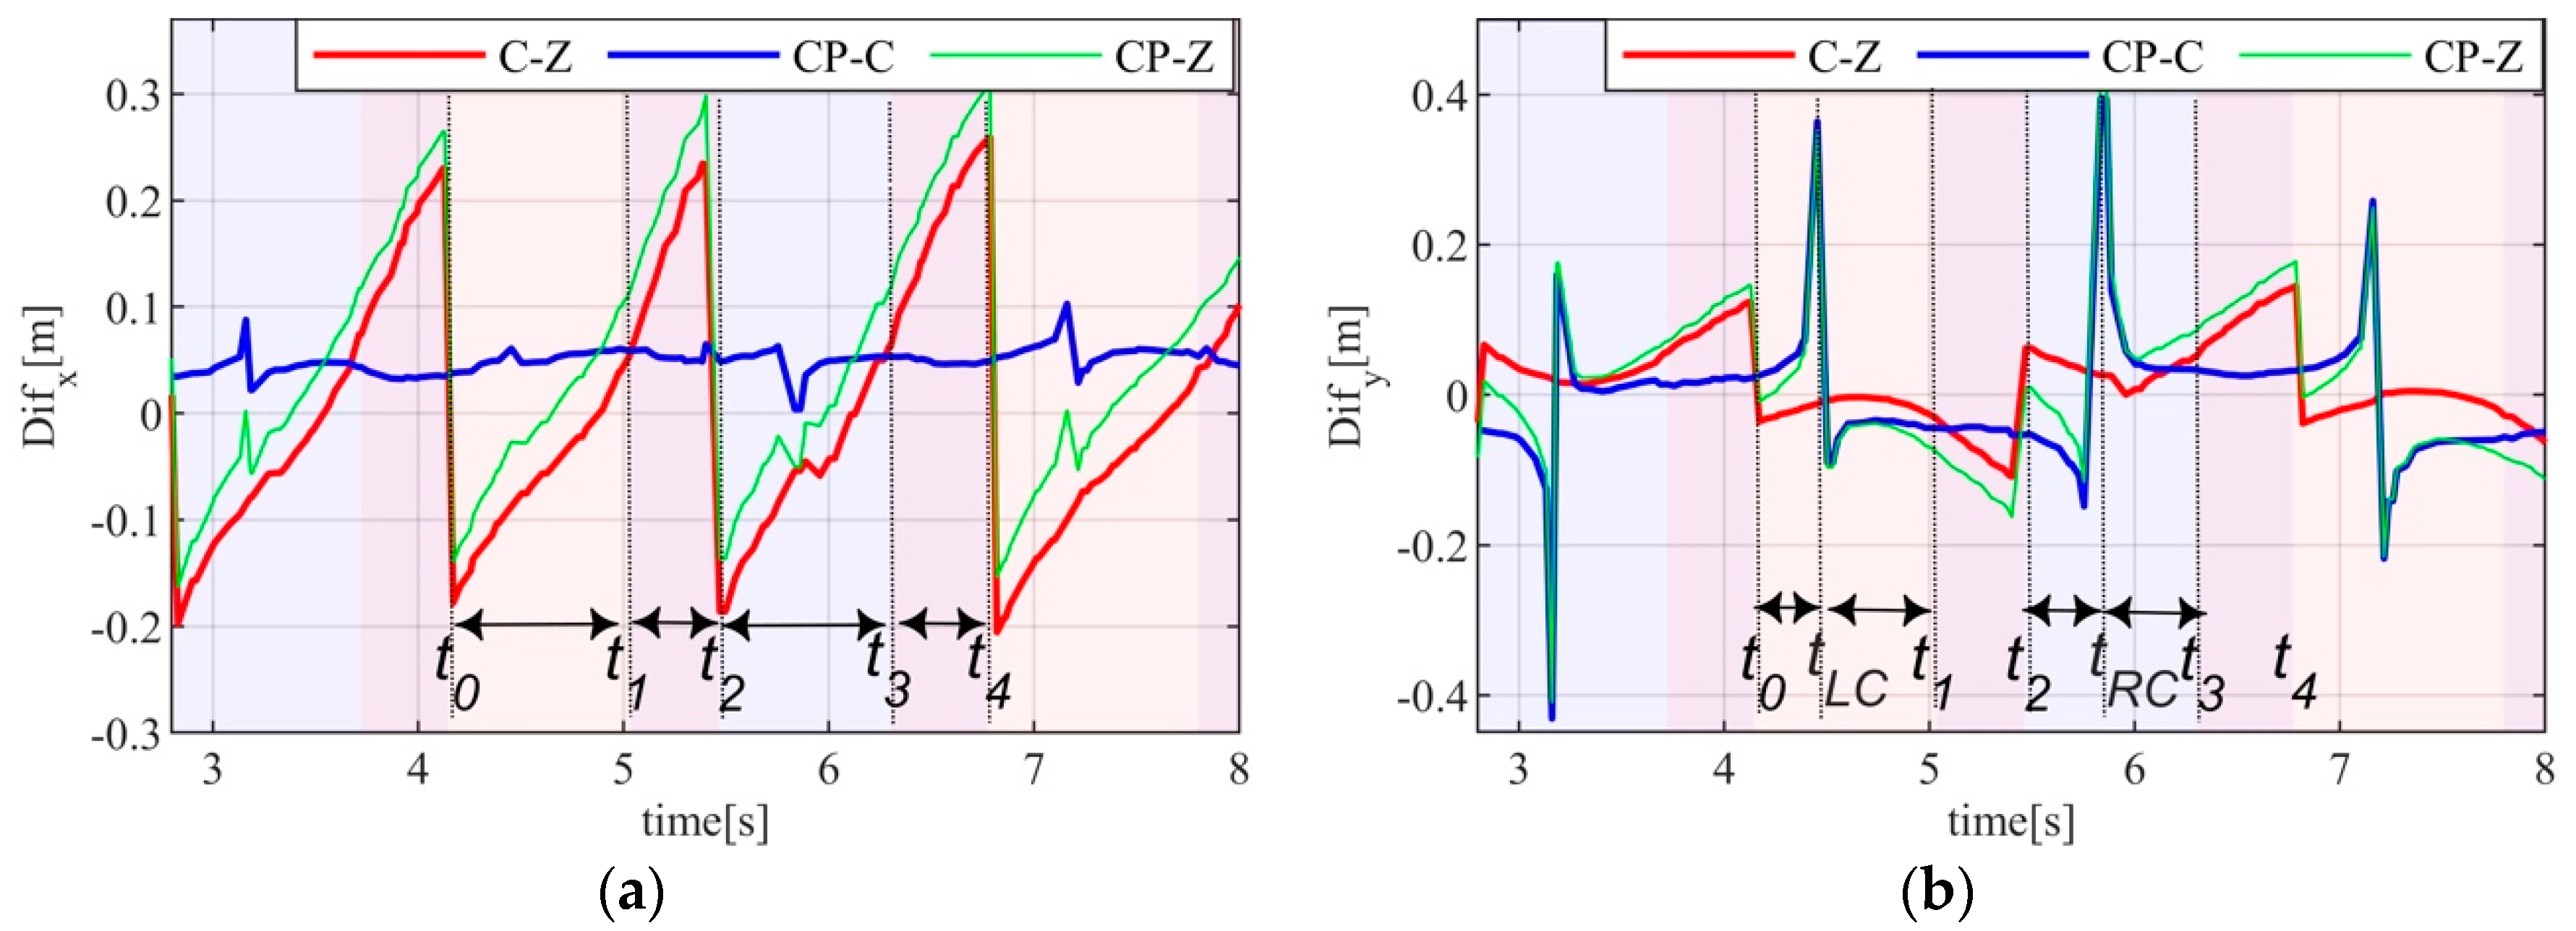
  • t0~t1 (SSL): the single stance by the left limb is from t0 of the lowest value of C-Z until t1, where C-Z is the same as CP-C.
  • t1~t2 (DS): the double stance is from t1 until t2, where C-Z or CP-Z is inverted.
  • t2~t3 (SSR): the single stance by the right limb is from t2 until t3, where C-Z is the same as CP-C.
  • t3~t4 (DS): the double stance is from t3 until t4, where C-Z or CP-Z is inverted.
On the y-axis, the difference values are estimated as given in Figure 8b. Here, the points tLC and tRC denote the transition state of the swing limb from back to forward. In the left and right single stance, the load point changes on the foot as follows:
  • t0~tLC (HPL): the load point is on the heel in SSL from t0 until tLC, where the values of CP-C and CP-Z go down sharply.
  • TLC~t1 (TPL): the load point is on the toe in SSL from tLC until t1.
  • t2~tRC (HPR): the load point is on the heel in SSR from t2 until tRC, where the values of CP-C and CP-Z increase dramatically.
  • tRC~t3 (TPR): the load point is on the toe in SSR from tRC until t3.
Figure 9 summarizes the above results for two steps from the SSL and the SSR to the DS. HS and the HO refer to a heel-strike and a heel-off with a prefix R(right) or L(left), respectively. Furthermore, TS and the TO denote the toe-strike and toe-off, respectively, with the prefixes R and L corresponding to right and left, respectively. One step from a side-SS to the DS is defined as being from 0 to 100%. A point of note is the T state, where the force position is inverted from the HPL(R) (period of pressure on heel) to the TPL(R) (period of pressure on toe) in walking. The T state clearly indicates a change in the incline value of CP, since T indicates the moment in which the swing limb passes the stance limb, as shown in Figure 7c. Moreover, this significance is reflected in the difference value with the conventional indices, as given in Figure 8b.
In summary, the walking state described using the difference values of COG, ZMP and CP is more segmentalized than using the difference values between COG and ZMP only. With respect to specific categories, the difference values in the x-axis with regard to walking direction clarify the SSL, SSR, and DS; on the other hand, the difference values in the y-axis for left and right indicate the instant of HPL, TPL, HPR, and TPR through to tLC and tRC.

5.2.2. CP with Downward Force of Body

In particular, T implies the shifting of force from the heel to the toe. The transfer of body balance resulting from the force causes the body to shift from backward to forward in the direction of walking. At this point, the value of CP can be used to help estimate when the T state will be reached, which is the moment at which the acting point of force changes.
Figure 10 displays the force on the hip and knee joints depending on the speed of walking [32]. One step is composed of the SS state (0–60%) and the DS state (60–100%), as presented in Figure 9. In the SS state, the heel touch state is the period from 0% to 20% and the toe touch state is the period from 40% to 60%. In addition, during the period 20–40%, the T moves from the HO state to the TS state in our approach. Force is largely at work on the hip and the knee joint during 0–20% and 40–60%, independent of walking speed. The reason the force is the greatest during these periods is that the body maintains its balance using only toe or heel. Thus, a greater amount of torque is generated at the hip and the knee to maintain body balance. That is to say, the T state is significant for identifying when the body segment will require additional force and when foot pressure will move from the heel to the toe.
Similarly, the authors in [33] studied the characteristics of plantar stress and its effect on the change of velocity during flat walking. The results indicated that the stress of the walking body on the ground was concentrated at the toe and the heel, and the stress of the toe increased significantly with increasing walking speed. Specifically, the role of the heel is to step on the ground first in each step and to absorb the impact from the ground. Additionally, the area of the toe connects one step to the next step smoothly and provides the impetus for the transition. Therefore, it is important to be aware of this moment in every step in order to understand the transfer of force in the foot. From this perspective, the CP is a more economical method than that used in in [33], which employed a PVDF thin film pressure acquisition system consisting of two sets of 16 piezoelectric films. With the T from the CP estimation representing the momentum, it is possible to catch when the overall arrangement of forces in the body change.

5.2.3. Comparison between Indices by SD and RMSE

An additional experiment is implemented in this section to observe the difference values of C-Z, CP-C, and CP-Z in a restricted environment and to determine which values reflect environmental factors. To analyze values on the x-axis and y-axis, 180 test cases were carried out using the same assumptions; C-Z, CP-C, and CP-Z correspond to COG-ZOP, CP-COG, and CP-ZMP, respectively. Moreover, a hurdle that differed in height as a percentage of lower limb’s height was set up intentionally to vary the movement of the hip joint. Thirty cases of walking were performed over the hurdle, the height of which was determined as a percentage of the lower limb’s height (84 cm). The hurdle heights corresponded to 0%, 10%, 20%, 30%, 40%, and 50% of limb height, and were named Case 1, Case 2, Case 3, Case 4, Case 5, and Case 6, respectively. The height of 0% in Case 1 corresponds to natural walking, with a concentration on maintaining balance. The results of this group are discussed in terms of the SD and the RMSE of C-Z, CP-C, and CP-Z. We expected that the values, including the CP, would display proportional features, depending on the changeable height of the disturbance before the implementation of experiment. However, the experimental results were a little different from our intuition, as shown in Figure 11 and Figure 12.
Figure 11 displays the SD results of the C-Z, CP-C, and CP-Z, depending on the height of the hurdle. When comparing the SD values with respect to the x value, as shown by Figure 11a,c,e, it can be seen that the SD distribution generally decreases with increasing height of the hurdle from 0 to 50%. On the other hand, in the SD results for the y values, as given in Figure 11b,d,f, the SD distribution in Figure 11b increases slowly, while most of the SD distribution in Figure 11d and in Figure 11f converge, with the exception of the values in Case 1. In particular, the SD distribution in Case 2 in Figure 11d,f is wider than others, because the 10% height in Case 2 causes human motion to take on a wide range of joint rotations, and there are many ways of maintaining forward kinematics. Additionally, the SD distributions in Case 5 and Case 6 are narrower than in the other cases, since the movement of the limbs is more restricted when the height of hurdle increases. In summary, the SD results on the x-axis are in proportion, depending on the increased movement in the lower limb’s joint, for all indices. The SD outcomes on the y-axis have a similar tendency, but only in cases with the CP.
Figure 12 shows the difference between two values among the COG, ZMP, and CP by using RMSE. As the result, the distribution values between COG and ZMP as shown in Figure 12a,b do not have a marked tendency; however, the RMSE distribution including the CP decreases with increasing height of the hurdle, as shown in Figure 12c–f. Among them, the RMSE distribution in Figure 12d,f is the largest in Case 2, for the same reason as in the SD discussion, i.e., that the walking body can be moved around more freely at 10% of the height of the limb than at other percentages of height.
In summary, with respect to the results of SD and RMSE, it can be noticed that walking in environments that cause more movement of joints can be classified based on the difference values between the COG, ZMP, and CP. This shows the potential of using CP, which is able to assist in classifying the relationship between environment and the motion of the limbs. However, the above consequence have some limitations, in that only the results in Case 2 can be excluded from the relationship between other cases. Therefore, the difference values between COG and ZMP can be considered by the numerical index to classify the walking environment based on changes in the range of joint movement.

6. Conclusions

Conventional COG and ZMP are variables for judging stability in the walking system. The concept of CP was added to these conventional indices to supplement them with additional information regarding walking symmetry, walking states (balance), and reaction in the particular environment. In general terms, CP was similar to the COG in the x-axis and y-axis; furthermore, left and right symmetry was estimated by comparing the yCOG with yCP. Moreover, in the middle of a single stance, the inverted point of the incline of CP was related to the transition period of the leading limb’s change from the HPL(R) to the TPL(R). Its period helps to carry out a specific walking analysis. In the numerical comparison using SD and the RMSE, the results showed meaningful relationships between the indices and the movement of limb joints in environment when walking over hurdles of various heights.
In conclusion, it is possible to use CP to enhance the role of COG and ZMP as integral indices, including the features of the upper and lower body. Although the studying CP is not an obvious step, because CP is estimated based on a geometrical concept, while the COG and the ZMP are calculated based on dynamics, it is nevertheless expected that the indices will compensate each other, since the CP has many similarities with the COG and the ZMP in balanced symmetrical walking. In the future, the determination of the value of CP using stability indices should be verified through lots of experiments in various environments.

Author Contributions

Conceptualization, S.K. and T.M.; methodology, S.K. and T.M.; software, S.K.; validation, S.K.; formal analysis, S.K.; data curation, S.K.; writing—original draft preparation, S.K.; writing—review and editing, S.K. and T.M.; supervision, T.M.; All authors have read and agreed to the published version of the manuscript.

Funding

This research received no external funding.

Conflicts of Interest

The authors declare no conflict of interest.

References

  1. Muro-de-la-Herran, A.; Garcia-Zapirain, B.; Mendez-Zorrilla, A. Gait analysis methods: An overview of wearable and non-wearable systems, highlighting clinical applications. Sensors (Basel) 2014, 14, 3362–3394. [Google Scholar] [CrossRef] [PubMed] [Green Version]
  2. Chunqian, F.; Xingson, W. Force-Shoes ZMP Measuring System for Human Walker. In Proceedings of the IEEE International Conference on Mechatronics and Machine Vision in Practice, Auckland, New Zealand, 2–4 December 2008; pp. 527–532. [Google Scholar]
  3. Yang, W.; Tang, C.; Chen, Y.; Xu, L. Simulation of Exoskeleton ZMP during Walking for Balance Control. In Proceedings of the IEEE International Conference on Mechanical and Intelligent Manufacturing Technologies, Cape Town, South Africa, 10–13 February 2018; pp. 172–176. [Google Scholar]
  4. Astudillo, D.; Minchala, L.I.; Astudillo-Salinas, F.; Vazquez-Rodas, A.; Gonzalez, L. A simple mapping methodology of gait biomechanics for walking control of a biped robot. In Proceedings of the IEEE International Conference on Electronics, Electrical Engineering and Computing, Lima, Peru, 8–10 August 2018; pp. 1–4. [Google Scholar]
  5. Kim, S.; Hirota, K.; Nozaki, T.; Murakami, T. Human Motion Analysis and Its Application to Walking Stabilization with COG and ZMP. IEEE Trans. Ind. Inform. 2018, 14, 5178–5186. [Google Scholar] [CrossRef]
  6. Lai, W.; Huang, H.; Chen, J. Real-time Control of a Humanoid Robot. In Proceedings of the IEEE International Conference on Advanced Robotics and Intelligent Systems, Taipei, Taiwan, 6–8 September 2018; pp. 17–23. [Google Scholar]
  7. Luo, R.; Chen, C. Quasi-Natural Humanoid Robot Walking Trajectory Generator Based on Five-Mass with Angular Momentum Model. IEEE Trans. Ind. Electron. 2018, 65, 3355–3364. [Google Scholar] [CrossRef]
  8. Guo, Z.; Wang, Z.; Yan, Z.; Zhang, L.; Ma, X.; Wu, X. Stable Control Gait Planning Strategy for A Rehabilitation Exoskeleton Robot. In Proceedings of IEEE International Conference on Mechatronics and Automation, Tianjin, China, 4–7 August 2019; pp. 1265–1270. [Google Scholar]
  9. Hong, Y. Capture Point-Bsed Controller Using Real-Time Zero Moment Point Manipulation for Stable Bipedal Walking in Human Environment. Sensors 2019, 19, 3407. [Google Scholar] [CrossRef] [PubMed] [Green Version]
  10. Kajita, S.; Benallegue, M.; Cisneros, R.; Sakaguchi, T.; Morisawa, M.; Kaminaga, H.; Kumagai, I.; Kaneko, K.; Kanehiro, F. Position-Based Lateral Balance Control for Knee-Stretched Biped Robot. In Proceedings of IEEE International Conference on Humanoid Robots, Toronto, ON, Canada, 15–17 October 2019; pp. 17–24. [Google Scholar]
  11. Ortiz, A.; Ibarra, J. Walk stability control for position-controlled servo actuated humanoid robot. In Proceedings of the IEEE International Conference on Electrical Engineering, Computing Science and Automatic Control, Mexico City, Mexico, 11–13 September 2019. [Google Scholar]
  12. Raoufi, M.; Edrisi, M. Designing a Fractional Order Back-Stepping Controller Based on GPI Observer for a 3D Biped Robot. In Proceedings of the IEEE International Conference on Robotics and Mechatronics, Tehran, Iran, 20–21 November 2019; pp. 211–216. [Google Scholar]
  13. Soliman, A.; Sendur, P.; Ugurlu, B. 3-D Dynamic Walking Trajectory Generation for a Bipedal Exoskeleton with Underactuated Legs: A Proof of Concept. In Proceedings of the IEEE International Conference on Rehabilitation Robotics, Toronto, ON, Canada, 24–28 June 2019; pp. 599–604. [Google Scholar]
  14. Tesio, L.; Rota, V. The Motion of Body Center of Mass During Walking: A Review Oriented to Clinical Applications. Front. Neurol. 2019, 10, 1–22. [Google Scholar] [CrossRef] [PubMed]
  15. Olney, S.J.; Richards, C. Hemiparetic gait following stroke. Part I: Characteristics. Gait Posture 1996, 4, 136–148. [Google Scholar] [CrossRef]
  16. Collins, S.H. Dynamic Walking Principles Applied to Human Gait. Ph.D. Thesis, The University of Michigan, Ann Arbor, MI, USA, 2008. [Google Scholar]
  17. Kiguchi, K.; Tamura, K.; Hayashi, Y. Estimation of Joint Force/Torque Based on EMG signals. In Proceedings of the 2013 IEEE Workshop on Robotic Intelligence in Informationally Structured Space, Singapore, 16–19 April 2013; pp. 20–24. [Google Scholar]
  18. Shamei, K.; Cenciarini, M.; Adams, A.; Gregorczyk, K.N.; Schiffman, J.M.; Dollar, A.M. Biomechanical Effects of Stiffness in Parallel with the Knee Joint during Walking. IEEE Trans. Biomed. Eng. 2015, 62, 2389–2401. [Google Scholar] [CrossRef] [PubMed]
  19. Fino, C.P.; Mancini, M. Phase-dependent Effects of Closed-Loop Tactile Feedback on Gait Stability in Parkinson’s disease. IEEE Trans. Neural Syst. Rehabilitation Eng. 2020, 28, 1636–1641. [Google Scholar] [CrossRef] [PubMed]
  20. Kagawa, T.; Nomura, T.; Kondo, S. Interlimb Parallel-link Powered Orthosis (IPPO): Compact Wearable Robot with Lateral Weight Bearing Mechanisms for Gait Assistance. IEEE Trans. Med. Robot. Bionics 2020, 2, 300–308. [Google Scholar] [CrossRef]
  21. Ng, K.; Mehdizadeh, S.; Iaboni, A.; Mansfield, A.; Flint, A.; Taati, B. Measuring Gait Variables Using Computer Vision to Assess Mobility and Fall Risk in Older Adults with Dementia. IEEE J. Transl. Eng. Health Med. 2020, 8, 1–9. [Google Scholar] [CrossRef] [PubMed]
  22. Bhat, S.A.; Mehbodniya, A.; Alwakeel, A.E.; Al-Begain, K. Human Motion Patterns Recognition based on RSS and Support Vector Machines. In Proceedings of the IEEE Wireless Communications and Networking Conference, Seoul, Korea, 25–28 May 2020. [Google Scholar]
  23. Meng, S.; Jin, S.; Li, J.; Hashimoto, K.; Guo, S.; Dai, S. The Analysis of Human Walking Stability Using ZMP in Sagittal Plane. In Proceedings of the IEEE International Conference on Cybernetics and Intelligent Systems, Ningbo, China, 19–21 November 2017; pp. 296–501. [Google Scholar]
  24. Available online: https://www.physio-pedia.com/Balance (accessed on 18 October 2020).
  25. Patterson, K.; Gage, W.; Brooks, D.; Black, S.E.; McIlroy, W.E. Evaluation of gait symmetry after stroke: A comparison of current methods and recommendations for standardization. Gait Posture 2010, 31, 241–246. [Google Scholar] [CrossRef] [PubMed]
  26. Sardian, P.; Bessonnet, G. Forces acting on a biped robot. Center of pressure-zero moment point. Trans. Syst. Man Cybern. Part A Syst. Hum. 2004, 34, 630–637. [Google Scholar] [CrossRef]
  27. Kajita, S.; Mastumoto, O.; Saigo, M. Real-time 3D Pattern Generation for a Biped Robot with Telescopic Legs. In Proceedings of the International Conference on Robotics & Automation, Seoul, Korea, 21–26 May 2001; pp. 2299–2306. [Google Scholar]
  28. Kajita, S.; Kanehiro, K.; Fujiwara, K.; Harada, K.; Yokoi, K.; Hirukawa, H. Biped Walking Pattern Generation by using Preview Control of Zero-Moment Point. In Proceedings of the International Conference on Robotics Automation, Taipei, Taiwan, 14–19 September 2003; pp. 1620–1626. [Google Scholar]
  29. Shourijeh, M.S.; McPhee, J. Foot-ground contact modelling within human gait simulations: From Kelvin-Voigt to hyper-volumetric model. Multibody Syst. Dyn. 2015, 35, 393–407. [Google Scholar] [CrossRef] [Green Version]
  30. Hunt, K.; Crossley, F. Coefficient of restitution interpreted as damping in vibroimpact. J. Appl. Mech. Trans. ASME 1975, 42, 440–445. [Google Scholar] [CrossRef]
  31. Available online: https://jp.mathworks.com/matlabcentral/fileexchange/64227-matlab-and-simulink-robotics-arena-walking-robot (accessed on 18 October 2020).
  32. Paul, J.P. Approaches to Design: Force actions transmitted by joints in the human body. Proc. R. Soc. Lond. Ser. B Boil. Sci. 1976, 192, 163–172. [Google Scholar]
  33. Lingyan, Z.; Shi, Z.; Lingtao, Y.; Zhiguang, G. Study on Stress Characteristics of Plantar Walking and Rehabilitation Strategy. In Proceedings of the IEEE ICCAR (International Conference on Control, Automation and Robotics), Singapore, 20–23 April 2020; pp. 553–557. [Google Scholar]
Figure 1. Walking dynamics during one cycle, which consists of two steps (left leg—solid black color, right leg—solid white color): (a) In the sagittal plane; (b) in the transverse plane.
Applsci 10 07307 g001
Figure 2. Six expected stages depending on the placement between Hr(l) and Ar(l) in the xy-plane; the red shadow area is a potential area for the CP; (ac) in the right stance state, and (df) in the left stance state: (a) Increased ycp with time; (b) overlap of La and Lh; (c) decreased ycp with time; (d) decreased ycp with time; (e) overlap of La and Lh (f) increased ycp with time.
Applsci 10 07307 g002
Figure 3. Stability indices and proposed CP in human dynamic motion (total of two cycles): (a) Human walking in sagittal plane; (b) expected ZMP trajectory in human walking; (c) expected COG trajectory; (d) line linked on hip joints; (e) line linked on ankle joints; (f) estimated CP trajectory by Lh and La.
Applsci 10 07307 g003
Figure 4. Normal force (NF) acting on the foot and pitch/roll torque value in a right limb: (a) NF and torque values according to the pitch-angle rotations in the yz-plane; (b) NF and torque values with respect to the roll-angle rotations in the xz-plane.
Applsci 10 07307 g004
Figure 5. Results of stability indices and CP detected from the robot walking simulation (red line: COG, blue line: ZMP, and black line: CP): (a) Traces of stability indices and the CP in xy-axis; (b) results of stability indices in x-axis (walking forward); (c) results of stability indices and the CP in y-axis (toward left and right).
Applsci 10 07307 g005
Figure 6. Results of foot pressure (unit: N) with CP (unit: m) detected from walking. (a) Results of right-foot pressure with CP (blue line: yCP, blue shadow: area stood by right limb); (b) results of left-foot pressure with CP (red line: yCP, red shadow: area stood by left limb).
Applsci 10 07307 g006
Figure 7. Results of stability indices and CP which are detected from the human walking (red line: COG, blue line: ZMP, and black line: CP): (a) Traces of stability indices and the CP in the xy-axis; (b) results of stability indices in x-axis (walking forward); (c) results of stability indices and the CP in y-axis (toward left and right).
Applsci 10 07307 g007
Figure 8. Difference values in stability indices and the CP to examine the relation between indices: (a) Difference values in x-time table (C-Z: value of xCOGxZMP, CP-C: value of xCPxCOG, and CP-Z: value of xCPxZMP); (b) Difference values in y-time table (C-Z: value of yCOGyZMP, CP-C: value of yCPyCOG, and CP-Z: value of yCPxZMP).
Applsci 10 07307 g008
Figure 9. Walking state in two steps: one step is indicated as being from 0 to 100%.
Applsci 10 07307 g009
Figure 10. The magnitude of the results during walking at slow, normal and fast speeds (0–20% of cycle time: heel strike, 40–60% of cycle time: toe off, 80–100% of cycle time: other heel strike) [32]: (a) Average variation during walking cycle of the resulting hip joint force; (b) average variation during walking cycle of the force transmitted to the tibio-femoral part of the knee joint.
Applsci 10 07307 g010
Figure 11. SD results of difference values of C-Z, CP-C and CP-Z according to the height percentage of lower limb (0%: Case 1; 10%: Case 2; 20%: Case 3; 30%: Case 4; 40%: Case 5; 50%: Case 6): (a) xCOGxZMP; (b) yCOGyZMP; (c) xCPxCOG; (d) yCPyCOG; (e) xCPxZMP; (f) yCPyZMP.
Applsci 10 07307 g011aApplsci 10 07307 g011b
Figure 12. RMSE results of difference values of COG, ZMP and CP according to the height percentage of lower limb (0%: Case 1; 10%: Case 2; 20%: Case 3; 30%: Case 4; 40%: Case 5; 50%: Case 6): (a) xCOGxZMP; (b) yCOGyZMP; (c) xCPxCOG; (d) yCPyCOG; (e) xCPxZMP; (f) yCPyZMP.
Applsci 10 07307 g012
Publisher’s Note: MDPI stays neutral with regard to jurisdictional claims in published maps and institutional affiliations.

