Article

Learning Better Representations for Audio-Visual Emotion Recognition with Common Information

Tsinghua-Berkeley Shenzhen Institute, Tsinghua University, Shenzhen 518055, China
*
Author to whom correspondence should be addressed.
Appl. Sci. 2020, 10(20), 7239; https://doi.org/10.3390/app10207239
Submission received: 13 September 2020 / Revised: 8 October 2020 / Accepted: 13 October 2020 / Published: 16 October 2020
(This article belongs to the Section Computing and Artificial Intelligence)

Abstract

:
Audio-visual emotion recognition aims to distinguish human emotional states by integrating the audio and visual data acquired in the expression of emotions. It is crucial for facilitating the affect-related human-machine interaction system by enabling machines to intelligently respond to human emotions. One challenge of this problem is how to efficiently extract feature representations from audio and visual modalities. Although progresses have been made by previous works, most of them ignore common information between audio and visual data during the feature learning process, which may limit the performance since these two modalities are highly correlated in terms of their emotional information. To address this issue, we propose a deep learning approach in order to efficiently utilize common information for audio-visual emotion recognition by correlation analysis. Specifically, we design an audio network and a visual network to extract the feature representations from audio and visual data respectively, and then employ a fusion network to combine the extracted features for emotion prediction. These neural networks are trained by a joint loss, combining: (i) the correlation loss based on Hirschfeld-Gebelein-Rényi (HGR) maximal correlation, which extracts common information between audio data, visual data, and the corresponding emotion labels, and (ii) the classification loss, which extracts discriminative information from each modality for emotion prediction. We further generalize our architecture to the semi-supervised learning scenario. The experimental results on the eNTERFACE’05 dataset, BAUM-1s dataset, and RAVDESS dataset show that common information can significantly enhance the stability of features learned from different modalities, and improve the emotion recognition performance.

1. Introduction

Emotion recognition is an important component in affect-related human-machine interaction systems [1,2], as emotion can provide implicit feedback about human experience and conditions that are not easily captured by the explicit input. Audio-visual emotion recognition is a common type of emotion recognition [3,4]. The comprehensive overview can be found in the surveys [5,6,7,8,9,10]. Recent works have successfully applied it for many areas, such as disease diagnosis [11,12], affective tutoring system [13,14], marketing [15,16], and entertainment [17,18]. One challenge of audio-visual emotion recognition is how to extract feature representations with an acceptable size from audio and visual data that are effective for emotion recognition. A number of previous works [19,20,21,22,23,24,25,26,27] have been proposed to tackle this challenge. Although progresses have been made by previous works, they usually suffer from the following two limitations.
First and foremost, these conventional strategies usually cannot efficiently utilize common information between different modalities by correlation analysis. For example, in [19,20,21], the common information is captured by combining the features that are learned from each modality into a feature vector. This technique often fails to exploit the complex dependencies and interactions between different modalities. Motivated by this concern, approaches [22,23,24] that are based on canonical correlation analysis (CCA) and some variant methods, such as kernel probabilistic CCA [25], sparse local discriminative CCA [26], and low-rank representation [27], are proposed. Although these methods have made some performance improvements, they may suffer from numerical issues [28,29]. This instability arises in that they need to use the inverse of the empirical covariance matrix, which easily become singular over some mini-batches. As a workaround, such methods often limit the feature dimensionality to be relatively small in order to ensure stability, which is undesirable for the complex audio-visual emotion recognition task.
Besides, some previous works use heuristic features [22,23,24,25,27] or the features learned from shallow neural network structures [19,20,21,26] for emotion recognition. For example, the widely used audio heuristic features include prosody features and voice quality features [9], while typical visual heuristic features include Gabor features and HOG-TOP features [30]. Recently, convolutional neural networks (CNNs) have become popular for extracting audio and visual features for emotion recognition [19,20,21]. However, due to the high-dimensional emotional data, the learned representations using such methods with shallow structures are not expressive enough to predict emotions, which may lead to limited performance.
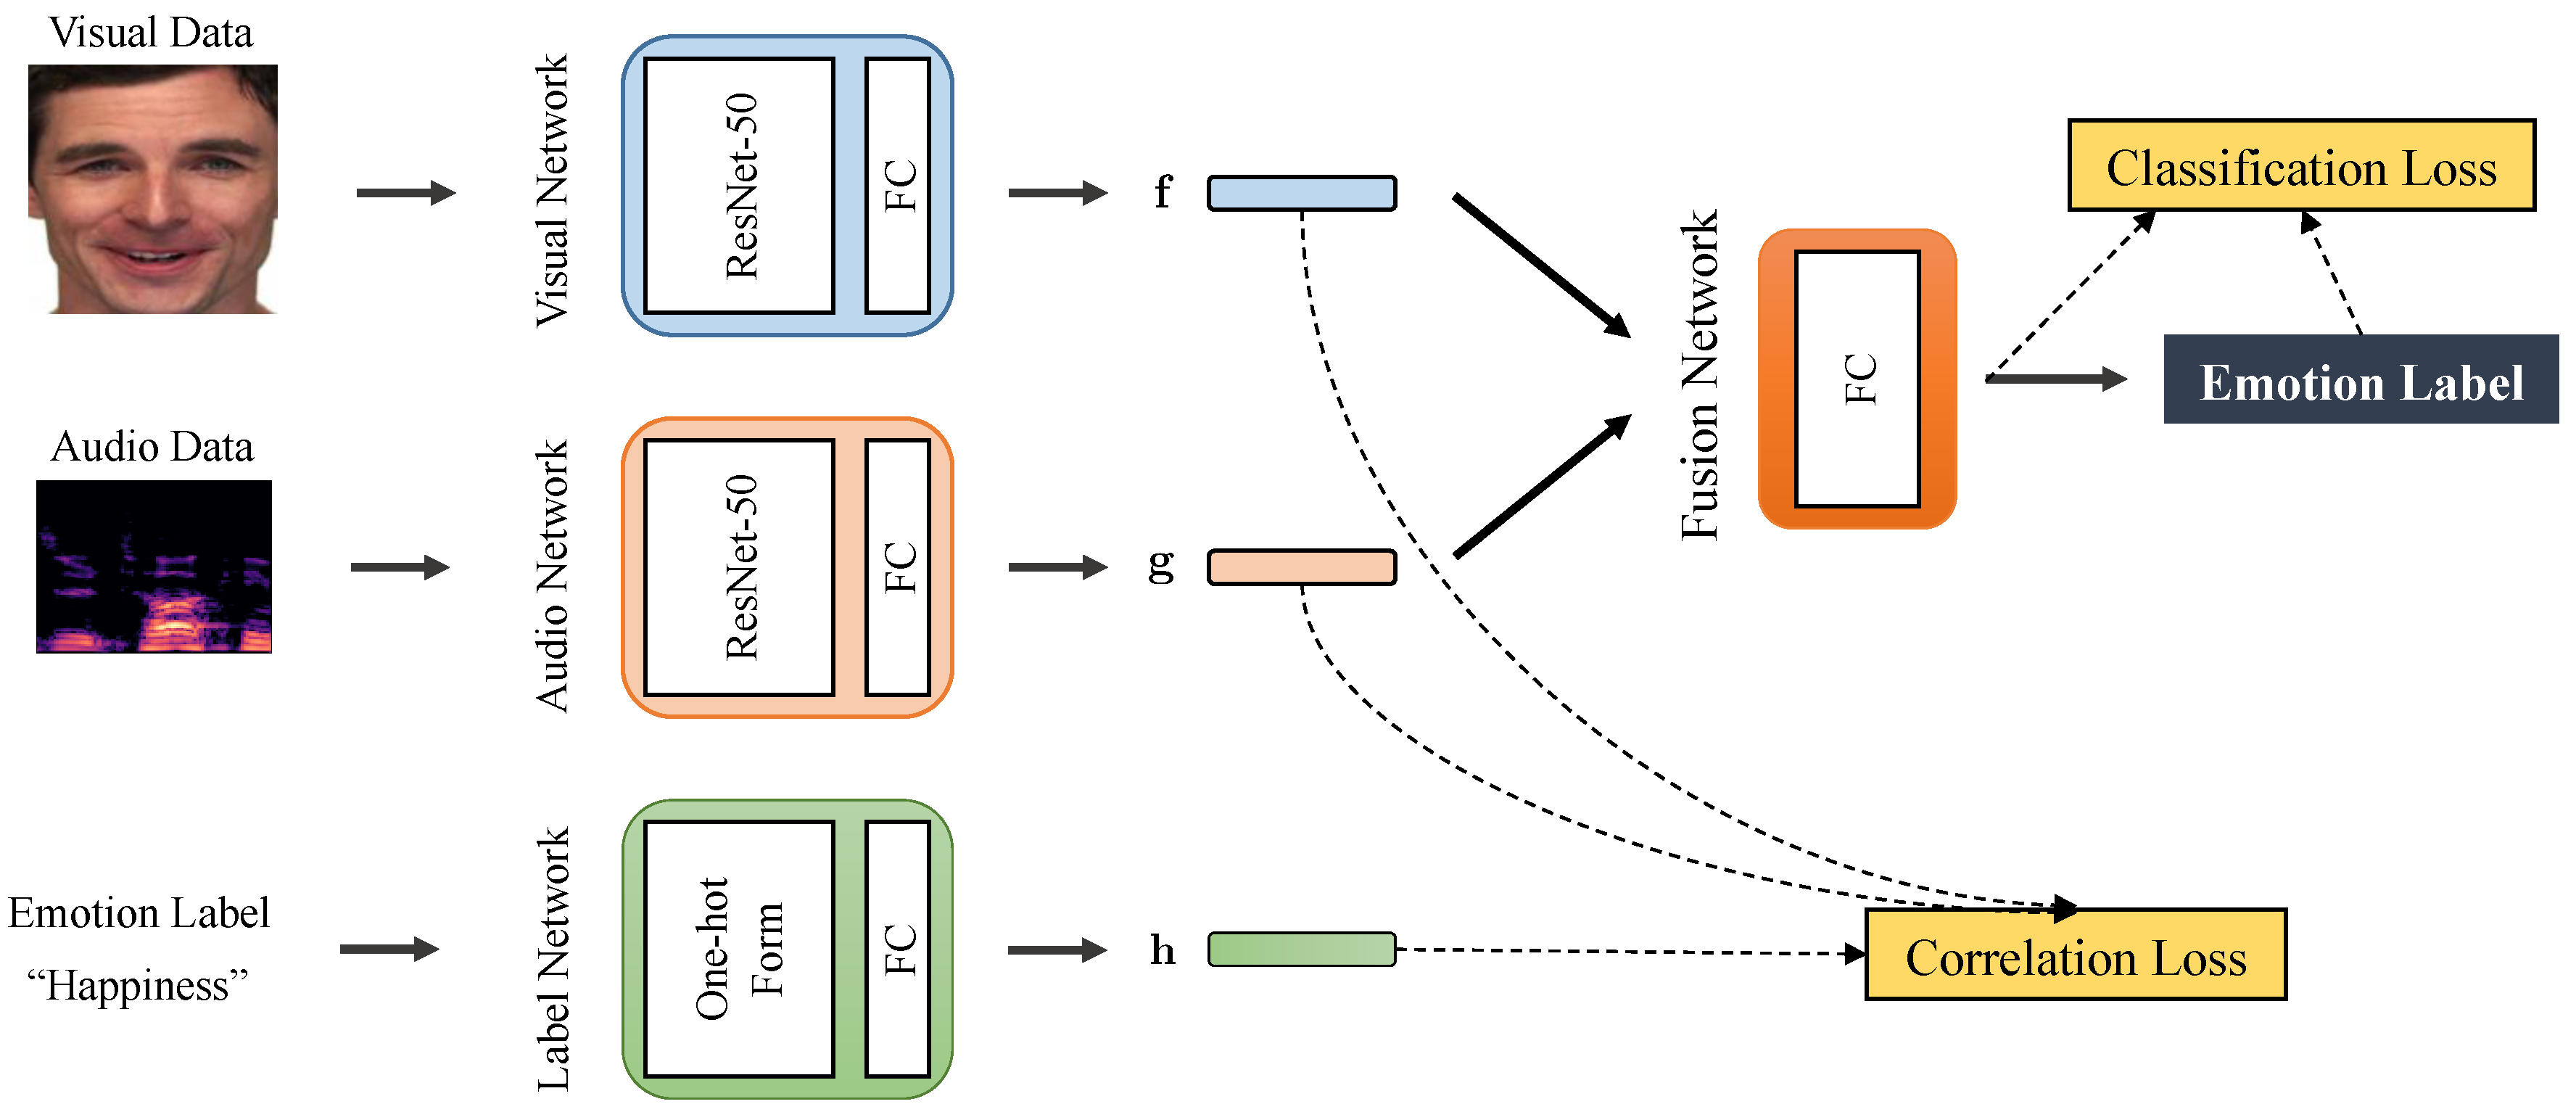
To address the above two problems, we propose an deep learning framework for audio-visual emotion recognition by efficiently utilizing common information between audio data, visual data, and the corresponding emotion labels. Figure 1 presents the structure of our system, which satisfies: (i) the highly non-linear correlation of the feature representations among audio data, visual data, and the corresponding labels should be fully analyzed in order to capture the common information, and (ii) the learned audio and visual features should have enough expressiveness to classify the emotions. By considering these two goals together, we can learn the feature representations that are fully discriminative for the emotion recognition task.
Specifically, we design an audio network and a visual network to learn the feature representations from audio and visual data, respectively, and then adopt a fusion network to combine the extracted audio and visual features for emotion prediction. Our neural network is trained by a joint loss function which is the linear combination of correlation loss and classification loss. The correlation loss is used to extract common information between audio data, visual data, and the corresponding emotion labels. We adopt common information here to describe the effectiveness of combining emotional information from different modalities by correlation analysis. It is implemented by a deep learning version of Hirschfeld-Gebelein-Rényi (HGR) maximal correlation [31,32,33], a well-known measure of dependence, to learn the maximally correlated feature representations of different modalities. The classification loss is used in order to extract discriminative information from each modality for emotion prediction. Further, we generalize our framework to the semi-supervised learning scenario. We conduct experiments on three public audio-visual datasets: eNTERFACE’05 [34], BAUM-1s [35], and RAVDESS [36]. The results demonstrate that, by capturing common information with HGR maximal correlation, our deep learning approach can significantly enhance the stability of features that are learned from different modalities and improve the emotion recognition performance.
To summarize, our main contributions are as follows:
  • We design a deep learning framework to learn the discriminative feature representations from the audio and visual data for emotion recognition.
  • We propose a correlation loss that is based on HGR maximal correlation to capture common information between audio data, visual data, and the corresponding emotion labels.
  • We generalize our framework to the semi-supervised learning scenario with common information.
  • We conduct experiments on the eNTERFACE’05, BAUM-1s, and RAVDESS datasets to demonstrate the effectiveness of our system.
To the best of our knowledge, our method is the first work to utilize HGR maximal correlation in order to extract common information between audio data, visual data, and the corresponding emotion labels for audio-visual emotion recognition. The remainder of this paper is organized, as follows. In Section 2, we describe the related works. In Section 3, we explain HGR maximal correlation. In Section 4, we introduce our approach in detail. Subsequently, we perform extensive experiments on the eNTERFACE’05, BAUM-1s, and RAVDESS datasets in Section 5. Finally, we draw conclusions and point out some future works in Section 6.

2. Related Works

Audio-visual emotion recognition is related to multimodal learning and feature extraction with deep learning. In this section, we review these two works.

2.1. Multimodal Learning

In the real world, human emotion expression has the inherent multimodality characteristic [38,39]. Multimodal learning [40,41], also referred to as multiview learning [42], is proposed to build models that can better process and relate information from multiple modalities in order to efficiently use the multimodal data similar to the emotional data [43]. One important research topic is to extract the information between different modalities to achieve better predictions, which is consistent with the common information in our paper.
The straightforward way is to concatenate the feature representations that were learned from each modality into a feature vector. Although this strategy is widely used, it often ignores the complex dependencies and interactions between different features of each modality and they may result in unsatisfactory performance [44]. Some CCA-based approaches are further proposed in order to capture the complex correlation between different modalities. It can extract the linearly maximally correlated feature mappings of two random variables. Kernel CCA [45,46] and deep CCA [47] are proposed in order to generalize CCA to non-linear setting using the kernel method and the deep neural network (DNN) respectively. Subsequently, Wang et al. [48] proposed the deep canonically correlated autoencoder (DCCAE) by combining the canonical correlation loss and the reconstruction loss of autoencoders.
HGR maximal correlation is another important measure of dependence [29]. It can extract the maximally non-linear correlated features of different modalities, showing higher efficiency than CCA. Recently, ref [28,49] implemented the HGR maximal correlation with deep learning. HGR maximal correlation and the deep learning version have become widely used [29,50,51,52]. For example, ref [52] adopted HGR maximal correlation to extract the correlation between different modalities and uses the hand-crafted features as the input for audio-visual emotion recognition while [29] considered the HGR maximal correlation in autoencoder architectures for multimodal emotion recognition.
Although HGR maximal correlation is used in the DNN methods [29,52] to compute the common information between the input audio and visual data, the emotional label information is not considered in the correlation loss, so it cannot guarantee that the learned features have sufficient discrimination ability for the emotion recognition task. Besides, the stability of common information in the deep learning models is not investigated in these methods. Here, we will sufficiently study the effectiveness of common information for emotion recognition.

2.2. Feature Extraction with Deep Learning

One key challenge in audio-visual emotion recognition is feature extraction [4,53], which decides what types of features with acceptable sizes are learned for emotion recognition. Since the success of deep learning, DNN has been gradually used to extract features and achieves better performance than traditional heuristic methods [54,55]. Here, we focus on DNN approaches for emotion recognition, which can be divided into two categories according to the type of input data: raw data-based and hand-crafted features-based.
For audio emotion recognition, some works use hand-crafted features as the input to DNN models. For example, Ma et al. [56] proposed a multi-task attention-based DNN model and feed the hand-crafted features into the model. Some works directly feed the raw data to the DNN models. For example, Chen et al. [20] designed a network with several convolutional layers to extract audio features. Tzirakis et al. [57] proposed a new CNN with Long Short-Term Memory (LSTM) for end-to-end audio emotion recognition. Fu et al. [26] used a sparse autoencoder in order to obtain the hidden features of audio data. Dai et al. [58] presented an approach to learn discriminative features from the audio data by integrating center loss in the deep learning model for audio emotion recognition.
For visual emotion recognition, most works directly send visual data to the DNN models. For example, Mollahosseini et al. [59] proposed a network that consisted of two convolutional layers, each of which was followed by max-pooling and four Inception layers. The Inception layers increased the depth and width of the network while keeping the computational budget constant. Jain et al. [60] proposed a hybrid convolution-recurrent neural network. It consists of convolution layers followed by a recurrent neural network, which can consider the temporal dependencies that exist in the facial images. Hickson et al. [61] presented an algorithm to automatically infer facial expressions by analyzing only a partially occluded face while the user is engaged in the virtual reality experience. Zhang et al. [4] employed a 3D CNN pre-trained on large-scale video classification tasks to capture the feature representations in visual data.
Besides, the representation of the input data also has a significant impact on the feature extraction process. For example, Li et al. [62] divided the visual emotion recognition methods into two categories according to the representation: static-based and dynamic-based. In static-based methods [59,63,64], two-dimensional (2D) networks are used to extract spatial information from the single facial expression image, whereas dynamic-based methods [65,66,67] use 3D networks to capture the spatial and temporal information from the facial expression sequence. Although 3D networks contain more information than 2D networks, it is difficult to choose the appropriate 3D networks that can effectively improve the emotion recognition performance. Besides, the large scale of 3D networks may lead to cumbersome training processes. Analogously, in terms of audio emotion recognition, some works [29,54] directly send the time-domain audio data into the DNN models, while other works [58,68,69] first convert the audio data into spectrum representations that are similar to the RGB images, and then feed the spectrums into deep learning models. The latter approach is considered to be more effective [69].
Recently, some popular deep learning models have been widely used, such as VGGNet [70], GoogLeNet [71], and ResNet [37]. When compared with VGGNet and GoogLeNet, ResNet has some advantages. For example, ResNet is shown to have better performance than VGGNet and GoogLeNet using a residual learning framework to ease the training of networks that are substantially deeper than those used previously [37]. Besides, ResNet has been successfully applied to audio emotion recognition [72,73,74,75] and visual emotion recognition [76,77,78,79,80]. These factors inspire us to use ResNet as the backbone of our whole network for audio-visual emotion recognition.

3. Preliminary

HGR maximal correlation can be regarded as a generalization of Pearson’s correlation [81]. For joint distributed random variables X and Y with ranges X and Y , HGR maximal correlation with k features is defined, as shown in Equation (1):
ρ ( k ) ( X , Y ) = sup f : X R k , E [ f ] = 0 , cov ( f ) = I g : Y R k , E [ g ] = 0 , cov ( g ) = I E [ f ( X ) T g ( Y ) ]
where the supremum is taken from all Borel measurable functions. Besides, 0 ρ ( k ) ( X , Y ) 1 , and ρ ( k ) ( X , Y ) = 1 represents that X is independent of Y. HGR maximal correlation can help us to extract the non-linear feature representations, f and g . From the perspective of information theory, f learned from X has the maximum information towards some aspects of Y and vice versa, which can be used to extract the common information that is shared in X and Y [28,82].
In [28,49], based on HGR maximal correlation, an objective function that can be directly used for deep learning is proposed, as shown in Equation (2):
max f , g E [ f T ( X ) g ( Y ) ] 1 2 t r ( cov ( f ( X ) ) cov ( g ( Y ) ) )
where cov ( f ( X ) ) and cov ( g ( Y ) ) represent the covariance matrix of f ( X ) and g ( Y ) , respectively. tr ( · ) represents the matrix trace operator. It is shown in [28] that Equation (2) can implement HGR maximal correlation equivalently. Inspired by this, we can design the loss function of our system based on HGR maximal correlation in order to extract the common information between different modalities.
HGR maximal correlation is appealing to multimodal learning. On the one hand, it can extract the maximally non-linear correlated features of different modalities, but the Pearson’s correlation cannot. On the other hand, it has strong efficiency in deep learning frameworks. These factors inspire us to integrate HGR maximal correlation into the deep learning model for audio-visual emotion recognition.

4. Methodology

Our goal is to efficiently learn the feature representations from audio and visual data in order to improve the emotion recognition performance with common information. To achieve the goal, we propose the system, as shown in Figure 1. In the following, we first formalize the audio-visual emotion recognition problem and, then, we present how the whole model is trained.

4.1. Problem Formulation

Here, we present the specific definition of audio-visual emotion recognition. Suppose that, in the training stage, we are given the samples ( x ( i ) , y ( i ) , z ( i ) ) x ( i ) R D x , y ( i ) R D y , z ( i ) Z = { 1 , 2 , , | Z | } , i = 1 , , m , where x ( i ) , y ( i ) , and z ( i ) , respectively, represent the visual data, audio data, and the emotion category label, such as anger, happiness, and sadness. Their corresponding random variables are denoted as X, Y, and Z. Subsequently, we use f ( X ) = f 1 ( X ) , f 2 ( X ) , , f k ( X ) T , g ( Y ) = g 1 ( Y ) , g 2 ( Y ) , , g k ( Y ) T , and h ( Z ) = h 1 ( Z ) , h 2 ( Z ) , , h k ( Z ) T to represent the k-dimensional feature functions of X, Y, and Z, respectively. We capture the HGR maximal correlation between f , g , and h , as shown in Figure 1, in order to learn the audio and visual features with common information to predict the corresponding emotions.

4.2. Model Learning

To jointly extract emotional features from audio and visual data, we propose the full loss function of the whole network, which is a linear combination of classification loss and correlation loss, defined as Equation (3):
L = L c l f + α L c o r r
The classification loss, L c l f , measures the classification performance. The correlation loss, L c o r r , measures the dependencies between audio data, visual data, and the corresponding emotion labels. The parameter α is the weight coefficient. By considering the correlation loss in the training process, our model can extract the non-linear correlated feature representations with common information in order to improve the performance of audio-visual emotion recognition.
When designing the correlation loss, most of previous works [29,52] only compute the correlation between audio data and visual data, but ignore the effect of label information, which may lead to the learned features not directly related to emotion prediction. It is significant to incorporate emotional label information into the correlation loss in order to enhance the discrimination ability of the learned feature representations. Therefore, we introduce a new form of correlation loss based on HGR maximal correlation, L c o r r , as shown in Equation (4).
L c o r r ( X , Y , Z ) = E [ f T ( X ) g ( Y ) ] + 1 2 tr ( cov ( f ( X ) ) cov ( g ( Y ) ) ) E [ f T ( X ) h ( Z ) ] + 1 2 tr ( cov ( f ( X ) ) cov ( h ( Z ) ) ) E [ g T ( Y ) h ( Z ) ] + 1 2 tr ( cov ( g ( Y ) ) cov ( h ( Z ) ) )
where the first, second, and third rows of L c o r r compute the HGR maximal correlation between f and g , f and h , g and h , respectively, which can be regarded as learning common information between audio data, visual data, and the corresponding emotion labels. By extracting the correlation among different modalities, L c o r r can ensure that our model has sufficient discrimination ability for emotion recognition. We can think the first row of L c o r r as a simple version and call it L c o r r _ s i m p l e . It only considers the HGR maximal correlation between the audio feature f and visual feature g , as shown in Equation (5).
L c o r r _ s i m p l e ( X , Y ) = E [ f T ( X ) g ( Y ) ] + 1 2 tr ( cov ( f ( X ) ) cov ( g ( Y ) ) )
Following [29], we use cross-entropy loss as the classification loss for emotion classification, as shown in Equation (6):
L c l f ( X , Y , Z ) = E [ log P Z | X Y ]
where
P Z = j | X Y ( X , Y , Z ) = exp Φ T f ( X ) , g ( Y ) θ j i = 1 | Z | exp Φ T f ( X ) , g ( Y ) θ i
where j = 1 , , | Z | , θ j represents the j-th term of the weights in the last layer of the fusion network, Φ represents the feature function of fully connected layers in the fusion network. Additionally, Φ T f ( X ) , g ( Y ) represents the function, Φ T , of the concatenation of f ( X ) and g ( Y ) . In Section 5.3.3, we will conduct experiments to consider different forms of Φ to test the stability of common information in our framework.
We can further consider the semi-supervised learning scenario [83,84], where labeled data may be expensive or time-consuming to obtain. Semi-supervised learning can help us use labeled data and unlabeled data for better emotion recognition. Suppose that, in the training process, we have labeled data ( X l , Y l , Z l ) and unlabeled data ( X u , Y u ) , where X l , Y l , and Z l , respectively, represent the labeled audio modality, labeled visual modality, and the corresponding emotional labels, and X u and Y u represent the unlabeled audio and visual modalities. We use Equation (4) in order to compute the correlation loss L c o r r with the labeled data and Equation (5) to compute the correlation loss L c o r r _ s i m p l e with the unlabeled data. The sum of correlation losses on these two parts is defined as L c o r r _ s e m i , as shown in Equation (8):
L c o r r _ s e m i ( X l , Y l , Z l , X u , Y u ) = L c o r r ( X l , Y l , Z l ) + L c o r r _ s i m p l e ( X u , Y u )
When the training data are 100% labeled, L c o r r _ s e m i will become L c o r r . Besides, we use the labeled data ( X l , Y l , Z l ) to compute the classification loss L c l f . Subsequently, we combine L c o r r _ s e m i and L c l f in the form of Equation (3) to jointly train our network for semi-supervised learning. In this way, our model can make full use of labeled data and unlabeled data for emotion recognition.

5. Experiments

In this section, we evaluate our system in the following aspects: (i) to show our approach achieves higher performance than the previous works, (ii) to show our approach can enhance the stability of features learned from audio and visual data for emotion recognition, and (iii) to show that our approach can be easily generalized to the semi-supervised learning scenario.

5.1. Datasets

We perform experiments on three audio-visual emotional datasets to evaluate the effectiveness of our approach, including eNTERFACE’05, BAUM-1s, and RAVDESS, because they are available to the research community and widely used in audio-visual emotion recognition.
The eNTERFACE’05 dataset [34] has 1287 English video samples from 42 subjects coming from 14 different nationalities. Each subject are first told to listen to six different situations, with each of them eliciting one of the following emotions: anger, disgust, fear, happiness, sadness, and surprise. They then react to each of the situations and two human experts judged whether the reaction expressed the emotion in an unambiguous way. Happiness has 213 samples, and each of the other five emotions has 216 samples. The frame rate is 25 frames per second. The audio sample rate is 48,000 Hz. In all the samples, the shortest duration is 1.12 s and the longest duration is 106.92 s. 95% samples have the duration more than 1.56 s.
The BAUM-1s dataset [35] is a spontaneous audio-visual Turkish database that contains expressions of affective as well as mental states. It has 1134 video samples from 31 subjects. The subjects are first shown a sequence of images and short video clips, which are not only meticulously fashioned, but also timed to evoke a set of emotions and mental states. Subsequently, they express their feelings and ideas about the images and video clips they have watched in their own words, without using predetermined scripts. The subjects are not guided in any way regarding how to perform the emotion. The database contains recordings reflecting the six basic emotions (anger, disgust, fear, happiness, sadness, and surprise) as well as boredom and contempt. The database also contains several mental states, namely unsure, thinking, concentrating, and bothered. Following [4], our work focuses on recognizing the six basic emotions, which have 521 video clips. To be specific, anger, disgust, fear, happiness, sadness, and surprise have 56, 80, 37, 173, 134, and 41 samples, respectively. The frame rate is 29.97 frames per second. The audio sample rate is 48,000 Hz. In all the samples, the shortest duration is 0.43 s and longest duration is 29.2 s. 95% samples have the duration more than 1.03 s.
The RAVDESS dataset [36] is a validated multimodal database of emotional speech and song. It is gender-balanced consisting of 24 professional actors (12 female, 12 male), vocalizing lexically-matched statements in a neutral North American accent. Emotional expressions are elicited while using techniques the actors are trained in, including method acting or emotional memory techniques. Here, we consider the speech video clips, which are recorded in audio-visual format with 1440 samples. It includes calm, happy, sad, angry, fearful, surprise, disgust, and neutral expressions. Each expression is produced at two levels of emotional intensity. Ratings are provided by 247 individuals who are characteristic of untrained research participants from North America. Analogously, we only consider recognizing the six basic emotions as the eNTERFACE’05 and BAUM-1s datasets, each of which has 192 samples. The frame rate is 29.97 frames per second. The audio sample rate is 48,000 Hz. In all samples, the shortest duration is 2.99 s and longest duration is 5.31 s. 95% samples have the duration more than 3.24 s.
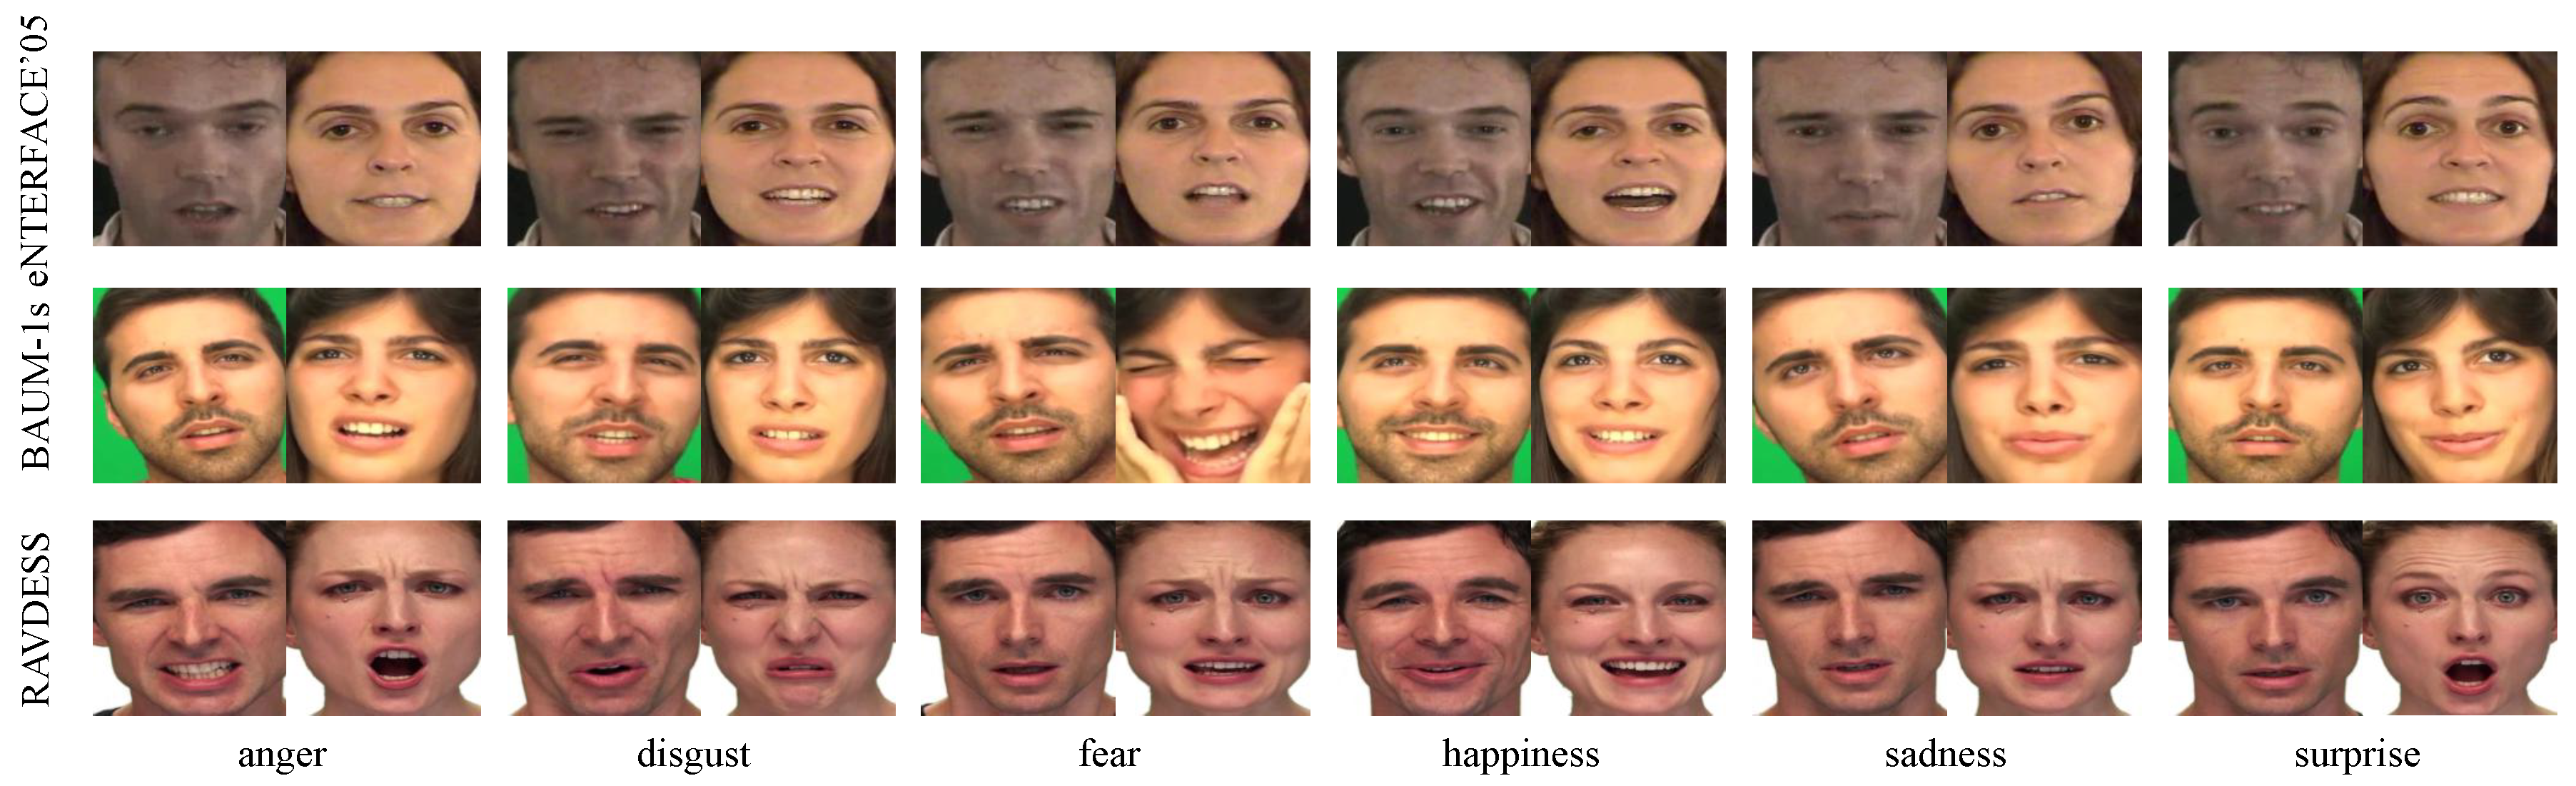
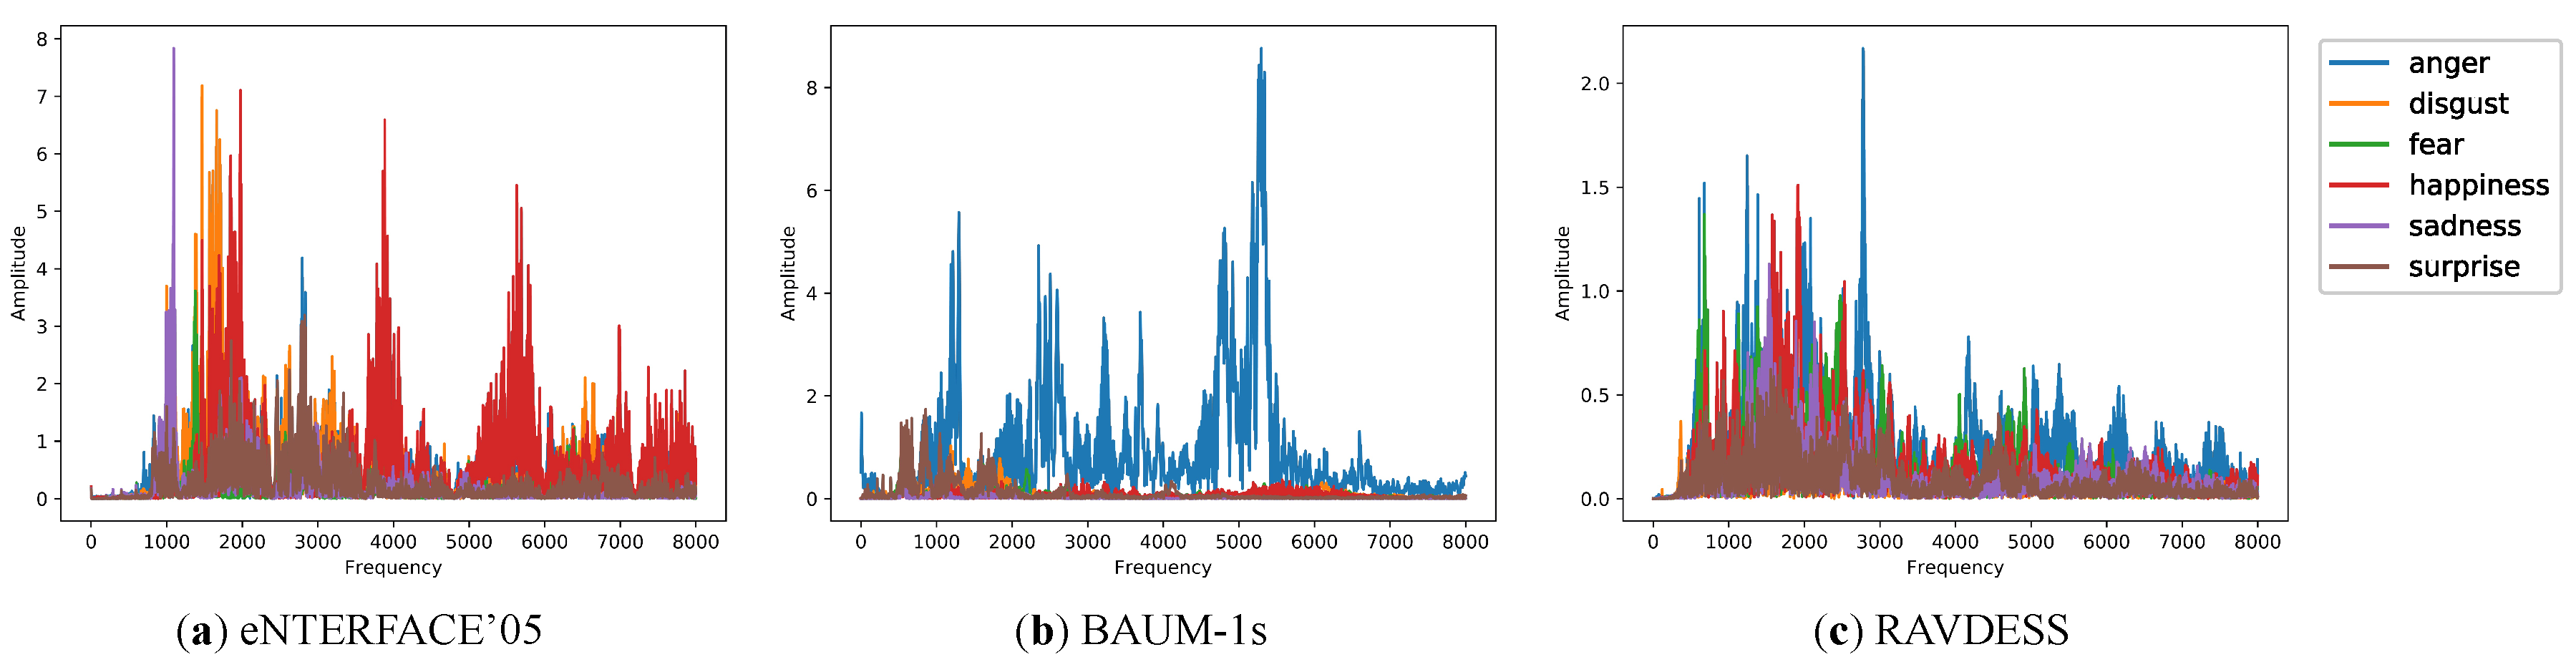
In Figure 2, we show some cropped facial images in order to illustrate the visual information of eNTERFACE’05, BAUM-1s, and RAVDESS datasets. We can also further provide the audio information of each dataset. However, the spectrogram of each sample is visually indistinguishable. Here, we statistically average the spectrograms of different samples that belong to the same class, as shown in Figure 3. It can be found that both visual information and audio information can differentiate emotions on the eNTERFACE’05, BAUM-1s, and RAVDESS datasets.

5.2. Implementation Details

5.2.1. Data Preprocessing

The audio and visual data need to be extracted from emotional video samples, which always vary in time duration. We consider splitting each emotional video sample into several segments with the same length and extract audio data and visual data from them. Some previous works [4,29] use a moving window with a fixed length to segment the video samples. Additionally, the moving step of the window should also be carefully determined. Because the number of segments for each video sample depends on the time length of the corresponding video sample and the time lengths for different video samples are very different, the distribution of segmented dataset may be different from that of the original video dataset. Because of this phenomenon, such an approach may affect the final performance of audio-visual emotion recognition.
Here, we propose to randomly obtain a segment from a given video sample with a window and repeat this operation 30 times. Therefore, we can obtain 30 segments belonging to the same video sample. The label of the given video sample is used as the labels for these 30 segments. This technique can effectively ensure the distribution of the segmented dataset is consistent with that of the original dataset, and it also has the data augmentation effect. The best window size for emotion recognition is still unclear and it is reported in [85] that a segment longer than 0.25 s includes sufficient emotional information. Inspired by this, we set the window length to 0.5 s. The experimental results show that this length is suitable for emotion recognition.
Each segment usually contains several consecutive frames, which express the same emotion in a very similar way. Additionally, in [86], it is said that at the start and end of the emotional videos, that the subject usually prepares to express the emotion from the neutral state or return to the neutral state after the emotion is shown. These factors motivate us to choose the central frame in each segment as the key frame and take all key frames as the visual data. This way can effectively make the visual data contain rich emotional information for emotion classification and avoid redundancy. Subsequently, we use the MTCNN (multi-task cascaded convolutional network), as proposed in [87], to detect the human face from visual data with the squared size 160 × 160 × 3 . After the preprocessing, we feed the visual data into the visual network.
In addition, we extract the speech signals from all segments. Subsequently, we extract the log Mel-spectrogram from the speech signal for each segment as audio data. For each speech signal, we adopt 94 Mel-filter banks in order to obtain the log Mel-spectrogram with a 40 ms hanning window and a 10ms overlapping, resulting in the representation with size 94 × 94. Afterwards, we convert the representation into three channels by copying the original Mel-spectrogram to each channel. Finally, we send the audio data into the audio network.

5.2.2. Network Architecture

We use ResNet-50 [37] as the backbone architectures of the audio network and visual network. The fully connected layer before the softmax layer of ResNet-50 has 512 units, denoted as feature functions f and g in the visual network and audio network, respectively. Additionally, the weights of the two networks are initialized by copying the parameters of trained on the ImageNet dataset [88]. Inspired by [89], we first convert the emotion labels into one-hot form and then use a fully connected layer with 512 units as the label network to obtain the feature function h . We then concatenate f and g into the fusion network for emotion prediction. The fusion network has several fully connected layers. The last layer of the fusion network is the softmax layer. Each fully connected layer is followed by the ReLU function. These fully connected layers before the softmax layer in the fusion network correspond to the feature function Φ . Because common information in different layers of our deep learning model may have different performance, we consider different forms of the feature function, Φ . Specifically, we respectively make the fusion network has one, two, and four fully connected layers before the softmax layer, as shown in Figure 4. We will report the performance of different settings in Section 5.3.3. In this way, we can test the stability of common information in our deep learning model.
In [4,90], it is said that the pre-trained strategy can effectively enhance the expressiveness of the learned features. Accordingly, here, we firstly train audio and visual network separately with the cross-entropy loss function. In this way, the networks can contain sufficient discriminative information from each modality. Subsequently, we use their weights as the initial weights of our whole model for joint training.
After the emotion probabilities of each segment are predicted, the average results across all segments belonging to the same video samples are used in order to predict the video-level emotion labels.

5.2.3. Experimental Settings

In our experiments, 70% samples are used as training data, 15% samples are used as validation data, and the remaining 15% samples are used as test data. The segments that belong to the same original video sample are assigned together as the training data or validation data or test data. Each experiment is run five times and the average recognition accuracy (%) is reported as the final result. We train our model while using the Adam [91] optimizer with the learning rate of 0.001. The batch size is set to 90. The number of epochs is set to 100. Pytorch [92] is used to implement our proposed model. We run the experiments on a NVIDIA TITAN V GPU card.

5.3. Experimental Results

In this section, we first show the performance of unimodal emotion recognition, show the performance of audio-visual emotion recognition, give the stability analysis of common information, and finally describe how our approach can be used for semi-supervised learning.

5.3.1. Unimodal Performance

To show the effectiveness of the learned audio and visual feature representations, we report the performance of our method in audio emotion recognition and visual emotion recognition, respectively, as shown in Table 1 and Table 2, respectively. In these two scenarios, we only use the corresponding audio network and visual network to extract the feature representations for emotion prediction. At the same time, we compare our work with previous works, which are all based on the original datasets. Some of them use hand-crafted features and some use DNN-based features.
From Table 1, we can see that our learned audio features are more discriminative for emotion recognition than the hand-crafted features [93,94] on the RAVDESS dataset and the features learned from DNN models with shallow structure [20,29] on the eNTERFACE’05 dataset. These results show that our network can effectively learn the audio features for emotion recognition. It is also worth noting that audio emotion recognition performs better on the RAVDESS dataset and eNTERFACE’05 dataset than on the BAUM-1s dataset, which indicate that the first two datasets may contain more emotional information.
From Table 2, we can also observe that our visual network performs better than the methods [20,95,96]. On the eNTERFACE’05 dataset, it can be found that our method achieves higher emotion recognition accuracy than the method [95] with hand-crafted features as input and the method [20] with raw data as input. On the RAVDESS dataset, our learned visual features yield better performance than the method [96] while using shallow DNN models with raw data as input. These results also show the visual features learned from our network have more discriminative power than previous works.

5.3.2. Multimodal Performance

We report the performance of audio-visual emotion recognition on the eNTERFACE’05, BAUM-1s, and RAVDESS datasets in order to further demonstrate the effectiveness of our system. In the meanwhile, we make a comparison with previous works, which also conduct experiments on these original datasets. Table 3 summarizes the results. To implement our architecture, we set α equal to 1 and make the fusion network have two fully connected layers on the eNTERFACE’05 dataset, set α equal to 1 and make the fusion network have one fully connected layer on the BAUM-1s dataset, set α equal to 0.1 and make the fusion network have one fully connected layer on the RAVDESS dataset.
From Table 3, we can find that our method is competitive with the compared works. To be specific, on the eNTERFACE’05 dataset, the performance of our method is at least 1% higher than that of the previous methods [20,21,22,27,29,95,97,98]. On the BAUM-1s dataset, we improve the performance of the method [27] from 60.05% to 67.59%. On the RAVDESS dataset, our method performs much better than the methods [99,100] by more than 13%. It is worth noting that the method [22] combines the audio and visual features that are based on CCA and the method [27] utilizes a similar approach with low-rank representation. Our method performs better than these two methods, which show that the correlation loss we propose can learn the discriminative feature representations more effectively. Besides, most of the above methods are based on DNN models, while our method achieves better performance, which shows that the features learned from our deep learning model has more powerful expressiveness. To sum up, our deep learning method can efficiently extract the discriminative feature representations with common information in order to achieve the highest accuracies among all the compared methods.
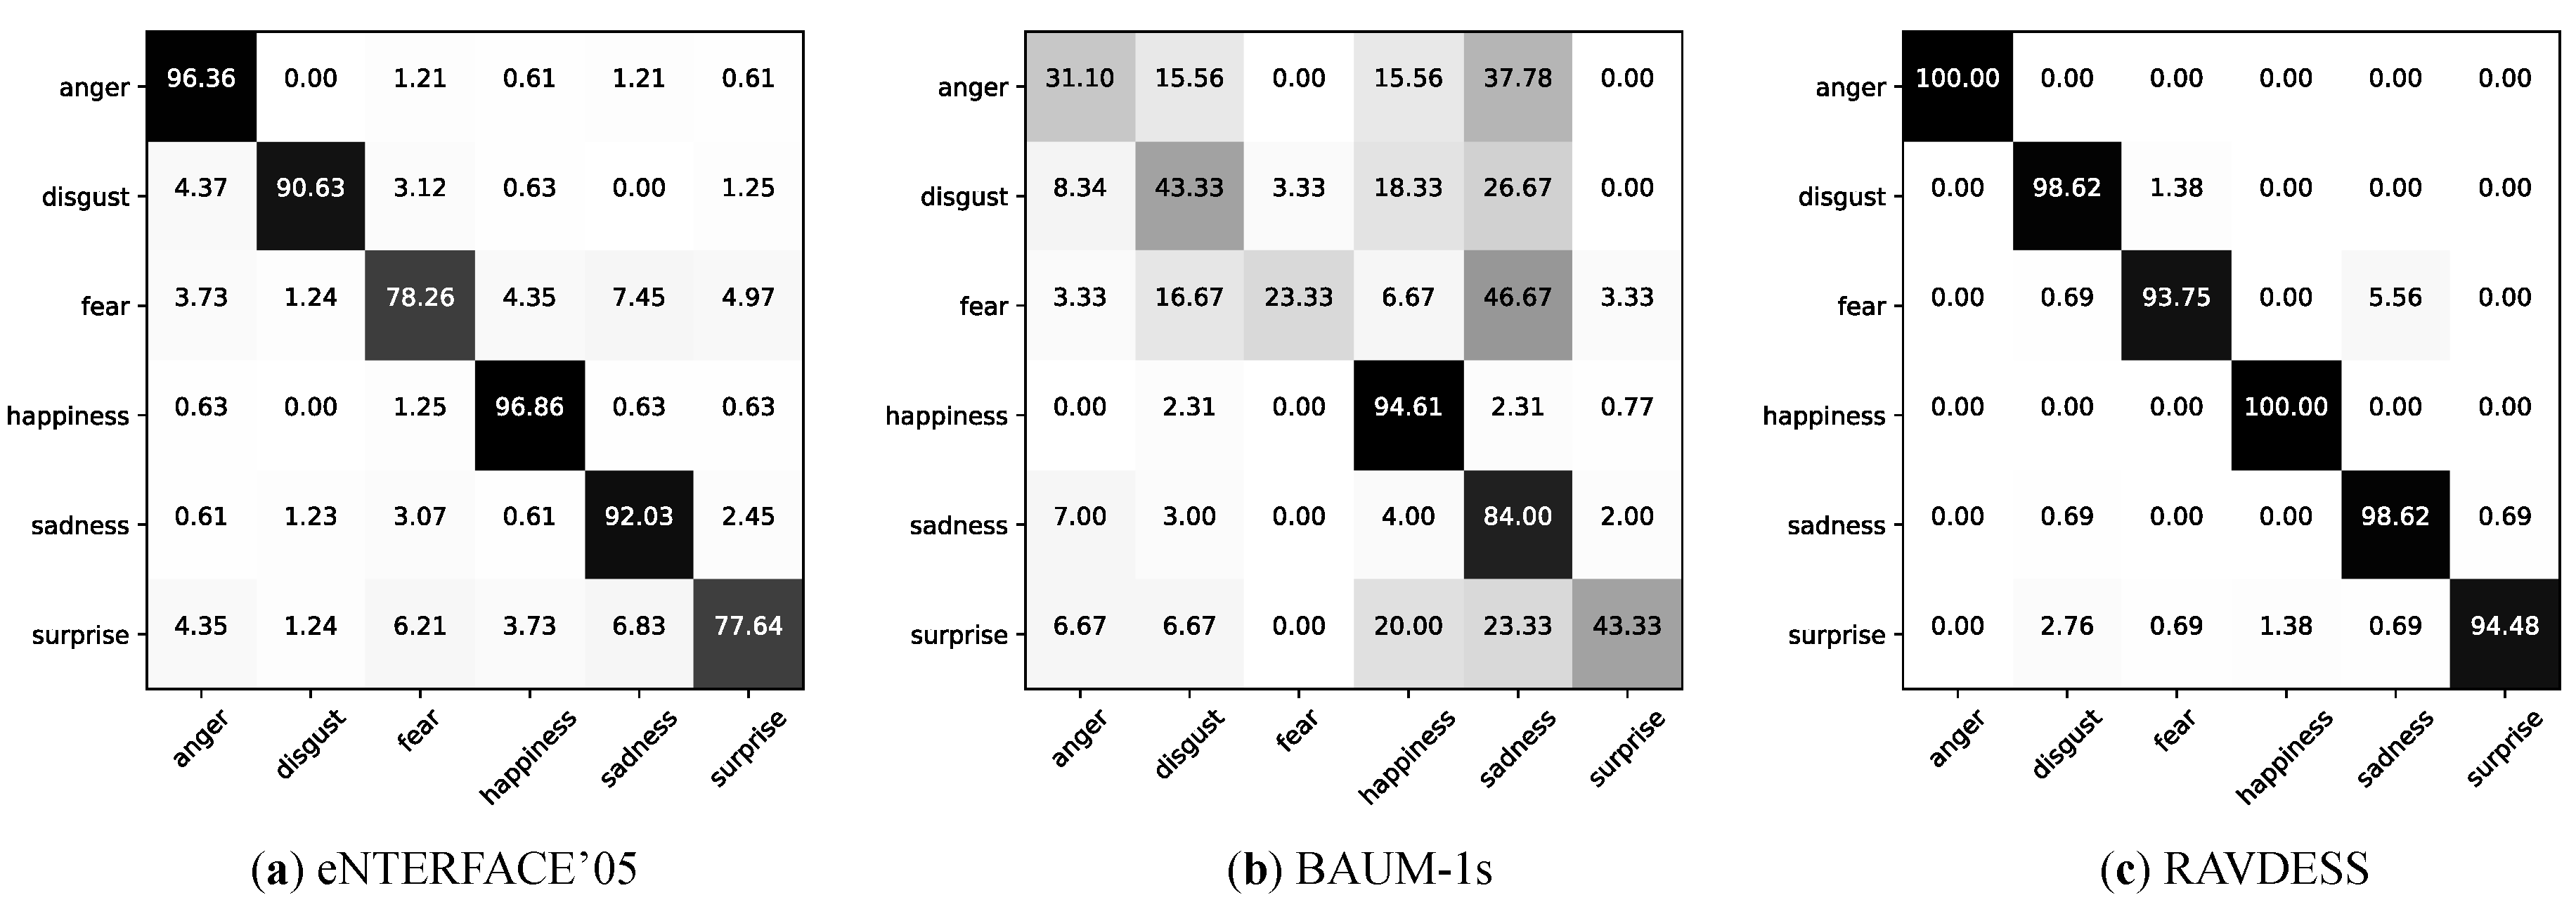
Figure 5 shows the classification confusion matrices using our method on the eNTERFACE’05, BAUM-1s, and RAVDESS datasets. It can be found that, on the eNTERFACE’05 dataset, “fear” and “surprise” are harder to be recognized when compared to other emotions. This indicates audio-visual cues of these two emotions contain less emotional information. On the BAUM-1s dataset, “happiness” achieves the highest recognition accuracy among the six emotions. However, “anger” and “fear” have lower recognition accuracies. This may be due to the small number of samples of “anger” and “fear” on the BAUM-1s dataset, which results in our model being unable to fully learn the features of “anger” and “fear” for emotion classification. On the RAVDESS dataset, both “anger” and “happiness” can be identified with 100% accuracy. Similar to the eNTERFACE’05 dataset, “fear” and “surprise” are more difficult to be recognized.
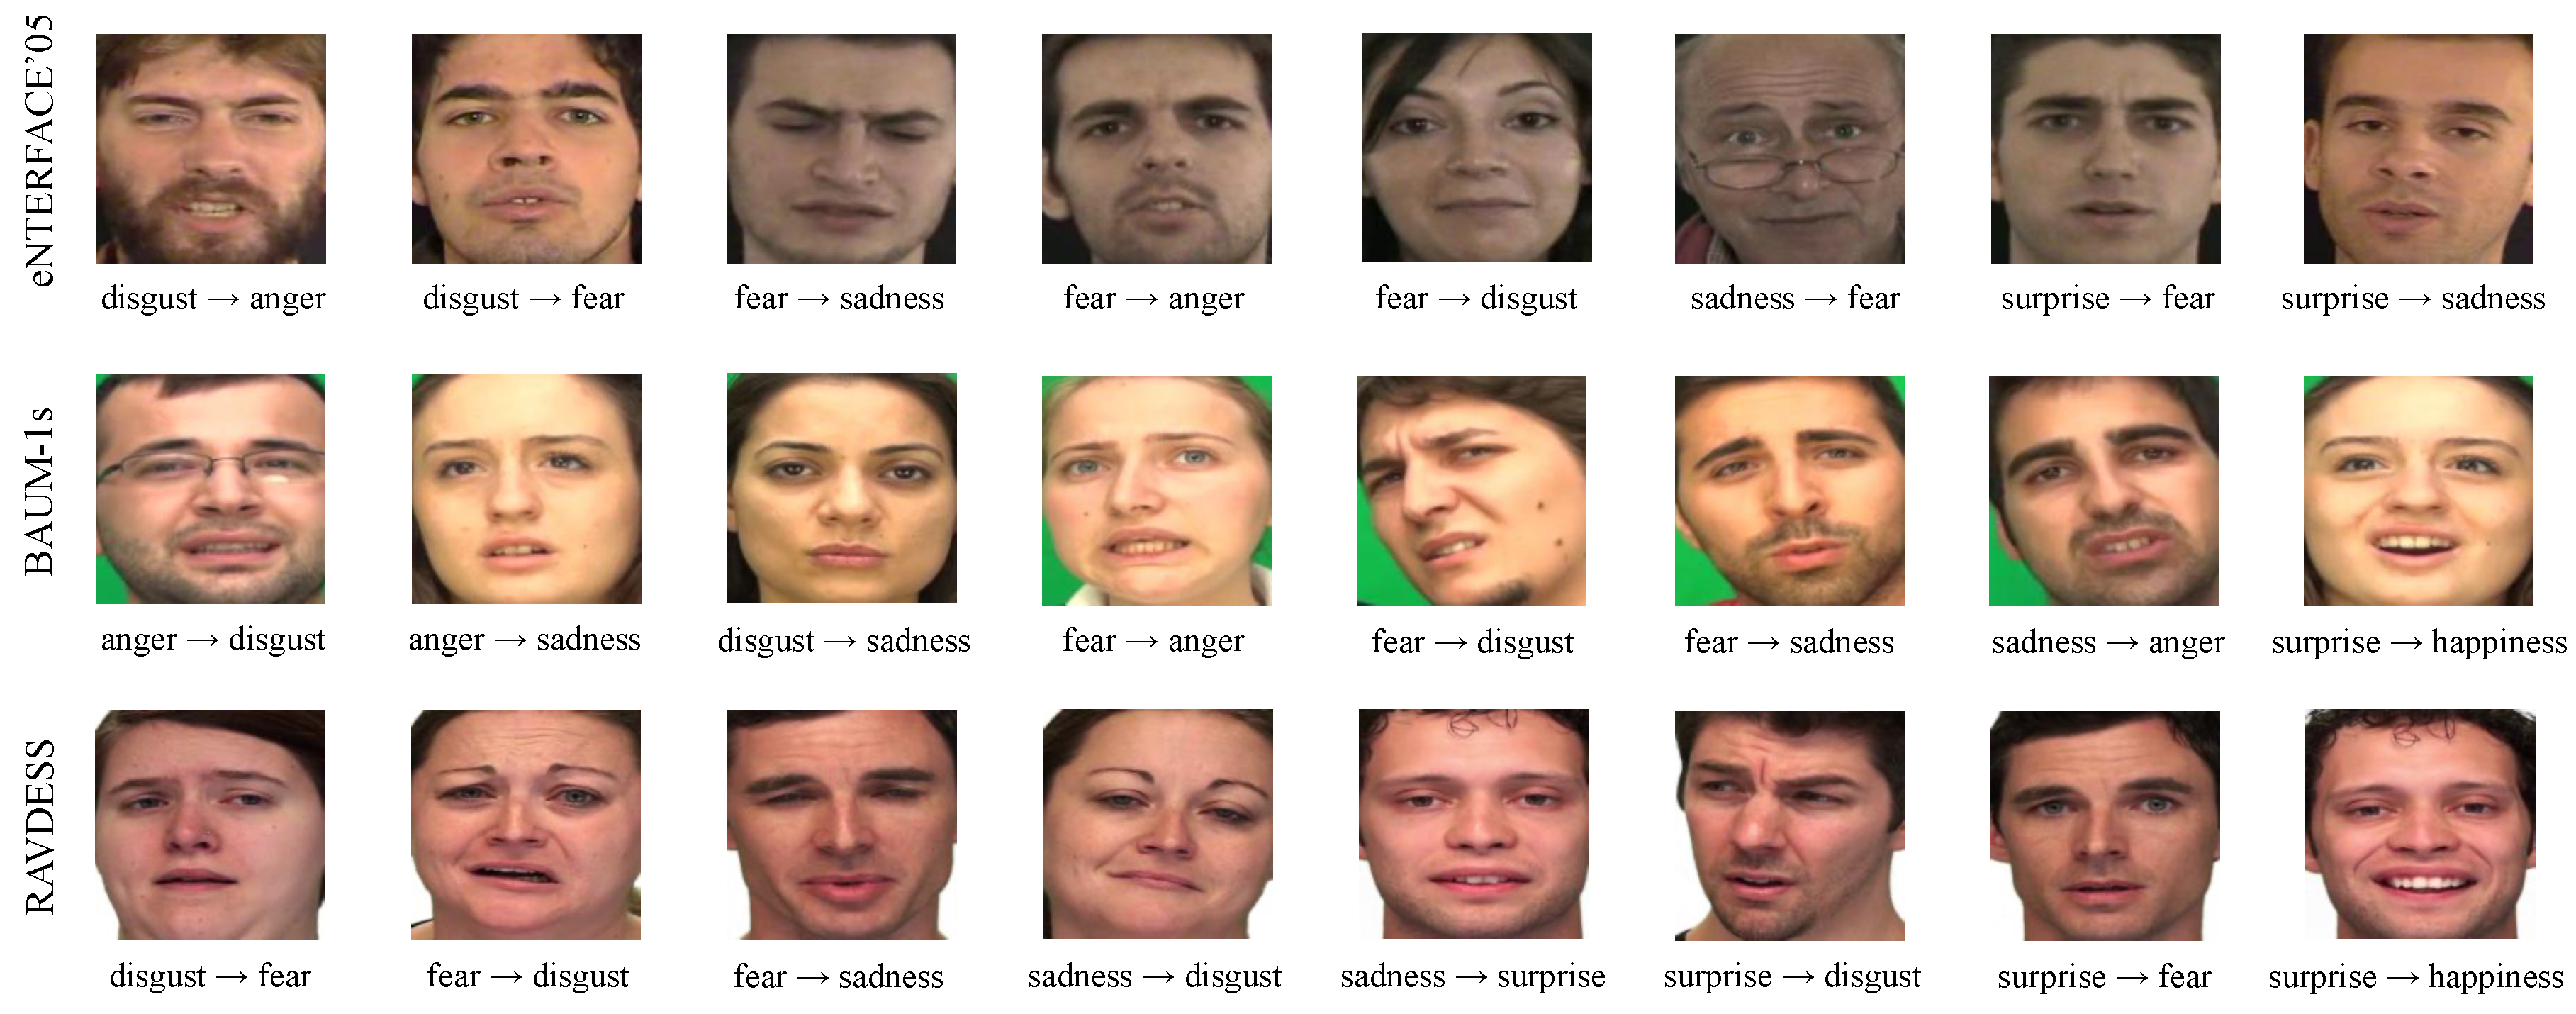
In addition to the classification confusion matrices, we show some misclassification examples on the eNTERFACE’05, BAUM-1s, and RAVDESS datasets, as shown in Figure 6. For example, on the eNTERFACE’05 dataset, “disgust” is misclassified as “anger”, “fear” is misclassified as “sadness”. On the BAUM-1s dataset, “anger” is misclassified as “disgust”, “disgust” is misclassified as “sadness”. On the RAVDESS dataset, “disgust” is misclassified as “fear” and “fear” is misclassified as “sadness”. This indicates that similar emotions on these three datasets may be difficult to distinguish.

5.3.3. Stability Analysis of Common Information

From Figure 1 and Figure 4, we can see that our proposed correlation loss can make the input features of the fusion network, f and g , maximally correlated. The more fully connected layers in the fusion network, the farther common information is from the softmax output, which may lead to different emotion recognition performance. Besides, we know that α determines how the correlation loss works during the training process. Different α values will lead to different operating mechanisms of common information. Motivated by these two factors, we investigate the stability of common information in our deep learning model.
We do the following study with different settings on the eNTERFACE’05, BAUM-1s, and RAVDESS datasets, as shown in Table 4, Table 5 and Table 6. We, respectively, make the fusion network has one, two and four fully connected layers before the softmax layer, which is shown in the setting column. The baseline in the method column means that we only use classification loss for training. We compare the performance of two forms of correlation loss, one is L c o r r , the other is L c o r r _ s i m p l e , which only computes the HGR maximal correlation between the features f and g . We set α to 0.01, 0.1, 1, and 10, respectively, to implement audio-visual emotion recognition to find how the common information works. For each setting, we report the performance of L c o r r _ s i m p l e method and L c o r r method, respectively.
We have the following observations on the three datasets: (1) the accuracy of baseline methods is higher than that of audio network and visual network, which indicates that baseline methods can combine the information of audio data and visual data to some extent to improve the emotion recognition performance. (2) When compared with the baseline method, L c o r r can significantly improve the emotion recognition performance for different weight coefficients and different fully connected layers in the fusion network. This shows that the correlation loss we proposed, L c o r r , is very stable in ing audio-visual emotion recognition. (3) It should be noted that the L c o r r _ s i m p l e method can also improve emotion recognition performance, but it is weaker than L c o r r method. For example, on the eNTERFACE’05 dataset, when the fusion network has one fully connected layer, L c o r r _ s i m p l e methods with the weight coefficient of 0.1 perform worse than the baseline method. On the RAVDESS dataset, when the fusion network has four fully connected layers, L c o r r _ s i m p l e method with the weight coefficient of 0.01 also performs worse than the baseline method. (4) On the eNTERFACE’05 dataset, the highest accuracy of 88.66% is achieved when we use L c o r r and set α = 1 with two fully connected layers in the fusion network. On the BAUM-1s dataset, the highest accuracy 67.59% is achieved when we use L c o r r and set α = 1 with one fully connected layer in the fusion network. On the RAVDESS dataset, the highest accuracy 97.57% is achieved when we use L c o r r and set α as 0.1 with one fully connected layer in the fusion network. These show that our method can benefit from common information with appropriate network settings. (5) When we set the weight coefficient to 0.1 or 1 and make the fusion network has one or two fully connected layers, our model performs better on all three datasets than models with other settings.

5.3.4. Robustness Analysis on Missing Modality

In our analysis above, we assume that audio and visual data are available during the testing stage. However, when generalizing the trained models to the real-world, we may encounter modality missing scenarios, which requires a good fusion model should perform well, even if missing modality occurs during the testing process. Motivated by this, we conduct the following study on the eNTERFACE’05 dataset in order to verify the robustness of our model in the testing process.
In our architecture, we concatenate the feature f of visual data and the feature g of audio data into the fusion network for emotion classification. In order to represent the modality missing problem during testing stage, we set the feature of one modality to 0 in order to indicate that this modality is missing, and then concatenate it with the feature of another modality to predict emotion. It should be noted that features of another modality is obtained by using the model we have trained. We consider three scenarios: only audio data are missing, only visual data are missing, and audio and visual data are missing. In each scenario, we, respectively, set 20%, 50%, and 80% of test data as missing. For the third scenario, the audio and visual data are missing at half of the missing rate, respectively. For example, the missing rate of 20% means that audio and visual data are missing with 10%, respectively. We compare the performance of three methods, L c o r r , L c o r r _ s i m p l e and baseline. They have the same network structure, with two fully connected layers in the fusion network. For the L c o r r and L c o r r _ s i m p l e methods, we set α = 1 . The baseline method means that we only use classification loss for training. For each setting, we report the emotion recognition accuracy, which is shown in Figure 7.
From Figure 7, we have the following observations: (1) as the missing rate increases, the emotion recognition accuracies of L c o r r , L c o r r _ s i m p l e and baseline methods decrease. (2) In the three data missing scenarios, the downward tendency of L c o r r _ s i m p l e method with the increase of missing rate is basically consistent with that of L c o r r method, but the performance of the L c o r r _ s i m p l e method is always lower than that of the L c o r r method. (3) When compared with the L c o r r method, the performance of the baseline method decreases faster with the increase of missing rate. The gap between L c o r r method and baseline method will become more apparent as the missing rate increases, especially in the scenario where only audio data are missing. This shows that the L c o r r method is more robust to deal with missing modality problem during the testing stage.

5.3.5. Semi-Supervised Audio-Visual Emotion Recognition

Semi-supervised learning has been used in many tasks when labeled data are scarce or difficult to obtain. It assumes that, during the training process, we have some labeled data and some unlabeled data. By using these two parts of data, semi-supervised learning can help us to perform better classification than supervised learning using only labeled data. Here, we show that our method can be easily adapted to semi-supervised audio-visual emotion recognition task. We conduct experiments on the RAVDESS dataset. Specifically, we mask the labels of some training data to indicate that they are unlabeled data. For the labeled data, audio modality, visual modality, and the corresponding emotion labels are available. For the unlabeled data, only audio modality and visual modality are available. We, respectively, set 20%, 50%, 80%, and 100% of the training data as labeled data. For each semi-supervised scenario, we compare the performance of different methods. The average accuracy of each method is reported in Table 7.
In the method column of Table 7, audio means that only the audio modality in the labeled data is trained for audio emotion recognition. Visual means that only the visual modality in the labeled data is trained for visual emotion recognition. Baseline means that audio and visual modalities in the labeled data are trained by our whole network with only classification loss for audio-visual emotion recognition. L c o r r _ s i m p l e means that whether labeled data or unlabeled data, we use the correlation loss L c o r r _ s i m p l e to compute the HGR maximal correlation between audio and visual modalities. In addition, for labeled data, we use Equation (6) in order to compute the classification loss L c l f . L c o r r _ s e m i means that we use Equation (8) to compute the correlation loss L c o r r _ s e m i . Additionally, similar to L c o r r _ s i m p l e method, the classification loss L c l f is also computed using labeled data. It is worth noting that, for the L c o r r _ s i m p l e method and L c o r r _ s e m i method, classification loss and correlation loss are combined in the form of Equation (3) with the weight coefficient α to train our network together. Here, we make the fusion network have two fully connected layers to implement the baseline, L c o r r _ s i m p l e and L c o r r _ s e m i methods for audio-visual emotion recognition. By comparing with the baseline method that only uses labeled data, we can find that our proposed method L c o r r _ s e m i can effectively combine unlabeled and labeled data for audio-visual emotion recognition.
From Table 7, we have the following observations: (1) the performance of baseline method is better than that of audio method and visual method, which shows the importance of combining information of different modalities to improve the emotion recognition accuracy. (2) L c o r r _ s e m i method achieves the highest accuracy among all methods, and it shows that it can significantly improve the performance of audio-visual emotion recognition for different weight coefficients and different percentages of labels. (3) L c o r r _ s i m p l e method can also contribute to improving the performance of audio-visual emotion recognition, but it is weaker than L c o r r _ s e m i method, especially when the labels are insufficient. To sum up, our method can effectively improve the performance of audio-visual emotion recognition, showing its potential for semi-supervised learning.

6. Conclusions

In this paper, we propose an efficient deep learning approach to exploit common information between audio data, visual data, and the corresponding emotion labels for emotion recognition on the eNTERFACE’05, BAUM-1s, and RAVDESS datasets. To be specific, we design an audio network and a visual network to learn the feature representations from audio data and visual data, respectively, and then use a fusion network to combine the audio and visual features for emotional recognition. The full loss function of our whole neural network is a linear combination of correlation loss and classification loss. The former is used to extract common information between audio data, visual data, and the corresponding emotion labels with HGR maximal correlation. The latter is used to extract discriminative information from different modalities. We further generalize our framework to the semi-supervised learning scenario. The experimental results demonstrate that by combining the common information with HGR maximal correlation, our deep learning approach can significantly enhance the stability of features that are learned from different modalities, and improve the emotion recognition performance.
In the future, we will investigate the performance of our method for emotion recognition in more datasets. It is worth noting that, in the real world, both audio data and visual data may be noisy. We will further consider audio-visual emotion recognition in the noisy environment. Besides, in addition to audio and visual data, physiological signals [101,102,103] and text data [104] are important modalities for characterizing human emotions. Therefore, we will consider combining the information of these modalities for multimodal emotion recognition.

Author Contributions

Conceptualization, F.M.; methodology, F.M.; software, F.M. and W.Z.; validation, F.M., W.Z., and Y.L.; formal analysis, F.M., W.Z., and Y.L.; investigation, F.M.; resources, S.-L.H. and L.Z.; data curation, F.M.; writing–original draft preparation, F.M.; writing–review and editing, F.M., W.Z., Y.L., and S.-L.H.; visualization, F.M. and W.Z.; supervision, Y.L., S.-L.H., and L.Z.; project administration, S.-L.H.; funding acquisition, S.-L.H. All authors have read and agreed to the published version of the manuscript.

Funding

The research of Shao-Lun Huang was supported in part by the Natural Science Foundation of China under Grant 61807021, in part by the Shenzhen Science and Technology Program under Grant KQTD20170810150821146, and in part by the Innovation and Entrepreneurship Project for Overseas High-Level Talents of Shenzhen under Grant KQJSCX20180327144037831.

Conflicts of Interest

The authors declare no conflict of interest.

References

  1. Picard, R.W. Affective Computing; MIT Press: Cambridge, MA, USA, 1997. [Google Scholar]
  2. Cowie, R.; Douglas-Cowie, E.; Tsapatsoulis, N.; Votsis, G.; Kollias, S.; Fellenz, W.; Taylor, J.G. Emotion recognition in human-computer interaction. IEEE Signal Process. Mag. 2001, 18, 32–80. [Google Scholar] [CrossRef]
  3. Chen, S.; Jin, Q. Multi-modal conditional attention fusion for dimensional emotion prediction. In Proceedings of the 2016 ACM on Multimedia Conference, Amsterdam, The Netherlands, 15–19 October 2016; pp. 571–575. [Google Scholar]
  4. Zhang, S.; Zhang, S.; Huang, T.; Gao, W.; Tian, Q. Learning Affective Features With a Hybrid Deep Model for Audio–Visual Emotion Recognition. IEEE Trans. Circuits Syst. Video Technol. 2018, 28, 3030–3043. [Google Scholar] [CrossRef]
  5. Busso, C.; Deng, Z.; Yildirim, S.; Bulut, M.; Lee, C.M.; Kazemzadeh, A.; Lee, S.; Neumann, U.; Narayanan, S. Analysis of emotion recognition using facial expressions, speech and multimodal information. In Proceedings of the 6th International Conference on Multimodal Interfaces, State College, PA, USA, 13–15 October 2004; pp. 205–211. [Google Scholar]
  6. Sebe, N.; Cohen, I.; Gevers, T.; Huang, T.S. Multimodal approaches for emotion recognition: A survey. In Internet Imaging VI; International Society for Optics and Photonics: Bellingham, WA, USA, 2005; Volume 5670, pp. 56–67. [Google Scholar]
  7. Zeng, Z.; Pantic, M.; Roisman, G.I.; Huang, T.S. A survey of affect recognition methods: Audio, visual, and spontaneous expressions. IEEE Trans. Pattern Anal. Mach. Intell. 2008, 31, 39–58. [Google Scholar] [CrossRef] [PubMed]
  8. Wu, C.H.; Lin, J.C.; Wei, W.L. Survey on audiovisual emotion recognition: Databases, features, and data fusion strategies. APSIPA Trans. Signal Inf. Process. 2014, 3. [Google Scholar] [CrossRef] [Green Version]
  9. El Ayadi, M.; Kamel, M.S.; Karray, F. Survey on speech emotion recognition: Features, classification schemes, and databases. Pattern Recognit. 2011, 44, 572–587. [Google Scholar] [CrossRef]
  10. Ko, B.C. A brief review of facial emotion recognition based on visual information. Sensors 2018, 18, 401. [Google Scholar] [CrossRef]
  11. Guastella, A.J.; Einfeld, S.L.; Gray, K.M.; Rinehart, N.J.; Tonge, B.J.; Lambert, T.J.; Hickie, I.B. Intranasal oxytocin improves emotion recognition for youth with autism spectrum disorders. Biol. Psychiatry 2010, 67, 692–694. [Google Scholar] [CrossRef]
  12. Simpson, C.; Pinkham, A.E.; Kelsven, S.; Sasson, N.J. Emotion recognition abilities across stimulus modalities in schizophrenia and the role of visual attention. Schizophr. Res. 2013, 151, 102–106. [Google Scholar] [CrossRef]
  13. Wang, C.H.; Lin, H.C.K. Emotional Design Tutoring System Based on Multimodal Affective Computing Techniques. Int. J. Distance Educ. Technol. (IJDET) 2018, 16, 103–117. [Google Scholar] [CrossRef] [Green Version]
  14. Shoumy, N.J.; Ang, L.M.; Seng, K.P.; Rahaman, D.M.; Zia, T. Multimodal big data affective analytics: A comprehensive survey using text, audio, visual and physiological signals. J. Netw. Comput. Appl. 2020, 149, 102447. [Google Scholar] [CrossRef]
  15. Seng, K.P.; Ang, L.M. Video analytics for customer emotion and satisfaction at contact centers. IEEE Trans. Hum.-Mach. Syst. 2017, 48, 266–278. [Google Scholar] [CrossRef]
  16. Shukla, A. Multimodal Emotion Recognition from Advertisements with Application to Computational Advertising. Ph.D. Thesis, International Institute of Information Technology Hyderabad, Hyderabad, India, 2018. [Google Scholar]
  17. Gonçalves, V.P.; Costa, E.P.; Valejo, A.; Geraldo Filho, P.; Johnson, T.M.; Pessin, G.; Ueyama, J. Enhancing intelligence in multimodal emotion assessments. Appl. Intell. 2017, 46, 470–486. [Google Scholar] [CrossRef]
  18. Hu, X.; Bai, K.; Cheng, J.; Deng, J.q.; Guo, Y.; Hu, B.; Krishnan, A.S.; Wang, F. MeDJ: Multidimensional emotion-aware music delivery for adolescent. In Proceedings of the 26th International Conference on World Wide Web Companion, Perth, Australia, 3–7 April 2017; pp. 793–794. [Google Scholar]
  19. Zhang, S.; Zhang, S.; Huang, T.; Gao, W. Multimodal deep convolutional neural network for audio-visual emotion recognition. In Proceedings of the 2016 ACM on International Conference on Multimedia Retrieval, New York, NY, USA, 6–9 June 2016; pp. 281–284. [Google Scholar]
  20. Chen, M.; Jiang, L.; Ma, C.; Sun, H. Bimodal Emotion Recognition Based on Convolutional Neural Network. In Proceedings of the 2019 11th International Conference on Machine Learning and Computing, Zhuhai, China, 22–24 February 2019; pp. 178–181. [Google Scholar]
  21. Hossain, M.S.; Muhammad, G. Emotion recognition using deep learning approach from audio–visual emotional big data. Inf. Fusion 2019, 49, 69–78. [Google Scholar] [CrossRef]
  22. Štruc, V.; Mihelic, F. Multi-modal emotion recognition using canonical correlations and acoustic features. In Proceedings of the 2010 20th International Conference on Pattern Recognition, Istanbul, Turkey, 23–26 August 2010; pp. 4133–4136. [Google Scholar]
  23. Nemati, S.; Rohani, R.; Basiri, M.E.; Abdar, M.; Yen, N.Y.; Makarenkov, V. A Hybrid Latent Space Data Fusion Method for Multimodal Emotion Recognition. IEEE Access 2019, 7, 172948–172964. [Google Scholar] [CrossRef]
  24. Nemati, S. Canonical correlation analysis for data fusion in multimodal emotion recognition. In Proceedings of the 2018 9th International Symposium on Telecommunications (IST), Tehran, Iran, 17–19 December 2018; pp. 676–681. [Google Scholar]
  25. Sarvestani, R.R.; Boostani, R. FF-SKPCCA: Kernel probabilistic canonical correlation analysis. Appl. Intell. 2017, 46, 438–454. [Google Scholar] [CrossRef]
  26. Fu, J.; Mao, Q.; Tu, J.; Zhan, Y. Multimodal shared features learning for emotion recognition by enhanced sparse local discriminative canonical correlation analysis. Multimed. Syst. 2019, 25, 451–461. [Google Scholar] [CrossRef]
  27. Wang, Z.; Wang, L.; Huang, H. Joint low rank embedded multiple features learning for audio-visual emotion recognition. Neurocomputing 2020, 388, 324–333. [Google Scholar] [CrossRef]
  28. Wang, L.; Wu, J.; Huang, S.L.; Zheng, L.; Xu, X.; Zhang, L.; Huang, J. An efficient approach to informative feature extraction from multimodal data. In Proceedings of the AAAI Conference on Artificial Intelligence, Honolulu, HI, USA, 27 January–1 February 2019; Volume 33, pp. 5281–5288. [Google Scholar]
  29. Ma, F.; Zhang, W.; Li, Y.; Huang, S.L.; Zhang, L. An End-to-End Learning Approach for Multimodal Emotion Recognition: Extracting Common and Private Information. In Proceedings of the 2019 IEEE International Conference on Multimedia and Expo (ICME), Shanghai, China, 8–12 July 2019; pp. 1144–1149. [Google Scholar]
  30. Chen, J.; Chen, Z.; Chi, Z.; Fu, H. Facial expression recognition in video with multiple feature fusion. IEEE Trans. Affect. Comput. 2016, 9, 38–50. [Google Scholar] [CrossRef]
  31. Hirschfeld, H.O. A connection between correlation and contingency. Math. Proc. Camb. Philos. Soc. 1935, 31, 520–524. [Google Scholar] [CrossRef]
  32. Gebelein, H. Das statistische Problem der Korrelation als Variations-und Eigenwertproblem und sein Zusammenhang mit der Ausgleichsrechnung. ZAMM-J. Appl. Math. Mech. Für Angew. Math. Und Mech. 1941, 21, 364–379. [Google Scholar] [CrossRef]
  33. Rényi, A. On measures of dependence. Acta Math. Hung. 1959, 10, 441–451. [Google Scholar] [CrossRef]
  34. Martin, O.; Kotsia, I.; Macq, B.; Pitas, I. The enterface’05 audio-visual emotion database. In Proceedings of the 22nd International Conference on Data Engineering Workshops (ICDEW’06), Atlanta, GA, USA, 3–7 April 2006; p. 8. [Google Scholar]
  35. Zhalehpour, S.; Onder, O.; Akhtar, Z.; Erdem, C.E. BAUM-1: A spontaneous audio-visual face database of affective and mental states. IEEE Trans. Affect. Comput. 2017, 8, 300–313. [Google Scholar] [CrossRef]
  36. Livingstone, S.R.; Russo, F.A. The Ryerson Audio-Visual Database of Emotional Speech and Song (RAVDESS): A dynamic, multimodal set of facial and vocal expressions in North American English. PLoS ONE 2018, 13, e0196391. [Google Scholar] [CrossRef] [PubMed] [Green Version]
  37. He, K.; Zhang, X.; Ren, S.; Sun, J. Deep residual learning for image recognition. In Proceedings of the IEEE Conference on Computer Vision and Pattern Recognition, Las Vegas, NV, USA, 27–30 June 2016; pp. 770–778. [Google Scholar]
  38. Bunt, H.; Beun, R.J.; Borghuis, T. Multimodal Human-Computer Communication: Systems, Techniques, and Experiments; Springer Science & Business Media: Berlin/Heidelber, Germany, 1998; Volume 1374. [Google Scholar]
  39. Kim, Y.; Lee, H.; Provost, E.M. Deep learning for robust feature generation in audiovisual emotion recognition. In Proceedings of the 2013 IEEE International Conference on Acoustics, Speech and Signal Processing, Vancouver, BC, Canada, 26–31 May 2013; pp. 3687–3691. [Google Scholar]
  40. Moreno, R.; Mayer, R. Interactive multimodal learning environments. Educ. Psychol. Rev. 2007, 19, 309–326. [Google Scholar] [CrossRef]
  41. Ngiam, J.; Khosla, A.; Kim, M.; Nam, J.; Lee, H.; Ng, A.Y. Multimodal deep learning. In Proceedings of the 28th International Conference on Machine Learning (ICML-11), Bellevue, WA, USA, 28 June–2 July 2011; pp. 689–696. [Google Scholar]
  42. Sun, S. A survey of multi-view machine learning. Neural Comput. Appl. 2013, 23, 2031–2038. [Google Scholar] [CrossRef]
  43. Baltrušaitis, T.; Ahuja, C.; Morency, L.P. Multimodal machine learning: A survey and taxonomy. IEEE Trans. Pattern Anal. Mach. Intell. 2018, 41, 423–443. [Google Scholar] [CrossRef] [Green Version]
  44. Gong, C.; Tao, D.; Maybank, S.J.; Liu, W.; Kang, G.; Yang, J. Multi-modal curriculum learning for semi-supervised image classification. IEEE Trans. Image Process. 2016, 25, 3249–3260. [Google Scholar] [CrossRef] [Green Version]
  45. Akaho, S. A kernel method for canonical correlation analysis. arXiv 2006, arXiv:cs/0609071. [Google Scholar]
  46. Huang, S.Y.; Lee, M.H.; Hsiao, C.K. Kernel Canonical Correlation Analysis and Its Applications to Nonlinear Measures of Association and Test of Independence; Institute of Statistical Science: Academia Sinica, Taiwan, 2006. [Google Scholar]
  47. Andrew, G.; Arora, R.; Bilmes, J.; Livescu, K. Deep canonical correlation analysis. In Proceedings of the International Conference on Machine Learning, Atlanta, GA, USA, 16–21 June 2013; pp. 1247–1255. [Google Scholar]
  48. Wang, W.; Arora, R.; Livescu, K.; Bilmes, J. On deep multi-view representation learning. In Proceedings of the International Conference on Machine Learning, Lille, France, 6–11 July 2015; pp. 1083–1092. [Google Scholar]
  49. Huang, S.L.; Xu, X.; Zheng, L.; Wornell, G.W. An Information Theoretic Interpretation to Deep Neural Networks. arXiv 2019, arXiv:1905.06600. [Google Scholar]
  50. Li, L.; Li, Y.; Xu, X.; Huang, S.L.; Zhang, L. Maximal Correlation Embedding Network for Multilabel Learning with Missing Labels. In Proceedings of the 2019 IEEE International Conference on Multimedia and Expo (ICME), Shanghai, China, 8–12 July 2019; pp. 393–398. [Google Scholar]
  51. Liang, Y.; Ma, F.; Li, Y.; Huang, S.L. Person Recognition with HGR Maximal Correlation on Multimodal Data. In Proceedings of the 25th International Conference on Pattern Recognition (ICPR2020), Milan, Italy, 10–15 January 2021. [Google Scholar]
  52. Zhang, W.; Gu, W.; Ma, F.; Ni, S.; Zhang, L.; Huang, S.L. Multimodal Emotion Recognition by extracting common and modality-specific information. In Proceedings of the 16th ACM Conference on Embedded Networked Sensor Systems, Shenzhen, China, 4–7 November 2018; pp. 396–397. [Google Scholar]
  53. Noroozi, F.; Marjanovic, M.; Njegus, A.; Escalera, S.; Anbarjafari, G. Fusion of classifier predictions for audio-visual emotion recognition. In Proceedings of the 2016 23rd International Conference on Pattern Recognition (ICPR), Cancun, Mexico, 4–8 December 2016; pp. 61–66. [Google Scholar]
  54. Tzirakis, P.; Trigeorgis, G.; Nicolaou, M.A.; Schuller, B.W.; Zafeiriou, S. End-to-End Multimodal Emotion Recognition Using Deep Neural Networks. IEEE J. Sel. Top. Signal Process. 2017, 11, 1301–1309. [Google Scholar] [CrossRef] [Green Version]
  55. Eskimez, S.E.; Duan, Z.; Heinzelman, W. Unsupervised Learning Approach to Feature Analysis for Automatic Speech Emotion Recognition. In Proceedings of the 2018 IEEE International Conference on Acoustics, Speech and Signal Processing (ICASSP), Calgary, AB, Canada, 15–20 April 2018; pp. 5099–5103. [Google Scholar]
  56. Ma, F.; Gu, W.; Zhang, W.; Ni, S.; Huang, S.L.; Zhang, L. Speech Emotion Recognition via Attention-based DNN from Multi-Task Learning. In Proceedings of the 16th ACM Conference on Embedded Networked Sensor Systems, Shenzhen, China, 4–7 November 2018; pp. 363–364. [Google Scholar]
  57. Tzirakis, P.; Zhang, J.; Schuller, B.W. End-to-End Speech Emotion Recognition Using Deep Neural Networks. In Proceedings of the 2018 IEEE International Conference on Acoustics, Speech and Signal Processing (ICASSP), Calgary, AB, Canada, 15–20 April 2018; pp. 5089–5093. [Google Scholar]
  58. Dai, D.; Wu, Z.; Li, R.; Wu, X.; Jia, J.; Meng, H. Learning Discriminative Features from Spectrograms Using Center Loss for Speech Emotion Recognition. In Proceedings of the ICASSP 2019—2019 IEEE International Conference on Acoustics, Speech and Signal Processing (ICASSP), Brighton, UK, 12–17 May 2019; pp. 7405–7409. [Google Scholar]
  59. Mollahosseini, A.; Chan, D.; Mahoor, M.H. Going deeper in facial expression recognition using deep neural networks. In Proceedings of the 2016 IEEE Winter Conference on Applications of Computer Vision (WACV), Lake Placid, NY, USA, 7–10 March 2016; pp. 1–10. [Google Scholar]
  60. Jain, N.; Kumar, S.; Kumar, A.; Shamsolmoali, P.; Zareapoor, M. Hybrid deep neural networks for face emotion recognition. Pattern Recognit. Lett. 2018, 115, 101–106. [Google Scholar] [CrossRef]
  61. Hickson, S.; Dufour, N.; Sud, A.; Kwatra, V.; Essa, I. Eyemotion: Classifying facial expressions in VR using eye-tracking cameras. In Proceedings of the 2019 IEEE Winter Conference on Applications of Computer Vision (WACV), Waikoloa Village, HI, USA, 7–11 January 2019; pp. 1626–1635. [Google Scholar]
  62. Li, S.; Deng, W. Deep facial expression recognition: A survey. arXiv 2018, arXiv:1804.08348. [Google Scholar] [CrossRef] [Green Version]
  63. Shan, C.; Gong, S.; McOwan, P.W. Facial expression recognition based on local binary patterns: A comprehensive study. Image Vis. Comput. 2009, 27, 803–816. [Google Scholar] [CrossRef] [Green Version]
  64. Liu, P.; Han, S.; Meng, Z.; Tong, Y. Facial expression recognition via a boosted deep belief network. In Proceedings of the IEEE Conference on Computer Vision and Pattern Recognition, Columbus, OH, USA, 23–28 June 2014; pp. 1805–1812. [Google Scholar]
  65. Zhao, G.; Pietikainen, M. Dynamic texture recognition using local binary patterns with an application to facial expressions. IEEE Trans. Pattern Anal. Mach. Intell. 2007, 29, 915–928. [Google Scholar] [CrossRef] [PubMed] [Green Version]
  66. Jung, H.; Lee, S.; Yim, J.; Park, S.; Kim, J. Joint fine-tuning in deep neural networks for facial expression recognition. In Proceedings of the IEEE International Conference on Computer Vision, Santiago, Chile, 11–18 December 2015; pp. 2983–2991. [Google Scholar]
  67. Zhao, X.; Liang, X.; Liu, L.; Li, T.; Han, Y.; Vasconcelos, N.; Yan, S. Peak-piloted deep network for facial expression recognition. In Proceedings of the European Conference on Computer Vision, Amsterdam, The Netherlands, 8–16 October 2016; pp. 425–442. [Google Scholar]
  68. Satt, A.; Rozenberg, S.; Hoory, R. Efficient Emotion Recognition from Speech Using Deep Learning on Spectrograms. In Proceedings of the INTERSPEECH 2017, Stockholm, Sweden, 20–24 August 2017; pp. 1089–1093. [Google Scholar]
  69. Zhao, Z.; Zhao, Y.; Bao, Z.; Wang, H.; Zhang, Z.; Li, C. Deep spectrum feature representations for speech emotion recognition. In Proceedings of the Joint Workshop of the 4th Workshop on Affective Social Multimedia Computing and first Multi-Modal Affective Computing of Large-Scale Multimedia Data, Seoul, Korea, 26 October 2018; pp. 27–33. [Google Scholar]
  70. Simonyan, K.; Zisserman, A. Very deep convolutional networks for large-scale image recognition. arXiv 2014, arXiv:1409.1556. [Google Scholar]
  71. Szegedy, C.; Liu, W.; Jia, Y.; Sermanet, P.; Reed, S.; Anguelov, D.; Erhan, D.; Vanhoucke, V.; Rabinovich, A. Going deeper with convolutions. In Proceedings of the 2015 IEEE Conference on Computer Vision and Pattern Recognition (CVPR), Boston, MA, USA, 7–12 June 2015; pp. 1–9. [Google Scholar]
  72. Kim, J.; Englebienne, G.; Truong, K.P.; Evers, V. Deep Temporal Models using Identity Skip-Connections for Speech Emotion Recognition. In Proceedings of the 2017 ACM on Multimedia Conference, Mountain View, CA, USA, 23–27 October 2017; pp. 1006–1013. [Google Scholar]
  73. Tang, D.; Zeng, J.; Li, M. An End-to-End Deep Learning Framework for Speech Emotion Recognition of Atypical Individuals. In Proceedings of the Interspeech 2018, Hyderabad, India, 2–6 September 2018; pp. 162–166. [Google Scholar]
  74. Xi, Y.; Li, P.; Song, Y.; Jiang, Y.; Dai, L. Speaker to Emotion: Domain Adaptation for Speech Emotion Recognition with Residual Adapters. In Proceedings of the 2019 Asia-Pacific Signal and Information Processing Association Annual Summit and Conference (APSIPA ASC), Lanzhou, China, 18–21 November 2019; pp. 513–518. [Google Scholar]
  75. Tripathi, S.; Kumar, A.; Ramesh, A.; Singh, C.; Yenigalla, P. Focal Loss based Residual Convolutional Neural Network for Speech Emotion Recognition. arXiv 2019, arXiv:1906.05682. [Google Scholar]
  76. Hasani, B.; Mahoor, M.H. Spatio-temporal facial expression recognition using convolutional neural networks and conditional random fields. In Proceedings of the 2017 12th IEEE International Conference on Automatic Face & Gesture Recognition (FG 2017), Washington, DC, USA, 30 May–3 June 2017; pp. 790–795. [Google Scholar]
  77. Chen, Y.; Du, J.; Liu, Q.; Zeng, B. Robust Expression Recognition Using ResNet with a Biologically-Plausible Activation Function. In Pacific-Rim Symposium on Image and Video Technology; Springer: Berlin, Germany, 2017; pp. 426–438. [Google Scholar]
  78. Li, M.; Xu, H.; Huang, X.; Song, Z.; Liu, X.; Li, X. Facial expression recognition with identity and emotion joint learning. IEEE Trans. Affect. Comput. 2018. [Google Scholar] [CrossRef]
  79. Xie, W.; Jia, X.; Shen, L.; Yang, M. Sparse deep feature learning for facial expression recognition. Pattern Recognit. 2019, 96, 106966. [Google Scholar] [CrossRef]
  80. Lai, Z.; Chen, R.; Jia, J.; Qian, Y. Real-time micro-expression recognition based on ResNet and atrous convolutions. J. Ambient Intell. Hum. Comput. 2020, 1–12. [Google Scholar] [CrossRef]
  81. Makur, A.; Kozynski, F.; Huang, S.; Zheng, L. An efficient algorithm for information decomposition and extraction. In Proceedings of the 2015 53rd Annual Allerton Conference on Communication, Control, and Computing (Allerton), Monticello, IL, USA, 29 September–2 October 2015; pp. 972–979. [Google Scholar]
  82. Huang, S.; Makur, A.; Zheng, L.; Wornell, G.W. An information-theoretic approach to universal feature selection in high-dimensional inference. In Proceedings of the 2017 IEEE International Symposium on Information Theory (ISIT), Aachen, Germany, 25–30 June 2017; pp. 1336–1340. [Google Scholar]
  83. Chapelle, O.; Scholkopf, B.; Zien, A. Semi-supervised learning (chapelle, o. et al., eds.; 2006) [book reviews]. IEEE Trans. Neural Netw. 2009, 20, 542. [Google Scholar] [CrossRef]
  84. Oliver, A.; Odena, A.; Raffel, C.A.; Cubuk, E.D.; Goodfellow, I. Realistic evaluation of deep semi-supervised learning algorithms. In Proceedings of the Advances in Neural Information Processing Systems, Montreal, QC, Canada, 3–8 December 2018; pp. 3235–3246. [Google Scholar]
  85. Kim, Y.; Provost, E.M. Emotion classification via utterance-level dynamics: A pattern-based approach to characterizing affective expressions. In Proceedings of the 2013 IEEE International Conference on Acoustics, Speech and Signal Processing, Vancouver, BC, Canada, 26–31 May 2013; pp. 3677–3681. [Google Scholar]
  86. Avots, E.; Sapiński, T.; Bachmann, M.; Kamińska, D. Audiovisual emotion recognition in wild. Mach. Vis. Appl. 2019, 30, 975–985. [Google Scholar] [CrossRef] [Green Version]
  87. Zhang, K.; Zhang, Z.; Li, Z.; Qiao, Y. Joint face detection and alignment using multitask cascaded convolutional networks. IEEE Signal Process. Lett. 2016, 23, 1499–1503. [Google Scholar] [CrossRef] [Green Version]
  88. Deng, J.; Dong, W.; Socher, R.; Li, L.J.; Li, K.; Fei-Fei, L. Imagenet: A large-scale hierarchical image database. In Proceedings of the 2009 IEEE Conference on Computer Vision and Pattern Recognition, Miami, FL, USA, 20–25 June 2009; pp. 248–255. [Google Scholar]
  89. Xu, X.; Huang, S. Maximal Correlation Regression. IEEE Access 2020, 8, 26591–26601. [Google Scholar] [CrossRef]
  90. Eitel, A.; Springenberg, J.T.; Spinello, L.; Riedmiller, M.; Burgard, W. Multimodal deep learning for robust RGB-D object recognition. In Proceedings of the 2015 IEEE/RSJ International Conference on Intelligent Robots and Systems (IROS), Hamburg, Germany, 28 September–2 October 2015; pp. 681–687. [Google Scholar]
  91. Kingma, D.P.; Ba, J. Adam: A method for stochastic optimization. arXiv 2014, arXiv:1412.6980. [Google Scholar]
  92. Paszke, A.; Gross, S.; Massa, F.; Lerer, A.; Bradbury, J.; Chanan, G.; Killeen, T.; Lin, Z.; Gimelshein, N.; Antiga, L.; et al. Pytorch: An imperative style, high-performance deep learning library. In Proceedings of the Advances in Neural Information Processing Systems, Vancouver, BC, Canada, 8–14 December 2019; pp. 8026–8037. [Google Scholar]
  93. Zamil, A.A.A.; Hasan, S.; Baki, S.M.J.; Adam, J.M.; Zaman, I. Emotion Detection from Speech Signals using Voting Mechanism on Classified Frames. In Proceedings of the 2019 International Conference on Robotics, Electrical and Signal Processing Techniques (ICREST), Dhaka, Bangladesh, 10–12 January 2019; pp. 281–285. [Google Scholar]
  94. Singh, R.; Puri, H.; Aggarwal, N.; Gupta, V. An Efficient Language-Independent Acoustic Emotion Classification System. Arab. J. Sci. Eng. 2020, 45, 3111–3121. [Google Scholar] [CrossRef]
  95. Yan, J.; Zheng, W.; Xu, Q.; Lu, G.; Li, H.; Wang, B. Sparse kernel reduced-rank regression for bimodal emotion recognition from facial expression and speech. IEEE Trans. Multimed. 2016, 18, 1319–1329. [Google Scholar] [CrossRef]
  96. He, Z.; Jin, T.; Basu, A.; Soraghan, J.; Di Caterina, G.; Petropoulakis, L. Human emotion recognition in video using subtraction pre-processing. In Proceedings of the 2019 11th International Conference on Machine Learning and Computing, Zhuhai, China, 22–24 February 2019; pp. 374–379. [Google Scholar]
  97. Poria, S.; Cambria, E.; Hussain, A.; Huang, G.B. Towards an intelligent framework for multimodal affective data analysis. Neural Networks 2015, 63, 104–116. [Google Scholar] [CrossRef]
  98. Seng, K.P.; Ang, L.M.; Ooi, C.S. A combined rule-based & machine learning audio-visual emotion recognition approach. IEEE Trans. Affect. Comput. 2016, 9, 3–13. [Google Scholar]
  99. Ghaleb, E.; Popa, M.; Asteriadis, S. Multimodal and Temporal Perception of Audio-visual Cues for Emotion Recognition. In Proceedings of the 2019 8th International Conference on Affective Computing and Intelligent Interaction (ACII), Cambridge, UK, 3–6 September 2019; pp. 552–558. [Google Scholar]
  100. Mansouri-Benssassi, E.; Ye, J. Speech Emotion Recognition With Early Visual Cross-modal Enhancement Using Spiking Neural Networks. In Proceedings of the 2019 International Joint Conference on Neural Networks (IJCNN), Budapest, Hungary, 14–19 July 2019; pp. 1–8. [Google Scholar]
  101. Kim, K.H.; Bang, S.W.; Kim, S.R. Emotion recognition system using short-term monitoring of physiological signals. Med Biol. Eng. Comput. 2004, 42, 419–427. [Google Scholar] [CrossRef]
  102. Lin, Y.P.; Wang, C.H.; Jung, T.P.; Wu, T.L.; Jeng, S.K.; Duann, J.R.; Chen, J.H. EEG-based emotion recognition in music listening. IEEE Trans. Biomed. Eng. 2010, 57, 1798–1806. [Google Scholar]
  103. Kim, J.; André, E. Emotion recognition based on physiological changes in music listening. IEEE Trans. Pattern Anal. Mach. Intell. 2008, 30, 2067–2083. [Google Scholar] [CrossRef] [PubMed]
  104. Poria, S.; Chaturvedi, I.; Cambria, E.; Hussain, A. Convolutional MKL based multimodal emotion recognition and sentiment analysis. In Proceedings of the 2016 IEEE 16th International Conference on Data Mining (ICDM), Barcelona, Spain, 12–15 December 2016; pp. 439–448. [Google Scholar]
Figure 1. The structure of our proposed system for audio-visual emotion recognition. The full loss function of our framework is a linear combination of correlation loss and classification loss. Audio network and visual network use ResNet-50 [37] as the backbone architectures. Fusion network has several fully connected layers. Different settings of fusion network are considered in Section 5.2.2. The correlation loss is used to extract common information between different modalities. Additionally, the classification loss is used to capture discriminative information from each modality for emotion prediction. During the training process, emotion labels are used twice, once to compute the classification loss, and the another as the third modality to compute the correlation loss with audio and visual modalities. In this way, label information can be fully used in order to improve the discrimination ability of the feature representations. In the testing process, audio and visual data are used to predict the corresponding emotion labels.
Applsci 10 07239 g001
Figure 2. Some cropped facial images from the eNTERFACE’05, BAUM-1s, and RAVDESS datasets.
Applsci 10 07239 g002
Figure 3. Statistical average results of the spectrograms of eNTERFACE’05, BAUM-1s, and RAVDESS datasets.
Applsci 10 07239 g003
Figure 4. Three settings of fusion network: one layer, two layers, and four layers. For example, two layers indicate that fusion network has two fully connected layers, with 1024 and 128 ReLU units, respectively. The output of fully connected layers is fed to the softmax layer, which has six units, representing the number of emotions.
Applsci 10 07239 g004
Figure 5. The confusion matrices of audio-visual emotion recognition using our method on the eNTERFACE’05, BAUM-1s, and RAVDESS datasets.
Applsci 10 07239 g005
Figure 6. Some misclassification samples on the eNTERFACE’05, BAUM-1s, and RAVDESS datasets. For instance, the image on the left of the first row is marked with “disgust → anger”, which indicates that the true label of the input data is “disgust”, but our model predicts that its label is “anger”.
Applsci 10 07239 g006
Figure 7. Three scenarios with missing modality during the testing process: only audio data are missing, only visual data are missing, and audio and visual data are missing. The performance of L c o r r method, L c o r r _ s i m p l e method and baseline method are compared. The missing rate of 0% means that there are no missing data.
Applsci 10 07239 g007
Table 1. The performance comparison of audio emotion recognition with previous works on the eNTERFACE’05, BAUM-1s, and RAVDESS datasets.
DatasetMethodAccuracy (%)
eNTERFACE’05Chen et al. [20], DNN66.3
Ma et al. [29], DNN58.95
Ours74.33
BAUM-1sOurs47.09
RAVDESSHolmström et al. [93], Logistic Model Tree70
Singh et al., [94], SVM64.15
Ours75.61
Table 2. The performance comparison of visual emotion recognition with previous works on the eNTERFACE’05, BAUM-1s, and RAVDESS datasets.
DatasetMethodAccuracy (%)
eNTERFACE’05Yan et al. [95], Sparse Representation76.23
Chen et al. [20], DNN61.7
Ours80.52
BAUM-1sOurs64.05
RAVDESSHe et al. [96], DNN79.74
Ours95.49
Table 3. The performance comparison of audio-visual emotion recognition with previous works on the eNTERFACE’05, BAUM-1s, and RAVDESS datasets.
DatasetMethod Accuracy (%)
eNTERFACE’05Štruc et al. [22], CCA71
Poria et al. [97], SVM85.23
Seng et al. [98], PCA + LDA + Rules86.67
Yan et al. [95], Sparse Kernel Reduced-Rank Regression87.46
Chen et al. [20], Attention Mechanism79.2
Ma et al. [29], HGR Maximal Correlation + Autoencoder85.43
Hossain et al. [21], Extreme Learning Machine + SVM86.4
Wang et al. [27], Low-rank Representation86.98
Ours88.66
BAUM-1sWang et al. [27], Low-rank Representation60.05
Ours67.59
RAVDESSGhaleb et al. [99], Incremental Learning67.70
Mansouri et al. [100], Spiking Neural Networks83.60
Ours97.57
Table 4. The performance of audio-visual emotion recognition with different settings on the eNTERFACE’05 dataset.
MethodSetting
OneTwoFour
Baseline87.1184.5484.54
α = 0.01 L c o r r _ s i m p l e 87.5388.3586.60
L c o r r 88.1487.3286.80
α = 0.1 L c o r r _ s i m p l e 86.3987.8487.84
L c o r r 87.6387.2286.19
α = 1 L c o r r _ s i m p l e 86.6085.3685.46
L c o r r 87.4288.6688.14
α = 10 L c o r r _ s i m p l e 87.7387.1185.98
L c o r r 88.1486.2988.25
Table 5. The performance of audio-visual emotion recognition with different settings on the BAUM-1s dataset.
MethodSetting
OneTwoFour
Baseline64.5664.0564.30
α = 0.01 L c o r r _ s i m p l e 65.3266.0865.57
L c o r r 66.5864.3065.32
α = 0.1 L c o r r _ s i m p l e 63.5465.0664.05
L c o r r 65.0665.5766.58
α = 1 L c o r r _ s i m p l e 66.3363.8064.30
L c o r r 67.5965.3264.56
α = 10 L c o r r _ s i m p l e 64.8165.8266.33
L c o r r 67.3465.8265.32
Table 6. The performance of audio-visual emotion recognition with different settings on the RAVDESS dataset.
MethodSetting
OneTwoFour
Baseline95.8396.0796.53
α = 0.01 L c o r r _ s i m p l e 97.4697.1196.30
L c o r r 96.5397.2396.76
α = 0.1 L c o r r _ s i m p l e 97.2397.1197.46
L c o r r 97.5797.2396.88
α = 1 L c o r r _ s i m p l e 97.3496.8896.88
L c o r r 97.2396.9997.11
α = 10 L c o r r _ s i m p l e 96.3096.4297.46
L c o r r 97.1196.6596.99
Table 7. The performance of semi-supervised audio-visual emotion recognition on the RAVDESS dataset.
MethodPercentage of Labels
20%50%80%100%
Audio42.5463.0171.5675.61
Visual65.4384.1691.7995.49
Baseline67.4088.4493.2996.07
α = 0.01 L c o r r _ s i m p l e 68.9088.7994.2297.11
L c o r r _ s e m i 69.9489.3694.6897.23
α = 0.1 L c o r r _ s i m p l e 69.6088.7994.8097.11
L c o r r _ s e m i 70.6489.7194.6897.23
α = 1 L c o r r _ s i m p l e 69.0287.6394.3496.88
L c o r r _ s e m i 69.1390.2995.2696.99
α = 10 L c o r r _ s i m p l e 67.2888.0995.7296.42
L c o r r _ s e m i 69.6089.4895.7296.65
Publisher’s Note: MDPI stays neutral with regard to jurisdictional claims in published maps and institutional affiliations.

