The Potential Use of Car Windscreens for Post-Accident Dose Reconstruction in the Periphery of Nuclear Installations


 , , ,
, , ,  and
and 
Abstract
:1. Introduction
2. Materials and Methods
3. Results and Discussion
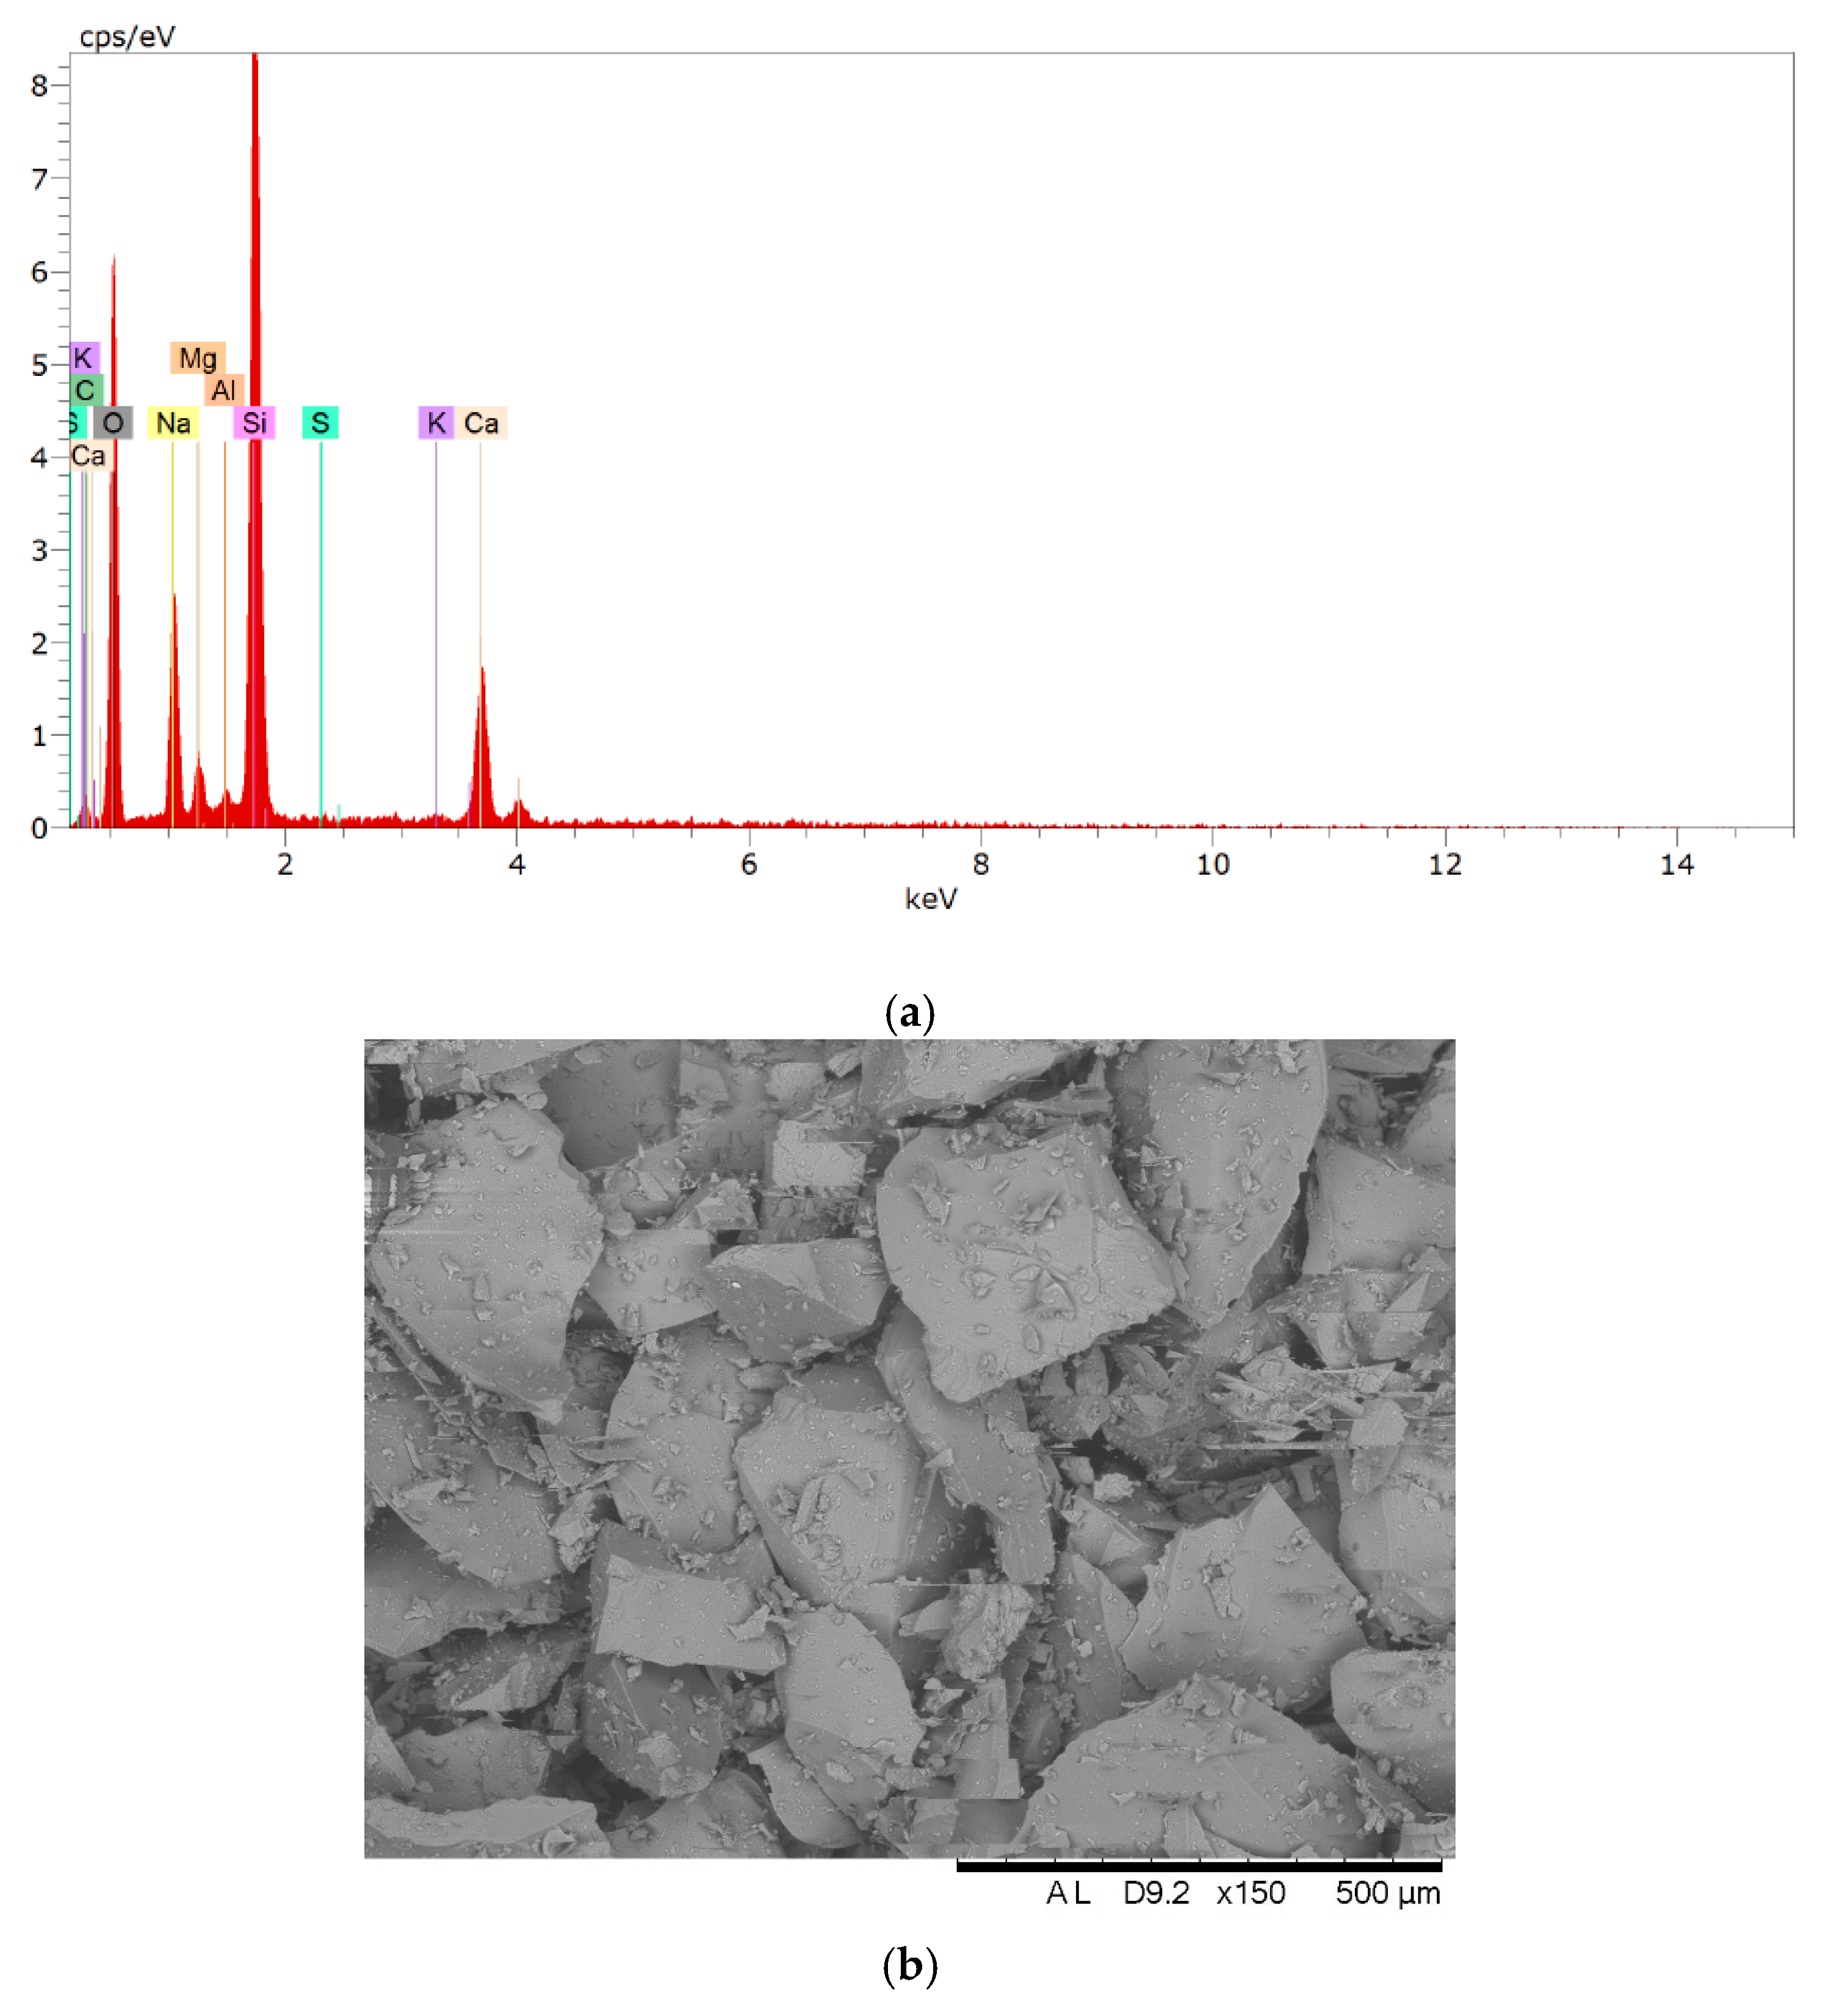
3.1. Effective Atomic Number
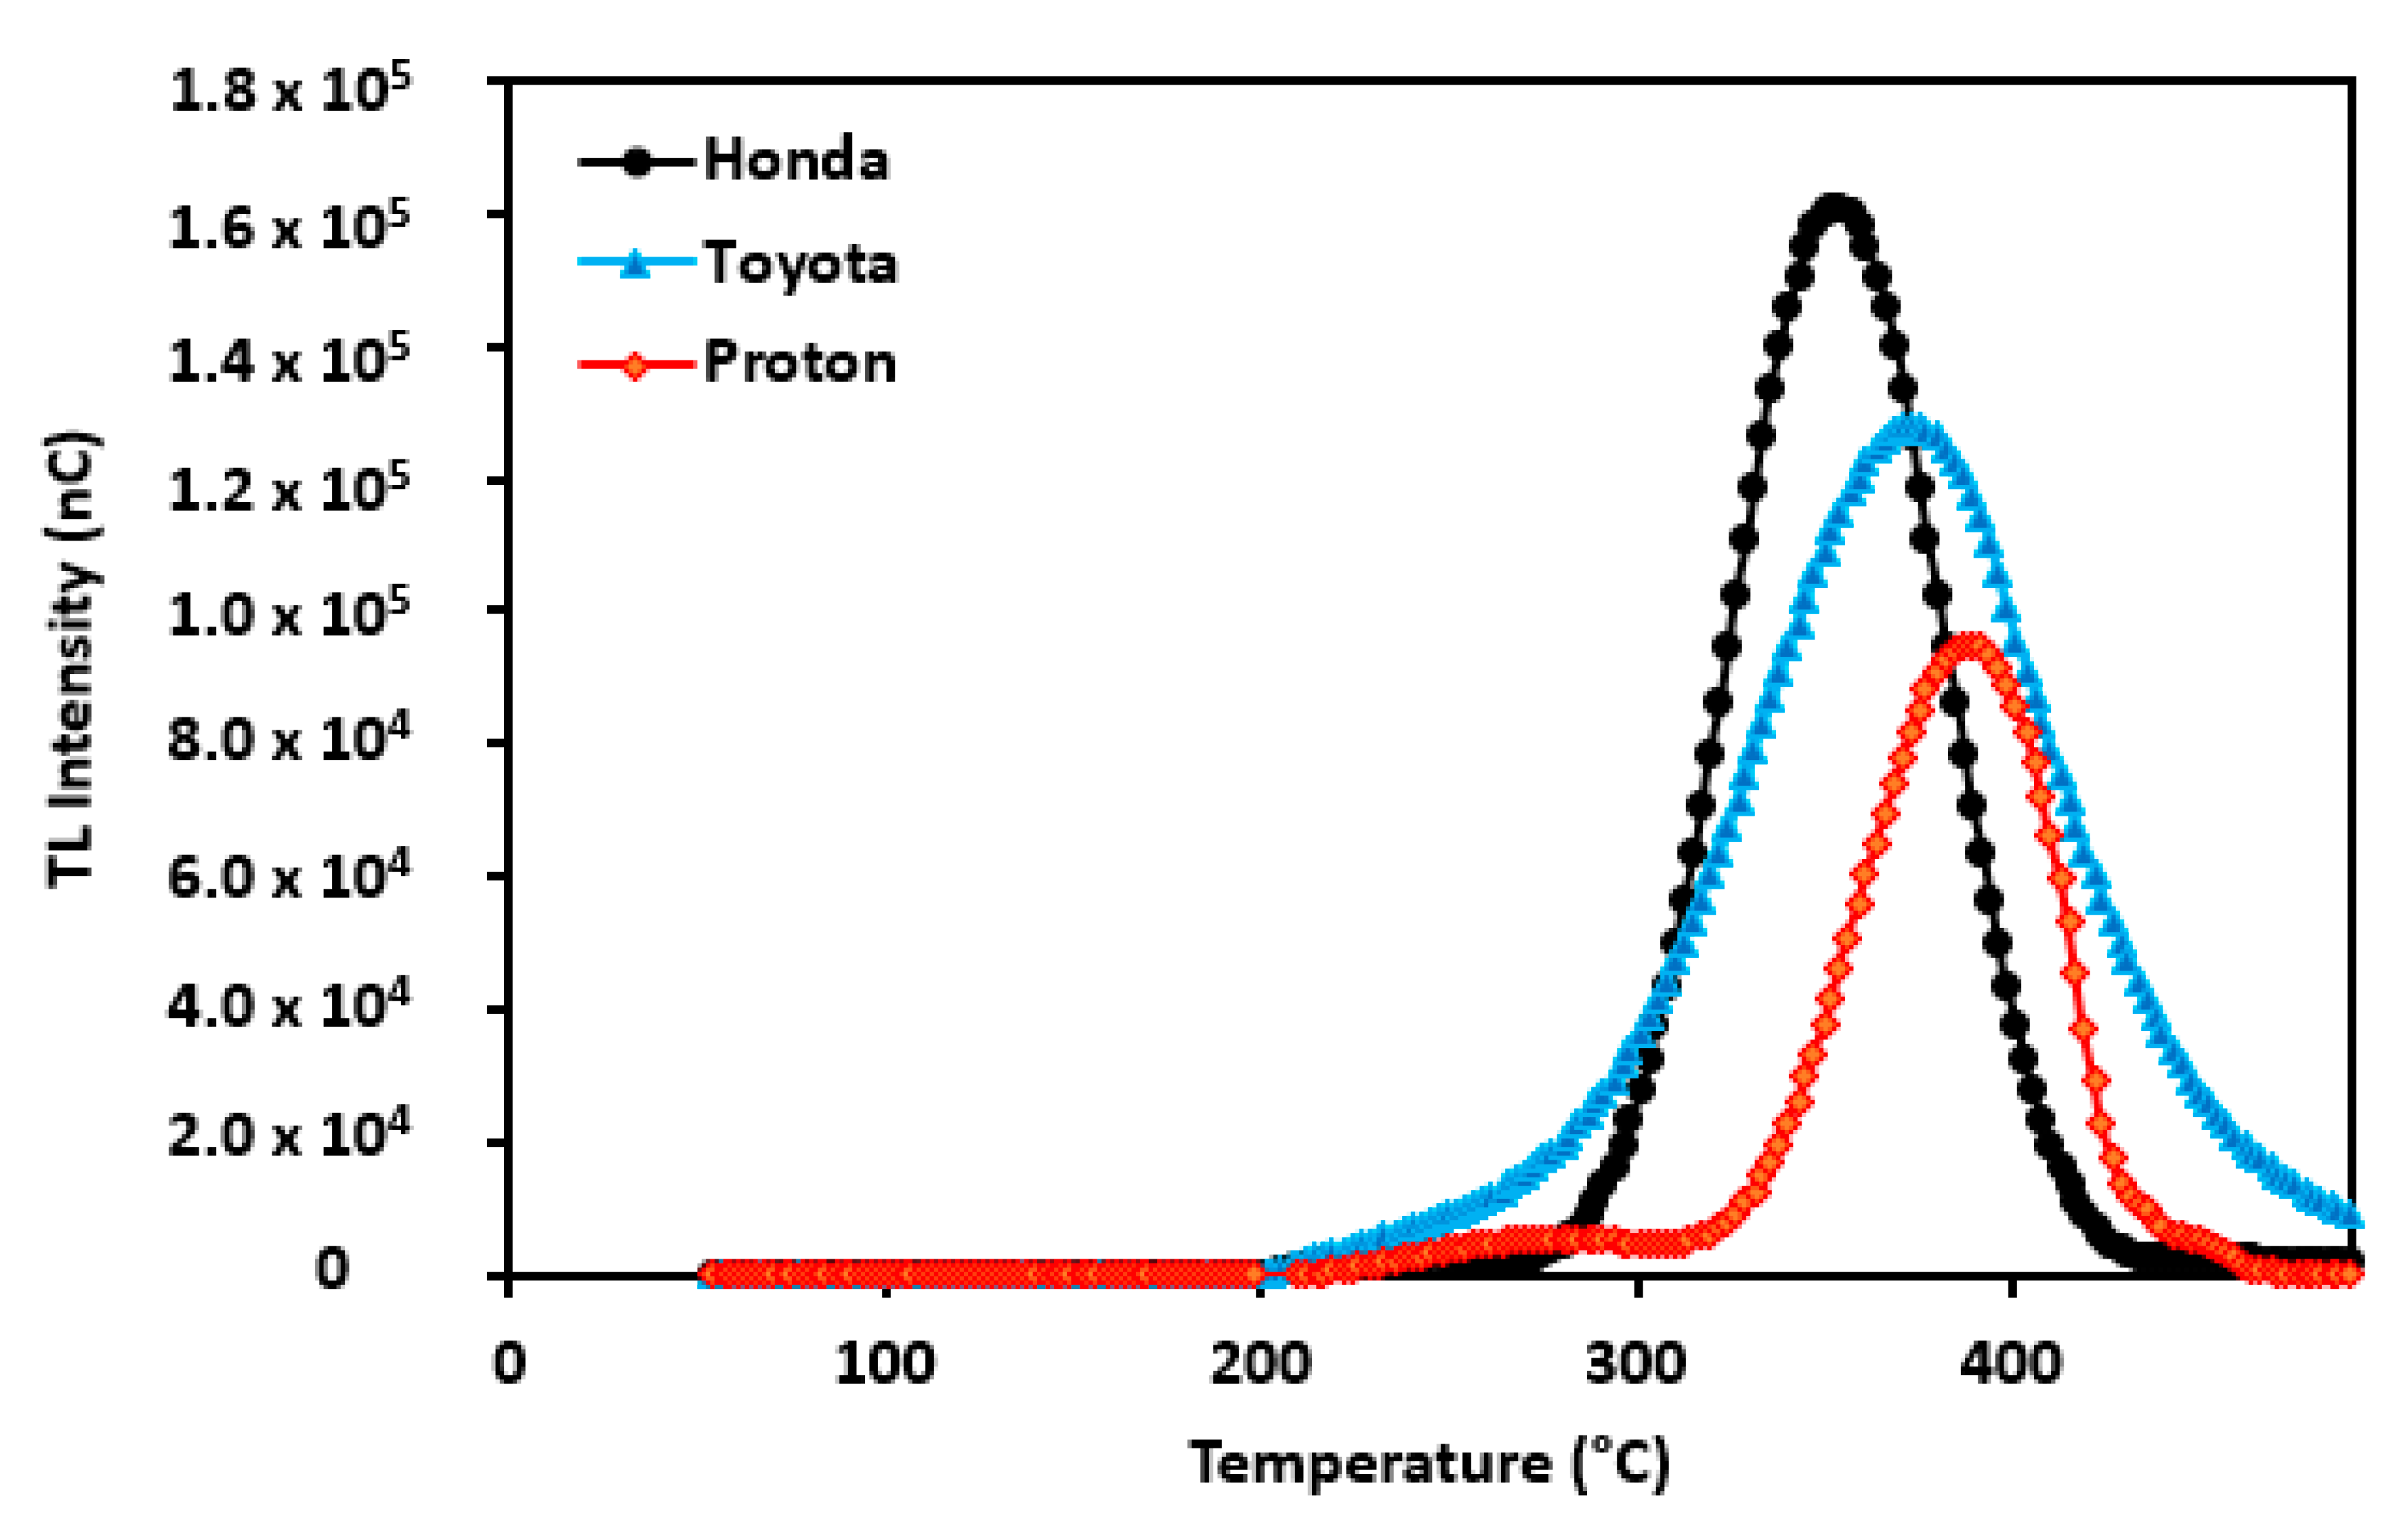
3.2. TL Glow Curve
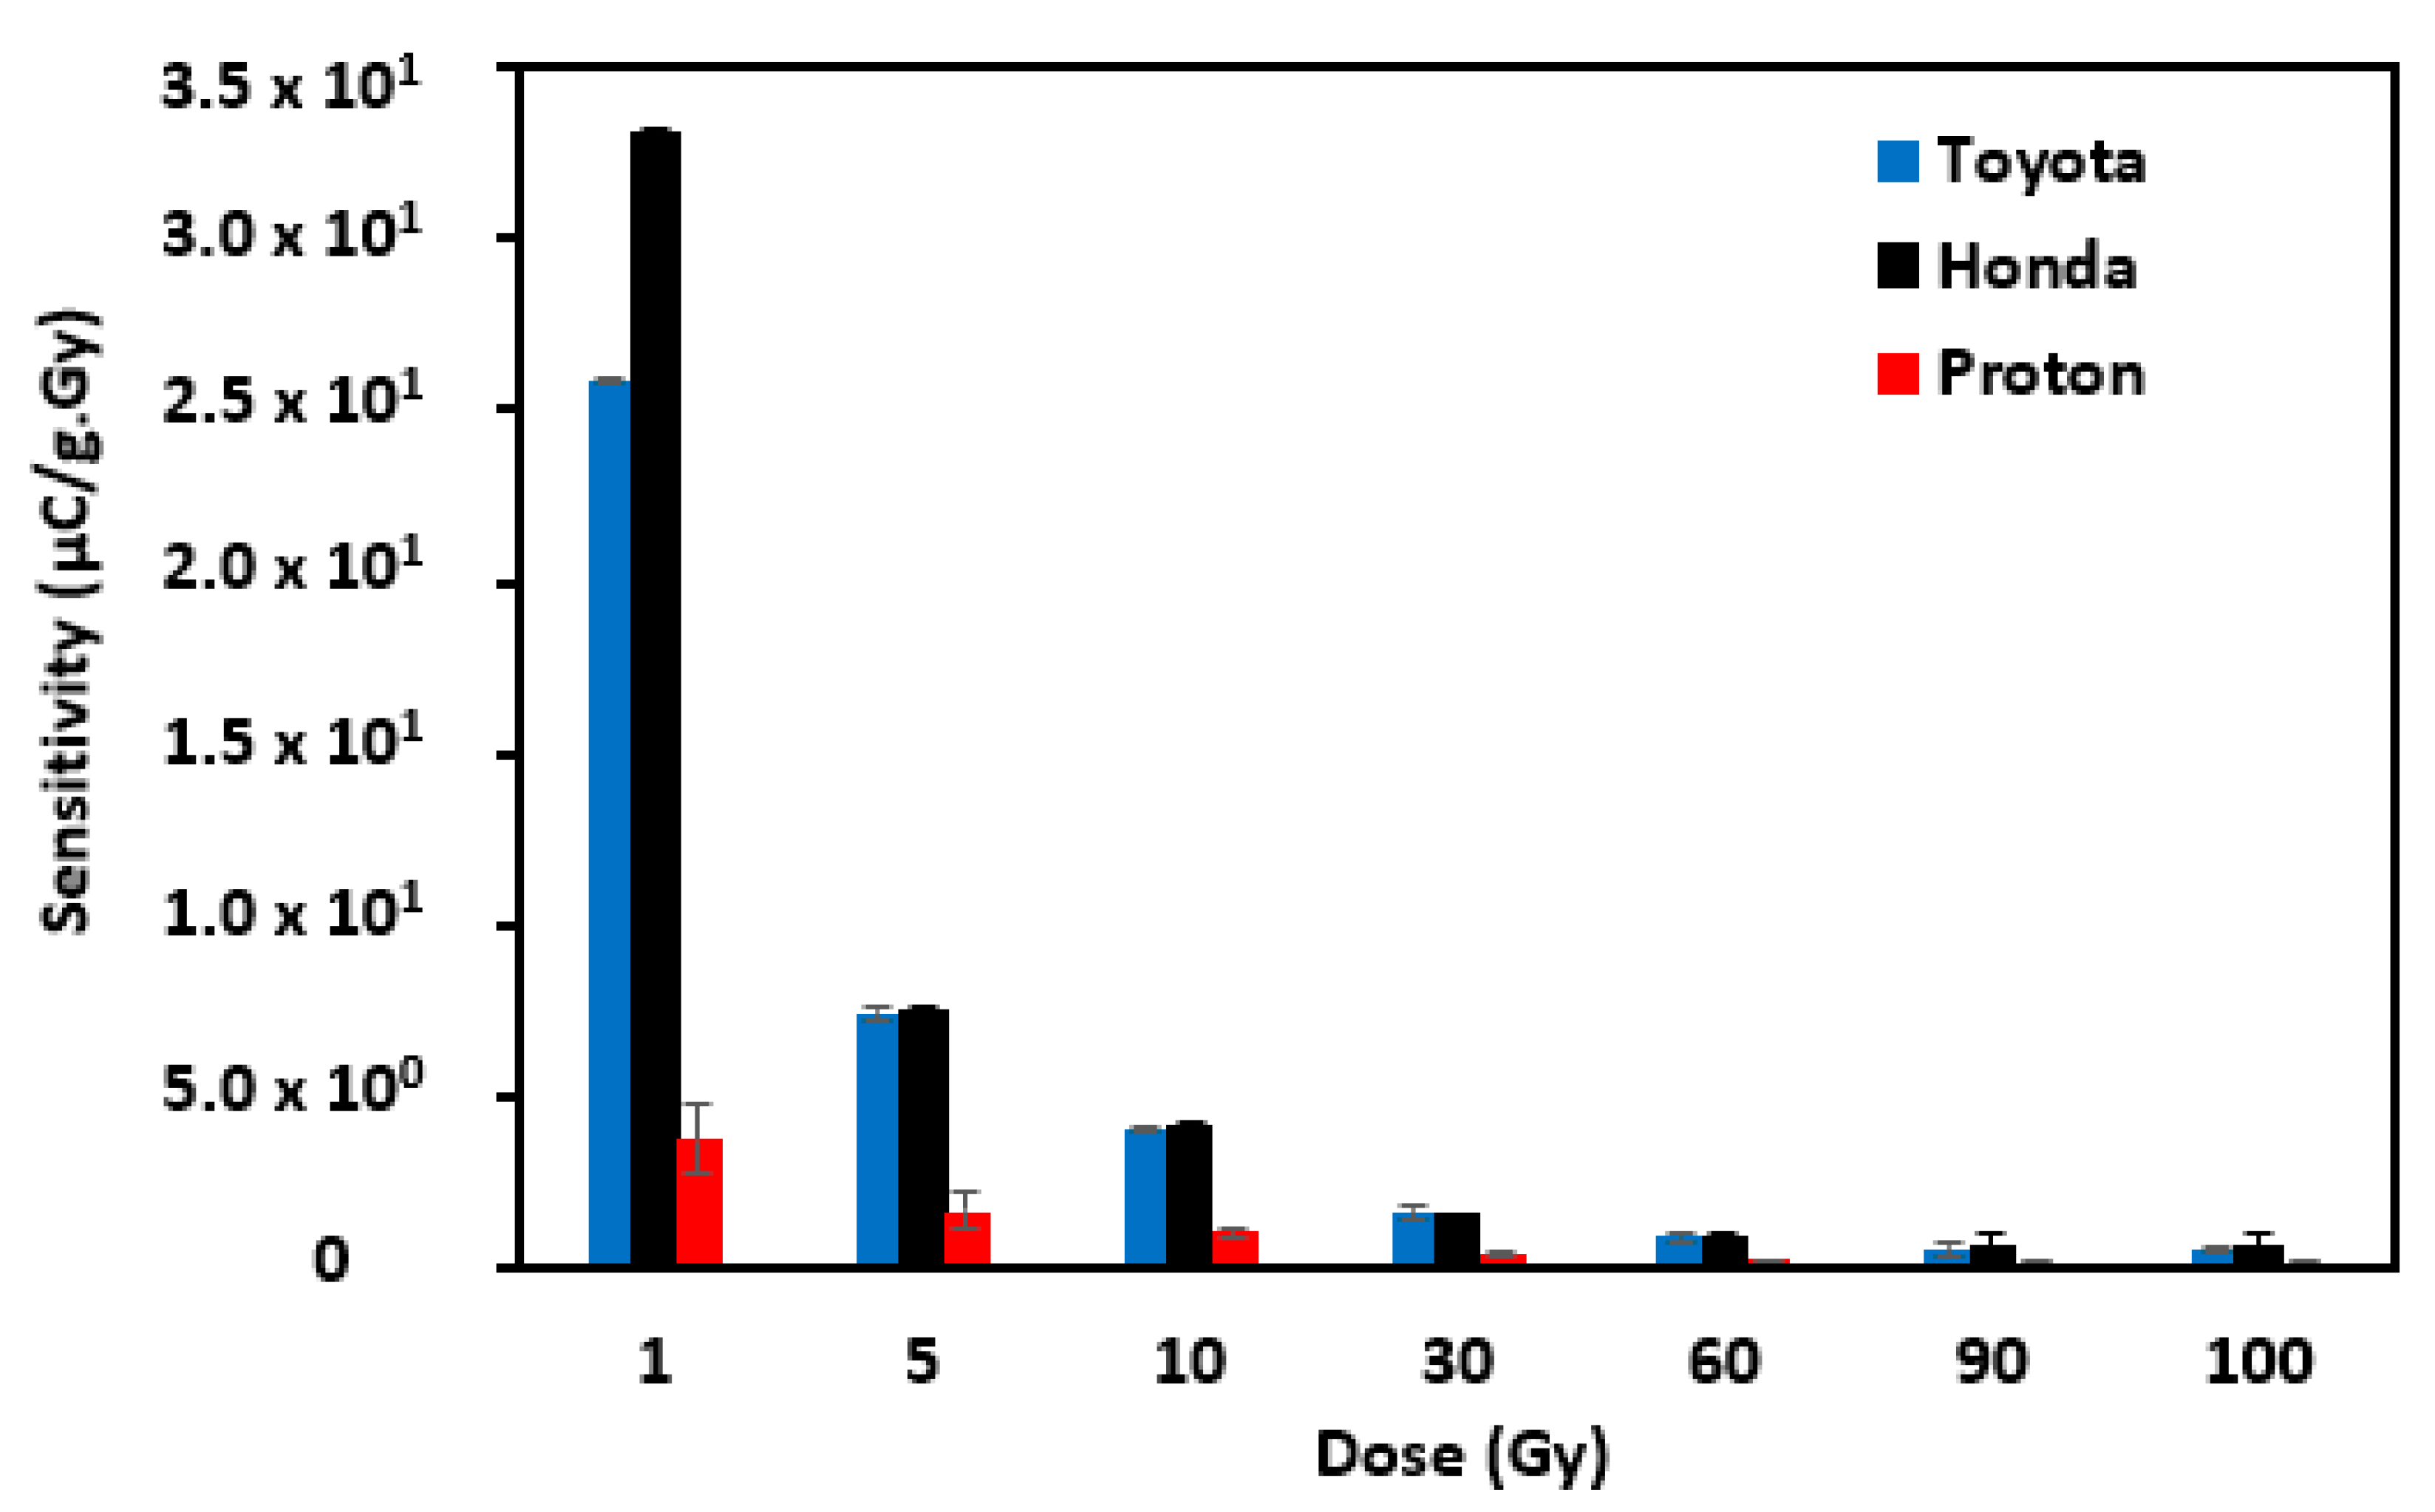
3.3. TL Sensitivity
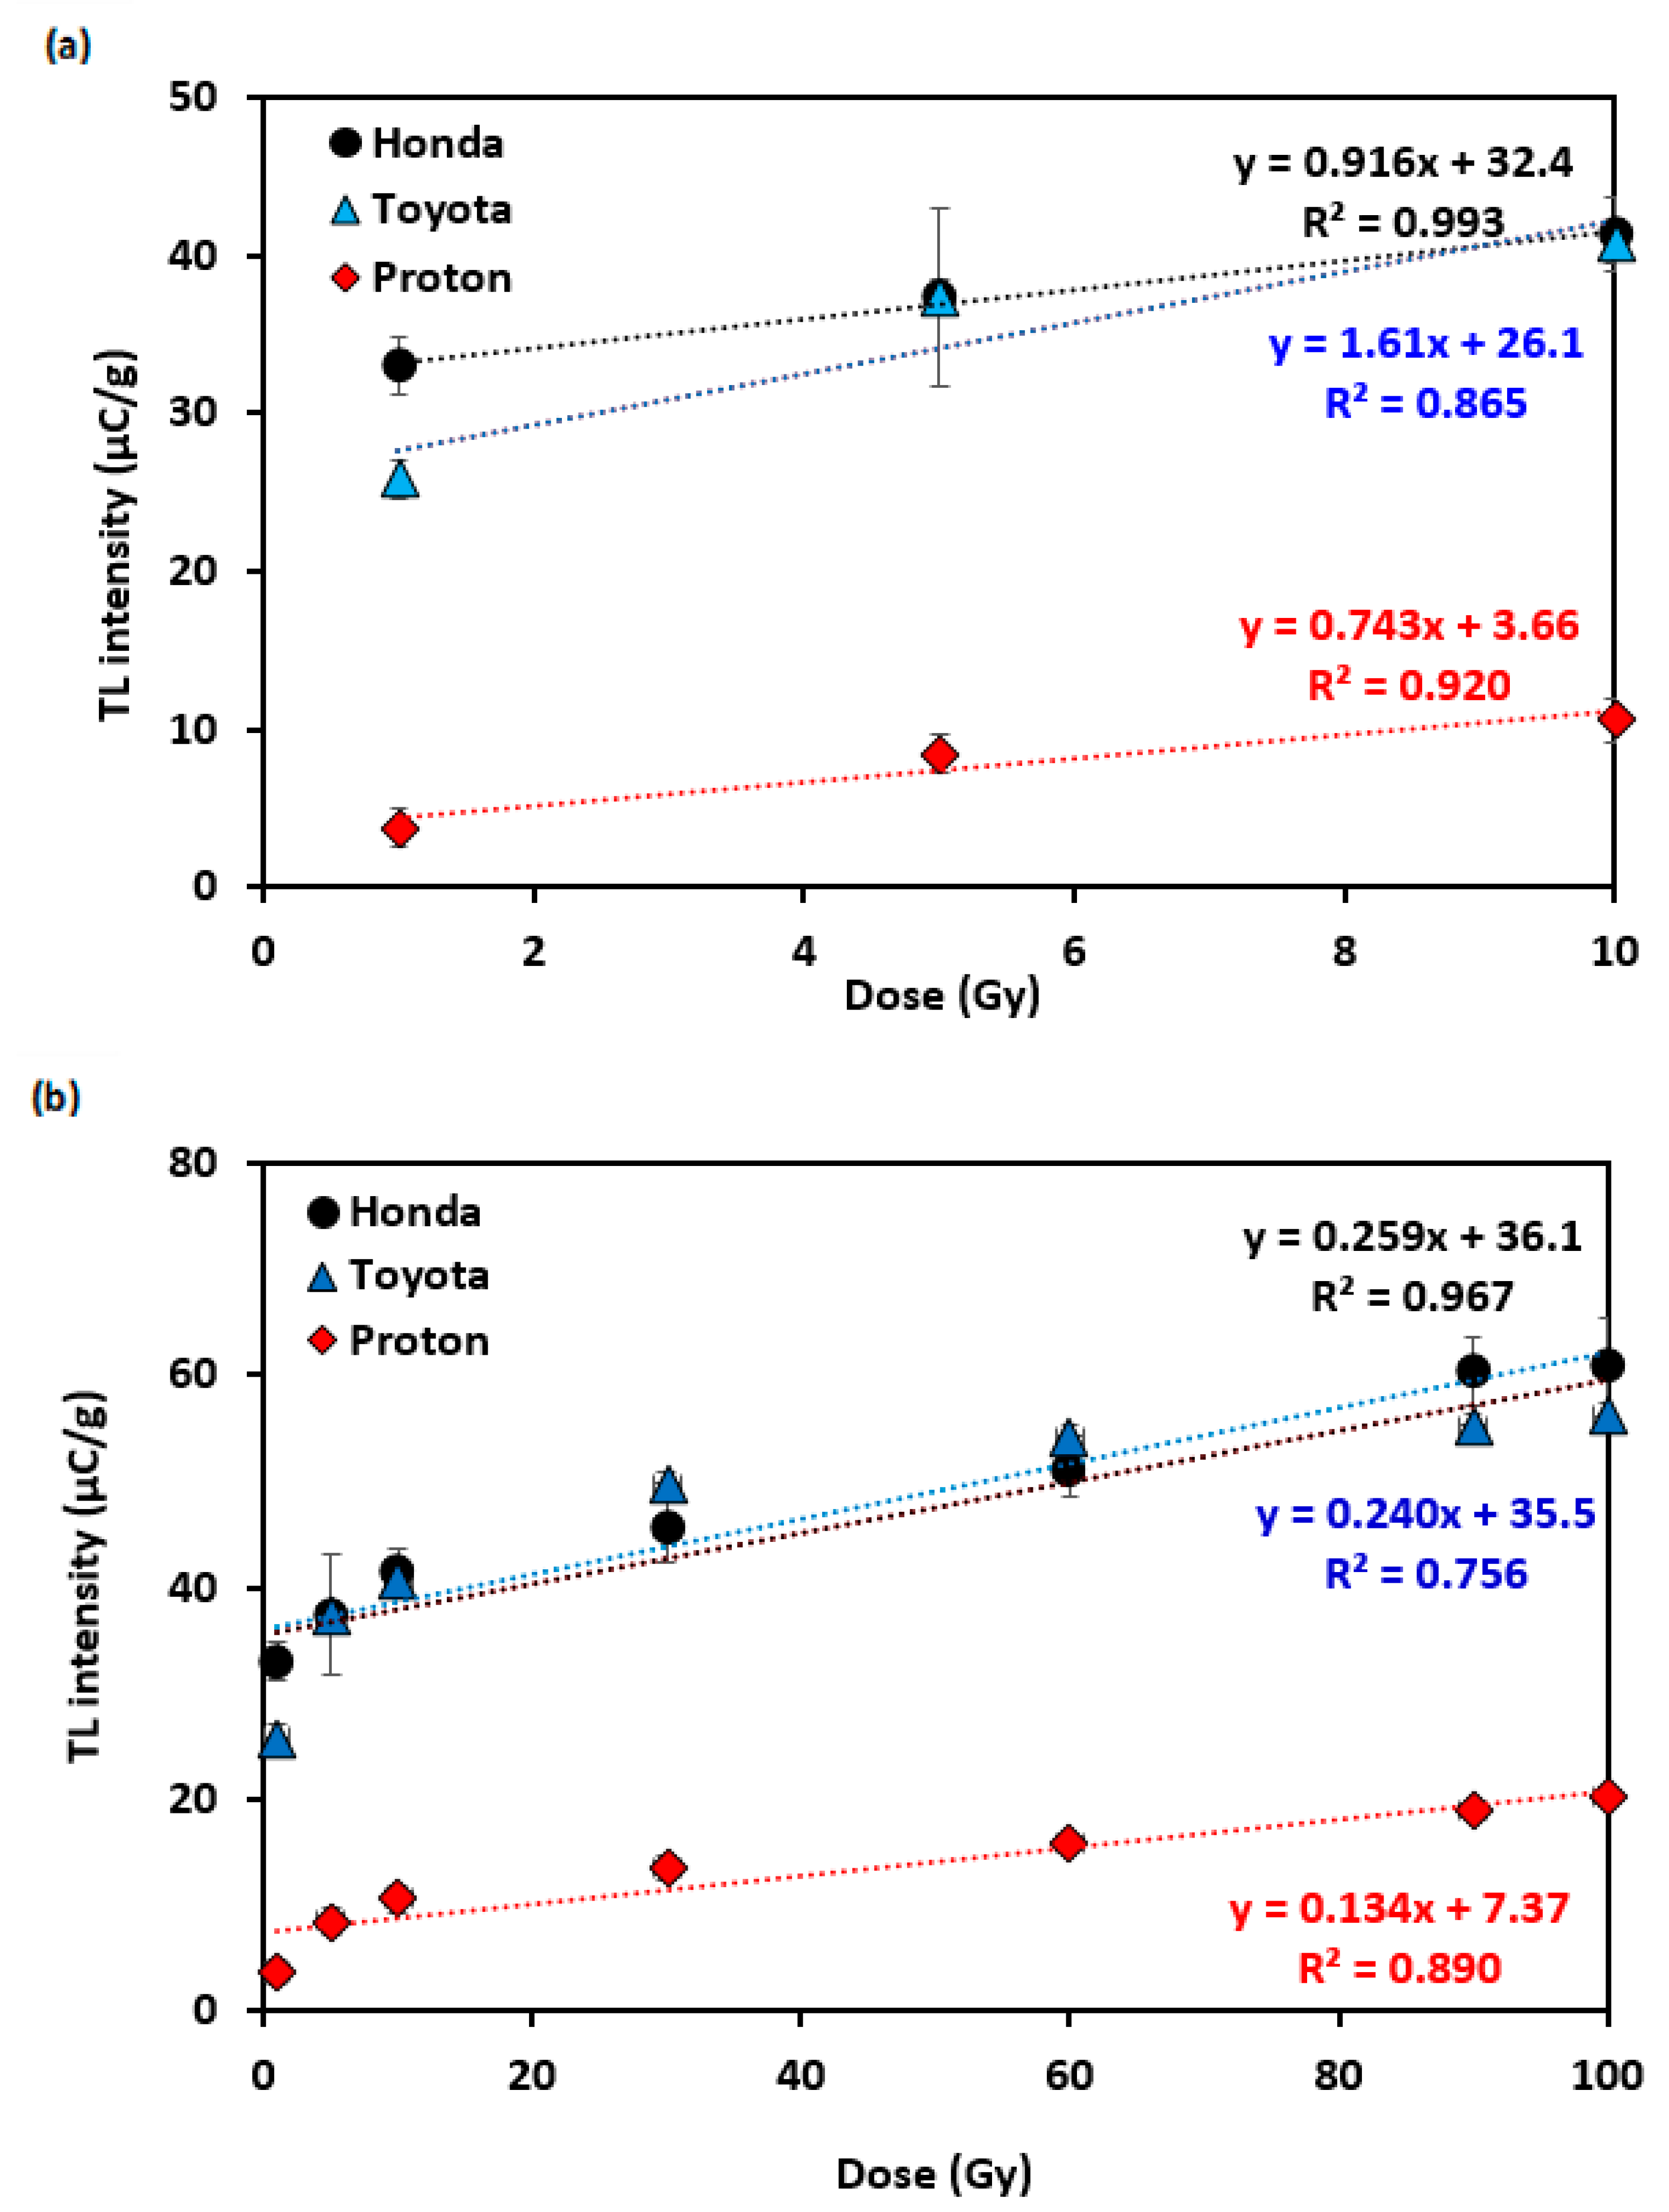
3.4. Dose Response
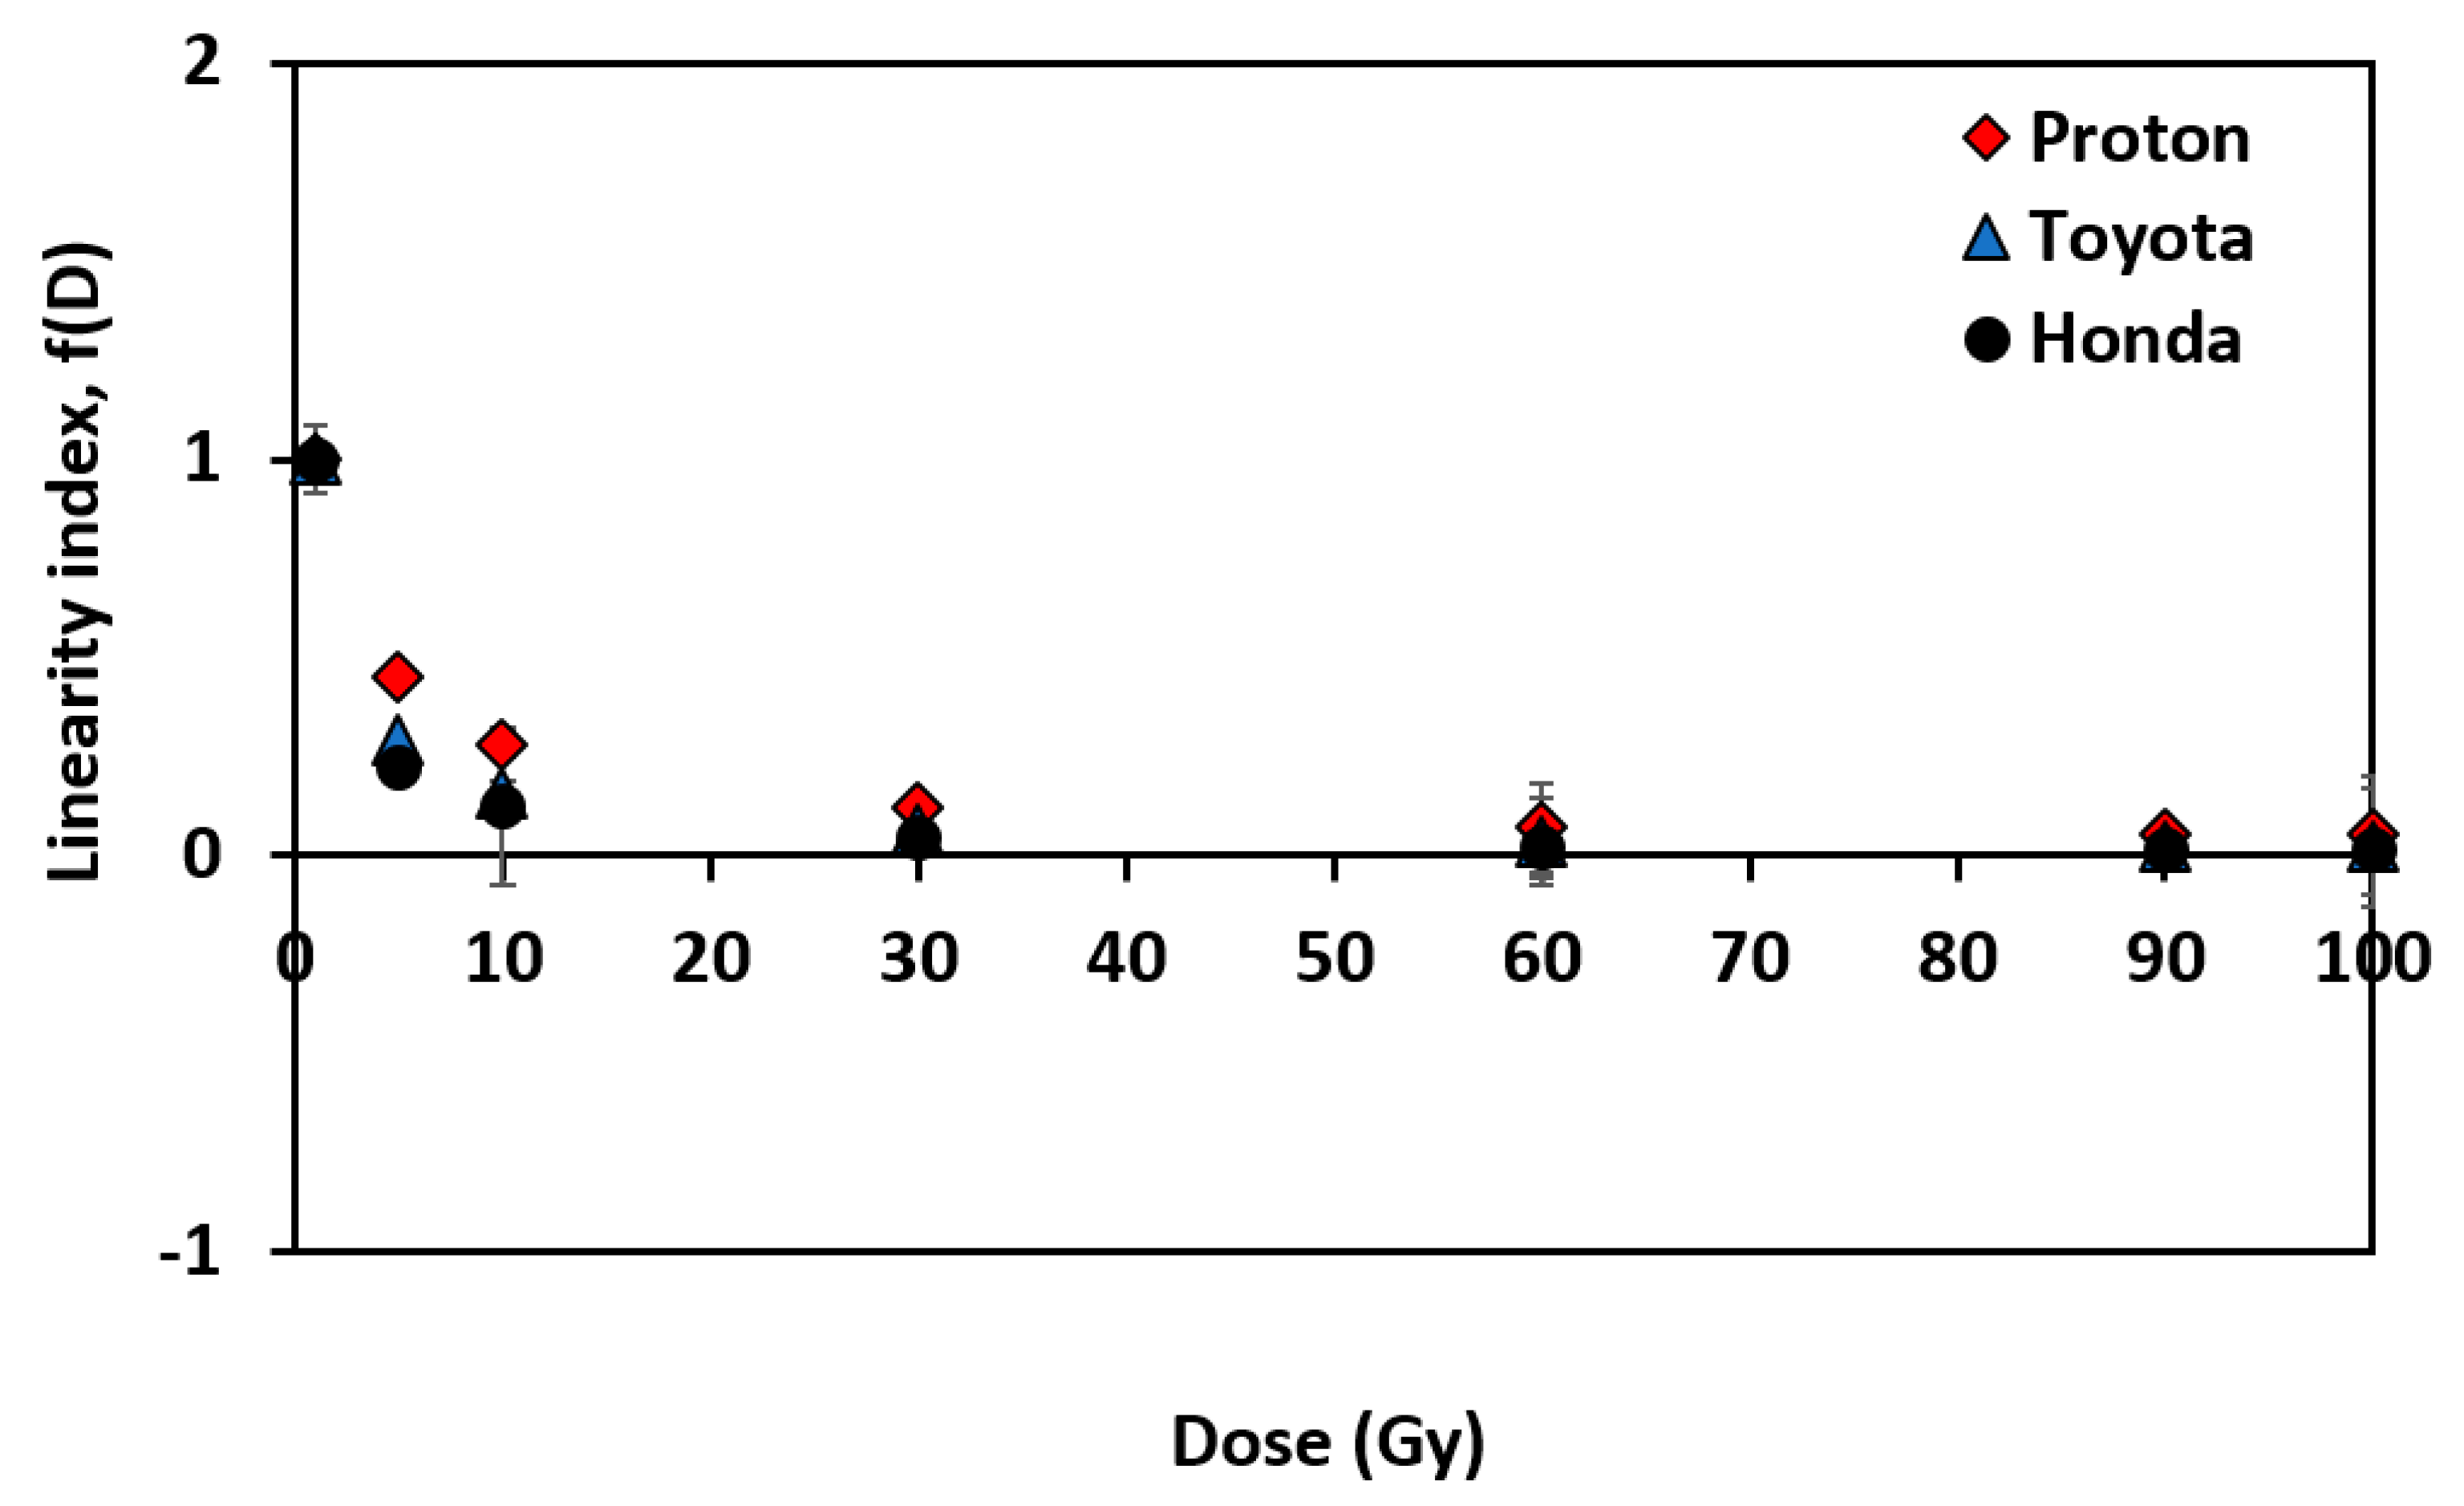
3.5. Linearity Index, f(D)
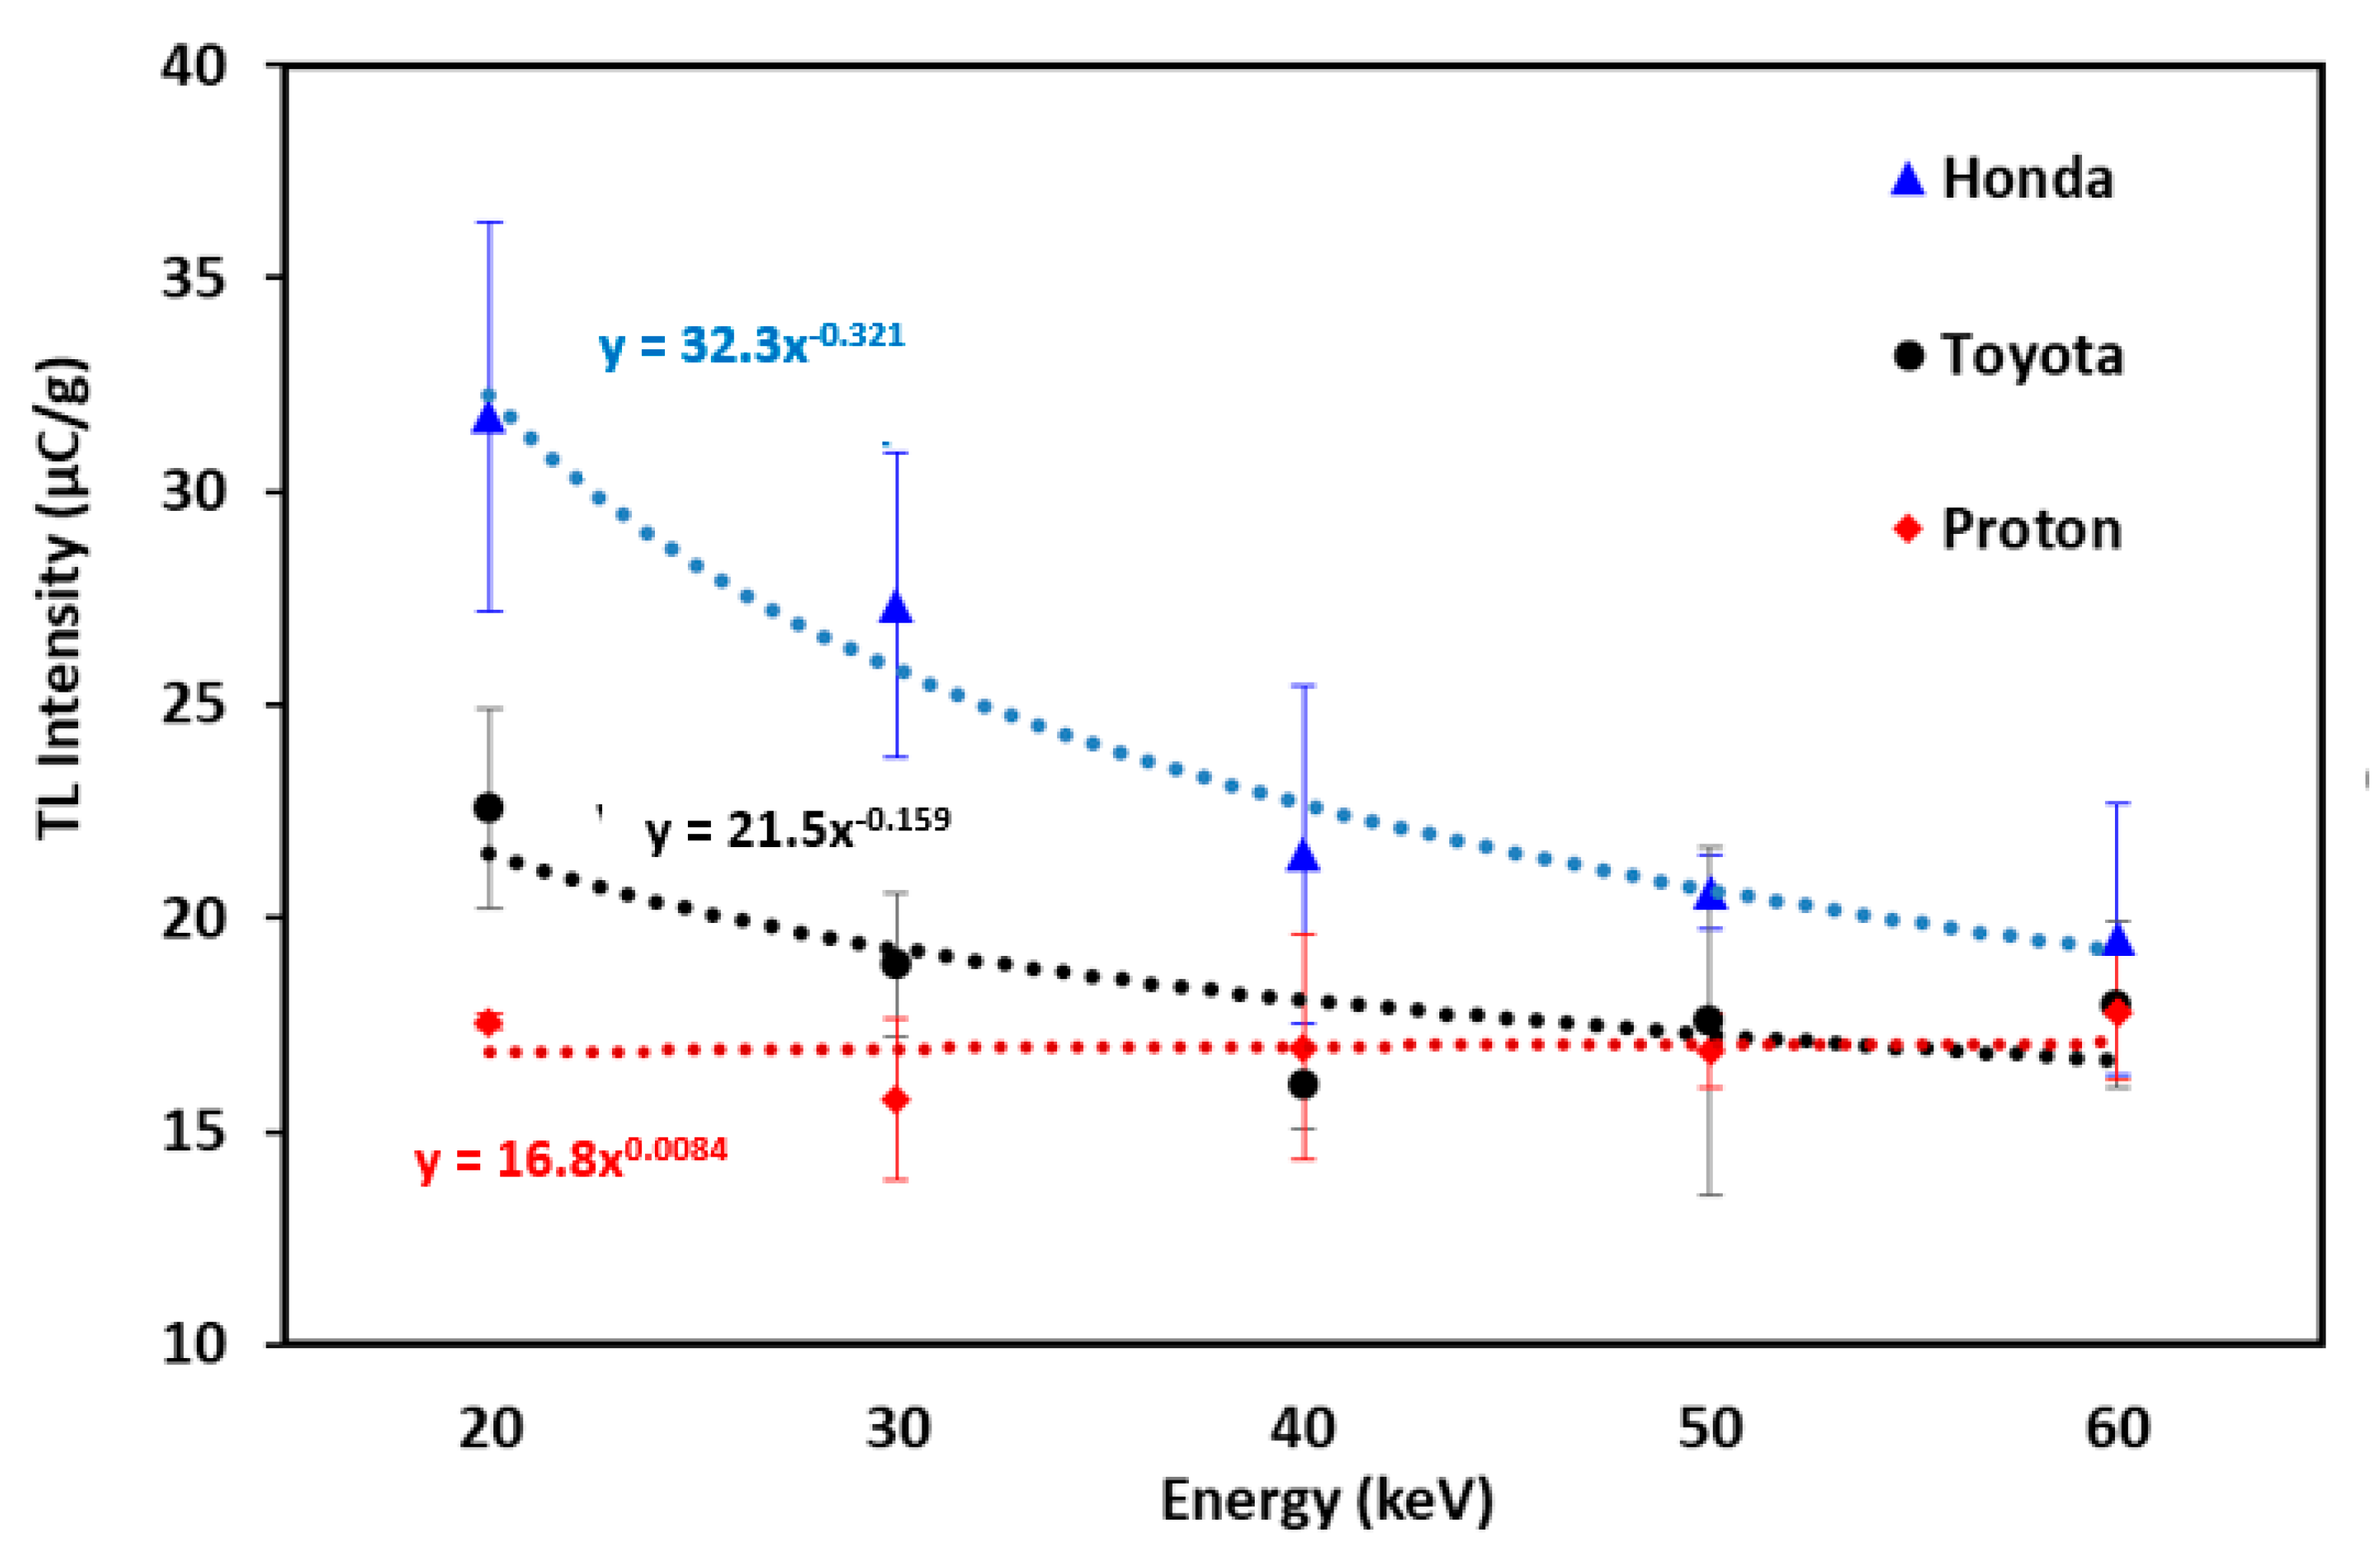
3.6. Energy Response
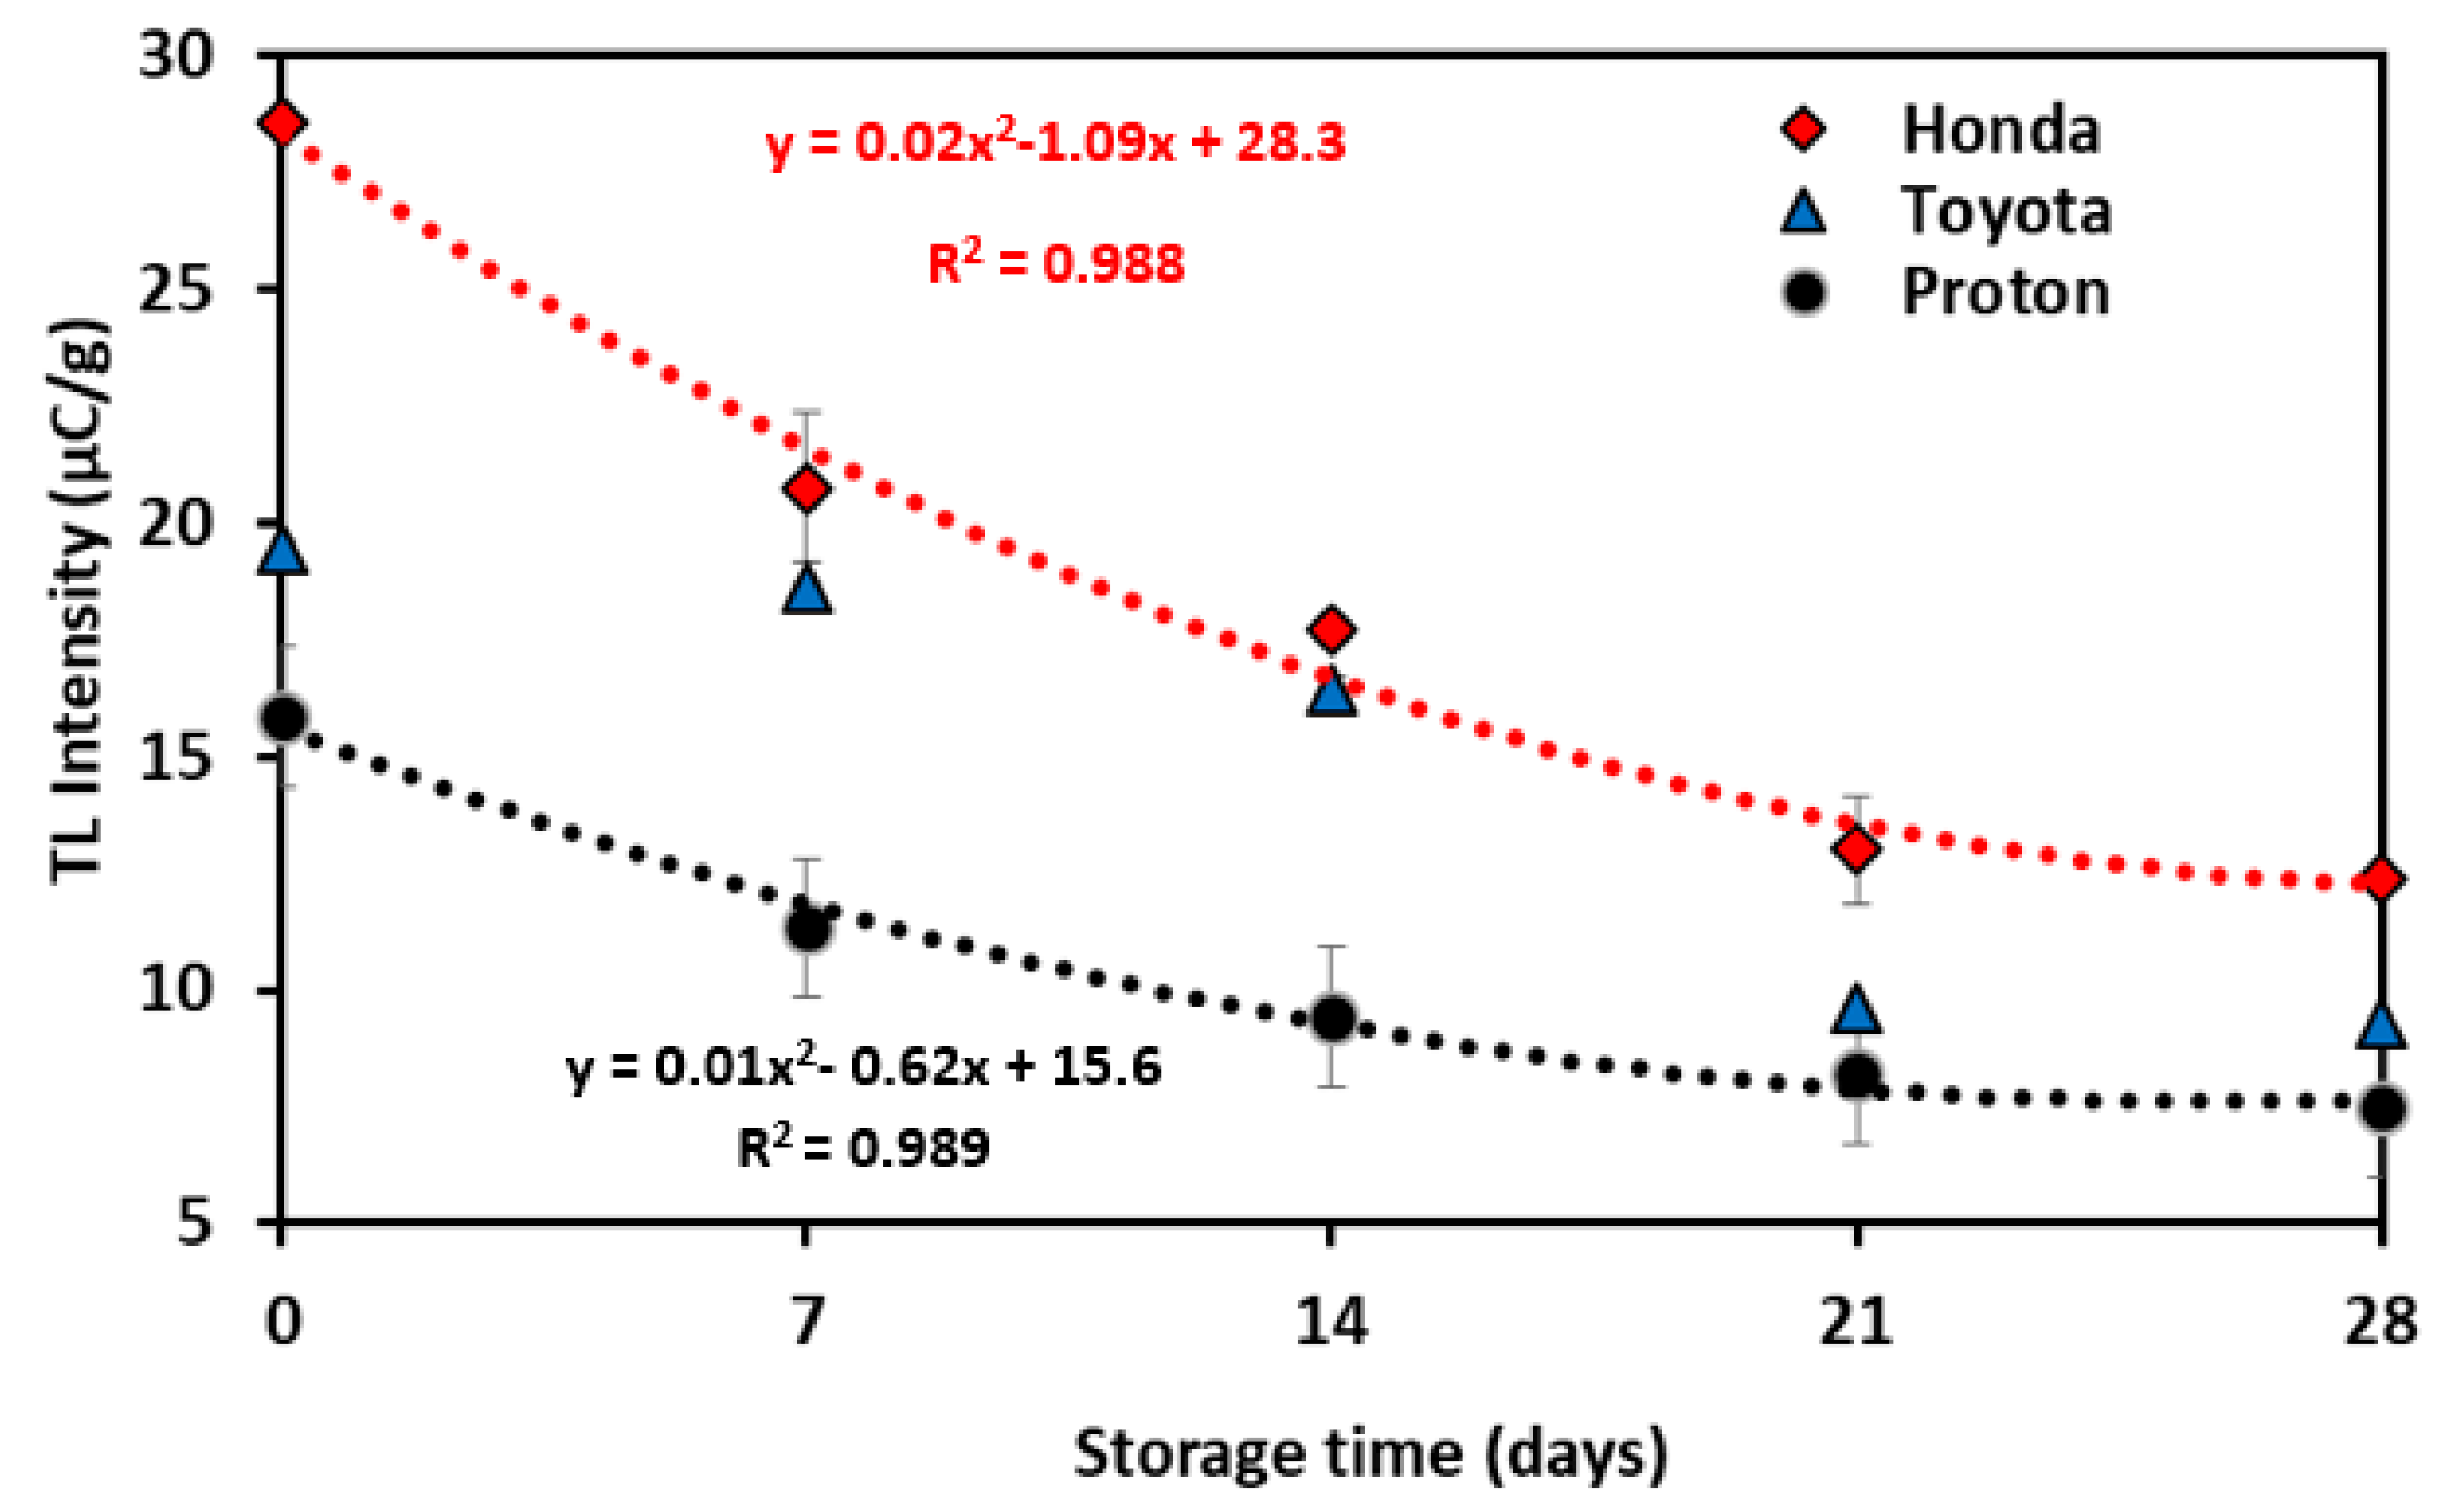
3.7. Fading
4. Conclusions
Author Contributions
Funding
Conflicts of Interest
References
- Yasmin, S.; Khandaker, M.U.; Rozaila, Z.S.; Rashid, M.A.; Bradley, D.A.; Sani, S.F.A. Thermoluminescence features of commercial glass and retrospective accident dosimetry. Radiat. Phys. Chem. 2020, 168, 108528. [Google Scholar] [CrossRef]
- Bradley, D.A.; Nawi, S.N.M.; Khandaker, M.U.; Almugren, K.S.; Sani, S.F. Sub kGy photon irradiation alterations in graphite. Appl. Radiat. Isot. 2020. [Google Scholar] [CrossRef] [PubMed]
- Horowitz, Y.S.; Chen, R.; Oster, L.; Eliyahu, I. Thermoluminescence theory and analysis: Advances and impact on applications. In Encyclopedia of Spectroscopy and Spectrometry; Elsevier: San Diego, CA, USA, 2016; ISBN 9780128032244. [Google Scholar]
- Capelletti, R. Luminescence. In Encyclopedia of Condensed Matter Physics; Elsevier: Amsterdam, The Netherlands, 2005; ISBN 978-0-12-369401-0. [Google Scholar]
- Bailiff, I.K. Retrospective dosimetry with ceramics. Radiat. Meas. 1997, 27, 923–941. [Google Scholar] [CrossRef]
- Göksu, H.Y.; Stoneham, D.; Bailiff, I.K.; Adamiec, G. A new technique in retrospective TL dosimetry: Pre-dose effect in the 230 °C TL glow peak of porcelain. Appl. Radiat. Isot. 1998, 49, 99–104. [Google Scholar] [CrossRef]
- Singh, A.K.; Menon, S.N.; Kadam, S.Y.; Koul, D.K.; Datta, D. OSL studies of local bricks for retrospective dosimetric application. Nucl. Instrum. Methods Phys. Res. Sect. B Beam Interact. Mater. Atoms 2016, 383, 14–20. [Google Scholar] [CrossRef]
- Trompier, F.; Della Monaca, S.; Fattibene, P.; Clairand, I. EPR dosimetry of glass substrate of mobile phone LCDs. Radiat. Meas. 2011, 46, 827–831. [Google Scholar] [CrossRef]
- Discher, M.; Woda, C.; Fiedler, I. Improvement of dose determination using glass display of mobile phones for accident dosimetry. Radiat. Meas. 2013, 56, 240–243. [Google Scholar] [CrossRef]
- Siti Rozaila, Z.; Khandaker, M.U.; Wahib, N.b.; Hanif bin Abdul Jilani, M.K.; Abdul Sani, S.F.; Bradley, D.A. Thermoluminescence characterization of smartphone screen for retrospective accident dosimetry. Radiat. Phys. Chem. 2020, 167, 108297. [Google Scholar] [CrossRef]
- Hashimoto, T.; Takano, M.; Yanagawa, Y.; Tsuboi, T. Radiation dosimetry using thermoluminescence from ceramic and glass samples at the JCO critical accident site. J. Environ. Radioact. 2000, 50, 97–105. [Google Scholar] [CrossRef]
- Mizuno, H.; Kanai, T.; Kusano, Y.; Ko, S.; Ono, M.; Fukumura, A.; Abe, K.; Nishizawa, K.; Shimbo, M.; Sakata, S.; et al. Feasibility study of glass dosimeter postal dosimetry audit of high-energy radiotherapy photon beams. Radiother. Oncol. 2008, 86, 258–263. [Google Scholar] [CrossRef]
- Jafari, S.M.; Bradley, D.A.; Gouldstone, C.A.; Sharpe, P.H.G.; Alalawi, A.; Jordan, T.J.; Clark, C.H.; Nisbet, A.; Spyrou, N.M. Low-cost commercial glass beads as dosimeters in radiotherapy. Radiat. Phys. Chem. 2014, 97, 95–101. [Google Scholar] [CrossRef]
- Bradley, D.A.; Siti Shafiqah, A.S.; Siti Rozaila, Z.; Sabtu, S.N.; Abdul Sani, S.F.; Alanazi, A.H.; Jafari, S.M.; Amouzad Mahdiraji, G.; Mahamd Adikan, F.R.; Maah, M.J.; et al. Developments in production of silica-based thermoluminescence dosimeters. Radiat. Phys. Chem. 2017, 137, 37–44. [Google Scholar] [CrossRef]
- Wahib, N.b.; Khandaker, M.U.; Aqilah binti Mohamad Ramli, N.; Sani, S.F.A.; Bradley, D.A. Commercial kitchenware glass as a potential thermoluminescent media for retrospective dosimetry. Appl. Radiat. Isot. 2019, 148, 218–224. [Google Scholar] [CrossRef] [PubMed]
- Kurudirek, M. Effective atomic numbers and electron densities of some human tissues and dosimetric materials for mean energies of various radiation sources relevant to radiotherapy and medical applications. Radiat. Phys. Chem. 2014, 102, 139–146. [Google Scholar] [CrossRef]
- Mayneord, W. The Significance of the Röntgen. In Unio Internationalis Contra Cancrum; Springer: Berlin, Germany, 1937. [Google Scholar]
- Khan, F.M. The Physics of Radiation Therapy, 4th ed.; Lippincott Williams & Wilkins: Philadelphia, PA, USA, 2009. [Google Scholar]
- Al-Sawaf, H.A.; Jassi, K.A.; Sleeman, S.Y. The Effective Atomic Number of Tissue Equivalent Materials. Raf. J. Sci. 2005, 16, 22–27. [Google Scholar]
- Hashim, S.; Saripan, M.I.; Rahman, A.T.A.; Yaakob, N.H.; Bradley, D.A.; Alzimami, K. Effective atomic number of Ge-doped and Al-doped optical fibers for radiation dosimetry purposes. IEEE Trans. Nucl. Sci. 2013. [Google Scholar] [CrossRef] [Green Version]
- Chen, R. On the calculation of activation energies and frequency factors from glow curves. J. Appl. Phys. 1969, 40, 570. [Google Scholar] [CrossRef] [Green Version]
- Aboud, H.; Saber, S.; Wagiran, H.; Hussin, R. Energy response and thermoluminescence properties of lithium potassium borate Glass co-doped with Cu and SnO2 nanoparticles. J. Radiat. Res. Appl. Sci. 2017. [Google Scholar] [CrossRef] [Green Version]
- Tamrakar, R.K.; Bisen, D.P.; Sahu, I.P.; Brahme, N. UV and gamma ray induced thermoluminescence properties of cubic Gd2O3:Er3+ phosphor. J. Radiat. Res. Appl. Sci. 2014. [Google Scholar] [CrossRef] [Green Version]
- Elashmawy, M. Study of constraints in using household NaCl salt for retrospective dosimetry. Nucl. Instrum. Methods Phys. Res. Sect. B Beam Interact. Mater. Atoms 2018. [Google Scholar] [CrossRef]
- Moffatt, J.E.; Spooner, N.A.; Creighton, D.F.; Smith, B.W. Luminescence properties of common glasses for application to retrospective dosimetry. Radiat. Meas. 2012, 47, 851–856. [Google Scholar] [CrossRef]
- Horowitz, Y.S. The theoretical and microdosimetric basis of thermoluminescence and applications to dosimetry. Phys. Med. Biol. 1981, 26, 765. [Google Scholar] [CrossRef] [PubMed]
- Furetta, C. Handbook of Thermoluminescence; World Scientific Publishing: Singapore, 2003. [Google Scholar]
- Bushberg, J.T.; Seibert, J.A.; Leidholdt, E.M.; Boone, J.M. The Essential Physics of Medical Imaging; Lippincott Williams and Wilkins: Philadelphia, PA, USA, 2011. [Google Scholar]
- Knoll, G.F. Radiation Detection and Measurement; John Wiley and Sons: New York, NY, USA, 2010; ISBN 9780470131480. [Google Scholar]
- McKeever, S.W.S.; Moscovitch, M.; Townsend, P.D. Thermoluminescence Dosimetry Materials: Properties and Uses; Nuclear Technology Publishers: Ashford, Kent, UK, 1995. [Google Scholar]
- Fadel, M.A. New approaches in glass dosimetry. Radiat. Eff. 1976. [Google Scholar] [CrossRef]
- Bakr, M.; Omer, M. Determination of Thermoluminescence Kinetic Parameters of La2O3 Doped with Dy3+ and Eu3+. Materials 2020, 13, 1047. [Google Scholar] [CrossRef] [Green Version]

| Brand Name | Country of Origin | Average Mass (g) |
|---|---|---|
| Proton | Malaysia | 0.050 ± 0.002 |
| Toyota | Japan | 0.040 ± 0.003 |
| Honda | Japan | 0.040 ± 0.002 |
| Windshield Glass from Car Brand | Element, i | Weight Fraction, Wi(%) | No of Electrons per gram of Each Element, Ne = (NA × Z × Wi)/AW | Fractional Weight Contributions of Each Element, ai | Effective Atomic Number, Zeff |
|---|---|---|---|---|---|
| Honda | Si | 24.8 | 7.43 × 10²² | 2.48 × 10⁻¹ | |
| Na | 8.06 | 2.32 × 10²² | 7.75 × 10⁻² | 12.2 | |
| K | 0.05 | 1.46 × 10²⁰ | 4.88 × 10⁻⁴ | ||
| C | 5.05 | 1.52 × 10²² | 5.07 × 10⁻² | ||
| O | 50.9 | 1.53 × 10²³ | 5.11 × 10⁻¹ | ||
| Ca | 8.88 | 2.67 × 10²² | 8.91 × 10⁻² | ||
| Mg | 1.68 | 4.99 × 10²¹ | 1.67 × 10⁻² | ||
| Al | 0.61 | 1.77 × 10²¹ | 5.91 × 10⁻³ | ||
| Toyota | Si | 24.7 | 7.40 × 10²² | 2.47 × 10⁻¹ | 12.0 |
| Na | 8.96 | 2.58 × 10²² | 8.62 × 10⁻² | ||
| K | 0.27 | 7.90 × 10²⁰ | 2.64 × 10⁻³ | ||
| C | 4.8 | 1.44 × 10²² | 4.82 × 10⁻² | ||
| O | 50.6 | 1.52 × 10²³ | 5.08 × 10⁻¹ | ||
| Ca | 7.27 | 2.18 × 10²² | 7.30 × 10⁻² | ||
| Mg | 2.35 | 6.98 × 10²¹ | 2.33 × 10⁻² | ||
| Al | 1.14 | 3.31 × 10²¹ | 1.10 × 10⁻² | ||
| Proton | Si | 28.8 | 8.64 × 10²² | 2.89 × 10⁻¹ | 11.8 |
| Na | 9.85 | 2.84 × 10²² | 9.48 × 10⁻² | ||
| K | 0.10 | 2.93 × 10²⁰ | 9.78 × 10⁻⁴ | ||
| C | 2.12 | 6.38 × 10²¹ | 2.13 × 10⁻² | ||
| O | 50.3 | 1.51 × 10²³ | 5.06 × 10⁻¹ | ||
| Ca | 5.16 | 1.55 × 10²² | 5.18 × 10⁻² | ||
| Mg | 2.48 | 7.37 × 10²¹ | 2.46 × 10⁻² | ||
| Al | 0.96 | 2.78 × 10²¹ | 9.31 × 10⁻³ | ||
| S | 0.22 | 6.61 × 10²⁰ | 2.21 × 10⁻³ |
| Windshield Glass from Car Brand | TL Peak Position, TM (K) | Geometric Factor, μg | Activation Energy (eV) | Frequency Factor (s−1) |
|---|---|---|---|---|
| Honda | 627.15 | 0.51 | 1.18 | 2.97 × 10¹⁰ |
| Toyota | 646.15 | 0.49 | 0.83 | 1.86 × 10⁷ |
| Proton | 662.15 | 0.48 | 1.29 | 5.93 × 10¹⁰ |
© 2020 by the authors. Licensee MDPI, Basel, Switzerland. This article is an open access article distributed under the terms and conditions of the Creative Commons Attribution (CC BY) license (http://creativecommons.org/licenses/by/4.0/).
Share and Cite
Wahib, N.b.; Khandaker, M.U.; Sani, S.F.A.; Al-mugren, K.S.; Bradley, D.A.; Sulieman, A.; Faruque, M.R.I.; Sayyed, M.I. The Potential Use of Car Windscreens for Post-Accident Dose Reconstruction in the Periphery of Nuclear Installations. Appl. Sci. 2020, 10, 7127. https://doi.org/10.3390/app10207127
Wahib Nb, Khandaker MU, Sani SFA, Al-mugren KS, Bradley DA, Sulieman A, Faruque MRI, Sayyed MI. The Potential Use of Car Windscreens for Post-Accident Dose Reconstruction in the Periphery of Nuclear Installations. Applied Sciences. 2020; 10(20):7127. https://doi.org/10.3390/app10207127
Chicago/Turabian StyleWahib, Norfadira binti, Mayeen Uddin Khandaker, S. F. Abdul Sani, K. S. Al-mugren, D. A. Bradley, A. Sulieman, Mohammad Rashed Iqbal Faruque, and M. I. Sayyed. 2020. "The Potential Use of Car Windscreens for Post-Accident Dose Reconstruction in the Periphery of Nuclear Installations" Applied Sciences 10, no. 20: 7127. https://doi.org/10.3390/app10207127
APA StyleWahib, N. b., Khandaker, M. U., Sani, S. F. A., Al-mugren, K. S., Bradley, D. A., Sulieman, A., Faruque, M. R. I., & Sayyed, M. I. (2020). The Potential Use of Car Windscreens for Post-Accident Dose Reconstruction in the Periphery of Nuclear Installations. Applied Sciences, 10(20), 7127. https://doi.org/10.3390/app10207127