Abstract
Bluetooth Low Energy (BLE) is a wireless network technology used for transmitting data over short distances. BLE maintains a data transmission range comparable to the regular Bluetooth transmission, but consumes less energy and cost. iBeacon technology refers to BLE mobile devices, which allow mobile applications to receive signals from iBeacons in both indoor and outdoor environments. It is commonly used nowadays for positioning, location services, navigation and marketing, for the sustainable development of smart cities. The applications, however, can be further enhanced for use in many disciplines, such as education, health sector, and exhibitions for disseminating information. This study performed a set of robustness and performance tests on BLE-based iBeacons in the teaching and learning environments to evaluate the performance of iBeacon signals for positioning. During robustness testing, positioning accuracy, signal availability and stability were assessed under different environmental conditions, and the findings suggested pedestrian traffic blocking the line of sight between iBeacon and receiver, causing the most signal attenuations and variation in RSSI. In performance testing, a series of tests was conducted to evaluate the deployment of the iBeacons for positioning; leading to recommendations of iBeacon deployment location, density, transmission interval, fingerprint space interval and collection time in physical learning spaces for sustainable eLearning environments.
1. Introduction
1.1. Background
Bluetooth is a wireless communication technology under the standard of Wireless Personal Area Networks (WPAN), which is managed by the Bluetooth Special Interest Group (Bluetooth SIG) []. It aims at providing short-range communication and data exchange in 2.4 GHz channel as a replacement of the connection between devices with wires []. This technology has been commonly used in our daily life, such as in hands-free headsets, wireless mouse and keyboards, and data transfers between smart mobile devices, as well as the wireless control applications in smart homes. Bluetooth Low Energy (BLE, which started from Bluetooth version 4.0) is a low-cost, low-power protocol that is an extension of the general Bluetooth standard used for wireless communication. It allows short-range wireless communication and significantly reduces power consumption when compared to regular Bluetooth transmission []. The latest development of Bluetooth version 5 allows communication within a few hundred meters distance, increases transmission speed, enhances direction-finding and it is optimized for Internet of Things (IoT) applications [,].
iBeacon is a framework proposed by Apple [] based on BLE. The iBeacon device operates in the 2.4 GHz unlicensed band, which is the same as the Bluetooth standard channel, and emits Bluetooth signals in advertising mode with general information using major and minor identifiers, media access control (MAC) address and universally unique identifier (UUID) []. These identifiers allow a BLE-enabled device to identify which specific area is the user, and they are useful in the development of mobile applications which interact with users. For example, when a user gets close to an item on exhibit in a museum, an app will pop up with information about the exhibition based on the distance and identification information broadcasted from iBeacon installed near the exhibit. iBeacon devices using BLE can now operate for a period of several months to a couple of years on a single coin battery, which support sustainable practices in broadcasting signals. Bluetooth-equipped mobile devices are able to detect their proximity to an iBeacon transmitter based on the Bluetooth signals. Although iBeacon was originally specified by Apple, the BLE proximity features are compatible with Android and other BLE-equipped devices.
With the development of smart devices, location-based services can be used in many areas, for example, positioning and navigation, range monitoring and trackers, entertainment, business advertisement and information dissemination. Nowadays, real-time positioning is available for most smart devices with an embedded Global Positioning System (GPS) receiver, and outdoor positioning is no longer a complicated task. However, there are some limitations in GPS positioning, as this method relies on satellite visibility and receiver-satellite geometry. Due to the inaccessible GPS signals in indoor environments, indoor positioning becomes difficult, and researchers have attempted to use radio networks to tackle this issue. To provide location-based services in indoor environments, Wi-Fi fingerprinting has been used for indoor positioning [,] down to a few meters of accuracy, given a highly surveyed environment and Wi-Fi coverage. However, Wi-Fi is power-demanding compared to BLE. As well, Wi-Fi-based indoor positioning systems generally lack ideal density and geometry of access points for positioning purposes, as the Wi-Fi capabilities were not originally designed for this purpose. iBeacon, therefore, offers the potential of unrestricted indoor positioning, as it is available in almost every possible location via the placement of iBeacons [].
The original goal of BLE iBeacons was to provide proximity-based application services, such as targeted advertising and checkpoint services. By detecting the range to an iBeacon from the mobile devices, location-based notification and information can be disseminated to the user devices. TX power and the current received signal strength indicator (RSSI), are used to determine the distance from the iBeacons to the mobile devices. The TX power is the calibrated strength of the signal measured at 1 m from the source device (iBeacons), whereas RSSI is a measure of the strength of the iBeacon’s signal from the receiving mobile devices. Extensive research has been done on the methods in locating a mobile device with the iBeacon, given the potential interference from environmental factors on radio signals and the accuracy of RSSI, as well as the variations of radio frequency (RF) in indoor environments.
1.2. Objectives
The deployment of iBeacons is challenging work, which can be affected by numerous factors, e.g., the number of iBeacons, spacing between iBeacons, interference with electronic devices, algorithms used for positioning and environmental conditions. Despite the amount of research on the accuracy of indoor positioning, the literature has only focused on limited aspects of the deployment, such as placement or TX power, approaching issues from the point of view of an approximate function or general solution to a problem. While some educational institutions have used iBeacons in physical learning spaces for teaching and learning purposes [], for example, attendance monitoring [,], dissemination of electronic teaching material and information [,], combining augmented reality contents [,] and for smart facility management purposes [,], there is no research paper that has conducted a comprehensive study to analyse the various environmental factors and deployment factors on iBeacon positioning accuracy for physical learning spaces. For the sustainable deployment of iBeacons in the future, therefore, this paper aims to: (a) evaluate the influences of different environmental factors to iBeacon signals with a series of robustness testing, and (b) evaluate the performance of different deployment settings of iBeacon, i.e., deployment position, deployment density, space interval of fingerprint method, collection time interval of fingerprint method, iBeacon signal transmission interval, venue and crowd condition, with a series of performance testing under the same control environment.
2. Related Work
2.1. Related Work of iBeacon Positioning Methods
There have been many attempts in testing and improving indoor BLE positioning systems using RSSI [,,]. They are mainly categorised into two groups of method, i.e., trilateration and fingerprinting.
2.1.1. Positioning Using Trilateration Method
Trilateration locates the device by intersecting the distances between the transmitter and the device estimated from RSSI. Experimental results from Paek, Ko and Shin [] showed that while iBeacon has promising accuracy in distance estimation and proximity, signal strength readings vary greatly, depending on the manufacturer, mobile platform (Android/iOS), environmental and deployment factors, and use cases. Using maximum TX power of 4 dBm at 1.2 m height, they found that RSSI readings for Android and iOS platforms decreased at different rates with increasing distances and temporary variation as well. Accuracy analysis of BLE for indoor positioning applications [] clarifies that low bandwidth of BLE signals is the cause of significant measurement error when using the three designated BLE advertising channels. To eliminate the measurement error in received signals, some researchers enhanced the positioning accuracy using particle filtering [], Kalman, Gaussian, and hybrid filters []. Fard, Chen and Son [] demonstrated that errors could increase significantly with increased distance when the RSSI signals varied over time. To improve positioning accuracy, previous studies conducted experimental tests in different indoor situations, with various signal database matching and signal-to-distance estimation methods. Ng [] revealed an average error of 0.43 m when measuring the distance from 0 m to 3 m with a constant speed of 0.01 m/s, and the average percentage error of 41.47%. This indicated that using iBeacon for precise positioning with consideration of height, localisation, geometry and TX power, could lead to fast fading and RSSI fluctuations, because of the logarithmic nature of power-based distance prediction and the low bandwidth of BLE. Martin, Ho, Grupen, Muñoz and Srivastava [] achieved positioning accuracy of 0.53 m in a 9 m × 10 m area by modelling the distance with exponential function of RSSI and TX power. Castillo-Cara et al. [] used two classification algorithms to improve the TX power settings for each iBeacon, and discovered a custom TX power level for each BLE Beacon could greatly improve positioning accuracy.
2.1.2. Positioning Using Fingerprinting Method
The fingerprinting method is another approach for radio-based positioning. This method requires the collection of signal strengths (RSSI) from each of the transmitters at every evenly spaced grid, with true location recorded to establish a signal database. With the database collected, positioning can be achieved by matching the instantaneous signals collected by a mobile device, with the database using deterministic or probabilistic methods to determine the location of the device. Generally, fingerprint-based approaches are superior in terms of accuracy to trilateration techniques []. Kriz, Maly and Kozel [] proposed a radio-based, indoor stationary positioning system, by comparing the Wi-Fi and BLE signals with the database using the k-nearest neighbour algorithm. Accuracy was improved and variance was reduced moderately when using the system. In the study conducted by Takahashi and Kondo [], location estimation algorithms were also compared, and the nearest neighbour method had a 1-meter lower average error than the k-nearest neighbour. Peng, Fan, Dong and Zhang [] used an iterative weighted k-nearest neighbour method to improve the traditional k-nearest neighbour method, and reduced the mean error by 1.5 m to 2.7 m in their experimental environment. Similar work [] reported a 1.2 m accuracy using a fingerprinting indoor positioning scheme in an ideal test space of 47.4 m × 15.9 m.
2.2. Related Work of iBeacon Deployment
The effectiveness and accuracy of a standalone implementation of BLE systems are clearly highly dependent on the environmental conditions [] and devices []. Research on improving the maximum accuracy and efficiency of indoor positioning [], as well as discussions of placement techniques for positioning such as trilateration and cell-based positioning, has been conducted []. The linkages between positioning accuracy, iBeacon arrangement and the number of iBeacons were discussed by Aman, Jiang, Quint, Yelamarthi and Abdelgawad [], who found additional iBeacons improved positioning accuracy. The lowest average errors were found by the authors of [], with a hexagonal iBeacon placement pattern relative to pentagonal, square and triangular layouts. Ji, Kim, Jeon and Cho [] analysed the signal attenuation of iBeacon and simulated the deployment of iBeacons in random-based and grid-based approaches. The results showed that more iBeacons always led to higher positioning accuracy, and the grid-based approach outperformed random-based approach when the grid interval was small enough.
Supporting the idea that additional iBeacons improve accuracy, a three-dimensional positioning experiment conducted by Yang, Wang and Wang [] resulted in maximum errors of 1.2 m in a 7 m × 5 m × 3 m room with four iBeacons, and a decreased maximum error of 0.77 m with an additional four iBeacons. However, receiving six to eight iBeacons at each fingerprint point was suggested by the authors of [], which was found to be sufficient, as there was minimal incremental benefit and iBeacon coverage beyond that point to further improve the accuracy of positioning []. The iBeacons were typically placed in the room in a high position on the wall or the ceiling for most studies, and the test sites were devoid of obstacles such as furniture and computers []. As the installation height affects signal quality, Paek, Ko and Shin [] compared the effects of placing the iBeacons on the ground with a height of 1.2 m. The placement of iBeacons on the ground yielded significant drops in RSSI with a maximum distance of only 12 m, as opposed to the 100 m recorded when the iBeacons were installed at a height of 1.2 m. To reduce the time cost of positioning error calculations, Yuan, Li, Xu and Zhao [] formulated an approximate function to optimise the BLE iBeacon placement method. They found that in various indoor settings, the approximate function was comparably effective with regards to other node placement methods.
A more specific exploration of iBeacon placement was studied by Rezazadeh et al. [], who formulated the Crystal-based iBeacon Placement (CiP) method for placing iBeacons indoors, in order to deploy the smallest number of iBeacons to cover the maximum possible area. To ensure this would happen, user devices must be able to receive sufficient iBeacon messages for positioning. This was achieved by initially deploying three iBeacons in an equilateral triangle, and then extending the coverage by placing iBeacons adjacent to the equilateral triangle, creating a “crystal shape.” CiP ensures the shortest possible distance between any three iBeacons, which improves positioning accuracy. CiP was analysed both vertically and horizontally; this method provided a 21.16% improvement in accuracy over random placement and Z-placement, as described by Rezazadeh, Moradi, Ismail and Dutkiewicz []. The CiP method resulted in a relatively lower location error due to the higher quality of the signals. A novel approach to the Beacon placement problem by Schaff, Yunis, Chakrabati and Walter [] aimed at searching for placement and inference strategies that, when combined, would be optimal for any given environment. They achieved this using a neural network formulation of inference, in conjunction with a differential neural layer that encoded Beacon distribution. The inference network and Beacon layer were then trained together to learn an optimal design for any given environment. In doing so, Beacon placement decisions could be made automatically and without expert supervision. Whereas iBeacon/Beacon placements have been explored through a number of attenuations and experimental studies, examinations and testing in other settings and conditions, which possibly influence the accuracy of positioning using BLE, are also necessary.
3. Methods
In order to evaluate the performance of iBeacon positioning under different environments and deployment settings, two sets of testing were conducted in this study, namely, robustness testing and performance testing, with the overall framework shown in Figure 1. Robustness testing focuses on the effects of distance and environmental factors (e.g., temperature, wind, trees, vehicle traffic, pedestrian traffic with and without blocking line of sight) on the stability of the iBeacon signals in outdoor environment. The details of the setup are described in Section 4. Performance testing focuses on the effects of various deployment plans and environmental factors on indoor positioning accuracy, including the iBeacon deployment position, deployment density, fingerprint space interval, fingerprint collection time, transmission interval, influence of venue and the crowd analysis. The details of the tests can be found in Section 5.
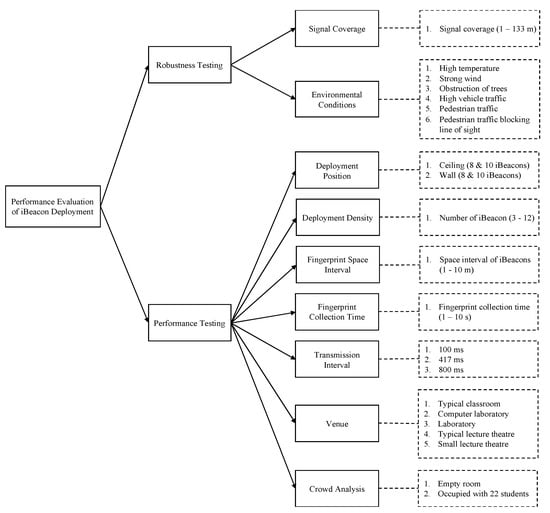
Figure 1.
Overall framework of the study.
The two sets of testing were designed for indoor and outdoor learning spaces, respectively. These tests were conducted using BrightBeacon, which is a BLE 4.0 iBeacon. The data were collected with two Android phones, Samsung SM-C7100 (hereafter device 1) and Sony G3426 (hereafter device 2).
4. Robustness Testing
Two robustness tests were conducted outdoors using two iBeacons and the two mobile devices, including (1) the signal coverage test and (2) the environmental conditions test. The iBeacon settings were defined as default (i.e., TX power of 4 dBm and 417 ms transmission interval) and a standard deployment height of 1.5 m was implemented for both the iBeacons and the mobile devices. The tests were conducted in the outdoor environments of the Hong Kong Polytechnic University. Figure 2 shows the site photos of the experiment.
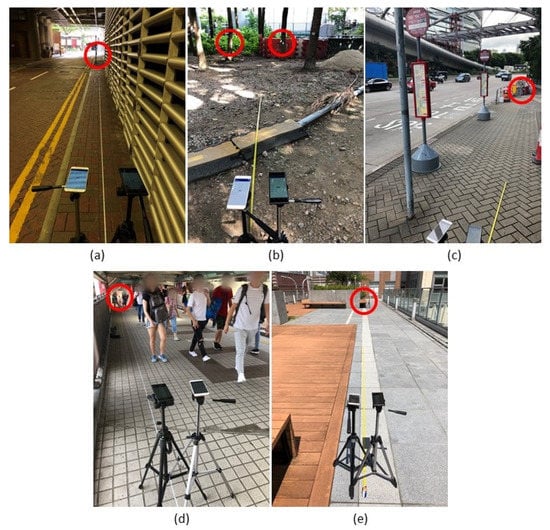
Figure 2.
Experimental setup of signal coverage test and environmental conditions test where the red circles indicate the location of iBeacons installed. (a) Signal coverage test. (b) Obstruction of tree. (c) High vehicle traffic. (d) Pedestrian traffic. (e) Control dataset.
4.1. Signal Coverage Test
Two iBeacons were deployed on a column with tape, with a long line of sight, to test the maximum signal coverage and the stability of signals; the two mobile devices were fixed on camera tripods at 1.5 m height as shown in Figure 2a. The RSSI was measured using the two mobile devices from 5 m to 133 m distance ranges, at 5 m intervals from 5 m to 120 m, and at 1 m interval from 121 m to 133 m. At each of these distances, 1 min of data was collected.
The outdoor maximum coverage test demonstrated that the iBeacons could provide outdoor coverage for up to 133 m with the data from two iBeacons. The signal packet loss rate, RSSI and the standard deviation of RSSI from the two devices at 5 m intervals from 5 m to 120 m, and at 1 m intervals from 121 m to 133 m, were recorded and plotted in Figure 3. From Figure 3a, the packet loss rate from device 1 became unstable after 120 m. For device 2, it started to fluctuate at 80 m. The graph shows that signals were attainable and stable when the distance was short, but different results obtained by the two devices after 80 m suggest that differing wireless capabilities of the devices could lead to different sensitivities to wireless signals. However, implications for long-range outdoor use-cases are probably unusual, as any deployment of iBeacons should entail more than one iBeacon for a distance of over 100 m.
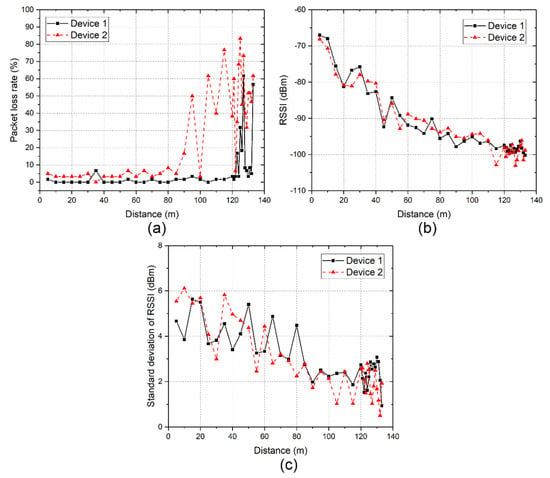
Figure 3.
Analysis of maximum coverage test on (a) signal packet loss rate, (b) received received signal strength indicator (RSSI) and (c) standard deviation of RSSI.
In terms of the RSSI, a logarithmic nature was found in both Figure 3b and Figure 3c. The RSSI collected by the two devices (Figure 3b) and their standard deviations (Figure 3c) were very similar, with an average RSSI of −88.02 dBm (for device 1) and −87.94 dBm (for device 2), respectively, and a standard deviation of 3.56 dBm (for device 1) and 3.50 dBm (for device 2) from the range of 5 m to 120 m. The result suggests the RSSI was stable when collected by different devices at different distances, and the estimation of distances from RSSI was practical.
4.2. Environmental Conditions Test
The environmental conditions test was conducted in the summer of 2018. All experiments were performed on cloudy dates without direct sunshine or conducted at locations with cover; the recorded air temperatures ranged from 27 °C to 32 °C. The signals were tested under the following conditions: (a) high-temperature environment (i.e., air temperature of 32 °C and iBeacon surface temperature of 45 °C recorded by thermometer); (b) strong wind, with speeds of 5.7 m/s recorded by nearby weather station; (c) obstruction of trees (Figure 2b); (d) high vehicle traffic (Figure 2c); (e) pedestrian traffic (Figure 2d); (f) pedestrian traffic blocking the line of sight between the iBeacon and mobile devices; and (g) control environment. In experiments (a), (b), (e), (f) and (g), two iBeacons were installed on a camera tripod at 1.5 m height, and the iBeacons were stuck on tree trunks and fences with plastic tape at 1.5 m height for experiments (c) and (d), respectively. As with the signal coverage test, the two mobile devices were fixed on camera tripods during the data collection.
To ensure the stability of iBeacon signals, the tests started after the iBeacons were deployed for at least two hours under each environmental condition. For experimental conditions (a)–(e), the signals were measured from distances 1 m to 20 m at 1 m intervals for 1 minute. For experimental condition (f), the signals were measured from distances 2 m to 20 m with same interval and duration as (a)–(e). The signal data collected were compared with the control data collected in a typical outdoor environment with fewer environmental factors, as shown in Figure 2e (i.e., air temperature at 28 °C and iBeacons installed under the shadow of a tree crown with an internal temperature of 34 °C, wind speed of 3.3 m/s recorded by nearby weather station and no pedestrian and vehicle in the experimental environment).
Figure 4 and Table 1 show the results of the environmental conditions test using two iBeacons where Figure 4 presents the (a) packet loss rate, (b) received RSSI and (c) standard deviation of RSSI; and Table 1 compares the overall packet loss rate, average and standard deviation of RSSI of 0.5 m to 20 m measurements. Comparisons were made with the control set data, although fluctuations of the RSSI and signal stability existed under normal conditions. Figure 4a indicates that the packet loss rate differed significantly between the control and some testing environments, including high temperature, pedestrian traffic near the iBeacons and mobile devices, and pedestrian traffic blocking the line of sight between iBeacons and the devices. Table 1 also suggests the obstruction by pedestrians and high temperature resulted in a relatively higher packet loss rate, while the effects of other factors were limited.
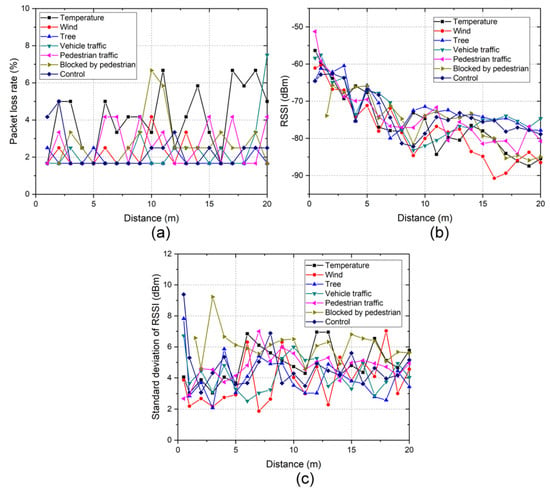
Figure 4.
Analysis of environmental conditions test on (a) signal packet loss rate, (b) received RSSI and (c) standard deviation of RSSI.

Table 1.
Average packet loss rate, RSSI and standard deviation of RSSI.
By comparing the RSSI between the environmental conditions in Figure 4b and Table 1, the high temperature, strong wind and blocking of pedestrians lowered the signal strength when compared with the control set. The standard deviation of the RSSI also indicates the adverse effects at the high temperature and the blocking of the signal by pedestrians. Table 1 highlights that the signal stability was more severely affected if pedestrians were blocking the line of sight between the mobile device and the iBeacon in comparison to when the line of sight was not blocked.
Our findings showed that signal fluctuation was present in the control data, which were collected from ideal outdoor settings, regardless of environmental conditions. The results suggest the presence of trees and nearby vehicle traffic did not have any negative effects on the signals. The high air temperature led to significant increase of packet loss rate and this slightly affected the signals in terms of RSSI and standard deviation of RSSI. The strong wind reduced the signal strength but did not vary the stability of signals. Pedestrian traffic without blocking the line of sight, led to mild increases of packet loss rate, and did not impact the stability of the iBeacon signals. Pedestrian traffic blocking the line of sight, caused the largest adverse impact on both packet loss rate, RSSI and the standard deviation of RSSI. The effects of the line of sight were far more significant than other environmental factors. When accounting for ways to provide stable and accurate positioning, the results recommend that the deployment of signal-based positioning systems should consider the line of sight as the first priority, as the signal quality and stability are most easily impacted by this factor.
5. Performance Testing
Various implementation factors that could affect the BLE signals and the overall positioning accuracy were identified in performance testing. A series of tests was performed, including (1) a deployment position test (ceiling vs. wall), (2) a deployment density test, (3) a fingerprint space interval test, (4) a fingerprint collection time test, (5) a transmission interval test, (6) a venue test and (7) a crowd analysis test; to evaluate the performance of the iBeacon deployments in indoor positioning. Tests were conducted in sequences that allowed findings from earlier tests to be incorporated into later tests.
For each test, we collected sets of fingerprint data using the mobile devices as the signal database, with handheld posture and sets of random samples spread across the room as test points. The true positions of the test points were surveyed by steel tape, and these true positions were compared with the positioning results obtained from the tests for evaluation and analysis. The weighted k-nearest neighbour method was employed for all performance tests in this study, for matching the signals collected at test points to the fingerprint database. This method assigns the weighting to the k-nearest neighbour points based on the signal distance, and calculates the coordinates of the test points using (1):
where is the selected number of nearest neighbour, are the coordinates of the points having the shortest distance with the test point and is the weighting calculated by distance:
where is the Euclidean distance of signals. Based on the findings from our preliminary study, the positioning accuracy is the highest when selecting k equals to 4 in the weighted k-nearest neighbour method. Thus, we used this value for all the performance tests.
The fingerprint grid interval was 1 m and the fingerprint collection time was 10 s, except when testing the effects of fingerprint grid interval and collection time on positioning accuracy. The fingerprint data were collected with static status to one direction, facing the blackboard/whiteboard at the front only, because most students would sit in this direction in normal teaching and learning spaces. The testing data were collected with the same configurations as the training data. Tests conducted after the first test, i.e., the deployment position test, used the signal data collected from ceiling-mounted iBeacons due to the superior accuracy of that placement method. The tests were conducted in the classrooms of the Hong Kong Polytechnic University as described in Table 2 and shown in Figure 5.

Table 2.
Classroom used for performance testing.
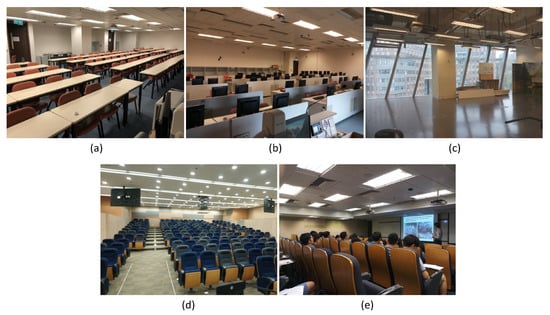
Figure 5.
Experimental environments. (a) Typical classroom (Room ZB214). (b) Computer laboratory (Room ZS1010). (c) Laboratory (Room V721). (d) Typical lecture theatre (Room Z205). (e) Small lecture theatre (Room Z414).
Room ZB214, which is a typical classroom with general classroom furniture and less known factors affecting iBeacon signals, was selected as a testbed to evaluate the general influence of deployment configurations to the positioning accuracy. Other classrooms (i.e., Rooms ZS1010, V721, Z205 and Z414), with characteristics listed in Table 2, were used for the venue test and crowd analysis test.
5.1. Deployment Position Test (Ceiling vs. Wall)
The deployment position test was conducted in Room ZB214, and the wall and ceiling placement of iBeacon were deployed and compared, in order to study whether simple placement choices could provide substantial increases in positioning accuracy at little to no extra cost and labour. For the wall deployment, the iBeacons were stuck on the wall with tape at 2 m height, while the ceiling deployment involved installing the iBeacons to the ceiling with the location shown in Figure 6. The test compared the positioning accuracy of deployment heights of 2 m up the wall versus on the ceiling, which was 2.38 m high. Eight and ten iBeacons were tested for each deployment scheme with the locations shown in Figure 6. The discrepancy between the two placement methods was the effect of geometry, as the iBeacons were located at the edge of classroom for wall placement because of the physical limitation, whereas the iBeacons could be evenly distributed in the classroom for the ceiling placement.
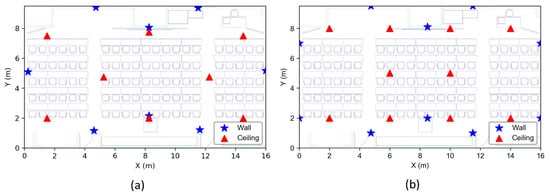
Figure 6.
Deployment plans. (a) 8 iBeacons; (b) 10 iBeacons.
The results of deploying iBeacons to the ceiling or wall with 8 or 10 iBeacons, respectively, are presented in Figure 7. As shown in Figure 7, the positioning accuracies from the ceiling and wall deployment schemes were compared with the cumulative distribution function (CDF). From Figure 7, we observed a lower error rate when 8 iBeacons were deployed on the ceiling compared with being deployed on the wall, and the superior accuracy of the ceiling deployment scheme with 10 iBeacons echoed the results obtained with 8 iBeacons. The root-mean-square error (RMSE) for the ceiling deployment was also lower than that of the wall placement method for the deployments of both 8 and 10 iBeacons.
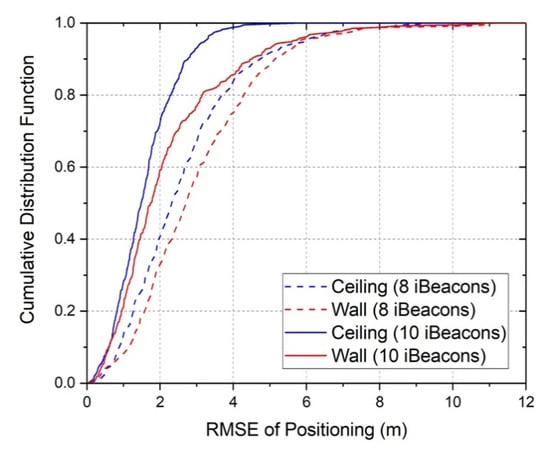
Figure 7.
Cumulative distribution function (CDF) comparison of the two deployment methods using 8 and 10 iBeacons, respectively.
The positioning accuracy improved with ceiling placement due to the reduction of obstructions between the iBeacons and the mobile device. By mounting iBeacons on the ceiling, there were fewer obstructions like people, furniture, hanging light fixtures and computers, etc. This mounting method allows a more consistent line of sight and enables flexibility in placement geometry, as iBeacons can be placed anywhere on the ceiling to ensure balanced coverage, while wall-based schemes are confined to the edges of the space. The results confirmed a drop in the positioning accuracy when using wall-based schemes, in particular, poorer accuracy in larger areas, as poor geometry results in the lack of signal in the centre as well as higher susceptibility to obstructions. If ceilings are too high, or ceiling deployment is impracticable because of the environment, wall-mounted iBeacons should be placed at a height higher than the average person, to ensure the line of sight is not blocked as suggested in the environmental conditions test.
5.2. Deployment Density Test
To identify a balance between iBeacon number and accuracy of positioning, different numbers of placement were tested. Twelve iBeacons were deployed in Room ZB214 on the ceiling and their positions were recorded. Fingerprint data were then collected, and the test was repeated, with one iBeacon removed each time until there were only three iBeacons left. The initial setup of the iBeacon is presented in Figure 8.
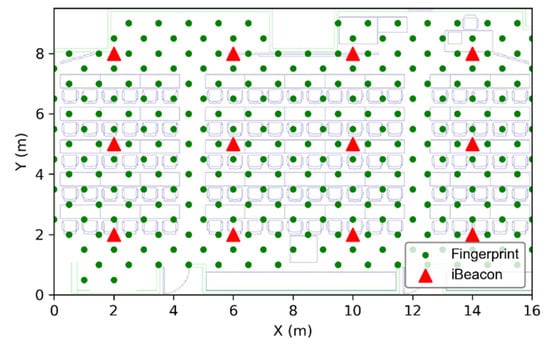
Figure 8.
Deployment plan of 12 iBeacons and the locations of fingerprint collection.
Using more iBeacons can result in greater coverage, with the following caveats. Deployment density can be increased by walls, furniture, distance and other obstacles, as they could attenuate the signals. With the deployment of different numbers of iBeacons, ranging from 12 to 3 iBeacons in this test, the CDF of RMSEs were plotted in Figure 9. The results show that positioning accuracy was enhanced by increasing the number of iBeacons from 3 to 12 (Figure 9). The RMSE was highest with three iBeacons and diminished gradually until eight iBeacons were deployed. The CDFs of the RMSE in using more than eight iBeacons were very similar in Figure 9. Figure 10 presents the difference in RMSE using different numbers of iBeacons. The results indicate that there was a significant improvement in accuracy from 3.44 m to 1.80 m, when the number of iBeacons was increased from three to eight. Using more than eight iBeacons resulted in a minimal increase in accuracy. The improvement of RMSE from 8 iBeacons to 12 iBeacons was 0.26 m, which was reduced from 1.80 m to 1.54 m. Dalkilic et al. [] explained that when iBeacons are close to each other (for instance, when there are too many iBeacons), the receiving mobile phones have difficulties detecting the exact location of the signal sources. Our results suggest that having too many iBeacons not only fails to improve the positioning accuracy significantly, but could also result in unnecessary overlaps of coverage areas.
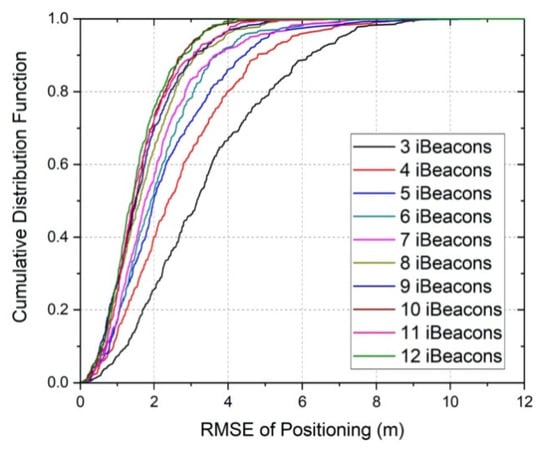
Figure 9.
CDF comparison of deploying different number of iBeacons.
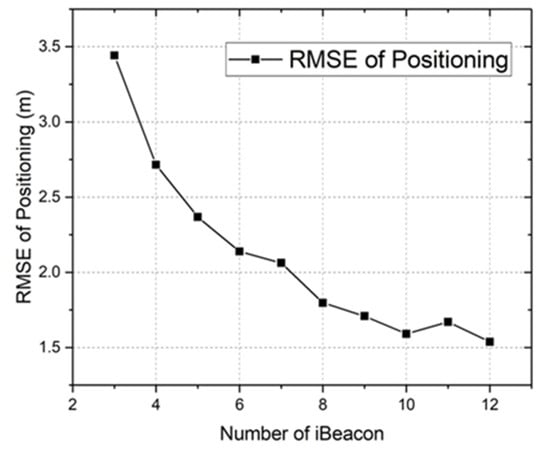
Figure 10.
Root-mean-square error (RMSE) of deploying different number of iBeacons.
From the experimental results, eight iBeacons were appropriate for the deployment in balancing the iBeacon hardware required and the RMSE error, but this number was dependent upon the room size. In considering the testing environment of a classroom with an area of 152 m2, the average spacing between iBeacons was 4.4 m, the context whereby this spacing was recommended in consideration of deployment density.
5.3. Fingerprint Space Interval Test
The viability of increasing fingerprint grid spacing to reduce labour at a negligible cost to accuracy was also studied. The same configuration with the deployment density test, using 12 iBeacons on the ceiling, was conducted in Room ZB214, and the fingerprint data were collected at 1 m grids as shown in Figure 8. Grid spacing was compared, ranging from 1 m to 10 m at 1 m intervals.
Experimenting with fingerprint grid widths represents an opportunity for those implementing BLE-based systems to save time and manpower. The results of collecting fingerprint at different space intervals with 12 iBeacons installed on the ceiling are shown in Figure 11. The CDF from 9 m and 10 m grids were very similar, having the lowest accuracy, which was over 5 m in overall RMSE. This was the result of a lack of fingerprint collection points in the room, since these two intervals collected signals at one point as database only.
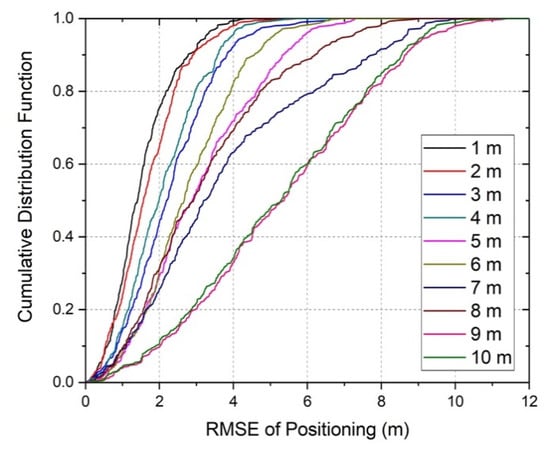
Figure 11.
CDF comparison of collecting fingerprint at different space intervals.
When the fingerprint became denser by reducing the interval from 7 m to 2 m, the accuracy improved significantly. The 1 m grid barely outperformed the 2 m grid in terms of positioning accuracy. In the 2 m grid, the RMSE was 1.70 m, which was very close to the result of a 1 m grid at 1.54 m RMSE. The 1 m fingerprint grid had the advantage of producing the highest accuracy, making it a preferred choice when time and manpower are not limiting factors. However, this setting required double effort in collecting the fingerprints compared to the 2 m grid. The 2 m grid was the most balanced grid width choice with regards to accuracy-labour-time trade-offs. If a large-scale deployment was to take place, this might allow significant savings of time and manpower. Figure 11 also suggests that even-number intervals performed better than odd-number intervals for most cases, e.g., 8 m was better than 7 m and 6 m was better than 5 m. The 3 m grid result was substantially less accurate than 2 m and 4 m grid. If the 2 m interval is unachievable because of the limited time or labour resources, selecting even-number intervals can slightly improve the positioning accuracy.
5.4. Fingerprint Collection Time Test
The effect of shorter fingerprint collection time on positioning accuracy and time saved was evaluated. Similar to the fingerprint spacing test, 12 iBeacons were deployed on the ceiling and the fingerprints were collected at 1 m spacing in Room ZB214. iBeacon signals were collected at every point for 10 s and the data were trimmed progressively to shorter collection times, at 1 s intervals, until 1 s. The positioning result, the relationship between fingerprint collection time and the positioning accuracy were analysed.
Testing of fingerprint collection time was conducted with the same configuration, using 12 iBeacons installed on ceiling. The CDF comparison of the collection time by RMSE, under different collection times, is shown in Figure 12. As the collection time increased, the RMSE of positioning accuracy decreased. The RMSE decreased substantially from a collection time of 1 s to 3 s, suggesting that very short collection times cause large uncertainties in positioning. There was a significant reduction in variance at a collection time of 4 s, and similar positioning errors were found in collection time of 4 s to 10 s. Although improvements were observed in the error rate with every additional second of collection time, improvements in RMSE from 6 s to 10 s were extremely marginal, with a drop from 1.53 m to 1.49 m.
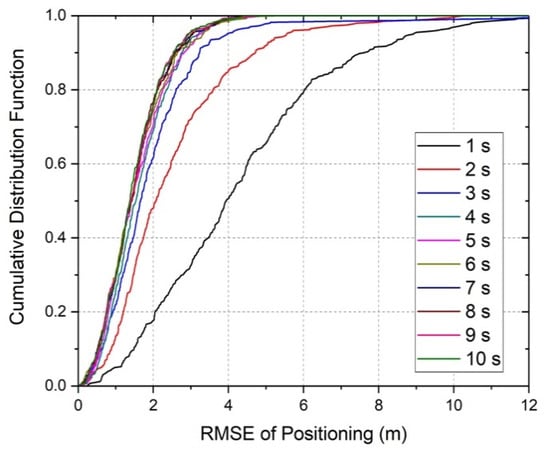
Figure 12.
CDF comparison of the collection time by RMSE under different collection times (in seconds).
The fingerprint collection time is also a parameter that can be altered to either save time or increase accuracy, depending on the limitations of the deployment. Our results demonstrated that a fingerprint collection time of at least 6 s was required for satisfactory accuracy, for use in indoor deployments. Whereas improvement in accuracy was observed beyond 6 s, it was almost imperceptible compared to significant leaps in accuracy when moving from 1 s collection time to 2 s, or from 2 s to 3 s. When deploying iBeacon positioning systems, our recommendation is a collection time of at least 6 s at each grid point, as no discernible positive effect was seen for collection times over 10 s.
5.5. Transmission Interval Test
We aimed at determining the accuracy performance differences between different transmission intervals and balance accuracy with battery usage. An identical setup in Room ZB214 with a 10 s collection time was used in this test (Figure 8), and the transmission interval effects on accuracy were tested by altering the settings of the iBeacons. Three transmission intervals of 100 ms, 417 ms and 800 ms were tested. Transmission intervals of over 1000 ms were not used because of potentially unacceptable delays for real-time location-based service applications, such as adaptive learning and exhibitions. For the iBeacon used, 417 ms was the default transmission interval, and 100 ms was selected as a potential improvement over the default in terms of positioning accuracy.
As the increase of the transmission interval reduces the power consumption of iBeacons, we aimed to locate a balance between accuracy and power consumption. Thus, the experiment was conducted in the same room (ZB214) with 12 iBeacons. The hypothesis in this test was that reducing the transmission interval would improve the positioning accuracy, due to a greater number of Bluetooth signals in a fixed period of time. We expected that a short transmission interval (i.e., 100 ms) would have better performance than long transmission intervals (i.e., 417 ms and 800 ms) because of the high number of signal packets. Yet, the CDF of RMSE did not support this hypothesis (Figure 13). The CDF curves of 100 ms and 800 ms interval were very similar, and most of the parts overlapped. The differences between their overall RMSE were only 0.01 m, where the RMSE of 100 ms interval was 1.81 m and the RMSE of 800 ms was 1.80 m. As shown in Figure 13, the interval of 417 ms outperformed significantly and the overall RMSE was only 1.54 m.
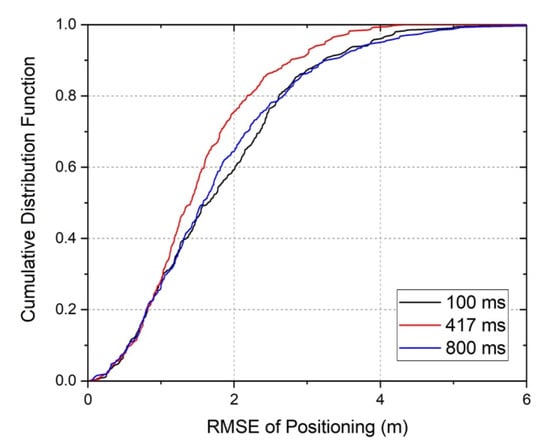
Figure 13.
CDF comparison of the three different transmission intervals.
One of the main advantages of the BLE protocol over standard Bluetooth is its lower power consumption over the same range, enabling battery life extensions of months to years. When altering the transmission interval of the iBeacons, the battery life is affected. Frequent transmissions lead to shorter battery life, whereas less frequent transmissions prolong it. Our results show that decreasing the transmission interval to 100 ms was actually detrimental to the positioning accuracy, relative to the default setting of 417 ms. Furthermore, this resulted in significantly faster depletion of the iBeacon battery. We recommend that the transmission interval be set at 417 ms, as this ensures a long battery life and provides two signal packets per second, which can fulfil the requirements of most usage scenarios.
5.6. Venue Test
Due to the potential influences of environmental factors (e.g., electronic equipment, furniture and glass walls) on the quality and availability of the iBeacon signal, testing in various learning space venues was conducted to ensure ample coverage and performance. The purposes of the test was to assess the accuracy differences between different classrooms and to acquire useful data on implementing indoor location-based systems for different venues. Classrooms with characteristics (i.e., Rooms ZS1010, V721, Z205 and Z414) were used for the venue test. Room ZS1010 is a computer laboratory with 60 desktop computers, which was used to investigate the effects of electronic interference on the iBeacon signals. Room V721 is a laboratory with a full-height glass panel which is known to induce multipath effects. In addition, two types of common lecture theatres were also tested (Rooms Z205 and Z414) for better evaluation of positioning accuracy in learning spaces. The data collected from each classroom were compared with the results from a typical classroom in Room ZB214 to investigate the detrimental effect on positioning accuracy.
A typical classroom (Room ZB214), a computer laboratory with 60 desktop computers (Room ZS1010), a laboratory with a full-height glass panel (Room V721), a typical lecture theatre (Room Z205) and a small lecture theatre with one window on the wall (Room Z414) were chosen to assess the differences in positioning accuracy caused by indoor environmental factors. Since the rooms are in different dimensions, the percentage errors are compared in Table 3 rather than comparing the CDF of the RMSE.

Table 3.
RMSE and percentage error results of the venue test.
Table 3 shows that Rooms Z205, ZB214 and Z414, a typical lecture theatre, a typical classroom, and a small lecture theatre, respectively, which did not contain an abundance of computers, windows, and electronic equipment, had the lowest error rates of 7.81%, 8.26% and 9.93%, respectively. The computer laboratory (Room ZS1010) had a higher percentage error than the three rooms mentioned above. The difference between the computer laboratory and the others was the existence of 60 desktop computers. Computers and other electronic equipment generate an electromagnetic field which can affect the BLE signals. In the study conducted by Dalkilic et al. [], iBeacons were affected by the computer, and the estimated distance from the mobile device to the iBeacons became more accurate if the computers were removed. Our results also support the finding that the presence of computer equipment lowers iBeacon positioning accuracy.
The laboratory with the full-height glass panel (Room V721) provided the worst positioning error, 12.41%. The reflective materials, e.g., the coatings on a glass panel, can cause a multipath effect where the iBeacons could be easily reflected by the glass coatings. As stated by Huh and Seo [], Bluetooth Beacon signals have a multipath problem, as the signals are reflected several times before reaching the receiver, causing uncertainty in distance estimation and positioning. Our results demonstrated that the wall materials of the room could contribute to the error on measurement, and the existence of reflective materials adversely affected the positioning when compared with other indoor environment settings. The findings from this test support that positioning accuracy varies greatly according to the equipment, obstructions, and amount of reflective materials present in the indoor environment. The installation location of iBeacons should be tested to reduce the effects of interference from electromagnetic signals and the multipath effects.
5.7. Crowd Analysis Test
As our usage scenario involves deployment in university lectures, labs and classrooms, it is important to determine the effects of crowds of people on the availability, stability and quality of the iBeacon signal. Since a human body is composed of approximately 70% water, it interferes with radio signals in the 2.4 GHz spectrum in which iBeacon operates []. Crowd analysis test was conducted in Room Z414 by comparing positioning results for the case with and without students in the room. The tests followed the same procedures for fingerprint collection, but two sets of random test points were collected. One set was collected in a classroom with 22 students, and another set was tested in an empty room. Two sets of data were then analysed for accuracy.
The negative impact of the pedestrian was evaluated in the previous outdoor environmental conditions test, and the results suggest the human body attenuates wireless signals. The influence of a crowd in a room was tested in this experiment by mounting the iBeacons on the ceiling to enhance the line of sight for better signal transmission. Figure 14 compares the CDF of RMSE results from the classroom with 22 students and the classroom without students. The positioning performance of the empty room was better than that of the occupied classroom. The overall RMSE increased from 1.10 m to 1.23 m, with an increment error rate of 1.17% when the room was occupied with students.
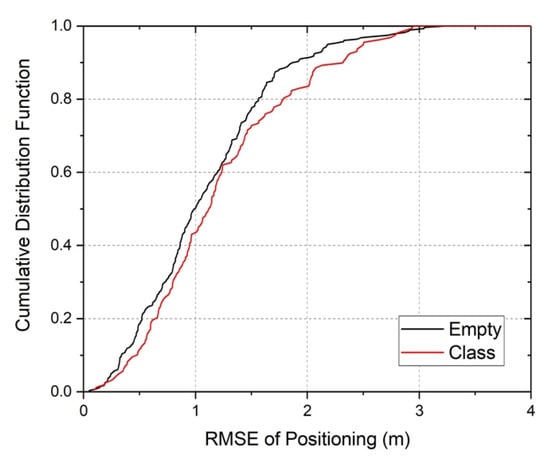
Figure 14.
CDF comparison of classroom with/without students.
We anticipated that the density of students in classrooms would attenuate the signal to a certain extent. However, the iBeacon placement tests confirmed the superiority of ceiling placement scheme over wall-based scheme, and demonstrated that the negative effect of the human body on positioning accuracy performance could be mostly negated by increasing the line of sight propagation, gained by ceiling placement of the iBeacons. We recommend that any concerns regarding the attenuation of the signal by a crowd be allayed by adopting a ceiling placement scheme.
6. Discussion
This study presented the results of experiments conducted for the performance evaluation of the deployment of iBeacons for positioning purposes. During robustness testing, positioning accuracy, signal availability and stability were assessed under different environmental conditions. The results of the outdoor robustness test demonstrated that the maximum signal coverage of up to 133 m was relatively consistent, despite different mobile devices were used, and the signal was stable until 80 m. This test also evaluated the stability of the iBeacon signals under different environmental conditions, indicating the presence of trees and nearby vehicle traffic caused an ignorable effect to the iBeacons. The conditions of high temperature, strong wind and pedestrian traffic without blocking the line of sight induced minor discrepancy to the signal. A significant adverse effect on the signals was found when the line of sight between a smart device and the iBeacon was blocked by pedestrians. Thus, preserving the line of sight between the iBeacons and the receiver is the key factor in enabling steady signal availability.
The performance testing examined various parameters, determined the trade-offs between accuracy and other factors and developed a series of recommendations for indoor BLE iBeacon deployment (Table 4). The results suggest installing iBeacons on the ceiling instead of the wall, as ceiling placement has better geometry and maximises the line of sight by avoiding the obstructions. Although more iBeacons deployed would provide higher positioning accuracy, there is still a concern of cost. Our results recommend an average spacing of 4.4 m for iBeacon deployment, which can balance the positioning accuracy and the number of iBeacons. Appropriate transmission time setting of iBeacon can also reduce the cost of iBeacons, by extending the battery life, as the setting of 417 ms interval outperformed 100 ms and 800 ms in this study. The training phase of iBeacon positioning always involves the collection of fingerprints, which is a labour and time-intensive task. By considering the collection time and outcome, collecting the signal database at the 2 m grid interval with 6 s to 10 s at each point is recommended. The venue test suggests that the existence of electronic devices/equipment and the reflective materials would cause unfavourable positioning performance because of the interference and multipath effects, but these negative effects are unavoidable and the installation location of iBeacons should be evaluated empirically.

Table 4.
Recommendations for iBeacon deployment.
7. Conclusions
In order to deploy iBeacons in physical learning spaces sustainably, this study performed robustness testing and performance testing to evaluate the signal stability and positioning accuracy under different deployment settings. The robustness testing indicated the iBeacon signals are relatively stable when the distance between the transmitter and receiver is shorter than 80 m, with the preservation of the line of sight. The results from performance testing recommend future deployment on the ceiling, with a grid density of 4.4 m, configurated at a transmission interval of 417 ms. A time for each of the fingerprint collection point, from 6 s to 10 s, is preferred, and the results suggest that the spacing should be 2 m.
Although recommendations are made in this study, there are still some limitations. First, the experiments conducted in this study used only two Android phones for data collection, and the smart devices with different BLE chips had different sensitivities on the signal receptions. The performance of iBeacons from different brands is also another consideration, as only Brightbeacon was employed in this study. The signal transmission power and interval, stability of signals and the battery life of other brand products may differ from the iBeacons we used, and the recommendations may deviate from the current results. In addition, the number of testing sites was limited. Ideally, the tests should be conducted in various room sizes, with variations in ceiling height, different building materials and diverse densities. However, these would have caused unlimited combinations of situations for testing. Exceptions may arise where a certain parameter leads to better positioning performances. Signal attenuation is present, even in ideal, controlled environments. There are also negative impacts as a result of obstructions, geometry, and iBeacon numbers in other environments. Furthermore, the introduction of the BLE 5.1 standard enhances the location-based services with the information of the angle of arrival and angle of departure in addition to the RSSI values [], and the positioning accuracy can achieve submeter level []. The results from this study provide a fundamental basis for iBeacon deployment and positioning with a combination of angle of arrival and RSSI in the near future.
For future study, experiments will be conducted with diverse combinations of parameters. Both iOS and Android devices will be used in the data collection phase with different brands of iBeacons, which are expected to have different characteristics and performances than the one used in this study. The same set of performance tests will be conducted in different types of classrooms with variations in size, ceiling height and density of people. In addition, the interrelationship between the deployment factors will be investigated and analysed, since the factors are posited to be intercorrelated. These experiments will optimise iBeacon deployment in physical learning spaces and offer a general guideline for iBeacon deployment in the future.
Author Contributions
Conceptualization, C.Y.T.K., M.S.W., R.K. and E.M.; Data curation, G.X.; Formal analysis, C.Y.T.K., M.S.W. and G.X.; Funding acquisition, M.S.W., R.K. and E.M.; Investigation, C.Y.T.K., M.S.W. and S.G.; Methodology, C.Y.T.K., M.S.W. and E.M.; Project administration, M.S.W.; Software, G.X.; Visualization, C.Y.T.K. and G.X.; Writing—Original draft, C.Y.T.K., M.S.W., S.G. and F.Y.Y.W.; Writing—Review & editing, R.K., D.C.W.C., G.X. and E.M. All authors have read and agreed to the published version of the manuscript.
Funding
This project was supported in part by “New Mobile Learning Scenarios Enabler—Development of Location-based Driven Application for Innovative and Technology-assisted Teaching and Learning Using iBeacon Technology” from the eLearning and Blended Learning Development Fund 2014–17, the Hong Kong Polytechnic University, Hong Kong; and “Augmenting Physical Learning Spaces with Location-based Services Using iBeacon Technology for Engaging Learning Experiences”, UGC Funding Scheme for Teaching and Learning Related Proposals (2016–19 Triennium), University Grants Committee, Hong Kong.
Conflicts of Interest
The authors declare no conflict of interest.
References
- Bray, J.; Sturman, C. Bluetooth: Connect Without Cables, 2nd ed.; Prentice Hall PTR: Upper Saddle River, NJ, USA, 2002. [Google Scholar]
- Haartsen, J.C. The Bluetooth radio system. IEEE Pers. Commun. 2000, 7, 28–36. [Google Scholar] [CrossRef]
- Gomez, C.; Oller, J.; Paradells, J. Overview and evaluation of Bluetooth low energy: An emerging low-power wireless technology. Sensors 2012, 12, 11734–11753. [Google Scholar] [CrossRef]
- Woolley, M. Bluetooth Core Specification v5.1 Feature Overview; Bluetooth SIG: Kirkland, WA, USA, 2019. [Google Scholar]
- Woolley, M. Bluetooth Core Specification Version 5.2 Feature Overview; Bluetooth SIG: Kirkland, WA, USA, 2020. [Google Scholar]
- Apple Inc. Getting Started with iBeacon. Available online: https://developer.apple.com/ibeacon/Getting-Started-with-iBeacon.pdf (accessed on 28 September 2020).
- Bahl, P.; Padmanabhan, V.N. Enhancements to the RADAR User Location and Tracking System; Microsoft Corporation: Redmond, WA, USA, 2000. [Google Scholar]
- Bullock, J.B.; Chowdhary, M.; Rubin, D.; Leimer, D.; Turetzky, G.; Jarvis, M. Continuous indoor positioning using GNSS, Wi-Fi, and MEMS dead reckoning. In Proceedings of the 25th International Technical Meeting of the Satellite Division of the Institute of Navigation (ION GNSS 2012), Nashville, TN, USA, 17–21 September 2012. [Google Scholar]
- Chen, L.-W.; Chen, T.-P.; Chen, D.-E.; Liu, J.-X.; Tsai, M.-F. Smart campus care and guiding with dedicated video footprinting through Internet of Things technologies. IEEE Access 2018, 6, 43956–43966. [Google Scholar] [CrossRef]
- Griffiths, S.; Wong, M.S.; Kwok, C.Y.T.; Kam, R.; Lam, S.C.; Yang, L.; Yip, T.L.; Heo, J.; Chan, B.S.B.; Xiong, G.; et al. Exploring bluetooth beacon use cases in teaching and learning: Increasing the sustainability of physical learning spaces. Sustainability 2019, 11, 4005. [Google Scholar] [CrossRef]
- Bae, M.Y.; Cho, D.J. Design and implementation of automatic attendance check system using BLE beacon. Int. J. Multimed. Ubiquitous Eng. 2015, 10, 177–186. [Google Scholar] [CrossRef]
- Lau, H.; Mok, Y.; Daut, N.; Tahir, A.; Chung, S.; Chua, B. Beacon-integrated attendance app. Adv. Sci. Lett. 2018, 24, 1114–1118. [Google Scholar] [CrossRef]
- Kim, I.-M. Design and development a smart-phone application for class interactions. J. Digit. Contents Soc. 2014, 15, 721–727. [Google Scholar] [CrossRef]
- McDonald, K.; Glover, I. Exploring the transformative potential of Bluetooth beacons in higher education. Res. Learn. Technol. 2016, 24, 32166. [Google Scholar] [CrossRef]
- Jurkovičova, L.; Ĉervenka, P.; Hrivíková, T. E-learning in augmented reality utilizing iBeacon technology. In Proceedings of the 10th International Conference on e-Learning—ICEL 2015, Nassau, The Bahamas, 25–26 June 2015. [Google Scholar]
- Karlsson, E.; Nygren, O.; Gamboa, M.; Thander, F. ArQuest: Augmented reality in education. In Proceedings of the 12th Student Interaction Design Research Conference (SIDeR 2016), Malmö, Sweden, 1–2 April 2016. [Google Scholar]
- Merode, D.; Tabunshchyk, G.; Patrakhalko, K.; Yuriy, G. Smart campus based on iBeacon technology. In Proceedings of the 14th International Symposium on Ambient Intelligence and Embedded Systems, Oostende, Belgium, 24–26 September 2015. [Google Scholar]
- Husni, E. Mobile Application for Smart Campus System with iBeacon-uBeacon. Adv. Sci. Lett. 2017, 23, 3746–3750. [Google Scholar] [CrossRef]
- DeBlasio, G.; Quesada-Arencibia, A.; Garcia, C.R.; Rodriguez-Rodriguez, J.C.; Moreno-Diaz, R. A protocol-channel-based indoor positioning performance study for bluetooth low energy. IEEE Access 2018, 6, 33440–33450. [Google Scholar] [CrossRef]
- Wu, X.; Shen, R.; Fu, L.; Tian, X.; Liu, P.; Wang, X. iBILL: Using iBeacon and inertial sensors for accurate indoor localization in large open areas. IEEE Access 2017, 5, 14589–14599. [Google Scholar] [CrossRef]
- Varela, P.M.; Otsuki Ohtsuki, T. Discovering co-located walking groups of people using iBeacon technology. IEEE Access 2016, 4, 6591–6601. [Google Scholar] [CrossRef]
- Paek, J.; Ko, J.; Shin, H. A measurement study of BLE iBeacon and geometric adjustment scheme for indoor location-based mobile applications. Mob. Inf. Syst. 2016. [Google Scholar] [CrossRef]
- Faragher, R.; Harle, R. An analysis of the accuracy of Bluetooth Low Energy for indoor positioning applications. In Proceedings of the 27th International Technical Meeting of The Satellite Division of the Institute of Navigation (ION GNSS+ 2014), Tampa, FL, USA, 8–12 September 2014; pp. 22–26. [Google Scholar]
- Zafari, F.; Papapanagiotou, I. Enhancing iBeacon based micro-location with particle filtering. In Proceedings of the 2015 IEEE Global Communications Conference (GLOBECOM), San Diego, CA, USA, 6–10 December 2015; pp. 1–7. [Google Scholar]
- Zhang, K.; Zhang, Y.; Wan, S. Research of RSSI indoor ranging algorithm based on Gaussian—Kalman linear filtering. In Proceedings of the 2016 IEEE Advanced Information Management, Communicates, Electronic and Automation Control Conference (IMCEC), Xi’an, China, 3–5 October 2016; pp. 1628–1632. [Google Scholar]
- Fard, H.K.; Chen, Y.; Son, K.K. Indoor positioning of mobile devices with agile iBeacon deployment. In Proceedings of the 2015 IEEE 28th Canadian Conference on Electrical and Computer Engineering (CCECE), Halifax, NS, Canada, 3–6 May 2015; pp. 275–279. [Google Scholar]
- Ng, T.M. From “Where I am” to “Here I am”: Accuracy study on location-based services with iBeacon technology. Hkie Trans. 2015, 22, 23–31. [Google Scholar] [CrossRef]
- Martin, P.; Ho, B.-J.; Grupen, N.; Muñoz, S.; Srivastava, M. An iBeacon primer for indoor localization: Demo abstract. In BuildSys ′14: Proceedings of the 1st ACM Conference on Embedded Systems for Energy-Efficient Buildings; ACM Press: Memphis, TN, USA, 2014; pp. 190–191. [Google Scholar]
- Castillo-Cara, M.; Lovón-Melgarejo, J.; Bravo-Rocca, G.; Orozco-Barbosa, L.; García-Varea, I. An empirical study of the transmission power setting for bluetooth-based indoor localization mechanisms. Sensors 2017, 17, 1318. [Google Scholar] [CrossRef] [PubMed]
- Estel, M.; Fischer, L. Feasibility of bluetooth ibeacons for indoor localization. In Digital Enterprise Computing (DEC 2015); Zimmermann, A., Rossmann, A., Eds.; Gesellschaft für Informatik e.V: Böblingen, Germany, 2015. [Google Scholar]
- Kriz, P.; Maly, F.; Kozel, T. Improving indoor localization using bluetooth low energy beacons. Mob. Inf. Syst. 2016. [Google Scholar] [CrossRef]
- Takahashi, C.; Kondo, K. Accuracy evaluation of an indoor positioning method using iBeacons. In Proceedings of the 2016 IEEE 5th Global Conference on Consumer Electronics, Kyoto, Japan, 11–14 October 2016; pp. 1–2. [Google Scholar]
- Peng, Y.; Fan, W.; Dong, X.; Zhang, X. An iterative weighted KNN (IW-KNN) based indoor localization method in bluetooth low energy (BLE) environment. In Proceedings of the 2016 Intl IEEE Conferences on Ubiquitous Intelligence & Computing, Advanced and Trusted Computing, Scalable Computing and Communications, Cloud and Big Data Computing, Internet of People, and Smart World Congress (UIC/ATC/ScalCom/CBDCom/IoP/SmartWorld), Toulouse, France, 18–21 July 2016; pp. 794–800. [Google Scholar]
- Chen, Z.; Zhu, Q.; Jiang, H.; Soh, Y.C. Indoor localization using smartphone sensors and iBeacons. In Proceedings of the 2015 IEEE 10th Conference on Industrial Electronics and Applications (ICIEA), Auckland, New Zealand, 15–17 June 2015; pp. 1723–1728. [Google Scholar]
- Mori, T.; Kajioka, S.; Uchiya, T.; Takumi, I.; Matsuo, H. Experiments of position estimation by BLE beacons on actual situations. In Proceedings of the 2015 IEEE 4th Global Conference on Consumer Electronics (GCCE), Osaka, Japan, 27–30 October 2015; pp. 683–684. [Google Scholar]
- Chawathe, S.S. Beacon placement for indoor localization using bluetooth. In Proceedings of the 2008 11th International IEEE Conference on Intelligent Transportation Systems, Beijing, China, 12–15 October 2008; pp. 980–985. [Google Scholar]
- Aman, M.S.; Jiang, H.; Quint, C.; Yelamarthi, K.; Abdelgawad, A. Reliability evaluation of iBeacon for micro-localization. In Proceedings of the 2016 IEEE 7th Annual Ubiquitous Computing, Electronics & Mobile Communication Conference (UEMCON), New York, NY, USA, 20–22 October 2016; pp. 1–5. [Google Scholar]
- Ji, M.; Kim, J.; Jeon, J.; Cho, Y. Analysis of positioning accuracy corresponding to the number of BLE beacons in indoor positioning system. In Proceedings of the 2015 17th International Conference on Advanced Communication Technology (ICACT), Seoul, Korea, 1–3 July 2015; pp. 92–95. [Google Scholar]
- Yang, L.; Wang, Q.; Wang, G. Positioning in an indoor environment based on iBeacons. In Proceedings of the 2016 IEEE International Conference on Information and Automation (ICIA), Ningbo, China, 1–3 August 2016; pp. 894–899. [Google Scholar]
- Yuan, Z.; Li, W.; Xu, Z.; Zhao, W. Beacon node placement for minimal localization error. arXiv 2015, arXiv:1503.08404. [Google Scholar]
- Rezazadeh, J.; Subramanian, R.; Sandrasegaran, K.; Kong, X.; Moradi, M.; Khodamoradi, F. Novel iBeacon placement for indoor positioning in IoT. IEEE Sens. J. 2018, 18, 10240–10247. [Google Scholar] [CrossRef]
- Rezazadeh, J.; Moradi, M.; Ismail, A.S.; Dutkiewicz, E. Superior path planning mechanism for mobile beacon-assisted localization in wireless sensor networks. IEEE Sens. J. 2014, 14, 3052–3064. [Google Scholar] [CrossRef]
- Schaff, C.; Yunis, D.; Chakrabarti, A.; Walter, M.R. Jointly optimizing placement and inference for beacon-based localization. In Proceedings of the 2017 IEEE/RSJ International Conference on Intelligent Robots and Systems (IROS), Vancouver, BC, Canada, 24–28 September 2017; pp. 6609–6616. [Google Scholar]
- Dalkilic, F.; Cabuk, U.C.; Arikan, E.; Gurkan, A. An analysis of the positioning accuracy of iBeacon technology in indoor environments. In Proceedings of the 2017 International Conference on Computer Science and Engineering (UBMK), Antalya, Turkey, 5–8 October 2017; pp. 549–553. [Google Scholar]
- Huh, J.-H.; Seo, K. An indoor location-based control system using bluetooth beacons for IoT systems. Sensors 2017, 17, 2917. [Google Scholar] [CrossRef] [PubMed]
- Cotton, S.L.; McKernan, A.; Ali, A.J.; Scanlon, W.G. An experimental study on the impact of human body shadowing in off-body communications channels at 2.45 GHz. In Proceedings of the 5th European Conference on Antennas and Propagation (EUCAP), Rome, Italy, 11–15 April 2011; pp. 3133–3137. [Google Scholar]
- Suryavanshi, N.B.; Viswavardhan Reddy, K.; Chandrika, V.R. Direction Finding Capability in Bluetooth 5.1 Standard. In Ubiquitous Communications and Network Computing; Kumar, N., Venkatesha Prasad, R., Eds.; Springer: Cham, Switzerland, 2019; pp. 53–65. [Google Scholar]
- Cominelli, M.; Patras, P.; Gringoli, F. Dead on Arrival: An Empirical Study of The Bluetooth 5.1 Positioning System. In WiNTECH ′19: Proceedings of the 13th International Workshop on Wireless Network Testbeds, Experimental Evaluation & Characterization; ACM Press: New York, NY, USA, 2019; pp. 13–20. [Google Scholar]
© 2020 by the authors. Licensee MDPI, Basel, Switzerland. This article is an open access article distributed under the terms and conditions of the Creative Commons Attribution (CC BY) license (http://creativecommons.org/licenses/by/4.0/).