Abstract
The gradual displacement of synchronous generators driven by conventional power plants, due to the increasing penetration of distributed renewable energy sources (DRES) in distribution grids, is creating a shortage of crucial ancillary services (AS) which are vital for the frequency and voltage stability of the grid. These AS, and some new ones, could now be offered by the DRES, particularly those that are converter interfaced, in a coordinated way in order to preserve the grid stability and resilience. Although recent standards and grid codes specify that the DRES exhibit some system support functions, there are no specifications on how to measure and quantify (M & Q) them both at DRES level and in aggregated form. The M & Q of AS is crucial, since it would allow the AS to be treated as tradable AS in the current and future AS markets. This paper attempts to define a number of AS that can be offered by converter-interfaced DRES and suggests methods for their M & Q. The new AS addressed are: (1) inertial response; (2) primary frequency response; (3) active power smoothing (ramp-rate limitation); (4) exchange of reactive power for voltage regulation; (5) fault-ride-through (FRT) and contribution to fault clearing; (6) voltage harmonic mitigation. Additionally, a rough estimation of the additional investment and operational cost, as well as the financial benefits associated with each AS is provided in order to form the basis for the development of business models around each AS in the near future.
1. Introduction
Ancillary services (AS) are defined by transmission system operators (TSOs) as services necessary for the reliable operation of the power system, [1] or needed to ensure security of supply, [2,3]. According to [4], which is a common report by the European Network of TSOs of Electricity (ENTSO-E) and several European Union (EU)/distribution system operators (DSO) entities (E.DSO, Eurelectric, etc.) AS are defined as services provided to DSOs and TSOs to keep the operation of the grid within acceptable limits for security of supply and are delivered mainly by third parties (with respect to the control of the source) or by the TSOs and DSOs themselves. The currently available AS, in all European synchronous areas, have mainly as a target to keep frequency and voltage within specific safe bands and restore their values to the normal range after an imbalance occurrence. Therefore, these AS mainly refer to frequency response, voltage control through reactive power support and black-start capability, [5] and can be classified as follows [4]: (i) frequency AS (mainly for balancing); (ii) services for congestion management; (iii) non-frequency AS, such as voltage control and grid restoration. Frequency-related AS are further distinguished as frequency containment reserves (FCRs), frequency restoration reserves (FRRs) and replacement reserves (RRs).
Currently, these AS exist only at the transmission system level and are usually remunerated (by the TSO or the respective AS market) following various approaches such as, [6,7]: (i) a regulated price: in this approach a fixed price is set by the regulator or the TSO; (ii) a pay as bid price: the AS provider receives the price of the accepted offer; (iii) a common clearing price: the successful sellers are paid the price of the most expensive accepted or the least expensive rejected offer. The AS remuneration includes several components that reflect the different costs of the providing entity, e.g., the fixed allowance and the availability price refer to the cost of the seller to make a specific amount of AS available, costs regarding the actual exploitation of the product and the one that may rise each time that the provider is called upon (in a specific period of time), respectively, i.e., the opportunity cost. For this reason, there are AS markets operating in parallel with the operating energy market. Currently, these AS are mainly provided by synchronous generators (SGs) driven by conventional fuel-driven power plants (PPs). It is noted that the aforementioned AS belong to the steady state or quasi-steady state condition of the transmission system. Therefore, their measurement and the subsequent quantification is easily made by conventional measuring devices that need to measure active or reactive power and energy. It should be mentioned that currently the inertial response, which belongs to the dynamic and transient area of operation, is considered an inherent property of SGs and therefore, is neither measured nor remunerated.
The increasing DRES penetration is expected to displace in the future the conventional PPs. This is actually an EU target that currently drives many research activities [8]. However, decommitment of conventional PPs will lead to the reduction of AS which are essential for the power system stability and safe operation. To mitigate this problem, three options are currently investigated: (i) the use of conventional PPs as providers of AS, for instance for provision of inertial response or reactive power to the TSO or as spinning reserves [9], (ii) use of utility-scale storage systems operated by third parties, i.e., other than the TSOs and DSOs, (iii) aggregation of those AS (and additional ones) from DRES connected in the distribution system level. Obviously, the last option represents the most decentralized approach and indirectly transforms the distribution systems into virtual power plants (VPPs) as seen from the transmission system. The most significant advantage of this solution is that even the smallest DRES owners can become active participants in the operation of the power system. Additionally, the decentralized approach-when based on DRES- enhances significantly the security in energy supply.
Realizing that the DRES, particularly the converter-interfaced ones, can have functionalities that could support the power grid, some recently issued grid codes and standards ask for the provision of various services by the DRES in the form of system support functions [10,11,12]. Examples of such services are: the provision of reactive power for voltage regulation purposes, the FRT capability, the injection of specific currents during a grid fault and the limitation of the rate of change of the electrical power of DRES (ramp rate limitation). It is noted that, by considering those services as system-support functions, their provision becomes mandatory in order for the DRES to get connection permission. Thereby, it is evident that no motivation is granted to the DRES for offering such services, despite the fact that some of these services imply a direct or indirect cost to the DRES owner; for instance the provision of reactive power may result in active power curtailment if the RES converter is not oversized. However, the TSOs of some weak transmission systems, e.g., Puerto Rico [13] and Ireland [13,14,15], have issued new requirements for the DRES directly connected to the transmission system. These requirements have the form of system support functions after realizing the consequences of the increased DRES penetration and the subsequent decommission of conventional SGs in those weak grids.
The recent advances in power electronics have enabled the converter-interfaced DRES to exhibit new functionalities that are useful to the distribution grid and the transmission system: (i) they may provide virtual inertial response, just like the conventional SGs, in an energy-neutral way if they are equipped with fast energy storage systems (FSS), like supercapacitors. In such cases, the inertial response can be offered even when the primary energy sources (sun or wind) are unavailable; (ii) they may be controlled to operate with a certain headroom, i.e., as FCRs. In fact, the slope of their P-f droop and the frequency deadband can be easily adjustable through setpoints sent remotely; (iii) by changing their control mode into voltage-controlled sources, the DRES can exhibit grid-forming capabilities, enabling, in this way, their participation in the black-starting procedure of distribution grids and even in their islanded operation; (iv) they can be controlled as active harmonic filters in order to mitigate voltage harmonic pollution within the distribution systems.
Electrochemical energy storage systems (ESS), like Li-ion batteries, which are also converter-interfaced, can also provide all the aforementioned functionalities apart from inertial response, as this stresses the batteries in a rather unacceptable manner. Some differences also exist between the variable-output DRES -like photovoltaics (PVs) or wind energy conversion systems (WECS), which are converter-interfaced and the dispatchable DRES—like hydro or biomass—which are directly coupled to the grid via SGs. The latter can provide inherently inertial response due to the involved rotating masses, however, their actual inertia is hardly known. They can also act as FCR, however their governors are much slower than the respective reaction of the power-electronic converters. Furthermore, their reactive power capability is narrower compared to the converter-interfaced DRES due to limitations in rotor design or due to power-angle stability reasons.
It is evident that the DRES can provide a number of useful services that can support either the distribution grid or transmission system if they are aggregated. However, in order for these services to be treated as AS (and not simply as system support functions) they should be properly measured and quantified in a unified and commonly agreed (by all stakeholders) methodology. In addition, the costs associated with the provision of these services and the financial benefits should be identified, so that relevant viable business models can be developed. Furthermore, when dealing with AS offered to the transmission system by aggregating their origin from individual DRES within the distribution system, methods to M & Q them should be established for all nodes where the service is offered. This is essential for the proper remuneration of each DRES according to its contribution, while taking into account technical constraints imposed by the distribution grid.
It should be mentioned that currently there exist no established AS market in the distribution system. Models of such AS markets can be found only in the technical literature (e.g., H2020 Project SmartNet [16]). However, these models focus on market structures without paying attention on the way the AS should be measured and quantified in order to become tradable quantities.
Currently, the term “ancillary service” is frequently used for DRES in the technical literature, so as to describe their various functionalities, e.g., reactive power for voltage regulation purposes, virtual inertia, primary frequency control, harmonic mitigation or even power smoothing. Many of the aforementioned AS have been recently introduced in the literature and are still under investigation; hence, the absence of particular metrics for their quantification is a common problem. This applies at metrics regarding both the overall service provision at particular points of the network (e.g., at the transmission-distribution interface), as well as the contribution of each AS provider, as mentioned in [17,18]. Therefore, it is essential to establish new quantification methods that will reflect the actual provision of every AS at the points of interest, with relatively high accuracy. The latter is important to enable AS that are offered at the distribution system to participate in future AS markets.
This paper is an attempt to define a number of AS that can be offered by DRES connected in the distribution system. By definition it is meant: (i) the way an AS should be M & Q and, (ii) an initial, thus not exhaustive, identification of the financial costs incurred for providing this AS and the benefits that result from its use. Further elaboration with respect to detailed evaluation of the financial costs and benefits is required but this falls in the frame of the development of viable bossiness models around each AS which is beyond the scope of this paper. Some of the AS are useful for the operation of the distribution grid, thereby they are procured by the respective DSO. Other AS, particularly those related to the stability of the power system, are aggregated and offered to the TSO at the point of interconnection (POI) of the distribution grid with the transmission grid. In such cases, aggregators may be involved for trading these AS, but the DSO should always be present in order to assure that the technical constraints within the distribution grid are respected.
To the best of the authors’ knowledge, there are no relevant references regarding the quantification of various AS offered by DRES connected in the distribution system. This is particularly stressed out in [18], where the lack of proper measurement and quantification is identified as one of the technical barriers that prevent the introduction of AS in distribution networks. The same is true with respect to the financial costs and benefits associated with each AS. For these reasons, the approach presented in this paper is all new. On the other hand, new standards that specify a number of system support functions for DRES give clues on the way these functions should be measured. Hence, the suggestions for the measurement of the proposed AS, particularly those associated with transient or dynamic DRES responses, are largely based on these standards. Since several AS are examined in this paper, detailed reviews and the relevant state-of-the-art with respect to their M & Q are presented in the rest of the manuscript in the respective Sections. The established AS in the transmission system level formed the basis for the definition of new AS offered by DRES connected in the distribution system. Detailed reviews of the main AS that already exist at the transmission system level with respect to their definition per country, the PPs that provide these AS and their remuneration can be found in [1,6,18].
The remainder of the paper is organized as follows: In Section 2 of the paper, the background and assumptions for the definition of several new AS that can be offered by converter-interfaced DRES connected to the distribution system are presented. The new AS addressed in this paper are: (1) inertial response; (2) primary frequency response; (3) active power smoothing (ramp-rate limitation); (4) exchange of reactive power for voltage regulation; (5) Fault-Ride-Through (FRT) and contribution to fault clearing; (6) voltage harmonic mitigation. In Section 3, for each of the aforementioned individual AS: (i) a brief overview of the state-of-the-art with respect to technical literature and Grid Codes is conducted; (ii) the theoretical and mathematical formulation of the new M & Q method is proposed and the challenges with respect to its practical implementation are identified; (iii) the associated costs and benefits are roughly estimated and analyzed in order to form the basis for the development of respective business models. Some technical barriers towards the development and future adoption of the suggested AS are briefly presented in Section 4, while Section 5 presents the conclusions.
2. Background and Assumptions for the Introduction of New AS Offered by the DRES at Distribution System Level
Currently, the frequency and non-frequency related AS are procured and remunerated by conventional PPs directly connected to the transmission system level. National TSOs define various AS in their own way, especially with respect to the frequency-related AS. Several differences exist also with respect to: (i) the type of source that provides the AS; (ii) the obligation (mandatory or optional AS provision); (iii) the fundamental values that are being remunerated; (iv) the remuneration and procurement schemes. However, the inertial response is still considered as a system support function, since it is provided by the inherent inertia of the conventional SGs, and, for this reason, it is not remunerated, [19]. In addition, recently published Standards and Guidelines [20] require the large-scale variable-output DRES that are directly connected to the transmission system, to offer frequency or voltage support as system support functions, which are also not remunerated, as in the previous case. However, in order for a distribution system to be able to provide certain AS, the DRES within it need to be intentionally controlled, leading in many cases to curtailment of active power (operation with a headroom) that would be otherwise injected into the grid, and in other cases to increased operational cost due to reduced efficiency and additional losses (e.g., when exchanging reactive power [21] or operating below a certain power level [22]). Therefore, it is necessary to accurately measure and quantify all these frequency and voltage support actions in order for them to be treated as AS.
This section presents a new approach on how to M & Q these services. This applies to services offered to the distribution grid at the terminals of the DRES and to services offered, in aggregated form, to the transmission system at the POI with the distribution grid. A significant assumption made to facilitate the M & Q is the following: the distribution grid has defined physical limits and there is a single POI with the upstream transmission grid. This assumption is realistic for the majority of the distribution grids and enables the evaluation of the contribution of each DRES to a specific service. Apart from the measurement and quantification, the financial costs and benefits associated with each service are roughly presented. Their quantification is essential for the development of viable business models based on the AS, but this is part of ongoing and, yet, unfinished research.
Given the fact that AS are offered during transient conditions, suitable measuring specifications are required for their proper measurement and quantification with respect to the starting and ending point of each AS. Hence, modern metering devices will need to be installed and be fully in line with the new measurement standards. This is particularly emphasized in [17], as one of the technical challenges that the DSOs have to deal with due to the increasing DRES penetration. Currently, measuring systems installed in distribution networks do not serve for the DSOs to gain access over particular quantities, which are essential for enacting any control over DRES, e.g., active power reduction or reactive power adjustment, so as to maintain the system balance. Moreover, the measuring devices within the distribution grids include SCADA systems, smart meters and line measurement systems [23]. A drawback of these devices is that they can only measure data related to the steady-state network operation [24]. Consequently, their use for capturing AS related to the dynamic network operation (e.g., the provision of inertial response, dynamic reactive power support) is not acceptable. Furthermore, the measurements should be synchronized to determine the contribution of each DRES to the overall distribution system behavior, something that cannot be implemented by the existing devices due to the lack of a synchronization mechanism, [23]. It should be noted at this point that according to the requirements for the interconnection of DRES mentioned in the IEEE Standard 1547−2018, [10], their built-in metering infrastructure presents limited measurement capability with respect to dynamic phenomena. Therefore, the inverters of DRES are usually equipped with devices that focus on the accurate detection of changes and not on the accurate calculation and measurement of absolute values, [25]. Finally, phasor measurement units (PMUs) [26] are usually used at the transmission system level. PMUs act on a fast timescale with reporting rates up to 50/s and are able to provide synchronized measurements. However, PMUs are considered expensive enough to be installed at each DRES connected in a distribution grid and have specific limitations, as highlighted in [27].
In order to enable the development of new business models in a quantified and monetary way, new metrics for the quantification of the AS will be proposed in this section together with an initial definition of various AS (and a brief review) that can be offered by DRES either at distribution system level or towards the upstream transmission system. In the latter case, they are assumed to be aggregated and offered at the single POI of the distribution system with the transmission system.
To enable the proper definition and quantification of AS the following assumptions are made:
- At the distribution system level (Figure 1), one or more individual control areas (ICAs) are foreseen, where the DRES with the newly developed functionalities are optimally orchestrated by suitable ICT infrastructure. Generally, the whole distribution grid can be considered as an ICA, hosting loads and DRES in the medium voltage (MV) level and microgrids in the low voltage (LV) level.
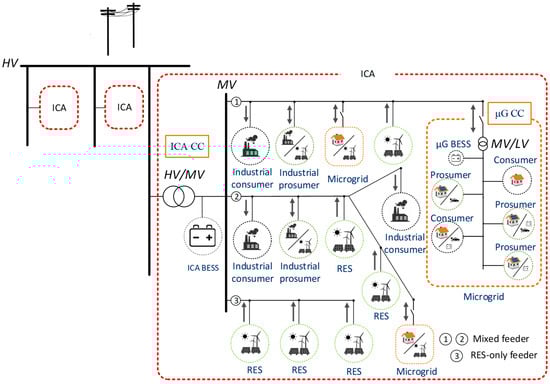 Figure 1. General representation of a distribution grid (ICA).
 - The DRES within the distribution system have new advanced functionalities enabling them to provide the AS shown in Figure 2 [18,27,28]. These functionalities have been technically developed and are reported in various deliverables [27,28] of the ongoing research project named EASY-RES [8] which is funded by European Union. Each DRES can provide: (1) inertial response; (2) primary frequency response; (3) power smoothing; (4) reactive power support; (5) harmonic mitigation; (6) FRT capability and fault-current contribution. Functionalities (1), (3) and (6) require an additional ESS, which will be a FSS, because large amounts of power are required for dynamic and transient phenomena. This FSS would be a supercapacitor that is connected to the DC-link of the DRES converter (Figure 3). It is noted that these functionalities require a new type of converter control, like the one presented in [28], for the converter-interfaced DRES (CI-DRES). Actually the CI-DRES should operate like virtual synchronous generators in order to provide in a unified way all the aforementioned functionalities. This is applicable to all CI-DRES irrespective of their primary source (PV, wind, etc). However, just for simplicity reasons, many of the AS addressed in this paper use PVs as primary source.
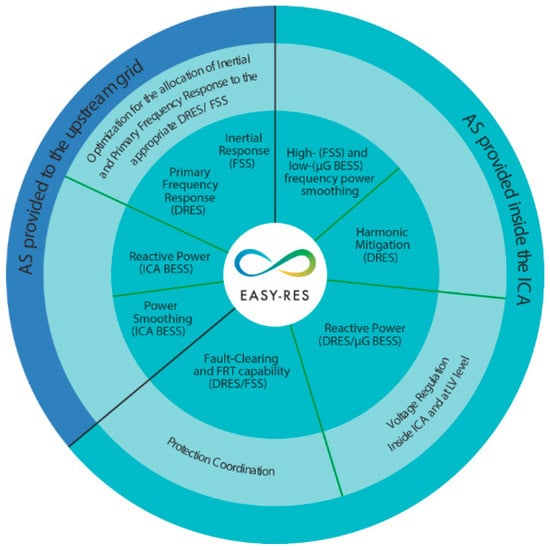 Figure 2. Proposed AS and their categorization [18,27,28].
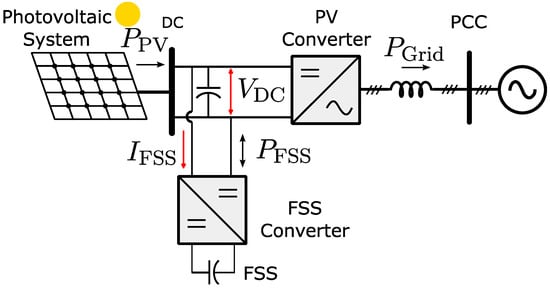 Figure 3. DRES and FSS based on supercapacitor bank for inertial response, FRT and ramp rate limitation in PV plants.
 - The distribution system has physical boundaries and a single POI with the transmission system as shown in Figure 1.
- Battery energy storage systems (BESS) are assumed to be installed only at the POI of a LV μG with the upstream MV gird and the POI of the ICA with the transmission system (see Figure 1). The BESS are sized only for the following AS: (1) power smoothing, (2) exchange of reactive power for voltage regulation purposes, while they will be able to provide also, (3) contribution to harmonic mitigation and (4) contribution to fault clearing.
By exploiting the aforementioned DRES/BESS functionalities, proper control schemes for voltage regulation and protection coordination will be applied at ICA level, while each ICA will be able to offer inertial and PFR by optimally allocating the respective responses to the DRES within each ICA.
The definition, measurement and quantification for each of these six AS is presented in the rest of this section together with rough estimations of the challenges for their introduction. The costs and benefits resulting by the introduction of each AS are also roughly presented.
3. New Types of AS Provided by DRES/ESS: Proposed Definition and Its Justification, Suggested Measurement and Quantification, Associated Costs/Benefits
3.1. Active Power Ramp Rate Control/Power Smoothing
3.1.1. Proposed Definition and Its Justification
During the last few years, the increased penetration of variable-output converter-interfaced DRES has led to significant net load variations and has modified the existing load pattern at system level. These variations, mostly appearing in minute-to-hour timeframes [29,30], can no longer be neglected by the TSOs and need to be properly compensated in order to maintain the power balance in the transmission system by increasing the required FCR and FRR. To mitigate this requirement, a growing number of grid codes, over the last years, are posing specific limits to RES generation so as to avoid extreme active power ramp rates, especially in weak grids, e.g., the TSOs in Ireland, [31,32] and Puerto Rico [13], pose specific ramp-rate limitations for PV systems and wind farms. For example, the Puerto Rico Electric Power Authority (PREPA) [13] requires the RES PP fluctuations to be less than 10% (of nominal power)/min. In other countries, e.g., Mexico, the regulations target greater restrictions, of around 1–5%/min [33]. It is noted that these specifications concern variable-output DRES connected in the transmission system. To address the high ramp rates originating from DRES connected in the distribution system, PREPA suggests the use of utility scale ESS at the POI of the distribution grids with the transmission system [34]. It is noted that the aforementioned requirements have the form of system-support functions, therefore they are not remunerated [6]. On the contrary, their absence is penalized.
Variable-output DRES can limit the ramp rate of their electrical power by using suitable control algorithms. Some wind generators equipped with advanced controllers, such as the rotor inertia control [35] and pitch angle control [36] can control the ramp rate (also referred to as power smoothing) without involving any complementary ESS. However, this is associated with a higher stress of their mechanical system. On the contrary, using a complementary FSS, both wind generators and PV systems can provide power smoothing without curtailing power or increasing the mechanical stress [37,38]. The use of FSS enables the smoothing of the power in timeframes from milliseconds up to few seconds. The use of slower ESS, such as BESS, is more suitable for power smoothing in time frames from some seconds up to several minutes. The degree of power smoothing depends on the algorithm implemented and the size of the ESS. The most prevalent power smoothing algorithms are based on moving average [39] or ramp-rate control [40].
3.1.2. Measurement and Quantification
Attempting to define a methodology for the measurement and quantification of the limitation of electrical active power ramp rate, active power ramp rate at the Point of Common Coupling (PCC) of a DRES is firstly defined by,
with:
where, is the per-unit (pu) variation of the electrical active power, , during the time interval, Δt, while , is the rated power of the DRES.
In order to better clarify our approach for the definition of the measurement and quantification of the ramp limitation we will use the following example: Measurements of the electrical power of a 239 kWp PVPP in the region of Sencur (Slovenia) were taken for several hours with 1 s resolution [28]. Figure 4 shows the power (expressed in pu) during a 40-min period.
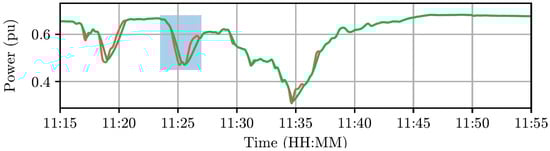
Figure 4.
Output power (red: actual; green: smoothed) of a 239 kWp PVPP with 1 s resolution [28].
The shaded area in Figure 4 is enlarged in Figure 5 where the PV power is shown in red, while the smoothed electrical power in green. The PV power is the power determined by the maximum power point tracking (MPPT) algorithm of the PVPP. The smoothed electrical power is achieved by using a FSS (an ultracapacitor bank) in the DC link of the PV converter and by implementing the smoothing algorithm developed in [28] that limits the ramp rate to .
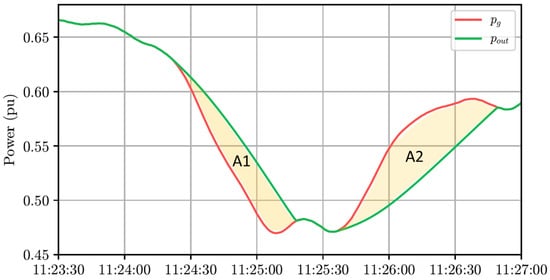
Figure 5.
Actual (red) and smoothed (green) electrical power of the 239 kWp PVPP during a 4-min interval [28].
The ramp rates are shown in Figure 6, where it is evident that, the ramp rate would be as high as or .
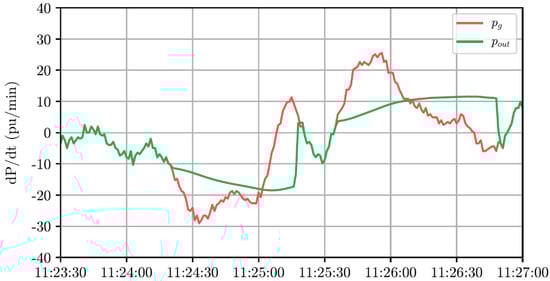
Figure 6.
Evaluation of ramp-rates without (red curve) or with (green curve) power smoothing.
The achieved ramp rate limitation (RRL) can be quantified on the basis of the difference between the actual electrical power, and the active power generated by the primary source .
with the time interval is defined as the period over which the RRL needs to be quantified, e.g., one hour or one day, etc. The resulting RRL can be seen as the sum of the shaded areas A1 and A2 in Figure 5. It is important that the control algorithm regularly (e.g., every some seconds) returns the state of charge of the FSS to its original state so the DRES is able to achieve the next ramp limitation. This prerequisite will finally yield
if the losses in the FSS and the associated DC/DC converter as well as the losses in the DC/AC converter are ignored. In case these losses are evaluated [21], then the integral in (4) should be equal to the aggregated losses over the period .
Another way for the evaluation of RRL could be based on the measurement of the work performed by the FSS associated with the DRES as shown in Figure 3. In this case,
where RRL is the total energy absorbed or released by the FSS within the time interval , is the current flowing to the FSS, is the DC-Link voltage level and are the energy losses on the DC/AC converter of the DRES.
Equation (3) can be applied not only to DRES but also to a BESS. In the latter case, is the electrical power upstream of the BESS, while is the electrical power downstream of the BESS. Equation (5) can be equally applied to DRES or BESS.
Challenges
There are currently two major challenges for the practical implementation of the suggested measurement and quantification procedure. The first one stems from the fact that there is currently no unified method for the precise definition of the ramp rate itself. For instance, there is a plethora of specifications with respect to Δt in (1). The TSOs in Puerto Rico [13], Ireland [13,14,15], China [32,41], or in England and Wales NGC [32], specify various Δt in the range of 2 s, 1-min, 5-min or 10-min. Such differences are documented in reviews like [28,32]. In the same context belongs the lack of specifications with respect to in (1). It is not clear what is actually meant with : is it the instantaneous 3-phase active power measured at instant t, or is it the active power averaged over some period and, in such a case, what is that period? Such details seriously affect the way powers and subsequently, the ramp rates are measured and quantified. The second challenge stems from the lack of a unified approach with respect to the measuring devices that will be used to measure the quantities in (3) or (5). All these quantities are currently measured within the respective converters; however, the aim of the measurement is the control of the converters and not the measurement and quantification of power and energy [25]. Even if it is assumed that the DSOs or TSOs trust such measurements, the different measurement accuracies among the various DRES, prohibit the use of the converter-based measurements, because they will be finally translated in financial remuneration.
Suggestions
Considering that the ramp rate control is a quasi-steady-state phenomenon and that the electrical quantities within the modern converters are measured in the time frame of μs, we firstly suggest that represents the average active power over the previous 200 ms (10 cycles) [10] in the case of DRES, since they will deal with rather fast evolving ramp rates. In the case of BESS it is suggested that this averaging window in increased to 1 s, since the BESS will deal with slower ramps in the time frame of 1–10 min.
3.1.3. Costs and Benefits
In the case of converter-interfaced DRES, the power smoothing (ramp-rate limitation) in both upwards and downwards direction requires a FSS the size of which depends on the largest ramp-rates expected by the primary source and on their limitation i.e., the highest allowable ramp-rate at the AC terminals of the DRES. Based on our research so far in the frame of the EASY-RES project we present some initial results on the required sizing of the FSS: We considered a 6 kWp PVPP in Germany, where measurements of solar irradiance were received with a resolution of 1 s. The limitation we set was that the electrical power at the AC terminals should not present ramps larger than 30% of the PV nominal power per minute. Based on the solar irradiance, the DC power presented ramp rates as high as 80% of the PV nominal power per minute. Another constraint that we set was that by the end of the period fluctuations the state-of-charge of the FSS should return to its initial condition. Based on the explanations given in the Appendix A, it was found that the required size of the ultracapacitor bank was 47 Wh. Based on an average cost of €20/Wh [42], the ultracapacitor bank has as cost €940. The required power of the DC-DC converter was estimated to be 0.9 pu, i.e., 5.4 kW with a cost of €540 (a unit cost of €100/kW, [43], is assumed for DC/DC converters which is approximately half of the unit cost of DC/AC converters as presented below in Section 3.5.3 and Figure 7). Thus, the total cost of the power smoothing system is €1480 which is comparable to the cost of the PVPP (~€5000). It is noted that the location of the specific PVPP was selected, since it represents fast solar-irradiance variations due to scattered clouds. In other locations such as in southern Europe such variations are softer. It should also be mentioned, that the same DC/DC converter and FSS can be used for other AS, such as inertial response and provision of FRT and contribution to fault clearing which increases significantly the utilization of the FSS and shares the implementation costs among three different AS.
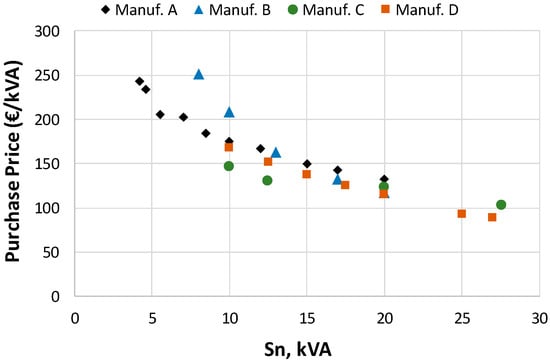
Figure 7.
Unit cost of purchasing of 3-phase PV inverters in Greece in July 2020. Data from same retailer for four different inverter manufactures.
In the case of BESS, the sizing procedure is similar, but the magnitudes are different. Since BESS are foreseen in the POI of the distribution grid with the transmission system or at the POI of a LV microgrid with the MV distribution system (see Figure 1) the limitation imposed on the ramp rate is considered to be 10% of the nominal transformer rating/min which is similar to the requirements imposed on DRES connected in the transmission system by TSOs of weak grids [13]. However, in this case, the effect of the load variations and the effect of the smoothing already performed by the DRES downstream should be considered. It is still an open research question the degree to which these factors affect the sizing of the BESS. Another fact that should be considered is the unit cost of Lithium-Ion (Li-ion) based stationary BESS which is of order of 300–400 €/kWh [44,45], i.e., much cheaper than that of the ultracapacitors.
The benefit associated with this service is that the distribution grid may appear to the transmission system as a VPP which can limit the active power ramp rates. This, in turn, will lead to reduction of the active power reserves by the TSO for the same frequency deviations. The deferral of the cost of these reserves is the financial benefit. Simulations at system level are required to estimate the relationship between the power smoothing at distribution grid level the reduction of those reserves.
3.2. Inertial Response
3.2.1. Proposed Definition and Its Justification
Inertia is an inherent characteristic of SGs due to their rotating masses, which prevents fast frequency variations in the first few cycles after a power imbalance occurs. Inertial response means that a SG is able to inject instantly an additional power to the grid which is proportional to the rate of change of the frequency (ROCOF) sensed at its terminals. This power is extracted, in cases of underfrequency events, by the kinetic energy stored in the rotating masses causing their deceleration. In cases of overfrequency events the reverse is true, i.e., additional kinetic energy is stored causing the rotor acceleration.
In the case of single SG, it is more meaningful to express the inertia in terms of the inertia time constant, as follows:
where, H (in seconds) is the inertia time constant, is the stored kinetic energy in the rotating masses with equivalent inertia, J (in ) and is the nominal apparent power of the SG. In the same way, the equivalent H of a large power system can be defined. Using the motion equation of the SG the following expression can be derived in pu:
where, and are respectively the mechanical and electrical power expressed in pu using as basis. It is evident from (7) that the ROCOF depends on the power imbalance and the inertial constant. Realizing that the displacement of conventional SGs by inertialess DRES will result in increased ROCOF, ENTSO-E [46] suggests that the DRES should provide synthetic inertia and that the various TSOs should evaluate the minimum levels of equivalent H of their areas that are required to maintain the frequency stability of their system. It is also mentioned in [46] that “traditional system inertia for a synchronous generator dominated system is of the order of H = 5–6 s”, although deviations from these values may exist among the various power system control areas.
The provision of synthetic inertia by a converter-interfaced DRES requires an ESS, where the equivalent “kinetic energy” will be stored. This ESS is associated with an additional installation, operational and maintenance cost that needs to be compensated. Therefore, synthetic inertia should be treated as a new AS and be remunerated, contrary to the current practice, where it is considered an inherent system support function. However there exist no methods for the measurement and quantification of the inertial response provided artificially, despite the fact that there are various methods to make a converter-interfaced DRES exhibit controllable inertial response [47,48,49]. In most of these methods, the converters are controlled as voltage rather than current sources, emulating in this way the behaviour of the conventional SGs. It should be mentioned that methodologies have also been proposed [50,51,52] in order to make WECS exhibit virtual inertia exploiting their kinetic energy. In fact, some of them have already been implemented in commercially available WECS [53,54,55,56,57]. However, this approach is energy-neutral, meaning that the energy provided during the inertial response period is then retrieved back from the grid, a phenomenon that may cause adverse effects to the overall frequency response of the system [58] (e.g., a postponed, but equally deep frequency nadir or the appearance of a second nadir). This approach also provides inertial response that depends on the operating point of the WECS, i.e., the provided inertia is rather stochastic, and it is not fully adjustable [59,60] and causes additional stress on the mechanical parts of the WECS [59]. For these reasons, we focus on inertial response that is based on voltage-controlled converters and on the incorporation of an additional FSS to provide the required energy. In this way, the inertia can be controllable and available all the time, even during the periods the primary source (solar irradiation, wind) are unavailable. Such a feature will enable the TSOs to procure this service in a deterministic rather than probabilistic way, paving the way for its introduction as new AS.
3.2.2. Measurement and Quantification
Supposing that a DRES can exhibit inertial response that corresponds to an inertial time constant H, then (7) can be used to evaluate this response, for a given ROCOF, . Such a response is shown in Figure 8 for a PV system that incorporates in its DC a supercapacitor bank able to provide inertial with H = 5 s. The physical configuration of the system under study is presented in Figure 3. More specifically, the PV system is directly connected to the upstream network, which is modelled as an ideal voltage source in series with an impedance. Initially, the PV system injects 0.25 pu to the grid, while the network frequency remains constant. Afterwards, to investigate how the PV system reacts on frequency disturbances, the network frequency is modified by varying the frequency of the ideal voltage source. There are three periods with negative, zero and positive ROCOF. Both the positive and the negative ROCOF are equal to 0.02 pu/s (1 Hz/s), as shown in Figure 8.
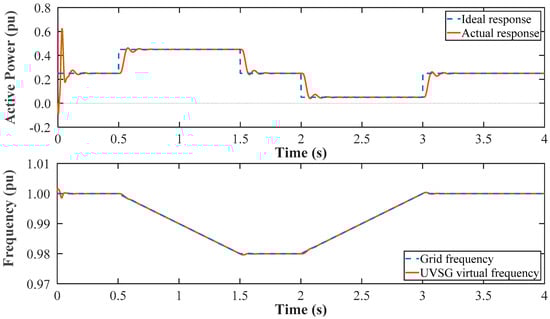
Figure 8.
Simulation of inertial response of a PV system with H = 5 s, under ROCOF = 0.02 pu (1 Hz/s).
Note that a new model for the grid-interfaced converter of the PV system has been adopted for these simulations. It has been developed in frame of the EASY-RES project and is called “Unified Virtual Synchronous Generator” (UVSG). Scope of the UVSG model is to incorporate a series of functionalities that will allow the widespread penetration of renewable energy sources in both distribution and transmission systems. Among them, the provision of inertia response is regarded as one of the most important functionalities that improves the frequency stability of the grid. More details regarding this model are presented in [28].
The inertial response derived from the UVSG model and shown in Figure 8 can be confirmed with (7) since, , resulting in a step increase of the electrical power from 0.2 pu to 0.4 pu. In such cases with high ROCOF, thereby high , the measurement and quantification of the inertial response can be evaluated from the sudden increase (or decrease) of the electrical power of the DRES for as long as the ROCOF lasts. However, during most of the time, the frequency deviates with very small ROCOF as shown by the frequency measurement for a time interval of 10 s with 20 ms resolution in Figure 9. The frequency measurement was made on 23 August 2018 by the Greek TSO on a 150 kV bus near Athens, Greece, via a PMU.
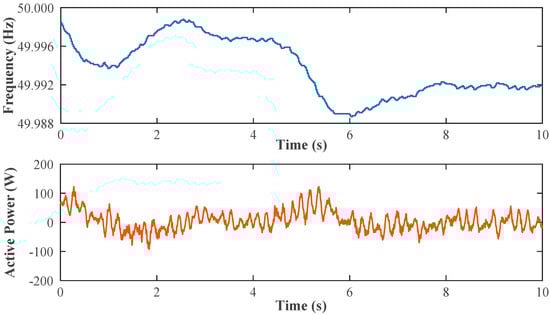
Figure 9.
Frequency measurement at a HV bus of the Greek power system (upper). Electrical power of an unloaded PV system equipped with supercapacitor able to provide inertia constant H = 9.5 s.
In such cases, the electrical power of a DRES will exhibit small variations too, making the measurement of inertial response questionable. Figure 9 shows the electrical power, during the night, of a PVPP with 20 kVA nominal inverter power, which is controlled to provide inertial response with H = 9.5 s. It can be seen that the electrical power, which in this case is the result of the inertial response, varies as little as 100 W or 0.5% of the nominal power. Such small quantities may fall within the measurement accuracy even of smart meters. On the other hand, if we assume that the frequency pattern in Figure 9 is repeated for a whole year, the inertial response would sum up to 200 kWh which is something tangible and cannot be neglected.
Based on the aforementioned obstacles, we suggest that the quantification of inertial response by a DRES is based on calculations as follows: it is evident from (7) that the inertial response depends only on H and ROCOF. The value of should be validated in a certified lab by subjecting the DRES converter to tests similar to the one shown in Figure 8. The ROCOF can be evaluated in discrete time steps by measuring the frequency and time in a window of 100 ms as suggested in the recent IEEE 1547-2018 standard [10]. Thus, the inertial contribution expressed in terms of energy over a period (an hour, day, etc.) can be calculated by
where, is the frequency measured at the DRES PCC at time instant , is the nominal power of the DRES converter and .
The evaluation of the inertial response presented by a distribution system in aggregated form at its POI with the transmission system is a very complicated task. This is due to the fact that the loads within the distribution system have a frequency sensitivity that depends on their type while the mixture of the various load types changes constantly. In such cases the minimum equivalent inertial constant of the distribution grid, , can be estimated based on the stored energy in the various DRES equipped with supercapacitors:
where, and are the inertial constant and nominal converter power of the DRES and is the number of the connected DRES equipped with supercapacitors. It is noted that, in the case of a smart distribution grid, the aggregator or the DSO may change by controlling the value of of the DRES from zero up to the maximum value determined by the size of its supercapacitor. Therefore, an agreement between the TSO and the aggregator/DSO can be established with respect to the desired minimum, . In order to establish a mutual trust between the TSO-DSO/aggregator, the inertial properties of each DRES within a distribution grid, as well as their connection status, should be continuously visible via a DRES registry, which is transparent to all stakeholders, like the one suggested in [4]. Apart from the mutual trust, Equation (9) can be verified only in the cases of a significant frequency event, where the large measured ROCOF should be used to estimate the sudden drop of active power using (7) and then compare it with the measured ΔP within the first second after the start of the frequency event. The latter should be larger than the former due to the frequency sensitivity of the loads.
Suggestions
The contribution of the DRES to inertial response can be quantified using frequency measurements at the PCC of each DRES and then implementing (8). A registry containing the inertial properties of all DRES in the distribution system should be constantly updated and be transparent to the TSO in order to establish a mutual trust. This trust can be confirmed in the cases of major frequency events by using (9) because only in such cases appear significant ROCOFs to make the inertial response measurable.
3.2.3. Costs and Benefits
The costs associated with the provision of inertial response from converter-interfaced DRES is the installation cost of the required FSS and the DC/DC converter for the control of the former. The size of the FSS can be roughly estimated as follows: if we assume that the DRES should be able to provide inertia with H = 5 s, i.e., the average inertia time constant of the continental European grid, under ROCOFs as high as 2.5 Hz/s, as anticipated in [19], then the power that should be injected by the FSS is, according to (7), 0.5 pu of the DRES rated power. The FSS will be theoretically discharged until the frequency nadir is reached. In continental Europe the frequency nadir is 49.2 Hz [31] while is other European areas is 49 Hz. Considering the worst case of 49 Hz and ROCOF = 2.5 Hz/s, the nadir will be reached in 0.4 s. Thus, the energy required from the FSS is 0.5 × 0.4 = 0.2 kJ/kW of rated DRES power. Today, the cost of the ultracapacitor bank is of the order of 20–25 k€/kWh~5.5–7.0 €/kJ, [61,62]. Therefore, the ultracapacitor cost is 1.1–1.4 €/kW of DRES rated power. The cost of a bidirectional DC/DC converter is of the order of 100 €/kW [43], therefore the converter cost is 50 €/kW of DRES power. Roughly, the total cost is of the order of 51–52 €/kW of DRES power, which is very small compared to the cost of converter interfaced DRES; ~800 €/kW for PV systems and ~1200 €/kW for wind systems, [63].
The evaluation of the financial benefits requires simulations at power system level, but some rough estimations are reported in [9], where is stated that in Great Britain the cost for containing the increase of ROCOF increased by 90 M£ within a year. This happens because the respective TSO engaged numerous synchronous condensers with flywheels in order to keep the decreasing system inertial due to the decommission of conventional power plants.
3.3. Frequency Containment Reserves (FCR)
3.3.1. Proposed Definition and Its Justification
FCRs are PPs operating, at nominal frequency, below their maximum capacity, thereby being able to provide additional power (or reduce their output) in case of frequency deviations. Their power- frequency response, called also P-f droop, is usually stepwise linear (see Figure 10) while a frequency deadband is introduced, in order to avoid the continuous hunting of the frequency during the everyday operation of the power system. The time response of the FCR is of order of some seconds, depending on their governor and their primary source, while their target is to arrest the frequency nadir and stabilize the system frequency at a new steady-state, leaving its restoration to the FRRs. Therefore, FCR are the first to act for the frequency restoration, while the inertial response helps in deteriorating the ROCOF, thus, providing the required time for the FCR to be engaged.
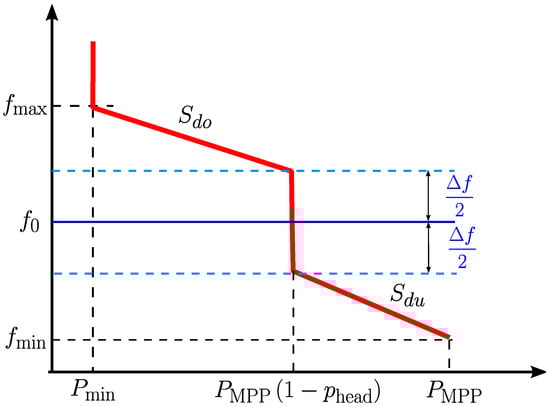
Figure 10.
Droop curve and operation points of DRES at a given time instant.
The increasing penetration of the DRES, particularly those with variable output leads to noticeable system frequency response degradation [60]. Moreover, several studies [64,65,66] agree that the demand for frequency reserves in several countries across Europe and the United States has increased nearly up to 10% of the additional RES capacity over the last few years. Although the opposite has been observed in Germany [67], where the commitment of reserves has been reduced despite the increased DRES penetration, this is attributed to change in the operation of the balancing market from static to dynamic and to the cooperation among the different TSOs that practically unified their control areas. Nevertheless, the increased DRES penetration and other physical reasons [68], e.g., excessive governor dead-bands, or generators operating in modes that do not offer PFR by blocking their governors, lead to the necessary participation of the DRES in the PFR.
Properly controlled converter-interfaced DRES can act as FCR providing either upward or downward or both types of balancing capacity. Operation in downward mode is rather easy and is implemented by moving the DRES away from its MPP as function of the measured frequency at its terminals following a droop like in Figure 10. Already, recent standards and codes at the transmission and distribution system levels [3,11,12], specify that determined by the DSO together with the frequency deadband range. The slope of the droop can be specified either with respect to the nominal DRES power in the case of dispatchable units (hydro or biomass) or with respect to the MPP power, , in the case of variable power DRES. It is noted that DRES like wind generators can limit their output up to a minimum power for stability reasons. In underfrequency events, the same Codes and standards [3,11,12], specify the reaction of DRES depending on whether they are assigned as FCR or not. In the former case, the frequency deadband can be set by the DSO between and while the slope . In case the DRES is not assigned as FCR, it is specified that they should simply support the system by “limiting the reduction” of their power. It is actually requested the DRES to “be resilient to the reduction of frequency at the point of connection while reducing the maximum active power as little as possible” [12]. Thus, a maximum allowed reduction rate of 10% of the maximum power per 1 Hz for frequencies below 49.5 Hz is specified for usual condition but a more stringent reduction of the order of 2% of the maximum power per 1 Hz for frequencies below 49 Hz may be requested by the DSO. It is evident that the Standards treat the frequency response of the DRES as system support functions.
3.3.2. Measurement and Quantification
In order for this response to be treated as AS, its provision should be similar to the conventional PPs, i.e., the DRES should be able to provide the balancing power both upwards and downwards. To achieve the latter without adding any storage device, a variable-output DRES should operate below its MPP, , with a headroom specified by the aggregator/DSO. Since the MPP varies with time, it is reasonable to define the headroom as a constant portion of the available , which means that the DRES output power at time instant , will be:
where, , is the headroom expressed in pu with respect to . This operating mode will be followed as long as . In case the frequency is outside the set deadband, the power of the DRES will be determined by the frequency measured at its PCC and the slopes of the droops. From Figure 10 it can be deduced that
and:
It is noted that are interrelated and fully configurable by the DSO/aggregator. The aggregator/DSO may enable/disable the operation of a particular DRES as FCR according to agreements made with the TSO. The contribution of a DRES to the PFR over a period , can be evaluated by:
where and is the time instant when the DSO sends to the DRES the enable signal to start operating as FCR, while is the time when the DSO sends to the DRES the disable signal, to finish the AS. It is noted that, while is the measured active power at the PCC of the DRES during the period , the power can only be calculated because it was not actually delivered. It can be calculated by the measured MPPT power (actually the available “mechanical” power, ) at the output of the DRES primary source (PV, wind generator, etc) and the efficiency of the DRES converter(s). Analytical tools for estimating the efficiency as a function of have been developed in [21,22]. Thus, can be calculated as:
It is evident that Equation (13) represents the lost opportunity cost (i.e., the energy that would be otherwise injected into the grid) in order for the DRES to act as a FCR entity. Therefore, this expression is suggested as a method for the quantification of the contribution of a DRES to PFR. It is noted that is internally calculated and registered by each variable-output DRES because they use it as control objective. However, in order to practically implement (13), the value of should be retrieved from the internal registers of the DRES in synchronization with the measured .
Regarding the accuracy of the various measurements, the specifications set in the IEEE 1547-2018 standard [10] are suggested considering that PFR is a quasi-steady state condition: frequency should be measured with 10 mHz accuracy over a window of 50 cycles (1 s). The active powers in (13) are suggested to be averaged over the same period (1 s) with an accuracy equal to 1% of the nominal DRES power. This suggestion is stricter than the respective specifications in [11,12], where the accuracy in the measurement of the power should be 10% of the nominal power and should be averaged over 1 min. The reason for the stricter suggestion is that the measurements will be used for the remuneration of a DRES, while the standards refer to measurements used for control purposes.
Validation
The actual participation of a DRES as a FCR entity can be validated by comparing the measured with the one calculated by equations (10), (11) or (12) as a function of the measured frequency considering also the various parameters set by DSO (see Figure 10). In this way a mutual trust between DSO/aggregator and DRES owner can be established. The same trust between DSO and TSO can be established provided that the DRES parameters and its locational information within a distribution grid are transparent to the TSO via a mutually accessible DRES registry [4].
3.3.3. Costs and Benefits
The cost for providing this AS is actually the lost opportunity cost as described above for each DRES. However, when considering the primary frequency response of the whole distribution grid by aggregating the individual DRES this cost may be slightly increased or decreased by the losses incurred within the distribution grid. The increase or decrease depends on the loading of the feeders and actually if the power flow is reversed or not. It should be mentioned that the evaluation of an aggregated P-f droop for the whole distribution grid based on the individual P-f droop characteristics of the DRES while respecting technical constrains within the grid is still a research issue. The financial benefits are obviously the deferral of commitment of respective reserves from conventional PPs.
3.4. Reactive Power Support for Voltage Regulation
3.4.1. Proposed Definition and Its Justification
The provision of reactive power for voltage regulation in the transmission networks is already an established AS and is usually remunerated on the basis of measured reactive energy (MVArh) exchanged. Operational costs such as the additional losses incurred in the excitation of SGs or in their stators are considered for establishing the unit cost (€/MVArh) of this AS.
The regulation of the voltage within the distribution networks is the responsibility of the DSO. Based on the passive nature of the distribution networks, the DSOs still use traditional means (such as the on-load tap changer (OLTC), switching of capacitor banks, etc.) to regulate the voltage while the relevant investment and operational costs are indirectly transferred to all consumers/producers within the distribution network. However, the increased penetration of DRES has added new problems, such as voltage rise, which can be effectively tackled by exploiting the reactive power capability of the DRES despite the fact that distribution networks exhibit relatively large R/X ratios. In addition to such internal problems, the TSOs impose limits in the reactive power exchanged with a distribution network at its POI with the transmission system. The voltage stability of the transmission system is deteriorated by the fact that the connected distribution systems exhibit capacitive behavior, i.e., inject reactive power towards the transmission system, particularly, when the net load (consumption minus generation) is reduced below 25% of the interconnected HV/MV transformer capacity, [20]. Such low loading conditions become more frequent as the DRES penetration within the distribution system increases. In order to preserve the voltage stability of the system, ENTSO-E suggests that the exchange of reactive power at the distribution system POI is closely monitored, and, if possible, zeroed. It is evident that the reactive power of the DRES should be controlled in a coordinated way to address the voltage regulation within the distribution network and the exchange of reactive power with the transmission system. Numerous methods have been suggested in the technical literature to address the voltage regulation in distribution networks under very high DRES penetration [69,70,71,72]. These methods are based on the control of the reactive power exchanged by the DRES in centralized, decentralized or distributed way [73,74,75,76,77] requiring different communication levels among the DRES and a central controller. Recognizing the value of reactive power, recently issued standards and codes [3,10,11,12,78] specify the reactive power capability of DRES connected in MV or LV distribution networks, limiting, however, this capability to Power Factor (PF) = 0.95 and in stringent cases to PF = 0.90 although operation under smaller PFs may be required [79].
The extended use of reactive power implies additional costs for the owners of the DRES or ESS. For instance, the DC/AC converter of a converter-interfaced DRES (PV or wind) should be oversized in order to simultaneously provide the maximum active and reactive power. Additionally, a converter operating under has reduced efficiency [21], which means additional operating cost. Therefore, the provision of reactive power should be treated as AS rather than system support function and should be remunerated like in the case of the transmission systems. The quantification of the reactive power contribution of a DRES or ESS connected in the distribution network is more complicated with respect to the case when they are connected directly to the transmission system for the following reasons: (1) distribution systems exhibit larger unbalances, (2) the voltage and current harmonic pollution is larger and (3) some DRES may also act as active harmonic filters at the same time. These reasons are closely associated with the various definitions of the term “reactive power” [80,81,82,83,84,85]. It is also reminded that voltage regulation refers to the positive sequence and fundamental frequency component of the voltage. In the same context, recent standards propose that the applicable voltages for DRES reactive power control are quantified in one of the following ways:
IEEE 1547-2018 Std [10]: (i) the average of the RMS values; (ii) positive-sequence component of voltages over one fundamental frequency period.
EN 50549 Stds. [11,12]: (i) the positive sequence of the symmetrical components; (ii) the average of voltages of a three-phase system; (iii) the voltage of every phase to determine the reactive power for every phase.
3.4.2. Measurement and Quantification
Considering the aforementioned issues, it is suggested in this paper that only the reactive power exchanged through the positive sequence and fundamental frequency voltages and currents should be considered for the voltage regulation AS. Thus, the contribution of DRES in reactive power should be quantified by:
where, are the instantaneous RMS values of the positive sequence and fundamental frequency of the line voltage and current at the DRES terminals, while is the phase difference between . It is noted that and can be instantaneously measured using already developed methods for the operation and control of active harmonic filters [84].
It is evident that in (15) represents the reactive “energy” (in kVArh) exchanged over a period T. Since voltage regulation is a steady-state or quasi steady-state process, the specifications mentioned in [86] with respect to can be used: initially a digital value of reactive power is measured with T equal to 10 cycles (200 ms). Next, these values will be aggregated over a: 3-s period (15 of 10-cycles values); 10 min (200 of 3-s values) and; 24-h period (144 of 10-min values) [27]. The aggregated data are referred to an absolute time stamp corresponding to the final moment of the aggregation interval. The accuracy in the measurement of voltage and currents should be 1% of their nominal values while for reactive power 5% of the rated DRES apparent power. Such an accuracy can be achieved with a sampling rate of at least 6.4 kHz (128 samples/period).
The exchange of reactive power increases the losses within the DRES converters. The additional losses can be evaluated by
where, (expressed in kWh) is actually the operational cost for providing reactive power. The efficiency () of the DRES converter is a function of the converter active () and reactive power () loading and can be analytically evaluated according to [21].
3.4.3. Costs and Benefits
The costs involved with this AS are the operational costs as mentioned above and the investment cost due to converter oversizing. The oversizing factor generally depends on the R/X ratio of the feeder on which the DRES is connected [78]. In addition, the operation of a DRES with a PF as low as 0.7, which implies an oversizing of the order of does not significantly affect its overall efficiency [22]. Thus, we may assume an oversizing of the order of as a worst case. As can be seen in Figure 7, such an oversizing does not lead to a proportional increase of the inverter purchase cost. Figure 7 shows the per-unit retail prices of commercially available PV inverters in Greece in July 2020 from four different manufacturers. It can be noticed that the per-unit price falls exponentially as the nominal power of the inverter increases. As an example, let us consider the case of and which are related with . The unit cost of the former is approximately 125 €/kW, while that of the latter is 93 €/kW. Therefore, there is an increase in purchase cost by €138 in total, which is 6.3% of the cost of the 17.5 kVA inverter.
The benefits associated with this AS are mainly the deferral of investments the DSO would otherwise do in order to accommodate the increasing penetration of DRES. Such investments are the upgrade of feeders, the use of advanced distribution transformers with OLTC capability, the use of coil banks to mitigate the capacitive reactive power at the POI of the distribution grid with the transmission system, etc.
Some indicative costs of feeders for the Spanish distribution system are: the cost of the overhead LV feeders is in the range of 16–26 €/m depending on the cross section and the kind of terrain, [42], while their operational and maintenance costs are 170–270 €/km/annum, [42]. In the case of cables, the respective costs are 48–98 €/m and 500–1000 €/km/annum, [42]. In the case of overhead MV feeders the respective costs are 58–110 €/m and 600–1100 €/km/annum while for MV cables 118–316 €/m, and 1200–3200 €/km/annum, [42].
Some indicative costs of distribution transformers with OLTC [42]: According to the Slovenian DSO, a 400 kVA distribution transformer with OLTC costs approximately 28 k€ while the conventional one just 10 k€.
Some indicative costs of coil banks for reactive power compensation [42]: The installation cost of coil banks in the Spanish distribution systems is of the order of 800 €/MVAr with the operational cost of the order of 22 €/MVAr/annum.
3.5. FRT Capability and DRES Reaction During Grid Faults
3.5.1. Proposed Definition and Its Justification
It is well known that the protection systems in distribution grids were designed under the assumption of unidirectional power flow. The increasing penetration of DRES however changes this situation and poses a number of challenges for the proper operation of the legacy protection systems, such as: false or sympathetic tripping [87], protection blinding [88], increase or decrease in short-circuit levels [89], undesirable network islanding [90], loss of protection coordination [91]. To avoid those problems, the DSOs and the relevant grid codes requested-in the early stages of DRES penetration- the immediate disconnection of the DRES at the occurrence of a fault. Their reconnection was allowed after some minutes from the instant the fault was cleared. However, this situation caused a significant active power mismatch as the DRES penetration increased significantly. The revised grid codes and even the recent standards request for certain FRT capability of the DRES both in the LV and MV parts of the distribution grid [11,12]. Apart from the FRT capability, the same standards now request that the DRES inject reactive currents (in both the positive and negative sequence) in linear proportion to the voltage drop sensed at the DRES terminals. The RMS value of the injected current is limited to the rated current of the generating unit. Although the reason for injecting reactive currents during faults is not justified in the standards and grid codes, we may assume that the reactive currents will help in maintaining a larger voltage at the DRES terminals, thereby increase the time it should remain connected for a specific FRT curve. However, the injection of reactive currents by DRES may cause the aforementioned protection system problems. Moreover, in distribution grids with relatively high R/X ratio, the injection of active currents would be more helpful in reducing the voltage drop during faults.
A lot of research has been conducted in past few years in order to address the protection systems in distribution grids and microgrids under high DRES penetration (see Table 1). However, the research focused on the use of more advanced protection systems and methods, which implies additional costs for the DSO. These costs will eventually be transferred to all consumers/prosumers in the distribution grid.

Table 1.
Fault-clearing methods in distribution systems- a categorization.
Further research has shown that, by suitably controlling the injected currents according to locational information within an islanded microgrid, the legacy protection system can remain fully functional and maintain its selectivity even under high DRES penetration [104]. However, to fulfill this task, the DRES need to have a rather extended FRT capability [37] being also able to inject active currents during the fault. Both the adjustable FRT capability and the injection of active currents when the primary source is not available (lack or wind or during the night for PVPPs) can be achieved by the implementation and proper control of a FSS at the DC link of converter-interfaced DRES. Therefore, an FSS system allows the DRES to inject controllable currents during the faults independently of the magnitude of the primary source.
Based on the aforementioned analysis it can be said that, an FSS system enables the DRES to follow any FRT requested by the DSO and inject controllable currents. This ability allows for the proper configuration of the DRES reaction during faults as function of the short-circuit capacity of the upstream grid while avoiding upgrades in the legacy protection system. Thus, for example, in cases where the short-circuit capacity of the upstream is large enough, the DRES within the distribution system may inject zero currents while remaining connected-this case is similar to the early days of DRES penetration but with enhanced FRT capability. In cases the upstream grid is weak, the DRES may be forced to inject controllable currents as function of their capacity and location [104], so that the operation of the legacy protection system is preserved.
3.5.2. Measurement and Quantification
The following measurement and quantification methods are suggested in order to transform the contribution to fault clearing and the associated FRT capability as an AS: A fault condition can be detected by the sudden reduction of the 20 ms RMS values of any of the DRES phase-voltages below a limit which is adjustable by the DSO [11,12]. Next, the DRES switches to current control mode and starts injecting currents in the faulty phases like the one shown in Figure 11, emulating the operation of a SG under short circuit.
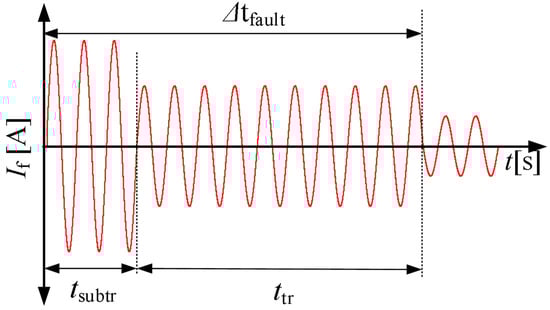
Figure 11.
DRES fault current [105].
The current resembles the fault current of a conventional SG with a subtransient, and transient period. The respective RMS value of the current is and . The subtransient period starts immediately after the detection of the fault, while the transient period ends as soon as the voltage recovers to steady-state values. All of these parameters can be configured by the DSO starting from zero up to a maximum value determined by the thermal limit of the converter switches in the case of the converter-interfaced DRES. In the case of DRES that are directly coupled with SGs, the aforementioned parameters are not configurable, but are determined by the SG construction. However, in both cases the contribution to fault clearing can be measured and quantified based on the energy quantity as follows:
It is known that the grid codes among the various countries differ with respect to the requested FRT capability of the DRES [105,106]. However, the implementation of an FSS system enables each DSO to configure its own FRT curve on each individual DRES. Such a generic FRT curve is shown in Figure 12 determined by eight points.
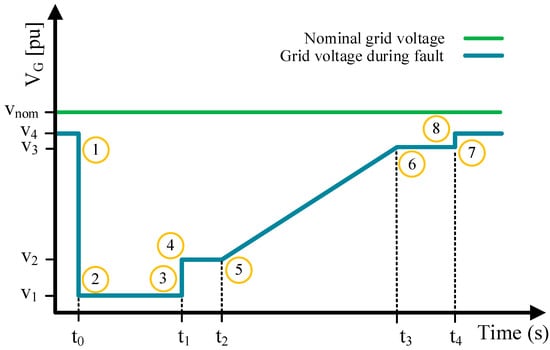
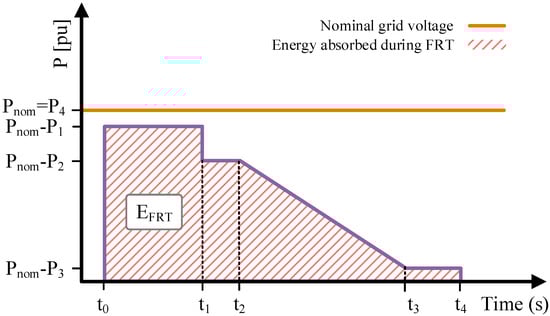
Figure 12.
Energy estimation (bottom) for supercapacitor sizing based on the generic FRT curve (top), [105].
The required storage capacity of the FSS, CFSS, is estimated by the case where, during the fault, the primary source is providing the nominal DRES power, , while for the time period the electrical power injected is zero, i.e., the DRES injects either zero or only reactive current. The required CFSS is given by Equation (18):
In case the DRES is required or allowed to inject active current, then only a portion of CFSS calculated by (18) is required. In this case, the DRES will inject the maximum allowable current which is equal to the nominal current. Therefore, the active power will be directly proportional to the terminal voltage. This portion, is calculated by (19) where is the active power injected under voltage , etc.
is the rated voltage of the FSS in Volts (V), while all the rest voltages , are expressed in pu.
It is noted that (18) or (19) give the size of the ultracapacitor that should remain discharged in order to absorb the power mismatch. Another case that should be considered is the following: the DRES should contribute with active fault currents when the primary source is not available, e.g., during the night for a PV system. In such cases, a portion of the FSS should be charged in order to provide the required active power. In the worst case it can be assumed that the fault caused the voltage to drop to (see top of Figure 12) while the DRES is programmed to inject a current similar to Figure 11. The required ultracapacitor size is the determined by:
where, is the RMS value of the fault current during the subtransient time duration and is the RMS value of the fault current during the transient time duration . Thus, in the worst case,
Equation (18) represents the availability cost that has to be remunerated. This cost involves only the additional FSS and the associated DC/DC converter installation cost. Due to the small time-scales involved during the faults the operational costs are negligible. On the other hand, Equation (17) represents the actual contribution of a DRES during a fault and can be used for additional remuneration of this AS in the cases where the contribution with controllable currents is requested. The remuneration coefficient that will be applied to (18) should be evaluated on a cost-benefit analysis of this AS within a distribution system.
3.5.3. Costs and Benefits
The costs and benefits are presented here in a qualitative way only. Their quantitative evaluation is pending research to be carried out in the near future. The costs that need to be considered are: (1) the additional investment cost of the required FSS according to (18); (2) in very weak parts of the distribution grid or in islanded microgrids the injected currents in (17) may need to be larger than 1 pu, [104]. In such cases the converter of the DRES needs to be somewhat oversized. The oversizing is not in direct proportion to the injected RMS current, if the short-term overloading capability of the power-electronic switches is also considered; (3) part of the cost of the DC/DC converter required for the control of the FSS. It is noted that the one DC/DC converter is required to control one physical FSS, which is actually used to provide three AS- inertial response, ramp-rate control and FRT. The provision of FRT is only rarely needed, therefore the DC/DC converter is rarely used for this AS. The unit costs of the FSS, the DC-DC converter and the inverter oversizing are mentioned above in previous sections.
The benefits associated with this AS are the deferral of investments that would be otherwise needed in upgrades of the distribution grid protection system (see Table 1) in order to accommodate larger DRES penetrations.
3.6. Voltage-Harmonics Mitigation
3.6.1. Proposed Definition and Its Justification
Harmonic pollution is a potential problem in distribution grids due to the proliferation of non-linear loads [107]. For this reason, the EN 50160 standard specifies maximum voltage harmonic pollution in distribution grids: the total harmonic distortion at any node should be less than 8% for 95% of the time within a week. Additionally, requirements are specified for individual harmonics too, e.g., the 5th harmonic should be less than 6%, even-order harmonics such as the 2nd less than 2%, etc.
It is noted that it is one of the DSO responsibilities to preserve the voltage quality within its distribution system. The harmonic pollution of the voltage is caused by the harmonic currents flowing in the feeders and drawn by the non-linear loads and DRES that are converter-interfaced. Various standards, e.g., the IEC 61000 series or the IEEE 519 specify limits on the harmonic pollution of load currents while various grid codes and recent standards, e.g., IEEE 1547-2018 [10] impose limits on the harmonic pollution of the currents injected by the DRES. Until now, most of the DSOs hope that they can limit the harmonic pollution of the voltages in their distribution grids by assuming that the prosumers will follow the limits imposed by standards and grid codes with respect to the injection of harmonic currents. However, there is no guarantee that this will keep on happening given the rapid expansion of the non-linear loads and the continuous reconfiguration and expansion of the distribution grids, i.e., the continuous change of the feeder impedances. Moreover, research has shown that the increased voltage harmonic pollution limits the DRES hosting capacity of the distribution grids [108,109,110].
On the other hand, it has been shown that converter-interfaced DRES can act as active harmonic filters, thus assist in the mitigation of voltage harmonics [111]. These DRES actually control their currents so that- in addition to the fundamental-frequency current component-they inject harmonic currents with magnitude and spectrum determined by the harmonic content of the voltage at their terminals. The basic constraint is that the RMS value of the currents injected should not exceed the thermal limit of the converter switches. Therefore, the DRES can act as active filters only when their fundamental-frequency loading is below the rated one. On the other hand, given the fact that harmonic currents are of reactive nature only, the active harmonic filtering action of the DRES is available even when the primary energy source is not available. Moreover, the active harmonic filtering does not require any additional equipment, such as supercapacitors, thereby there is no additional investment cost in providing this service. However, additional operational costs, e.g., increase of power losses on the DRES converter, should be considered in a similar manner as for the reactive power provision.
3.6.2. Measurement and Quantification
Assume that the DSO sends an enable signal to DRES, so that the latter starts acting also as an active filter. The filtering action will stop either when a disable signal is received by the DSO or the total harmonic distortion (THD) of the voltage at the DRES terminals falls below a predefined value also determined by the DSO. The contribution of a DRES to harmonic mitigation can be quantified as described in (22) considering the fact that a DRES -even when not acting as active filter- injects harmonic currents, which should be below the limits specified by standards [10]. These currents can be considered as “background” harmonics for which the DRES should be remunerated or generally rewarded.
The instantaneous harmonic current is used in (22) to find its squared RMS value over a period T = 1 min, within the minute. The actual contribution, , of a DRES over a day (one day has 1440 min) for the mitigation of the hth harmonic is given in (23) where, is the 1-min rms value of the fundamental current injected by the converter during the kth minute and is the coefficient of the individual harmonic as defined in [10]. For example, for h < 11, for , etc. Finally, the total daily contribution of a DRES in harmonic mitigation is calculated by , which is the suggested metric for the remuneration of a DRES. Considering that the switching frequencies of the DRES are in the range of 10–20 kHz (the converters in wind turbines of the order of MW may have switching frequencies that are even lower than 10 kHz), it is reasonable to focus on mitigation of harmonics up to the 25th order. The instantaneous values of currents in (22) have to be measured at the DRES converter terminals. The selection of T = 1 min instead of T = 10 min (as specified in EN 50160) is justified by the fact that the quantification will be used for remuneration of the service. However, this averaging period is a parameter that can be changed. It affects only the memory capacity of the converter. The procedure for measuring the harmonic voltages and currents should be according the Class A mentioned in the relevant standards [86,112].
3.6.3. Costs and Benefits
The operation of a converter-interfaced DRES as active filter can be simply done by suitable control of the converter, thus, no additional investment cost is required, as mentioned above. However, the converter operates with which means reduced efficiency [21]. This is an additional operational cost, which can be evaluated in a way similar to the case of fundamental-frequency reactive power mentioned above.
The financial benefits would be the deferral of investments by the DSO in order to mitigate voltage harmonic pollution beyond the acceptable limits; such investments would be the installation of passive or active harmonic filters in specific nodes. Other benefit is the reduction of the losses in the distribution transformers due to the reduction of the voltage THD.
4. Identification of Some Technical Barriers and Further Research Targets
To enable the provision of the aforementioned AS in an optimized manner, a rather sophisticated ICT infrastructure is required in each distribution system independently whether the AS are to be provided to the upstream transmission system or within the distribution grid [16]. The ICT system should interconnect every DRES with a central server on which a number of software will take decisions on the optimal allocation of each AS to the various DRES and send the appropriate signals; actually set-points, such as the inertial time constant, the slope of droops, the ramp rate values, etc. In addition, the ICT system should collect and register the measured AS, so that they can be later remunerated in the context of an AS market. Evidently, the ICT system should be robust and resilient towards cyber-attacks mainly due to the accounting of quantities that will be finally remunerated. On the other hand, the speeds involved in such an ICT system are not required to be high, because all the aforementioned AS are provided on the basis of local measurements; the exchange of set-points and the retrieval of measured AS are made in time scales of several seconds or minutes. However, the currently used SCADA systems in most of the distribution systems are not suitable as building block of the AS environment mainly due to the lack of the required security. Given the fact that the various DRES currently use different communication protocols, the ICT should enable the easy integration of those protocols without jeopardizing the security. Apart from security, the ICT system and the various software platforms as well as any databases regarding the DRES, should be transparent to all involved stakeholders: DRES owners, aggregators, DSO and TSO.
Such an ICT system evidently has an investment and maintenance cost that needs to be allocated among the various AS it serves. However, methods for fair allocation of this cost to the various AS is still an open research issue.
With respect to harmonic mitigation the following barrier has been identified: the current grid codes and relevant standards (even the recent ones) specify upper limits for the injection of harmonic currents by DRES. Evidently, such specifications prohibit the use of the DRES as active harmonic filters. Therefore, it is suggested that the DSO should lift those specifications from the DRES which are assigned the role of active filters. At the same time, the DSO should monitor the activity of the DRES not participating in the active filtering action to make sure that they follow the specifications. Obviously, an ICT system is required at distribution grid level that will enable the DSO to monitor each DRES, to send the enabling/disabling signals mentioned above, to register the quantified contribution of each DRES and the voltage THD at all respective nodes.
Moreover, although there are mature methods for controlling the DRES to act also as active harmonic filters, there is limited research on the methods to optimally allocate the filtering action to specific existing DRES within a distribution grid. Such optimal allocation should be dynamic for two reasons: the non-linear loads continuously change; the loading of the DRES also changes as their primary source is volatile while at the same time they might be engaged in other AS of higher priority that exhaust their rated power.
The current market regulations treat the DSO mainly as market facilitator, leaving the offer of the AS to third parties, like the aggregators. Nevertheless, several technical constraints (e.g., line and transformer thermal limits, over- and under-voltages during either steady-state operation or dynamic situations and false operation of protection means due to influx of high currents) should be respected when DRES located within a distribution system offer a specific AS. Hence, the DSOs should be involved in the evaluation of the technically feasible amount of each AS, which can be offered at any time interval, even in the cases an aggregator is responsible for the trading of these AS. Hence, the aggregation of the AS, particularly those related to frequency deviation, and their secure and controllable provision to the upstream TSO, still remains an open research issue. This ongoing discussion has already been reflected and comprehensively presented in the recently published “TSO-DSO Report: An integrated approach to active system management” [4]. As a starting point, in [113] a method is developed to (i) aggregate the inertial response by several DRES within a distribution system and (ii) to optimally allocate a given amount of inertial response to the DRES within the distribution system. This two-stage method takes into account some of the technical constraints within the distribution system mentioned above as well as specific constraints of the DRES, e.g., converter temperature increase and power losses. A broader identification of relevant technical, financial and regulatory barriers can be found in [18].
5. Discussion
There are some issues that need to be discussed with respect to the actual implementation of the suggested M & Q:
- The suggested M & Q methods for each AS need to be commonly agreed among the involved stakeholders because, in the end, the quantification will be translated in remuneration of the AS. Such a common agreement should be, preferably, reflected in new standards specifying the M & Q method as well as the measurement accuracy. The measurement accuracy suggested in this paper for the various AS has not been tested with suitable experimental setups. Such as testing is essential because the measured quantities in some cases (e.g., inertial response or ramp rate limitation and harmonic mitigation) may be small either due to the magnitude of the AS or due to its short duration. For instance, the error introduced in the provision of PFR according to Equation (13) needs to be evaluated as function of the sampling rate of currents and voltages. The magnitude of this error will subsequently help in the final decision on a common sampling rate followed by all DRES that participate in a future AS market.
- Another issue concerns the device that performs the M & Q. A smart meter retrofitted at the terminals of a DRES or a plant consisting of several DRES (e.g., a PV or wind plant) is an option that has some merits and drawbacks. The merits include the fact that all DRES will have the same M & Q system which, however, needs to be synchronized. In this case one single smart meter per plant is sufficient. The drawback is that such smart meter that is able to capture and quantify dynamic or transient AS does not currently exist. Another option is to implement the M & Q within each DRES converter by using, for example, a dedicated Raspberry PI device which will also take care of the communication between the DRES and the overlaying ICT system. The cost of this option seems to be lower than that of the first option, since actually it will be an extension of the already existing measuring systems within each DRES converter. However, it has to be certified with respect to the expected accuracy and the synchronization procedure. This option also allows the evaluation of the AS offered by each DRES individually.
- The action of a DRES as FCR is suggested to be quantified via (13) which, however, requires the synchronized monitoring of the available maximum power point. Currently, in all converter interfaced DRES, is internally calculated with custom accuracy and rate. Nevertheless, in order to adopt (13), , should be evaluated in a uniform way and should be accessible to the external or internal metering system.
- Currently many grid codes impose lower power limits on DRES in order to participate as FCR. For example, this limit is 1 MW in the case of Greece. Such limits prohibit the participation of small DRES although their aggregated contribution cannot be ignored. Thus, aggregation may be required but this, in turn, requires suitable aggregation methods, such as the one published recently by the same authors for inertia aggregation [113].
- For some AS such as inertial response and PFR, the availability of the service is equally important to actual delivery of the service when remuneration is considered. The respective suggestions made is Section 3.2.2 and Section 3.3.2 need to be evaluated experimentally and subsequently in real relevant environment.
- A number of dispatchable DRES such as small hydro or biomass units are already installed and are expected to be installed in distribution grids. These units employ rotating electrical machines that inherently possess inertia, but its magnitude is either unknown or know with limited accuracy. Means for their on-line evaluation (overhauling and testing in certified labs is expected to be very expensive) should be devised in order for them to equally participate in future inertia markets in a fair way.
6. Conclusions
The converter-interfaced DRES that are controlled as grid-formers can provide a number of functions that can support the frequency and voltage stability of the grid, as well as the fault-clearing and harmonic mitigation in distribution grids, despite their increasing penetration. This paper focuses on providing the theoretical framework with respect to the M & Q of various AS. It was shown that these support functions can be transformed into future AS by suggesting suitable methods for their M & Q, so that they can become tradable.
Based on the experience gained from AS at transmission system level, the paper proposes the definition, the M & Q method, as well as a rough estimation of the associated costs and benefits for the following new AS: (1) inertial response, (2) primary frequency response, (3) active-power smoothing (ramp-rate limitation), (4) exchange of reactive power for voltage regulation purposes, (5) FRT and contribution to fault-clearing, (6) voltage harmonic mitigation.
To the best of our knowledge, this is the first attempt to clearly define and quantify AS offered by DRES connected within distribution systems. A number of open research issues and some barriers imposed by current grid codes have also been identified. However, the authors believe that the research gaps and the barriers can be addressed in the near future without affecting the proposed M & Q of the new AS.
Author Contributions
Conceptualization, C.S.D., K.-N.D.M., J.M.M.; Review and state-of-the-art, K.-N.D.M., K.O.O.; methodology and investigation per Section: Section 3.1., K.-N.D.M., G.C.K., S.G., J.L.M.R.; Section 3.2, G.C.K., J.M.M., C.S.D., E.O.K.; Section 3.3, J.M.M., C.S.D., E.O.K.; Section 3.4, K.-N.D.M., G.C.K.; Section 3.5, S.G., K.O.O.; Section 3.6, K.-N.D.M., C.S.D.; writing—original draft preparation, C.S.D., K.-N.D.M.; writing—review and editing, K.-N.D.M., G.C.K., S.G., E.O.K.; supervision, C.S.D.; project administration, C.S.D.; All authors have read and agreed to the published version of the manuscript.
Funding
This research is part of the EASY-RES project that has received funding from the European Union’s Horizon 2020 Research and Innovation program under Grant Agreement No. 764090.
Acknowledgments
The authors would like to thank Francisco Casado Machado from University of Seville, Spain, for his valuable contribution in deriving the results presented in the Appendix A.
Conflicts of Interest
The authors declare no conflict of interest.
Appendix A
In a real 6 kWp PV system in Germany measurements have been taken with 1 s resolution during a day, specifically on 28/09/2018. The measurements concern 12 h of this day starting from 07.30 to 19.30, when the PV power is zeroed.

Figure A1.
Power Smoothing Performed by the Super-Capacitor: (a) blue curve: measurements of the PV power of a real 6 kWp PV system in Germany with resolution of 1 s; orange curve: the active power finally injected in the grid after the performance of the power smoothing algorithm; (b) blue curve: the ramp-rate of the real active power in pu/min; orange curve: the ramp-rate of the smoothed power in pu/min; (c) the power absorbed/released by the supercapacitor (SC); (d) the SC energy along with its reference value.
As it can be observed in Figure A1a with the blue curve, from around 13.00 to 15.00 (i.e., 20,000 s to 30,000 s) there exist several fluctuations in the PV power, since it is a very cloudy day. It is assumed that the PV converter performs a simple ramp-rate control in a similar manner as the one presented in [114]. The ramp-rate limitation is set to 0.3 pu/min. Based on this control, the power of the SC released/absorbed is depicted in Figure A1c. After the smoothing action finishes, the supercapacitor (SC) restores its energy back to its reference value (Figure A1d). With respect to its power the DC/DC converter of the SC is assumed to be able to absorb/release up to 0.9 pu, i.e., 5.4 kW for this specific PV system, since in Central Europe such rapid fluctuations like Figure A1a are very often. The energy needed for this action is calculated to be 47 Wh in a similar manner as calculated in [114].
References
- Roberts, C. Review of International Grid Codes. In Energy Analysis and Environmental Impacts Division Lawrence Berkeley National Laboratory; Technical Report; 2018. Available online: https://certs.lbl.gov/sites/default/files/international_grid_codes_lbnl-2001104.pdf (accessed on 12 June 2020).
- Daniel, G.S.; Kirschen, S. Fundamentals of Power System Economics, 2nd ed.; Wiley: Hoboken, NJ, USA, 2018. [Google Scholar]
- Commission Regulation (EU) 2016/631 of 14 April 2016, Establishing a Network Code on Requirements for Grid Connection of Generators. 2016. Available online: https://eur-lex.europa.eu/legal-content/EN/TXT/PDF/?uri=CELEX:32016R0631&from=EN (accessed on 16 June 2020).
- ENTSO-E; E.DSO; Eurelectric; GEODE & CEDEC. TSO–DSO REPORT: An Integrated Approach to Active System Management with the Focus on TSO–DSO Coordination in Congestion Management and Balancing, Technical Report. 2019. Available online: https://docstore.entsoe.eu/Documents/Publications/Position%20papers%20and%20reports/TSO-DSO_ASM_2019_190416.pdf (accessed on 16 June 2020).
- Holttinen, H.; Cutululis, N.A.; Gubina, A.; Keane, A.; Van Hulle, F. Ancillary Services: Technical Specifications, System Needs and Costs. Deliverable D2.2, REserviceS FP7 Project. 2012. Available online: http://orbit.dtu.dk/files/72251308/Ancillary_Services.pdf (accessed on 13 June 2020).
- Gallos, K.; Tsitsimelis, A.; Dikaiakos, C.; Mushtaq, U.; Cvetkovic, M.; Vargas, A.A.; Mauricio, J.M.; Santos, J.R.; Maza-Ortega, J.M.; Demoulias, C.; et al. D5.1 Report Reviewing the Current Market Regulatory Framework, EASY-RES, H2020 EU Project. 2018. Available online: https://cordis.europa.eu/project/rcn/213757/results/en (accessed on 15 June 2020).
- Rebours, Y.G.; Kirschen, D.S.; Trotignon, M.; Rossignol, S. A Survey of Frequency and Voltage Control Ancillary Services— Part II: Economic Features. IEEE Trans. Power Syst. 2007, 22, 358–366. [Google Scholar] [CrossRef]
- EASY-RES Project. Funded by EU in the Frame of H2020 (GA:764090). Available online: www.easyres-project.eu (accessed on 2 September 2020).
- ENTSO-E; Wind Europe; Solar Power Europe and T&D Europe. High Penetration of Power Electronic Interfaced Power Sources and the Potential Contribution of Grid Forming Converters, Technical Report. 2020. Available online: https://eepublicdownloads.blob.core.windows.net/public-cdn-container/clean-documents/Publications/SOC/High_Penetration_of_Power_Electronic_Interfaced_Power_Sources_and_the_Potential_Contribution_of_Grid_Forming_Converters.pdf (accessed on 22 July 2020).
- IEEE Standard for Interconnection and Interoperability of Distributed Energy Resources with Associated Electric Power Systems Interfaces. In IEEE Std 1547–2018; Revision of IEEE Std 1547–2003; IEEE: San Diego, CA, USA, 2018; pp. 1–138.
- EN50549-1:2019 Requirements for Generating Plants to be Connected in Parallel with Distribution Networks—Part 1: Connection to a LV Distribution Network—Generating Plants up to and including Type B; European Committee for Electrotechnical Standardization (CENELEC): Brussels, Belgium, 2019.
- EN50549-2:2019 Requirements for Generating Plants to be Connected in Parallel with Distribution Networks—Part 2: Connection to a MV Distribution Network—Generating Plants up to and including Type B; European Committee for Electrotechnical Standardization (CENELEC): Brussels, Belgium, 2019.
- Gevorgian, V.; Booth, S.L. National Renewable Energy, Review of PREPA Technical Requirements for Interconnecting Wind and Solar Generation. 2013. Available online: https://www.nrel.gov/docs/fy14osti/57089.pdf (accessed on 30 July 2020).
- EirGrid. “WFPS-Active-Power-Control-Test-Procedure”. 2019. Available online: http://www.eirgridgroup.com/library/index.xml (accessed on 30 July 2020).
- EirGrid Grid Code, Version 6.0; EirGrid, 22 July 2015. Available online: http://www.eirgridgroup.com/site-files/library/EirGrid/GridCodeVersion6.pdf (accessed on 30 July 2020).
- Gerard, H.; Rivero, E.; Six, D. D1.3 Basic Schemes for TSO-DSO Coordination and Ancillary Services Provision, H2020 SmartNet Project Deliverable. December 2016. Available online: http://smartnet-project.eu/wp-content/uploads/2016/12/D1.3_20161202_V1.0.pdf (accessed on 30 July 2020).
- Gubina, A.F.; Tuerk, A.; Pucker, J.; Taljan, G. Policy framework conditions for provision of ancillary services in a distribution network by distributed RES generation. In Proceedings of the 2015 IEEE Eindhoven PowerTech, Eindhoven, The Netherlands, 29 June–2 July 2015; IEEE: Eindhoven, The Netherlands, 2015; pp. 1–6. [Google Scholar]
- Oureilidis, K.; Malamaki, K.-N.; Gallos, K.; Tsitsimelis, A.; Dikaiakos, C.; Gkavanoudis, S.; Cvetkovic, M.; Mauricio, J.M.; Maza Ortega, J.M.; Ramos, J.L.M.; et al. Ancillary Services Market Design in Distribution Networks: Review and Identification of Barriers. Energies 2020, 13, 917. [Google Scholar] [CrossRef]
- ENTSO-E. Future System Inertia, Technical Report. 2018. Available online: https://docs.entsoe.eu/dataset/nordic-report-future-system-inertia (accessed on 24 June 2020).
- ENTSO-E. Reactive Power Management at T—D Interface. In ENTSO-E Guidance Document for National Implementation for Network Codes on Grid Connection; 2016; Available online: https://docstore.entsoe.eu/Documents/Network%20codes%20documents/NC%20RfG/161116_IGD_Reactive%20power%20management%20at%20T%20and%20D%20interface_for%20publication.pdf (accessed on 25 June 2020).
- Malamaki, K.D.; Demoulias, C.S. Estimation of Additional PV Converter Losses Operating Under PF ≠ 1 Based on Manufacturer’s Data at PF = 1. IEEE Trans. Energy Convers. 2019, 34, 540–553. [Google Scholar] [CrossRef]
- Demoulias, C.S. A new simple analytical method for calculating the optimum inverter size in grid-connected PV plants. Electr. Power Syst. Res. 2010, 80, 1197–1204. [Google Scholar] [CrossRef]
- Monti, A.; Muscas, C.; Ponci, F. Phasor Measurement Units and Wide Aera Monitoring Systems; Elsevier: Amsterdam, The Netherlands, 2016. [Google Scholar]
- Sun, Q.; Li, H.; Ma, Z.; Wang, C.; Campillo, J.; Zhang, Q.; Guo, J. A Comprehensive Review of Smart Energy Meters in Intelligent Energy Networks. IEEE Internet Things J. 2016, 3, 464–479. [Google Scholar] [CrossRef]
- SMA Technical Information: Measurement Accuracy-Energy Values and Efficiency for PV Inverter Sunny Boy and Sunny Mini Central. Available online: http://files.sma.de/dl/7418/Messgenau-UEN092520.pdf (accessed on 13 June 2020).
- Eto, H.; Stewart, E.; Smith, T.; Buckner, M.; Kirkham, H.; Tuffner, F.; Schoenwald, D. Scoping Study on Research and Development Priorities for Distribution-System Phasor Measurement Units, Ernest Orlando Lawrence Berkeley National Laboratory. 2016. Available online: https://prod.sandia.gov/techlib-noauth/access-control.cgi/2016/163546r.pdf (accessed on 4 June 2020).
- Malamaki, K.-N.; Gkavanoudis, S.; Mushtaq, U.; Cvetkovic, M.; Marano, A.; Gallos, K.; Dikaiakos, C.; Jerele, M.; Schneider, C.; Damböck, R. D1.1 Description of the Metrics Developed for the Quasi-Steady-State Operation and Report on the Review of the Respective Current Grid Codes, EASY-RES, H2020 EU Project. 2018. Available online: https://cordis.europa.eu/project/rcn/213757/results/en (accessed on 28 July 2020).
- Mauricio, J.M.; Kryonidis, G.; Malamaki, K.-N.; Villarejo, M.B.; Delgado, L.C.; Mushtaq, U. D2.3 Development of Dynamic Functionalities, EASY-RES, H2020 EU Project. May 2019. Available online: https://cordis.europa.eu/project/rcn/213757/results/en (accessed on 30 July 2020).
- Li, W.; Joos, G.; Abbey, C. Attenuation of Wind Power Fluctuations in Wind Turbine Generators Using a DC Bus Capacitor Based Filtering Control Scheme. In Proceedings of the Conference Record of the 2006 IEEE Industry Applications Conference Forty-First IAS Annual Meeting, Tampa, FL, USA, 8–12 October 2006. [Google Scholar]
- Changling, L.; Boon-Teck, O. Frequency deviation of thermal power plants due to wind farms. IEEE Trans. Energy Convers. 2006, 21, 708–716. [Google Scholar]
- EirGrid Group and System Operator of Northern Ireland; DS3 System Services: Portfolio Capability Analysis, Technical Report. 2012. Available online: http://www.eirgridgroup.com/site-files/library/EirGrid/System-Services-Consultation-New-Products-and-Contractual-Arrangements-June_2012.pdf (accessed on 30 July 2020).
- Zhang, Y.; Duan, Z.; Liu, X. Comparison of Grid Code Requirements with Wind Turbine in China and Europe. In Proceedings of the 2010 Asia-Pacific Power and Energy Engineering Conference, Chengdu, China, 28–31 March 2010. [Google Scholar]
- Demoulias, C.; Gkavanoudis, S.; Mauricio, J.M.; Gallos, K.; Dikaiakos, C.; Mushtaq, U.; Cvetkovic, M.; Schneider, C. D2.1 Description of Metrics Developed with Respect to Transient and Dynamic Response and Report on the Review of the Respective Current Grid Codes, EASY-RES, H2020 EU Project. 2018. Available online: https://cordis.europa.eu/project/rcn/213757/results/en (accessed on 5 August 2020).
- Puerto Rico Public Private Partnerships Authority, Request for Qualifications for the Puerto Rico Electric Power Authority Utility Scale Energy Storage System Project, Technical Report. PREPA; 2018. Available online: http://www.p3.pr.gov/assets/rfq-energy-project-june-2018.pdf (accessed on 15 July 2020).
- Sato, D.; Saitoh, H. Smoothing Control of Wind Farm Output by Using Kinetic Energy of Variable Speed Wind Power Generators. IJTPE 2009, 129, 580–590. [Google Scholar]
- Sakamoto, R.; Senjyu, T.; Kaneko, T.; Urasaki, N.; Takagi, T.; Sugimoto, S. Output power levelling of wind turbine generator by pitch angle controller using H-infinity control. Electr. Eng. Jpn. 2008, 162, 45–57. [Google Scholar] [CrossRef]
- Gkavanoudis, S.I.; Demoulias, C.S. A combined fault ride-through and power smoothing control method for full-converter wind turbines employing Supercapacitor Energy Storage System. Electr. Power Syst. Res. 2014, 106, 62–72. [Google Scholar] [CrossRef]
- Pegueroles-Queralt, J.; Bianchi, F.D.; Gomis-Bellmunt, O. A Power Smoothing System Based on Supercapacitors for Renewable Distributed Generation. IEEE Trans. Ind. Electron. 2015, 62, 343–350. [Google Scholar] [CrossRef]
- Ellis, A.; Schoenwald, D.; Hawkins, J.; Willard, S.; Arellano, B. PV Output Smoothing with Energy Storage. In Proceedings of the 2012 38th IEEE Photovoltaic Specialists Conference, Austin, TX, USA, 3–8 June 2012; pp. 001523–001528. [Google Scholar]
- Marcos, J.; de la Parra, I.; García, M.; Marroyo, L. Control strategies to smooth short-term power fluctuations in large photovoltaic plants using battery storage systems. Energies 2014, 7, 6593–6619. [Google Scholar] [CrossRef]
- Cabrera-Tobar, A.; Bullich-Massagué, E.; Aragüés-Peñalba, M.; Gomis-Bellmunt, O. Review of advanced grid requirements for the integration of large scale photovoltaic power plants in the transmission system. Renew. Sustain. Energy Rev. 2016, 62, 971–987. [Google Scholar] [CrossRef]
- Oureilidis, K.; Demoulias, C.; Ramos, J.L.M.; Vargas, A.A.; Machado, F.C.; Gallos, K.; Dikaiakos, C.; Jerele, M.; Littwitz, E.; Schneider, C. D5.2 Report Presenting the Portfolio of Ancillary Services, EASY-RES, H2020 EU Project. 2019. Available online: https://cordis.europa.eu/project/rcn/213757/results/en (accessed on 2 August 2020).
- Masih-Tehrani, M.; Ha’iri Yazdi, M.R.; Esfahanian, V.; Dahmardeh, M.; Nehzati, H. Wavelet-based power management for hybrid energy storage system. J. Mod. Power Syst. Clean Energy 2019, 7, 779–790. [Google Scholar] [CrossRef]
- Ramos, J.L.M.; Machado, F.C.; Soto, J.Z.; Oureilidis, K.; Mushtaq, U.; Kühn, R.; Khazem, Y.; Schneider, C. D5.3 First Report Presenting the Cost-Functions for the Ancillary Services, EASY-RES, H2020 EU Project. 2019. Available online: https://cordis.europa.eu/project/rcn/213757/results/en (accessed on 1 August 2020).
- Keiner, D.; Ram, M.; Barbosa, L.S.N.S.; Bogdanov, D.; Breyer, C. Cost optimal self-consumption of PV prosumers with stationary batteries, heat pumps, thermal energy storage and electric vehicles across the world up to 2050. Solar Energy 2019, 185, 406–423. [Google Scholar] [CrossRef]
- ENTSO-E. Need for Synthetic Inertia (SI) for Frequency Regulation. In ENTSO-E Guidance Document for National Implementation for Network Codes on Grid Connection; 2017; Available online: https://consultations.entsoe.eu/system-development/entso-e-connection-codes-implementation-guidance-d-3/user_uploads/igd-need-for-synthetic-inertia.pdf (accessed on 1 July 2020).
- Bevrani, H.; Ise, T.; Miura, Y. Virtual synchronous generators: A survey and new perspectives. Int. J. Elect. Power Energy Syst. 2014, 54, 244–254. [Google Scholar] [CrossRef]
- Tamrakar, U.; Shrestha, D.; Maharjan, M.; Bhattarai, B.P.; Hansen, T.M.; Tonkoski, R. Virtual inertia: Current trends and future directions. Appl. Sci. 2017, 7, 654. [Google Scholar] [CrossRef]
- Tan, S.; Geng, H.; Yang, G.; Wang, H.; Blaabjerg, F. Modeling framework of voltage-source converters based on equivalence with synchronous generator. J. Mod. Power Syst. Clean Energy 2018, 6, 1291–1305. [Google Scholar] [CrossRef]
- Arani, M.F.M.; El-Saadany, E.F. Implementing Virtual Inertia in DFIG-Based Wind Power Generation. IEEE Trans. Power Syst. 2013, 28, 1373–1384. [Google Scholar] [CrossRef]
- Chang-Chien, L.R.; Lin, W.T.; Yin, Y.C. Enhancing Frequency Response Control by DFIGs in the High Wind Penetrated Power Systems. IEEE Trans. Power Syst. 2011, 26, 710–718. [Google Scholar] [CrossRef]
- Wang, S.; Hu, J.; Yuan, X.; Sun, L. On Inertial Dynamics of Virtual-Synchronous-Controlled DFIG-Based Wind Turbines. IEEE Trans. Energy Convers. 2015, 30, 1691–1702. [Google Scholar] [CrossRef]
- Yan, R.; Saha, T.K. Frequency response estimation method for high wind penetration considering wind turbine frequency support functions. IET Renew. Power Gener. 2015, 9, 775–782. [Google Scholar] [CrossRef]
- Fairley, P. Can Synthetic Inertia from Wind Power Stabilize Grids? IEEE Spectrum. 2016. Available online: https://spectrum.ieee.org/energywise/energy/renewables/can-synthetic-inertia-stabilize-power-grids (accessed on 13 July 2020).
- Senvion Wind Turbines—Product Catalogue. Available online: https://www.senvion.com/global/en/products-services/wind-turbines/ (accessed on 18 July 2020).
- ENERCON Wind Turbines—Product Catalogue. Available online: https://www.enercon.de/en/home/ (accessed on 23 July 2020).
- Miller, N.; Clark, K.; Walling, R. WindINERTIA: Controlled Inertial Response from GE Wind Turbine Generators. In Proceedings of the 45th Annual Minnesota Power Systems Conference, Minneapolis, MN, USA, 3–5 November 2009. [Google Scholar]
- Kroposki, B.; Johnson, B.; Zhang, Y.; Gevorgian, V.; Denholm, P.; Hodge, B.-M.; Hannegan, B. Achieving a 100% Renewable Grid: Operating Electric Power Systems with Extremely High Levels of Variable Renewable Energy. IEEE Power Energy Mag. 2017, 15, 61–73. [Google Scholar] [CrossRef]
- Miller, N.W.; Shao, M.; Venkataraman, S. California ISO (CAISO) Frequency Response Study. 2011. Available online: https://www.caiso.com/Documents/Report-FrequencyResponseStudy.pdf (accessed on 24 July 2020).
- Miller, N.W.; Clark, K.; Shao, M. Frequency responsive wind plant controls: Impacts on grid performance. In Proceedings of the 2011 IEEE Power and Energy Society General Meeting, Detroit, MI, USA, 24–28 July 2011; IEEE: San Diego, CA, USA, 2011; pp. 1–8. [Google Scholar]
- Kovaltchouk, T.; Ben Ahmed, H.; Multon, B.; Aubry, J.; Venet, P. An aging-aware life cycle cost comparison between supercapacitors and Li-ion batteries to smooth Direct Wave Energy Converter production. In Proceedings of the 2015 IEEE Eindhoven PowerTech, Eindhoven, The Netherlands, 29 June–2 July 2015; pp. 1–6. [Google Scholar]
- Gaetani-Liseo, M.; Alonso, C.; Jammes, B. Impacts of supercapacitors on battery lifetime in hybrid energy storage system in building integrated photovoltaic DC micro-grid. In Proceedings of the 2018 7th International Conference on Renewable Energy Research and Applications (ICRERA), Paris, France, 14–17 October 2018; pp. 1247–1252. [Google Scholar]
- IRENA. Renewable Power Generation Costs in 2019, International Renewable Energy Agency, Technical Report. 2020. Available online: https://www.irena.org/-/media/Files/IRENA/Agency/Publication/2020/Jun/IRENA_Power_Generation_Costs_2019.pdf (accessed on 22 July 2020).
- Saiz-Marin, E.; Garcia-Gonzalez, J.; Barquin, J.; Lobato, E. Economic Assessment of the Participation of Wind Generation in the Secondary Regulation Market. IEEE Trans. Power Syst. 2012, 27, 866–874. [Google Scholar] [CrossRef]
- Kirby, B.; Milligan, M.; Ela, E. Providing Minute-To-Minute Regulation from Wind Plants. In Proceedings of the 9th Annual International Workshop on Large-Scale Integration of Wind Power into Power Systems; and Transmission Networks for Offshore Wind Power Plant, Québec, QC, Canada, 18–19 October 2010. [Google Scholar]
- Ela, E.; Gevorgian, V.; Fleming, P.; Zhang, Y.C.; Singh, M.; Muljadi, E.; Scholbrook, A. Active Power Controls from Wind Power: Bridging the Gaps. NREL Technical Report. Golden, Colorado; 2014. Available online: https://www.nrel.gov/docs/fy14osti/60574.pdf (accessed on 15 July 2020).
- Ocker, F.; Ehrhart, K.-M. The “German Paradox” in the balancing power markets. Renew. Sustain. Energy Rev. 2017, 67, 892–898. [Google Scholar] [CrossRef]
- Gevorgian, V.; Zhang, Y.; Ela, E. Investigating the Impacts of Wind Generation Participation in Interconnection Frequency Response. IEEE Trans. Sustain. Energy 2015, 6, 1004–1012. [Google Scholar] [CrossRef]
- Xavier, L.S.; Cupertino, A.F.; Pereira, H.A. Ancillary services provided by photovoltaic inverters: Single and three phase control strategies. Comput. Electr. Eng. 2018, 70, 102–121. [Google Scholar] [CrossRef]
- Coppo, M.; Raciti, A.; Caldon, R.; Turri, R. Exploiting inverter-interfaced DG for Voltage unbalance mitigation and ancillary services in distribution systems. In Proceedings of the 2015 IEEE 1st International Forum on Research and Technologies for Society and Industry Leveraging a better tomorrow (RTSI), Turin, Italy, 16–18 September 2015; pp. 371–376. [Google Scholar]
- Alsokhiry, F.; Lo, K.L. Provision of reactive power support ancillary services from distributed generation based on renewable energy. In Proceedings of the 2013 International Conference on Renewable Energy Research and Applications (ICRERA), Madrid, Spain, 20–23 October 2013; pp. 1018–1023. [Google Scholar]
- Kim, Y.J.; Kirtley, J.L.; Norford, L.K. Reactive Power Ancillary Service of Synchronous DGs in Coordination With Voltage Control Devices. IEEE Trans. Smart Grid 2017, 8, 515–527. [Google Scholar] [CrossRef]
- Farag, H.E.Z.; El-Saadany, E.F. A Novel Cooperative Protocol for Distributed Voltage Control in Active Distribution Systems. IEEE Trans. Power Syst. 2013, 28, 1645–1656. [Google Scholar] [CrossRef]
- Calderaro, V.; Galdi, V.; Lamberti, F.A. Piccolo; A Smart Strategy for Voltage Control Ancillary Service in Distribution Networks. IEEE Trans. Power Syst. 2015, 30, 494–502. [Google Scholar] [CrossRef]
- Vaccaro, A.; Velotto, G.; Zobaa, A.F. A Decentralized and Cooperative Architecture for Optimal Voltage Regulation in Smart Grids. IEEE Trans. Ind. Electron. 2011, 58, 4593–4602. [Google Scholar] [CrossRef]
- Robbins, B.A.; Hadjicostis, C.N.; Domínguez-García, A.D. A Two-Stage Distributed Architecture for Voltage Control in Power Distribution Systems. IEEE Trans. Power Syst. 2013, 28, 1470–1482. [Google Scholar] [CrossRef]
- Kryonidis, G.C.; Demoulias, C.S.; Papagiannis, G.K. A Two-Stage Solution to the Bi-Objective Optimal Voltage Regulation Problem. IEEE Trans. Sustain. Energy 2019, 11, 928–937. [Google Scholar] [CrossRef]
- Technische und organisatorische Regeln für Betreiber und Benutzer von Netzen, Teil D: Besondere technische Regeln—Hauptabschnitt D4: Parallelbetrieb von Erzeugungsanlagen mit Verteilernetzen, TOR-D4, Version 2.3; Energie-Control Austria, Wien. 2016. Available online: https://www.pvaustria.at/wp-content/uploads/TOR-D4.pdf (accessed on 12 October 2020).
- Kryonidis, G.C.; Demoulias, C.S.; Papagiannis, G.K. A Nearly Decentralized Voltage Regulation Algorithm for Loss Minimization in Radial MV Networks With High DG Penetration. IEEE Trans. Sustain. Energy 2016, 7, 1430–1439. [Google Scholar] [CrossRef]
- IEEE Standard Definitions for the Measurement of Electric Power Quantities under Sinusoidal, Nonsinusoidal, Balanced, or Unbalanced Conditions; 1459TM-2010; IEEE Std.: Piscataway, NJ, USA, 2010.
- Berrisford, A.J. A Smarter Meter: IEEE-1459 power definitions in an off-the-shelf Smart Meter. In Proceedings of the 2015 IEEE International Instrumentation and Measurement Technology Conference (I2MTC) Proceedings, Pisa, Italy, 11–14 May 2015; pp. 830–835. [Google Scholar]
- Arenas, L.D.O.; Melo, G.A.; Canesin, C.A. FPGA-based power meter implementation for three-phase three-wire and four-wire power systems, according to IEEE 1459-2010 standard. In Proceedings of the 2017 Brazilian Power Electronics Conference (COBEP), Juiz de Fora, Brazil, 19–22 November 2017; pp. 1–6. [Google Scholar]
- Rens, J.; van Rooyen, T.; de Jager, F. Where is the power of the IEEE 1459-2010? In Proceedings of the 2014 IEEE International Workshop on Applied Measurements for Power Systems Proceedings (AMPS), Aachen, Germany, 24–26 September 2014; pp. 1–6. [Google Scholar]
- Akagi, H.; Watanabe, E.H.; Aredes, M. Electric Power Definitions: Background. In Instantaneous Power Theory and Applications to Power Conditioning; IEEE: Piscataway, NJ, USA, 2017; pp. 17–37. [Google Scholar]
- Bollen, M.H.; Gu, I.Y.H. Signal Processing of Power Quality Disturbances; Wiley: New York, NY, USA, 2007. [Google Scholar]
- IEC 61000-4-7 Standard: Electromagnetic compatibility (EMC)–Part 4–7: Testing and Measurement Techniques—General Guide on Harmonics and Interharmonics Measurements and Instrumentation, for Power Supply Systems and Equipment Connected Thereto. Edition 2.1. 2009. Available online: https://webstore.iec.ch/preview/info_iec61000-4-7%7Bed2.0%7Den_d.pdf (accessed on 22 September 2020).
- Kauhaniemi, K.; Kumpulainen, L. Impact of distributed generation on the protection of distribution networks. In Proceedings of the 2004 Eighth IEE International Conference on Developments in Power System Protection, Amsterdam, The Netherlands, 5–8 April 2004; pp. 315–318. [Google Scholar]
- Koumba, P.M.; Cheriti, A.; Doumbia, M.L. Impacts of distribution generation on the coordination of protective devices in distribution network. In Proceedings of the 2015 IEEE 28th Canadian Conference on Electrical and Computer Engineering (CCECE), Halifax, NS, Canada, 3–6 May 2015; pp. 460–465. [Google Scholar]
- Haron, A.R.; Mohamed, A.; Shareef, H.; Zayandehroodi, H. Analysis and solutions of overcurrent protection issues in a microgrid. In Proceedings of the 2012 IEEE International Conference on Power and Energy (PECon), Kota Kinabalu, Malaysia, 2–5 December 2012; pp. 644–649. [Google Scholar]
- Telukunta, V.; Pradhan, J.; Agrawal, A.; Singh, M.; Srivani, S.G. Protection challenges under bulk penetration of renewable energy resources in power systems: A review. CSEE J. Power Energy Syst. 2017, 3, 365–379. [Google Scholar] [CrossRef]
- Driesen, J.; Vermeyen, P.; Belmans, R. Protection issues in microgrids with multiple distributed generation units. In Proceedings of the 2007 Power Conversion Conference—Nagoya, Nagoya, Japan, 2–5 April 2007; pp. 646–653. [Google Scholar]
- Yazdanpanahi, H.; Li, Y.W.; Xu, W. A New Control Strategy to Mitigate the Impact of Inverter-Based DGs on Protection System. IEEE Trans. Smart Grid 2012, 3, 1427–1436. [Google Scholar] [CrossRef]
- Jing, M.; Jinlong, L.; Zengping, W. An adaptive distance protection scheme for distribution system with distributed generation. In Proceedings of the 2010 5th International Conference on Critical Infrastructure (CRIS), Beijing, China, 20–22 September 2010; pp. 1–4. [Google Scholar]
- Sortomme, E.; Venkata, S.S.; Mitra, J. Microgrid Protection Using Communication-Assisted Digital Relays. IEEE Trans. Power Deliv. 2010, 25, 2789–2796. [Google Scholar] [CrossRef]
- Dambhare, S.; Soman, S.A.; Chandorkar, M.C. Adaptive Current Differential Protection Schemes for Transmission-Line Protection. IEEE Trans. Power Deliv. 2009, 24, 1832–1841. [Google Scholar] [CrossRef]
- Jones, D.; Kumm, J.J. Future Distribution Feeder Protection Using Directional Overcurrent Elements. IEEE Trans. Ind. Appl. 2014, 50, 1385–1390. [Google Scholar] [CrossRef]
- Zhang, Y.; Dougal, R.A. Novel Dual-FCL Connection for Adding Distributed Generation to a Power Distribution Utility. IEEE Trans. Applied Supercond. 2011, 21, 2179–2183. [Google Scholar] [CrossRef]
- Ghanbari, T.; Farjah, E. Development of an Efficient Solid-State Fault Current Limiter for Microgrid. IEEE Trans. Power Deliv. 2012, 27, 1829–1834. [Google Scholar] [CrossRef]
- Nimpitiwan, N.; Heydt, G.T.; Ayyanar, R.; Suryanarayanan, S. Fault Current Contribution From Synchronous Machine and Inverter Based Distributed Generators. IEEE Trans. Power Deliv. 2007, 22, 634–641. [Google Scholar] [CrossRef]
- Buigues, G.; Dysko, A.; Valverde, V.; Zamora, I.; Fernández, E. Microgrid protection: Technical challenges and existing techniques. In Proceedings of the International Conference on Renewable Energies and Power Quality, Bilbao, Spain, 20–22 March 2013; pp. 222–227. [Google Scholar]
- Che, L.; Khodayar, M.E.; Shahidehpour, M. Adaptive Protection System for Microgrids: Protection practices of a functional microgrid system. IEEE Electrif. Mag. 2014, 2, 66–80. [Google Scholar] [CrossRef]
- Casagrande, E.; Woon, W.L.; Zeineldin, H.H.; Svetinovic, D. A Differential Sequence Component Protection Scheme for Microgrids With Inverter-Based Distributed Generators. IEEE Trans. Smart Grid 2014, 5, 29–37. [Google Scholar] [CrossRef]
- Zadeh, H.K. An ANN-Based High Impedance Fault Detection Scheme: Design and Implementation. Int. J. Emerg. Electr. Power Syst. 2005. [Google Scholar] [CrossRef]
- Oureilidis, K.O.; Demoulias, C.S. A Fault Clearing Method in Converter-Dominated Microgrids With Conventional Protection Means. IEEE Trans. Power Electron. 2016, 31, 4628–4640. [Google Scholar] [CrossRef]
- Gkavanoudis, S.; Oureilidis, K.; Kryonidis, G.; Mauricio, J.M.; Mushtaq, U.; Cvetkovic, M.; Marano, A.; Jerele, M. D3.1 Report on the Work done in T3.1 (Development of Metrics for Contribution to Fault Clearing and FRT of DRES/BESS), EASY-RES, H2020 EU Project. 2018. Available online: https://cordis.europa.eu/project/rcn/213757/results/en (accessed on 5 August 2020).
- Malamaki, K.-N.; Mushtaq, U.; Cvetkovic, M. D1.2 Report on the Definition of the Converter Reactive Power Capability, EASY-RES, H2020 EU Project. 2019. Available online: https://cordis.europa.eu/project/rcn/213757/results/en (accessed on 4 August 2020).
- Chidurala, A.; Saha, T.K.; Mithulananthan, N. Harmonic impact of high penetration photovoltaic system on unbalanced distribution networks—Learning from an urban photovoltaic network. IET Renew. Power Gener. 2016, 10, 485–494. [Google Scholar] [CrossRef]
- Ismael, S.M.; Aleem, S.H.E.A.; Abdelaziz, A.Y.; Zobaa, A.F. State-of-the-art of hosting capacity in modern power systems with distributed generation. Renew. Energy 2019, 130, 1002–1020. [Google Scholar] [CrossRef]
- Sakar, S.; Balci, M.E.; Aleem, S.H.E.A.; Zobaa, A.F. Increasing PV hosting capacity in distorted distribution systems using passive harmonic filtering. Electr. Power Syst. Res. 2017, 148, 74–86. [Google Scholar] [CrossRef]
- Sakar, S.; Balci, M.E.; Aleem, S.H.E.A.; Zobaa, A.F. Integration of large-scale PV plants in non-sinusoidal environments: Considerations on hosting capacity and harmonic distortion limits. Renew. Sustain. Energy Rev. 2018, 82, 176–186. [Google Scholar] [CrossRef]
- Liang, X.; Karim, C.A.-B. Harmonics and Mitigation Techniques Through Advanced Control in Grid-Connected Renewable Energy Sources: A Review. IEEE Trans. Ind. Appl. 2018, 54, 3100–3111. [Google Scholar] [CrossRef]
- International Electrotechnical Commission. Electromagnetic Compatibility (EMC)—Part 4–30: Testing and Measurement Techniques–Power Quality Measurement Methods; IEC 61000-4-30; International Electrotechnical Commission: Geneva, Switzerland, 2015. [Google Scholar]
- Nozal, Á.R.; Kontis, E.O.; Mauricio, J.M.; Demoulias, C.S. Provision of Inertial Response as Ancillary Service from Active Distribution Networks to the Transmission System. IET Gener. Transm. Distrib. 2020. Available online: https://digital-library.theiet.org/content/journals/10.1049/iet-gtd.2020.0675 (accessed on 5 October 2020).
- Tragianni, S.D.; Oureilidis, K.O.; Demoulias, C.S. Supercapacitor sizing based on comparative study of PV power smoothing methods. In Proceedings of the 2017 52nd International Universities Power Engineering Conference (UPEC), Heraklion, Greece, 28–31 August 2017; pp. 1–6. [Google Scholar]
© 2020 by the authors. Licensee MDPI, Basel, Switzerland. This article is an open access article distributed under the terms and conditions of the Creative Commons Attribution (CC BY) license (http://creativecommons.org/licenses/by/4.0/).