Article

Ductile Fracture Behavior of Mild and High-Tensile Strength Shipbuilding Steels

Department of Naval Architecture and Ocean Engineering, Inha University, Incheon 22212, Korea
*
Author to whom correspondence should be addressed.
Appl. Sci. 2020, 10(20), 7034; https://doi.org/10.3390/app10207034
Submission received: 15 September 2020 / Revised: 29 September 2020 / Accepted: 30 September 2020 / Published: 10 October 2020
(This article belongs to the Special Issue Ductile and Brittle Fractures in Metals)

Abstract

:
A comparison is made of the ductility limits of one mild (normal) and two high-tensile strength shipbuilding steels with an emphasis on stress state and loading path dependency. To describe the ductile fracture behavior of the considered steels accurately, an alternative form of ductile fracture prediction model is presented and calibrated. The present fracture model combines the normalized Cockcroft–Latham and maximum shear stress criterion, and is dependent on both stress triaxiality and Lode angle parameter. The calibrations indicate that, depending on the hardening characteristics of the steels, ductile fracture behavior differs considerably with stress state. It is demonstrated that the adopted fracture model is able to predict the ductile fracture initiation in various test specimens with good accuracy and is flexible in addressing the observed differences in the ductile fracture behavior of the considered steel grades.

1. Introduction

Ductile fracture resistance is an important structural performance requirement for the steel components of naval structures. As discussed by Matic et al. [1], computational tools are capable of implementing a range of elastic–plastic constitutive relations and ductile fracture initiation models for analyzing the structural problems relevant to ship steels that involve considerable strain beyond moderate plasticity, such as an analysis of the plastic zone ahead of the crack tip and, on a larger scale, the plasticity generated due to forming [2,3] or extreme loads. Therefore, there is a demand for ductile fracture models that can be calibrated and implemented easily in finite element analysis but represent the micro-mechanisms of the failure process as accurately as possible.
Fracture initiation in ductile metals depends strongly on the stress state. Earlier studies on micro-void-based fracture mechanisms highlighted the role of the hydrostatic pressure (or the first invariant of the stress tensor) on void growth [4,5]. Experiments on notched round bars have been conducted to achieve a range of axisymmetric tension stress states. The failure initiation results have been correlated through stress triaxiality (hydrostatic stress normalized with equivalent von Mises stress) and equivalent plastic strain [6,7], and micro-mechanism based models by McClintock [4] and Rice and Tracey [5] have been verified, particularly for high-stress triaxialities. A parallel development is the porous plasticity model by Gurson [8], which was later enhanced by Tvergaard [9], and Tvergaard and Needleman [10]. Porous plasticity models incorporate the void volume fraction into the constitutive behavior of the material, which evolves with void nucleation, growth, and coalescence mechanisms in a phenomenological manner [10].
On the other hand, Johnson and Cook [11] proposed a purely empirical model using a stress triaxiality sensitivity factor similar to the Rice and Tracey model and included the strain rate effect and thermal softening terms in a multiplicative format. Cockcroft and Latham [12] proposed an alternative model based on the maximum principal tensile stress to predict fracture initiation in bulk metal forming at a low and negative stress triaxiality. Oh et al. [13] modified the Cockcroft–Latham (CL) model slightly by normalizing the maximum principal tensile stress with the von Mises equivalent stress. CL model incorporates both the hydrostatic pressure (stress triaxiality) sensitivity and the deviatoric stress state sensitivity (so-called Lode angle sensitivity) in an implicit manner.
Xue [14], who first interpreted the experimental results of Bao and Wierzbicki [15] correctly, reported the strong dependence of ductile fracture on the deviatoric stress state or the third invariant of the deviatoric stress tensor, i.e., the tendency of one of the principal stresses to dominate over the other two. The test results by Bao and Wierzbicki [15] indicated that the equivalent plastic strain to fracture does not decrease monotonically with increasing stress triaxiality, particularly at a low stress triaxiality range bounded between pure shear and uniaxial tension, and between uniaxial tension and equi-biaxial tension. Xue [14] emphasized that a second measure of the stress state, which is the Lode parameter representing the third invariant of the deviatoric stress tensor, is needed to discriminate between axisymmetric and shear-dominated stress states. Some other test results, such as those by Barsoum and Faleskog [16] and Clausing [17], support Xue’s arguments. Consequently, Xue [18] proposed a damage plasticity model for ductile fracture, which is dependent on the hydrostatic pressure and the Lode angle. In addition, Xue [19] developed a Gurson-type model that included the void shearing mechanism because of the Lode angle effect. Based on these recent developments, a dozen empirical or phenomenological uncoupled ductile fracture models that incorporate the Lode angle effect and particularly address fracture due to shear-dominated stress states were proposed recently [20,21,22,23,24,25,26,27]. An important set of these models adopts a simple weighted product format, incorporating terms representing different micro-mechanisms of the ductile fracture initiation process.
A comparative of several popular fracture models was made by Park et al. [28] relating to the prediction accuracy for marine high-tensile strength steels. It was noted that the recent models incorporating Lode angle sensitivity explicitly outperformed the relatively old fracture models such as maximum shear stress criterion (MSS) and CL, yielding a very low error of calibration and high accuracy, especially in the shear-fracture-dominated regime. In addition, the recent models exhibit very similar fracture loci. Therefore, it was noted that the assumptions behind the models are of less importance as compared to the mathematical flexibility that can cover a wide range of stress states. The calibrations and applications of one of these advanced fracture models, namely the Hosford–Coulomb model, were presented by the present authors in a series of recent papers for marine structural steels and low-velocity impact problems [29,30,31,32,33,34,35,36]. On the other hand, despite their ease of calibration and good prediction capability for certain ranges of stress states, MSS and CL criteria lack mathematical flexibility, yielding high calibration errors in general. It was noted by Park et al. [28] that the extension of the CL model by combining it with MSS criterion may provide a flexible alternative format, as demonstrated by Gruben et al. [37].
This paper compares the ductility limits of mild and high-tensile strength shipbuilding steels using an uncoupled ductile fracture model, which is postulated by combining the normalized maximum shear stress and maximum principal tensile stress in a weighted sum format. A hybrid experimental–numerical approach is adopted to identify the hardening law and fracture model parameters for the steel grades considered. The predictive capabilities of the presented fracture model are evaluated for marine structural steels.

2. Ductile Fracture Model

2.1. Model Formulation

The preliminary information characterizing the stress state and adopted plasticity model is given in Appendix A. Following Gruben et al. [37], a ductile fracture model in association with non-porous plasticity is formulated by combining the normalized maximum shear stress criterion (MSS) and maximum principal tensile stress criterion (modified version of CL criterion by Oh et al. [13]) in a weighted sum format
C 1 τ m a x σ ¯ + 1 C 1 σ 1 σ ¯ C 2 ε ¯ p = C 3
where C 1 0 , 1 is the weighting factor between the normalized maximum principal tensile stress and the normalized maximum shear stress. C 2 is an exponent that represents the stress state-dependency of the ductility. C 3 is a constant that determines the overall ductility of the material. The operator used for the maximum principal stress, i.e., , is the Macaulay bracket, which yields zero for negative values. Using the transformation of stress states given in Equation (A11) the proposed fracture model can be expressed as follows
τ m a x σ ¯ = 1 3 cos π 6 θ ¯
σ 1 σ ¯ = 3 η + 2 cos π 6 1 θ ¯ 3
C 1 1 3 cos π 6 θ ¯ + 1 C 1 3 η + 2 cos π 6 1 θ ¯ 3 C 2 ε ¯ p = C 3
The fracture model can be expressed as the macroscopic equivalent plastic strain at the instant of first localization under strictly proportional loading paths as follows
ε ¯ f p r η , θ ¯ = C 3 C 1 1 3 cos π 6 θ ¯ + 1 C 1 3 η + 2 cos π 6 1 θ ¯ 3 C 2
For general cases, i.e., non-proportional loading paths, the fracture indicator framework is adopted. In this case, the strain to fracture under proportional loading serves as a stress-state-dependent weighting function. The fracture indicator, D 0 , 1 , is defined as an integration of the weighted equivalent plastic strain increment along the strain path as follows
d D = d ε ¯ p ε ¯ f p r η , θ ¯
Note that D is not coupled with the material’s elasto-plastic behavior, such that it does not cause any irreversible weakening (softening) with increasing plastic deformation. For finite element analysis of the implentation of the model in the software package Abaqus/Explicit, a user-defined material subroutine (VUMAT) is developed. The user subroutine adopts a standard return-mapping algorithm for plasticity calculations, where equivalent plastic strain increment is determined. Then, it is used in Equation (6) together with the proposed fracture model as the weighing factor to calculate the increment of fracture indicator. An element is assumed to have failed and deleted if all integration points satisfy the condition D = 1 .

2.2. Parameter Sensitivity

Before discussing the sensitivity of the fracture strain to model parameters, the dependencies of the model to the stress triaxiality and the Lode angle parameter need to be introduced. Figure 1 shows the equivalent plastic strain to fracture obtained using the proposed model with the parameters C 1 = 0.85 , C 2 = 2.0 , C 3 = 0.2 . Geometrically, the fracture locus is represented as a surface in the space of ( ε ¯ p , η , θ ¯ ) . The fracture locus is asymmetric with respect to the Lode angle parameter. However, its dependence on stress triaxiality is monotonic.
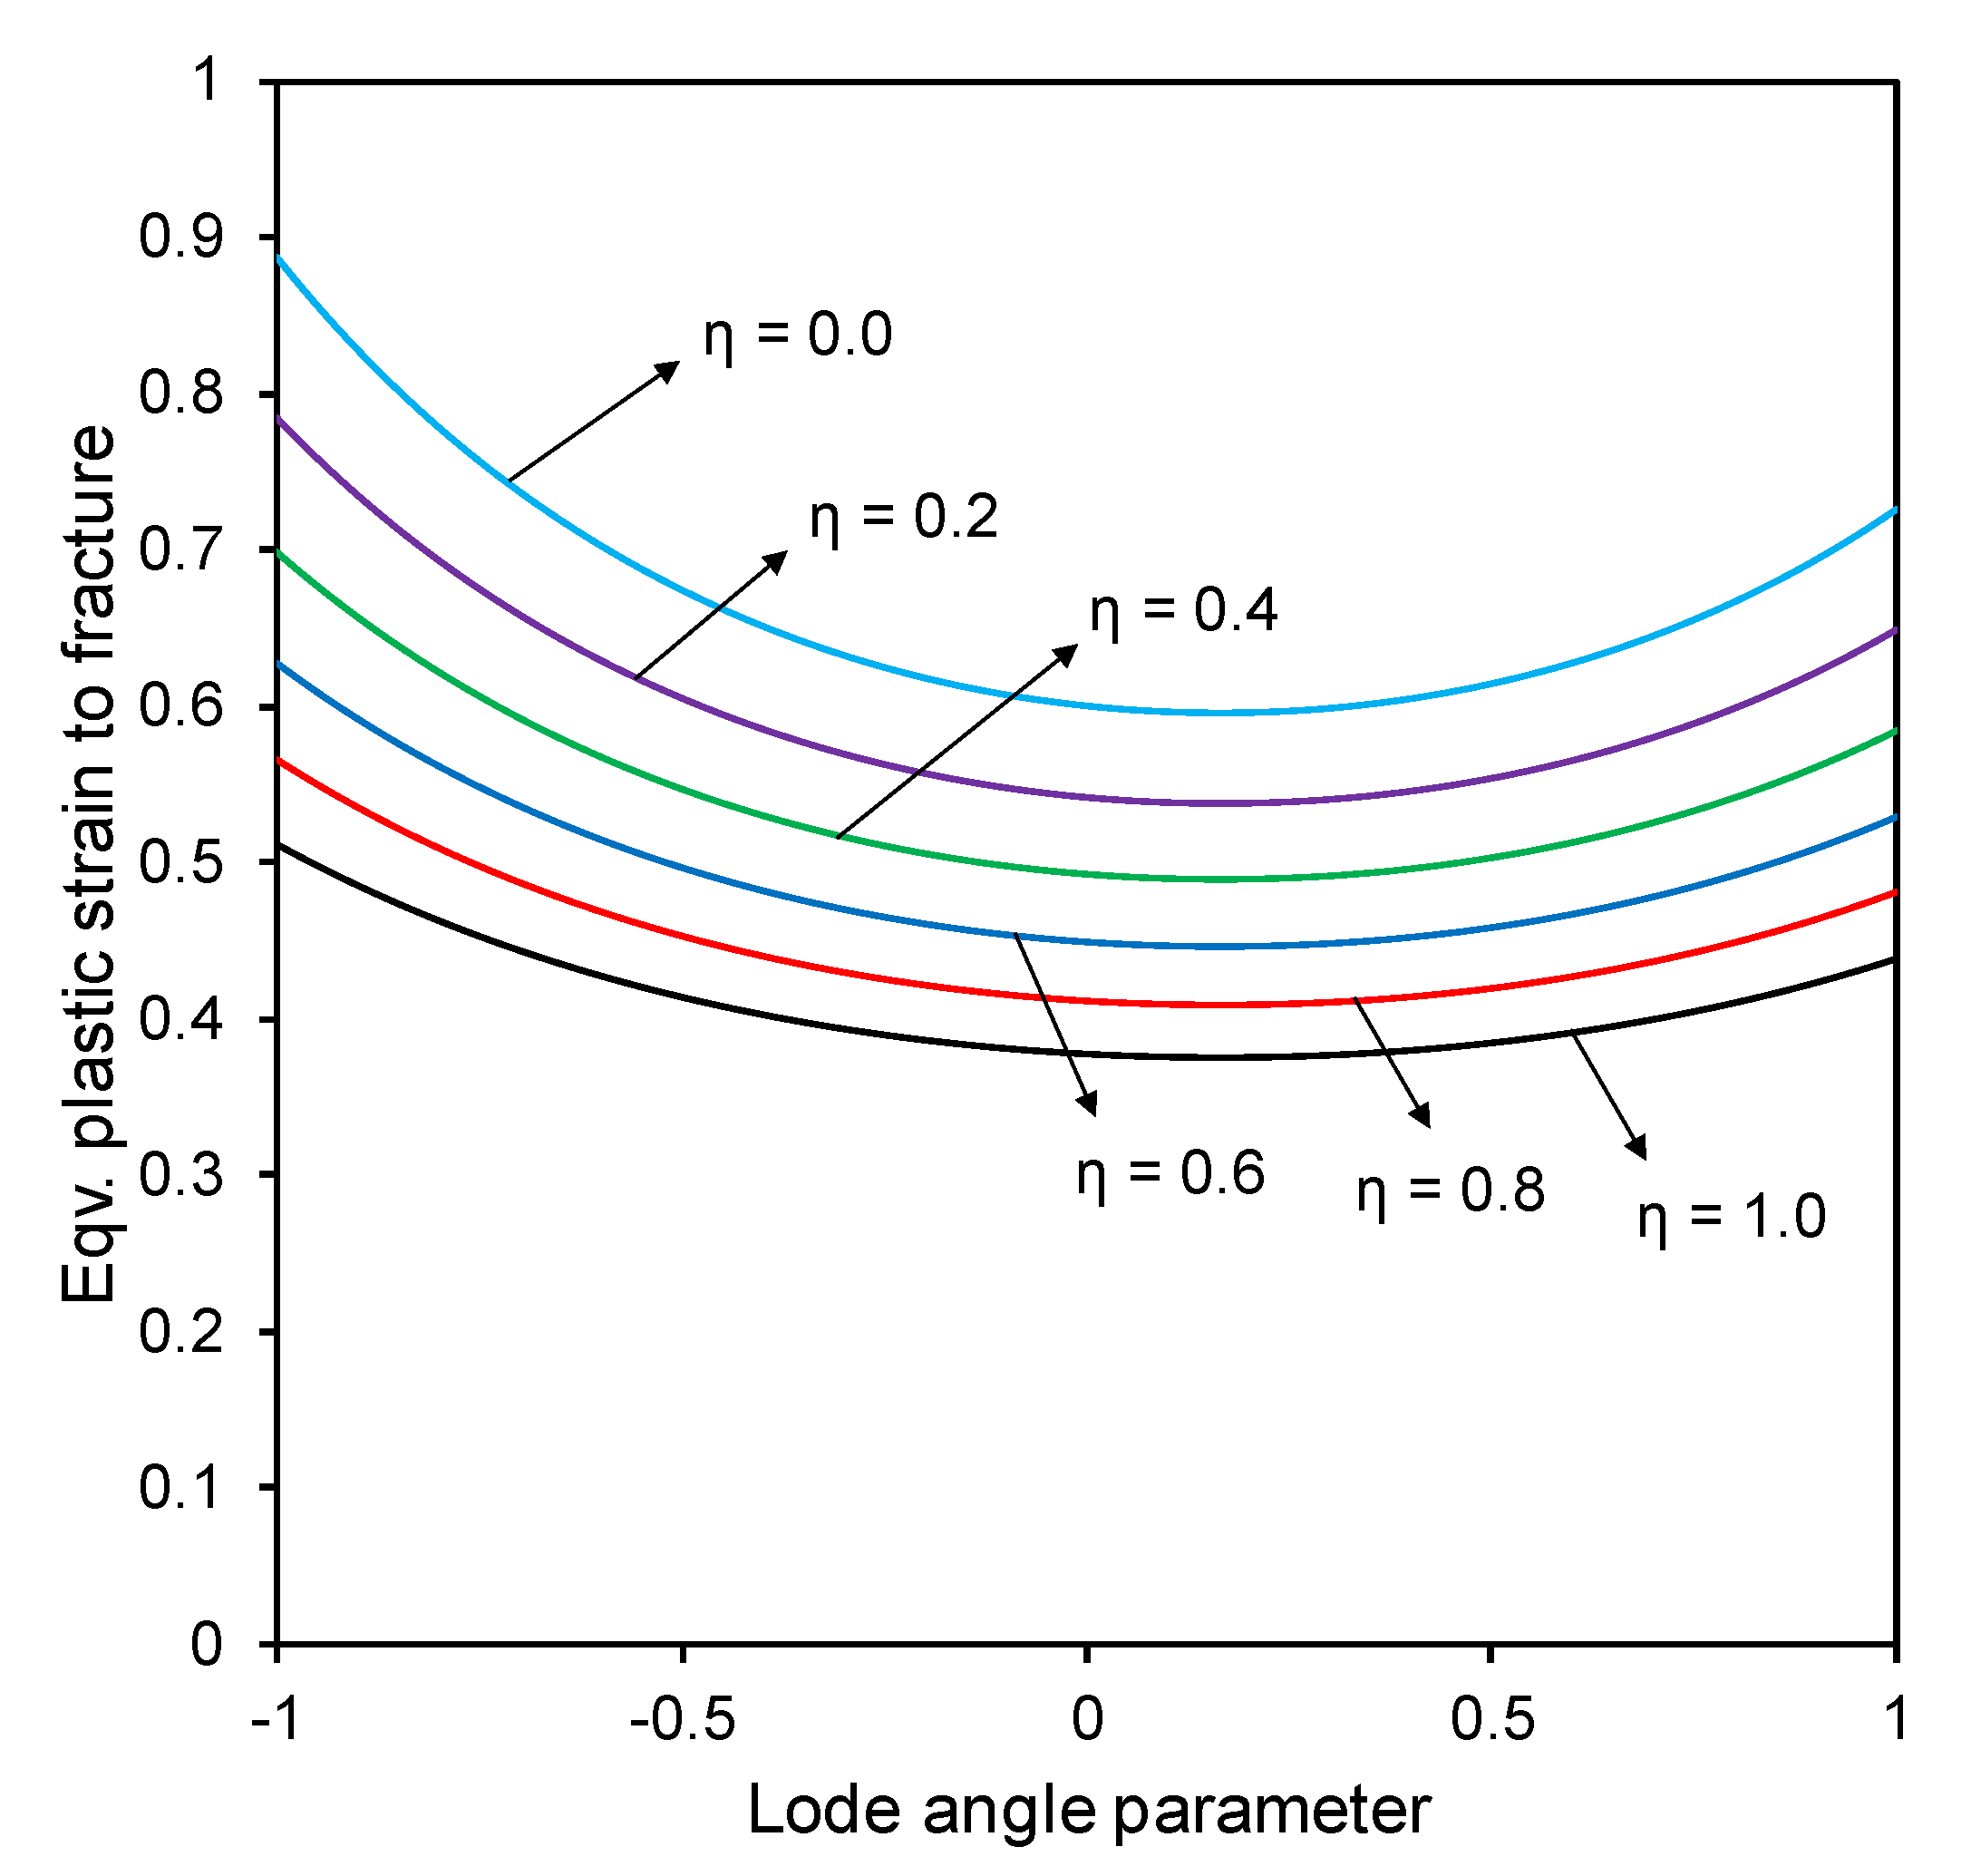
Figure 2 gives an example 2D plot of the fracture locus in the plane of ( ε ¯ p , η ) for several fixed values of the Lode angle parameter. The stress triaxiality dependence is a monotonically decreasing one, which is in agreement with the previous stress-triaxiality-dependent models [4,5,11]. At high stress triaxialities, the effects of the Lode angle vanish and all three curves converge to a single one. Figure 3 shows a 2D plot of the fracture locus in the plane ( ε ¯ p , θ ¯ ) for several fixed values of the stress triaxiality. The asymmetric nature of the Lode angle dependency is more evident in this figure. The Lode angle dependency explains the difference in ductility observed for axisymmetric tension-compression and generalized shear state states.
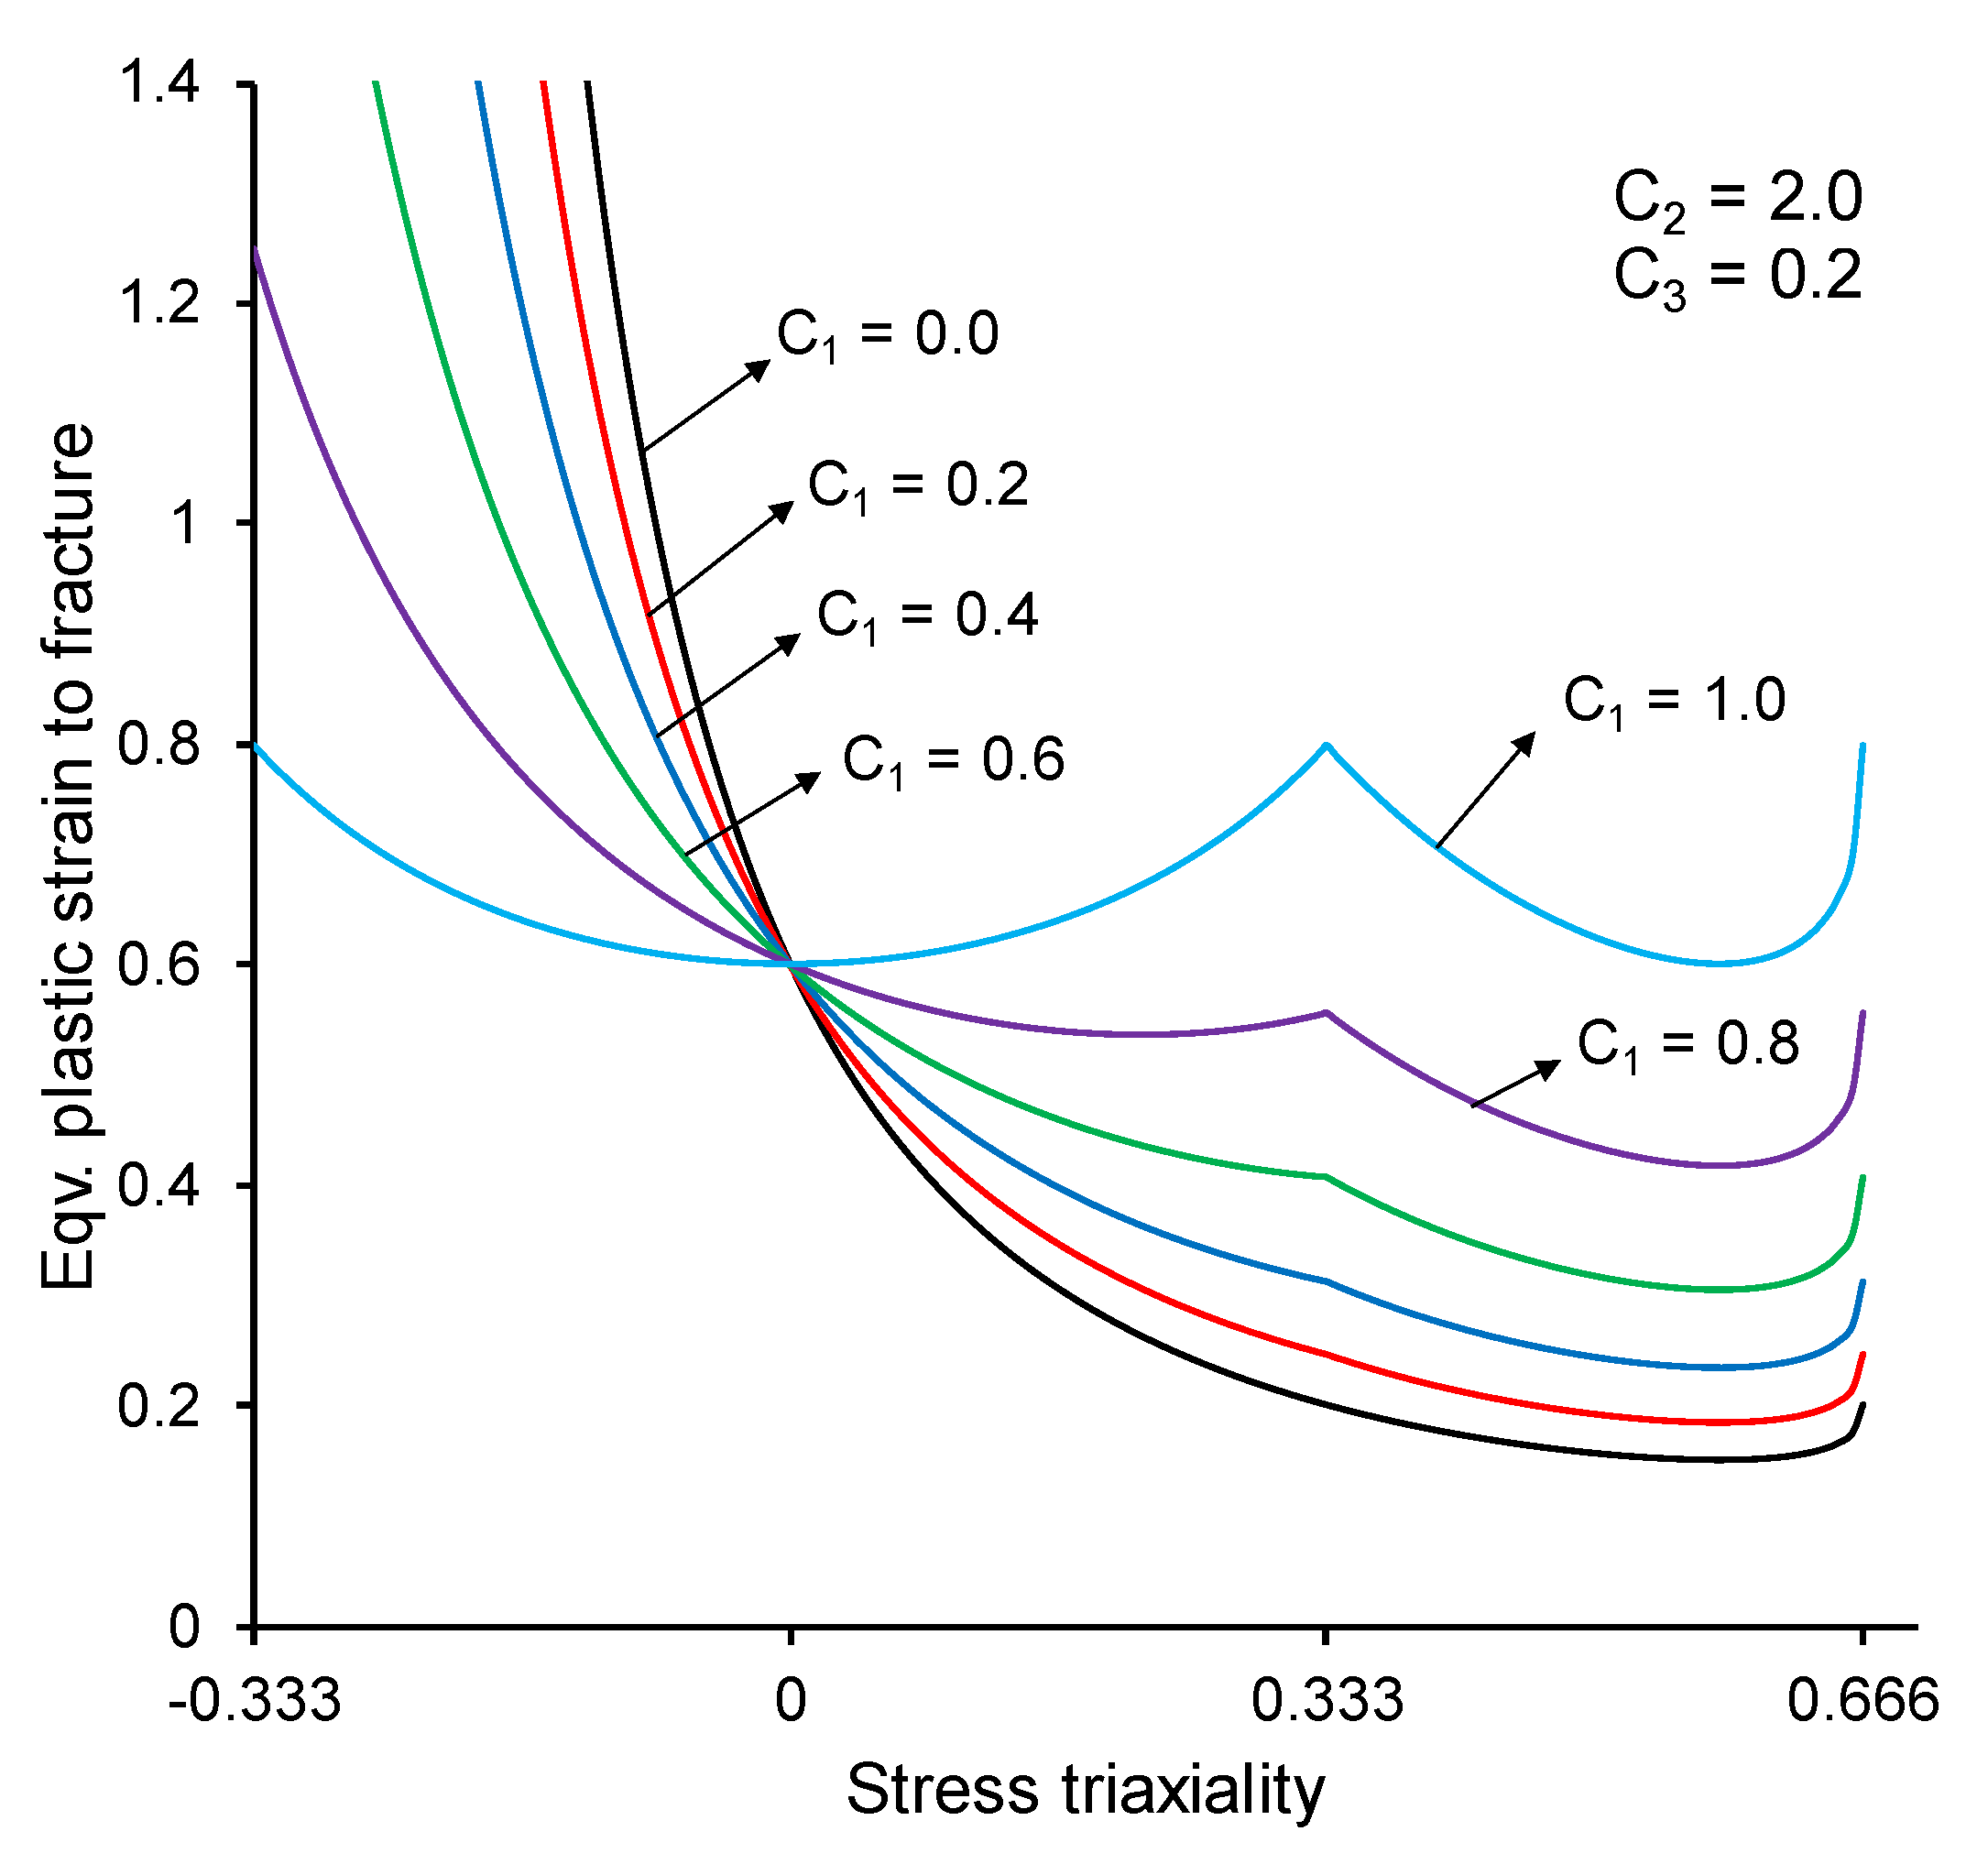
The parameter C 1 regulates the effects of the maximum shear stress and maximum principal tensile stress. For the limiting case of C 1 = 1 , the proposed model reduces to the normalized maximum shear-stress criterion, which is not stress-triaxiality-dependent. The other limiting case, C 1 = 0 , reduces the proposed model to the normalized CL criterion (the modified CL criterion proposed by [13]), in which case both the Lode angle- and stress triaxiality-dependencies are retained. Figure 4 presents several plots of the proposed fracture model under plane stress conditions considering several C 1 values. The parameter C 1 has no effect on the strain to fracture for in-plane shear ( η = 0 ) . Large C 1 values yield a fracture locus with a noticeable hump at uniaxial tension ( η = 1 / 3 ) and a plane strain tension ( η = 1 / 3 ) “valley”, i.e., a trough between uniaxial tension and equi-biaxial tension ( η = 2 / 3 ) . This effect is due mainly to the Lode angle dominance on the stress-state dependency of ductility. In addition, stress trixiality sensitivity decreases with increasing C 1 , as the maximum shear stress criterion dominates. Hence, C 1 plays an important in regulating the stress triaxiality and Lode angle competition. Moreover, a stress-triaxiality-dependent cut-off region value for each C 1 value is noticeable in Figure 4. Ductile fracture will not occur below the cut-off value.
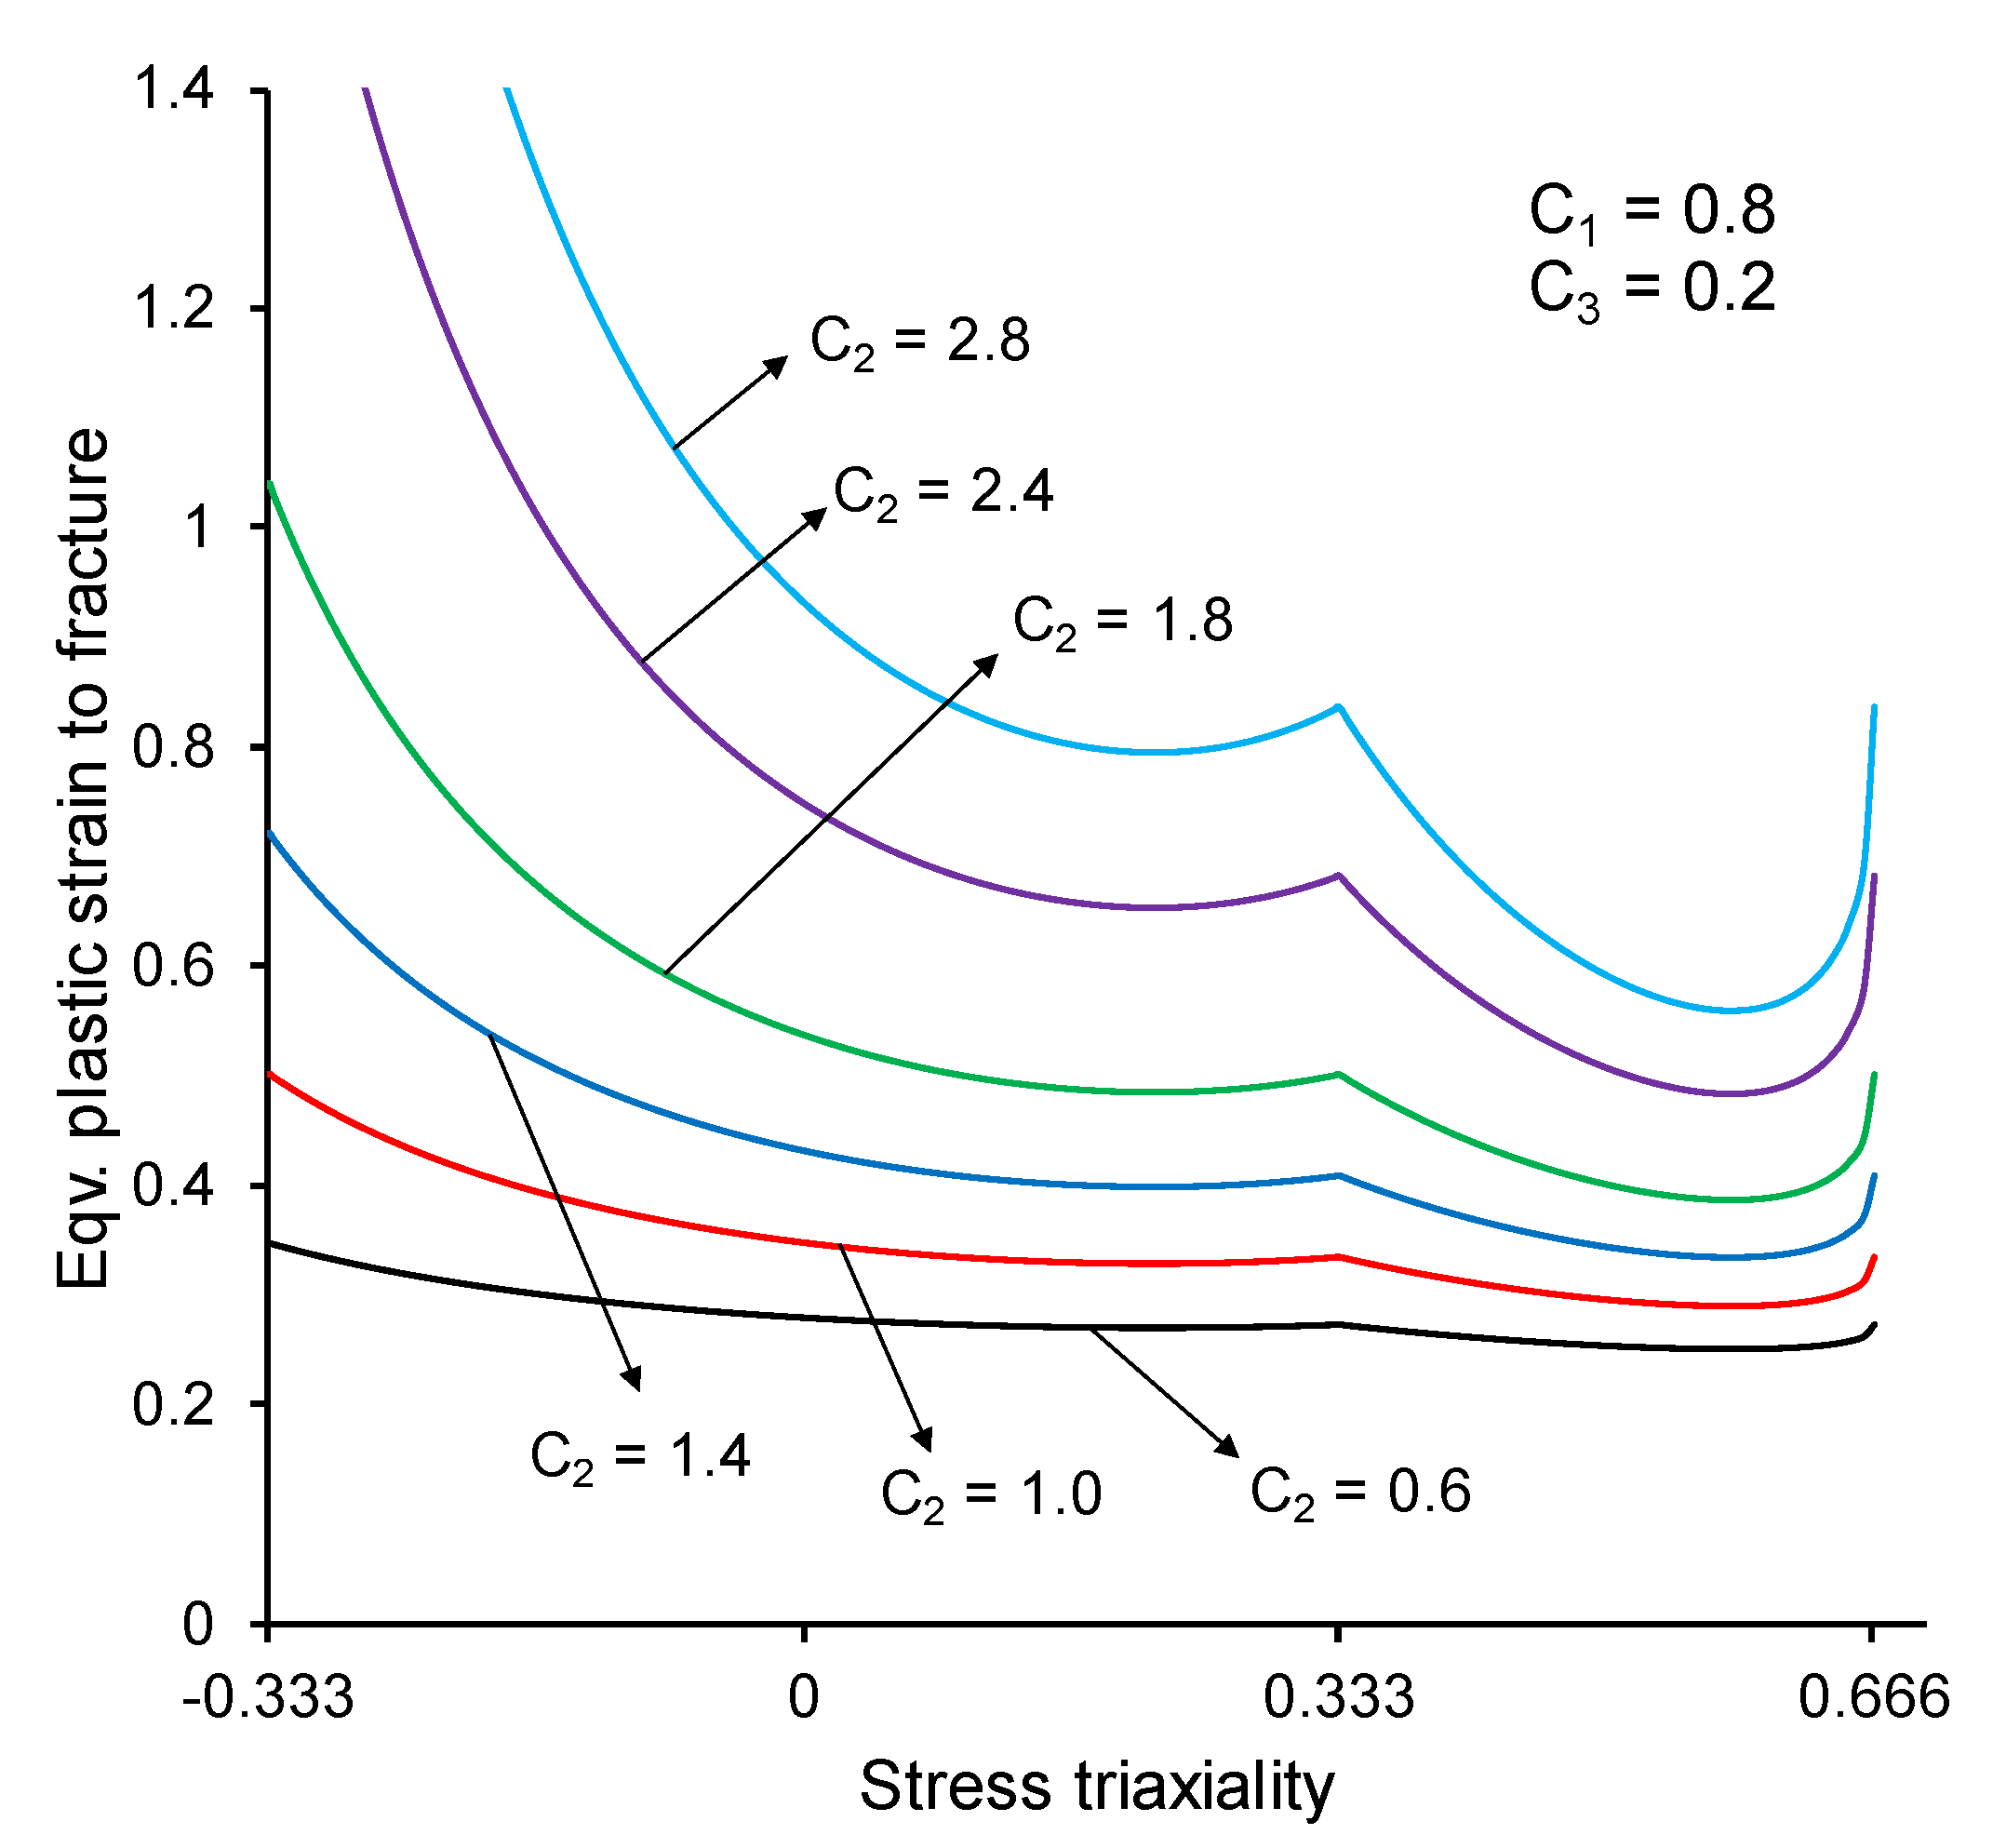
Figure 5 presents several plots of the proposed fracture model under plane stress conditions considering several different C 2 values. The overall effect of C 2 is emphasizing the stress state-dependency by reflecting both the stress triaxiality and Lode angle sensitivities.
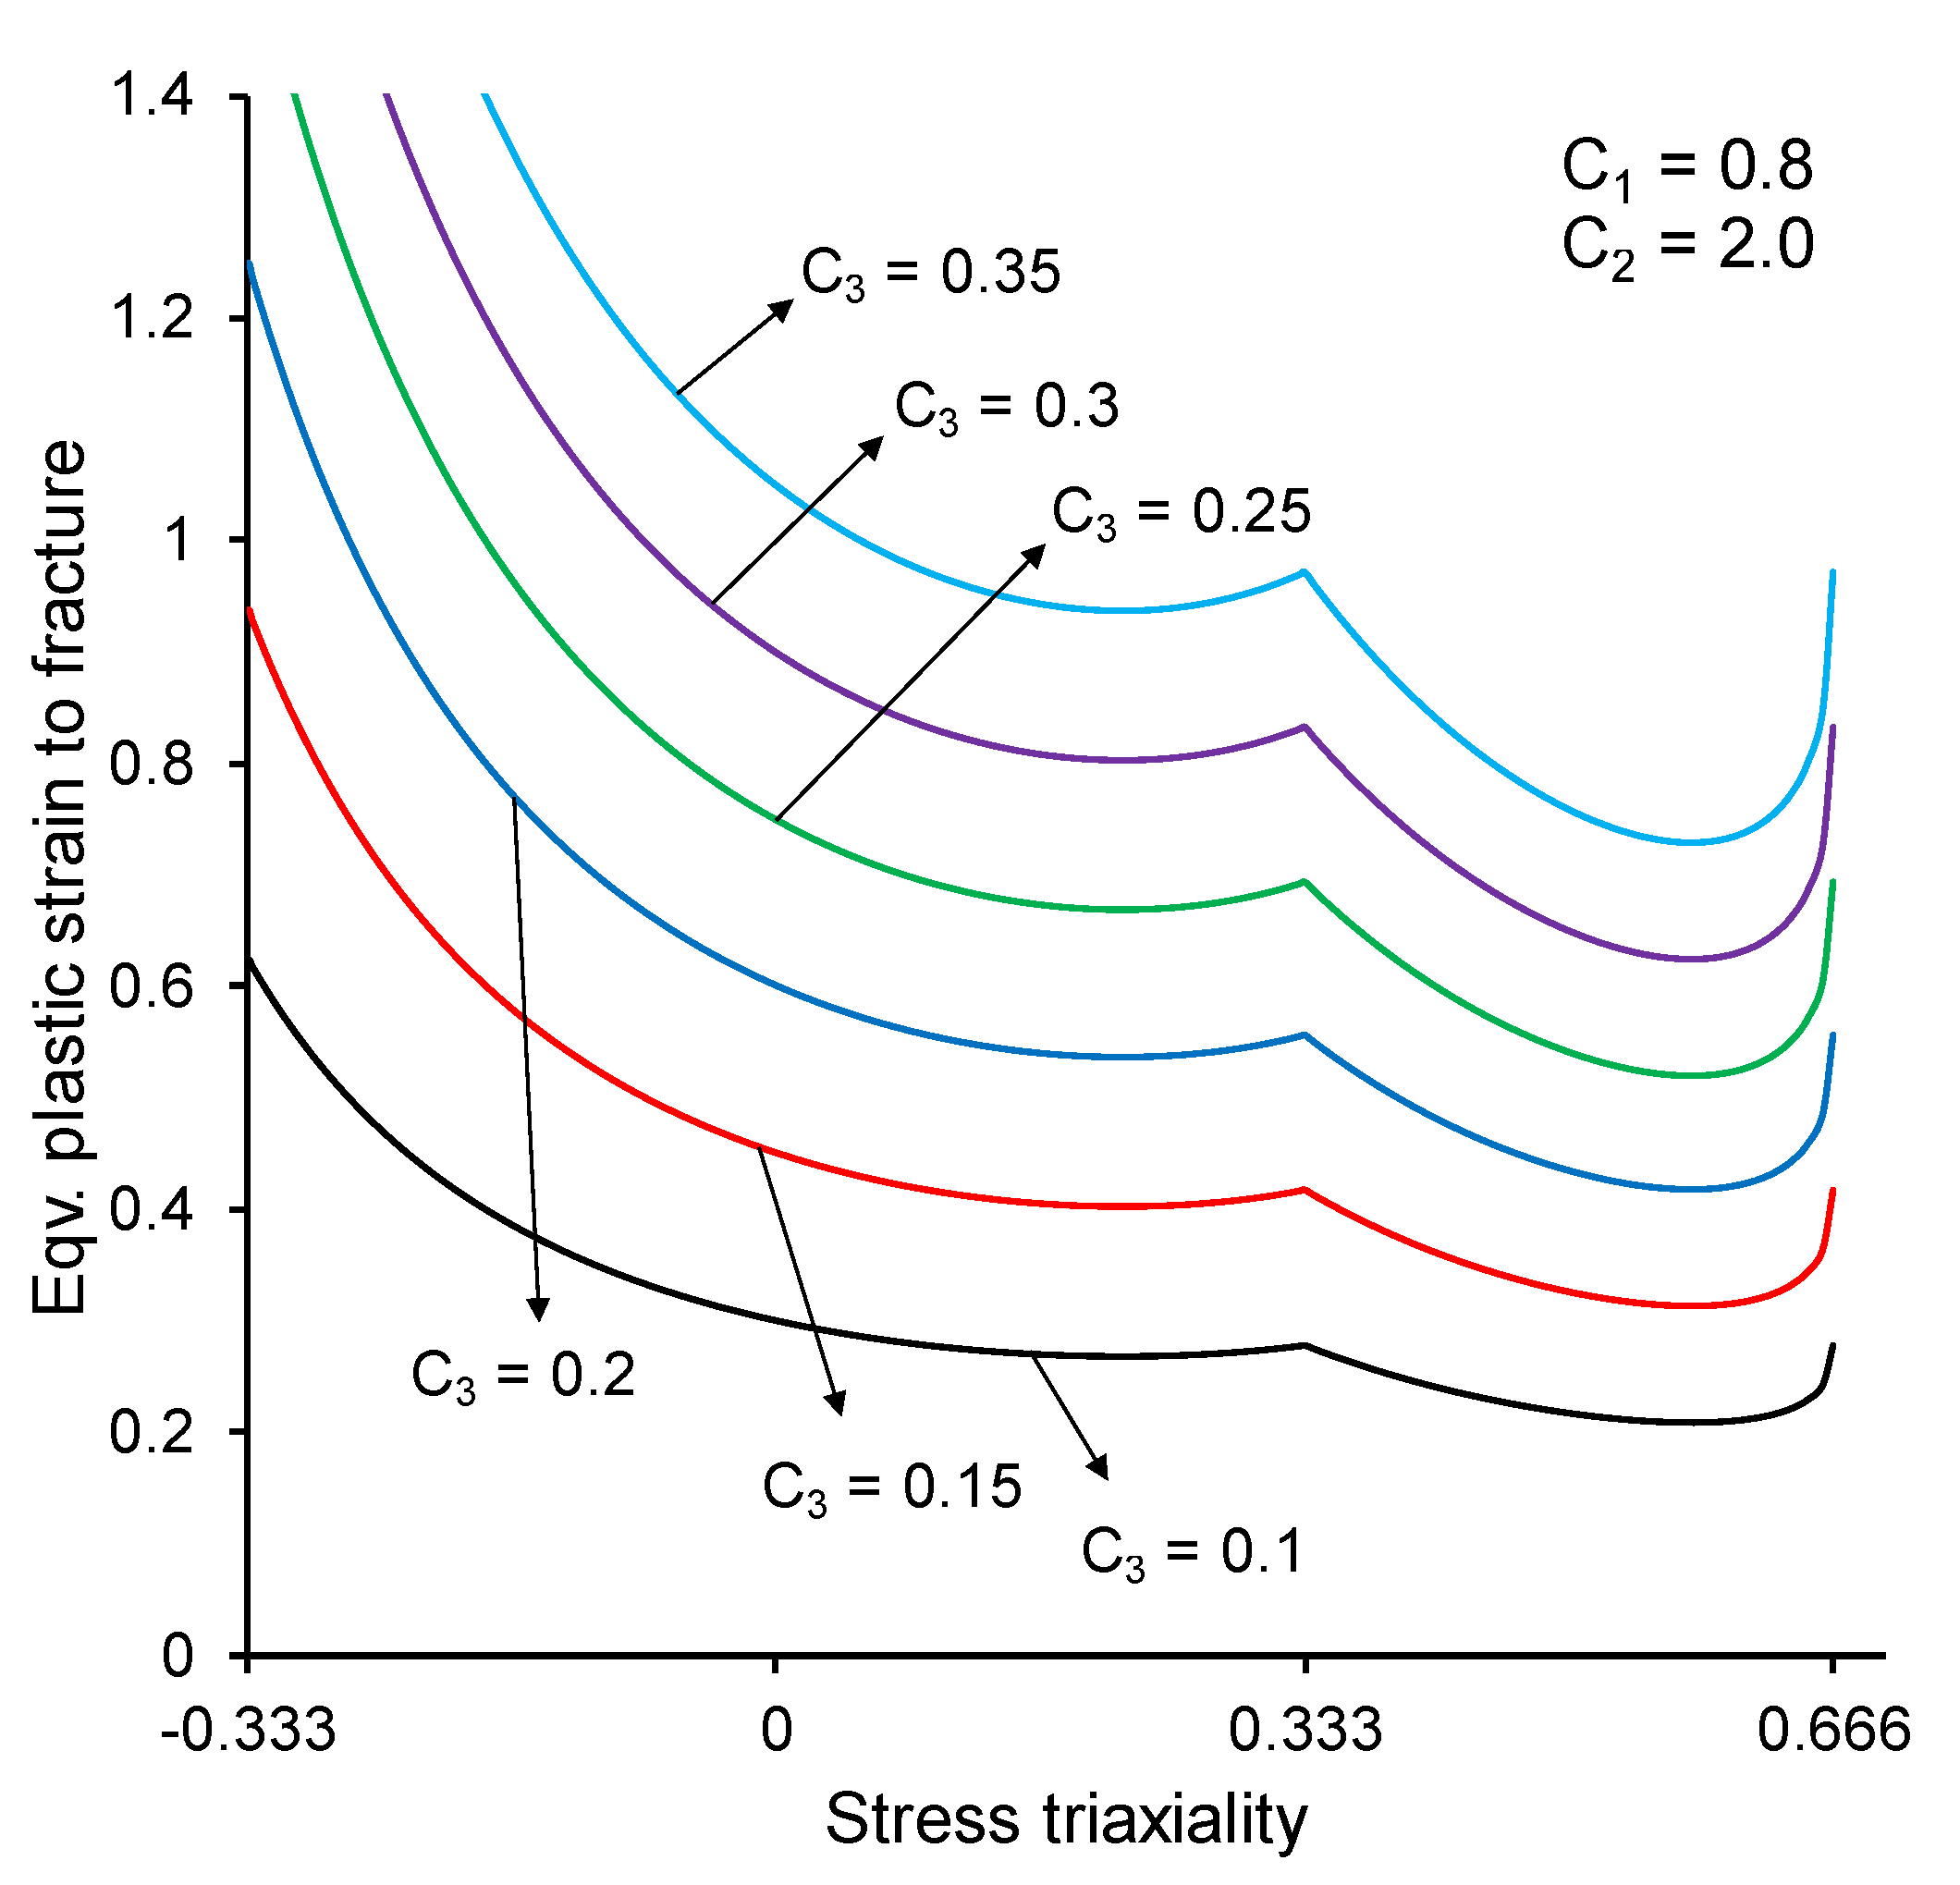
Figure 6 shows the effects of C 3 . C 3 does not alter the stress-state-dependency of the ductility significantly but shifts the fracture locus up and down. Note that the value of C 3 does not correspond to the strain to fracture for any particular stress state.
In the general case, the border of the cut-off region can be derived from Equation (5). The strain to fracture approaches infinity when the following condition is met
C 1 1 3 cos π 6 θ ¯ + 1 C 1 3 η + 2 cos π 6 1 θ ¯ 3 = 0
This equation defines a plane in the space of ( ε ¯ p , η , θ ¯ ) . Figure 7 shows the projection of the cut-off plane to the plane of ( η , θ ¯ ) for C 1 = 0.6 . As mentioned earlier, the parameter C 1 controls the shape of the cut-off plane. For C 1 = 0 , the cut-off plane is identical to the biaxial compression part of the plane stress curve, 2 / 3 η 1 / 3 . No cut-off plane exists for the limiting case of C 1 = 1 .

3. Experiments

The experimental data for one normal strength and two high-strength steel grades, which are widely used maritime industry, are used to demonstrate the calibration procedure and validate the model. The target steels are:
  • A grade (KR) normal-strength (mild) steel plate (6 mm);
  • AH36 grade (ASTM A131) high-strength steel plate (6 mm);
  • DH36 grade (LR) high-strength steel plate (7 mm).
Cerik et al. [32] published the test results for grade DH36 steel and Park et al. [28] presented the data for AH36. The tests for A grade are reported in the present study. The base plates with the thicknesses given above are procured from three different Korean steel producers. According to the mill test certificates, Table 1 lists the chemical composition of the steel plates considered. The test specimens are cut from the mid-layer of the plates given above using the CNC wire-cutting method perpendicular to the plate rolling direction.
Standard flat dog-bone specimens with a 50-mm-long, 12.5-mm-wide and 2-mm-thick gauge section are used to obtain the flow stress before the onset of diffuse necking. The loading speed is 1 mm/min. In general, marine structural steels display planar-isotropic characteristics, as reported by Park et al. [36]. For simplicity, the mechanical properties of the tested steel grades are assumed to be isotropic. Figure 8 presents the measured true stress versus logarithmic plastic strain curves for the three steel grades up to diffuse necking.
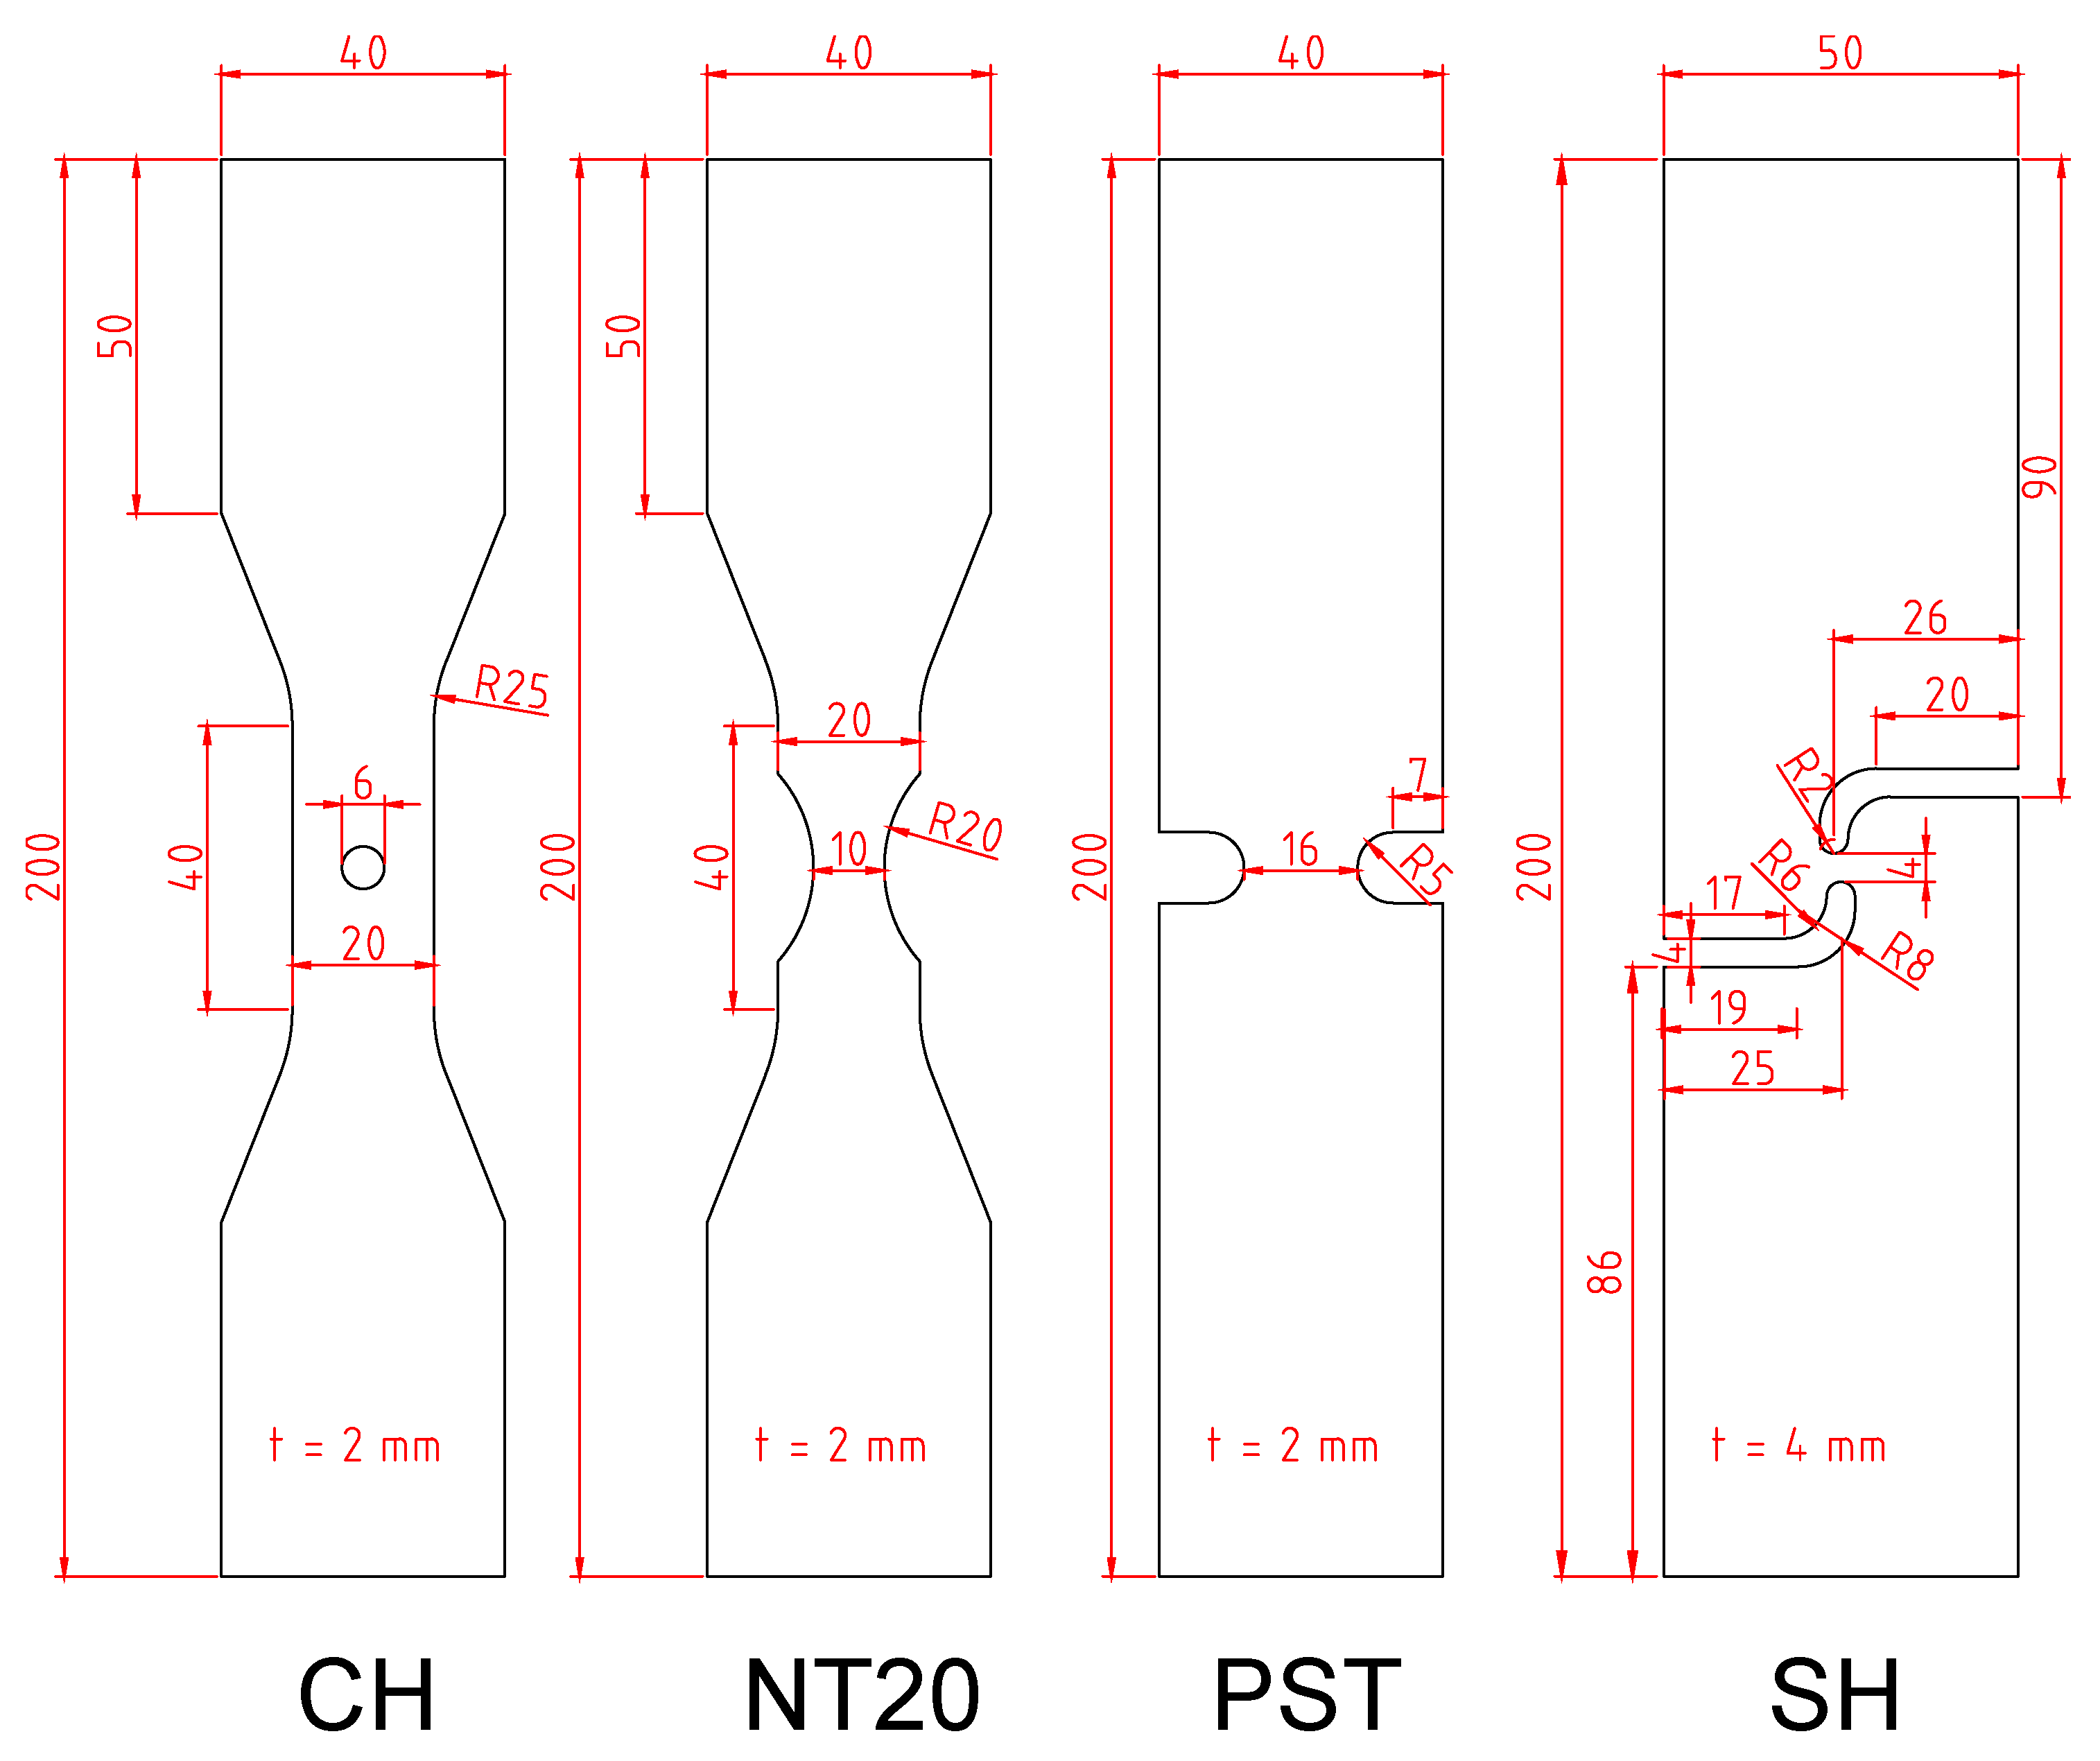
Uniaxial tension tests are performed on central hole and notched specimens. These tension specimens are also 2-mm thick. The first type of flat specimen, designated as NT20, has a circular cut-out with a notch radius of 20 mm. The gauge section width is 10 mm. The second type of notched specimen, designated as PST, has a smaller notch radius and but larger gauge width. The central hole specimen (CH) features a 6-mm hole at the center. The shear specimen is adopted from the design proposed by Peirs et al. [38]. Its thickness is 4 mm. Figure 9 shows the scantlings of the test specimens. The tests are performed with a speed of 0.5 mm/min. The reported displacement correspond to the extensometer measurements at 50-mm gauge length. The tests are conducted three times and the repeatability of the results is confirmed.

4. Fracture Model Calibration

4.1. Hardening Model

The combined Swift-Voce hardening model, following the general format give by Sung et al. [39], is adopted
k = f ε ¯ p = α k S ε ¯ p + ( 1 α ) k V ε ¯ p
Here, α 0 , 1 is the weighting factor between the Swift and the Voce hardening laws. The Swift hardening law is given as
k S ε ¯ p = A ε 0 + ε ¯ p n
The Voce law can be written as
k V ε ¯ p = k 0 + Q 1 exp β ε ¯ p
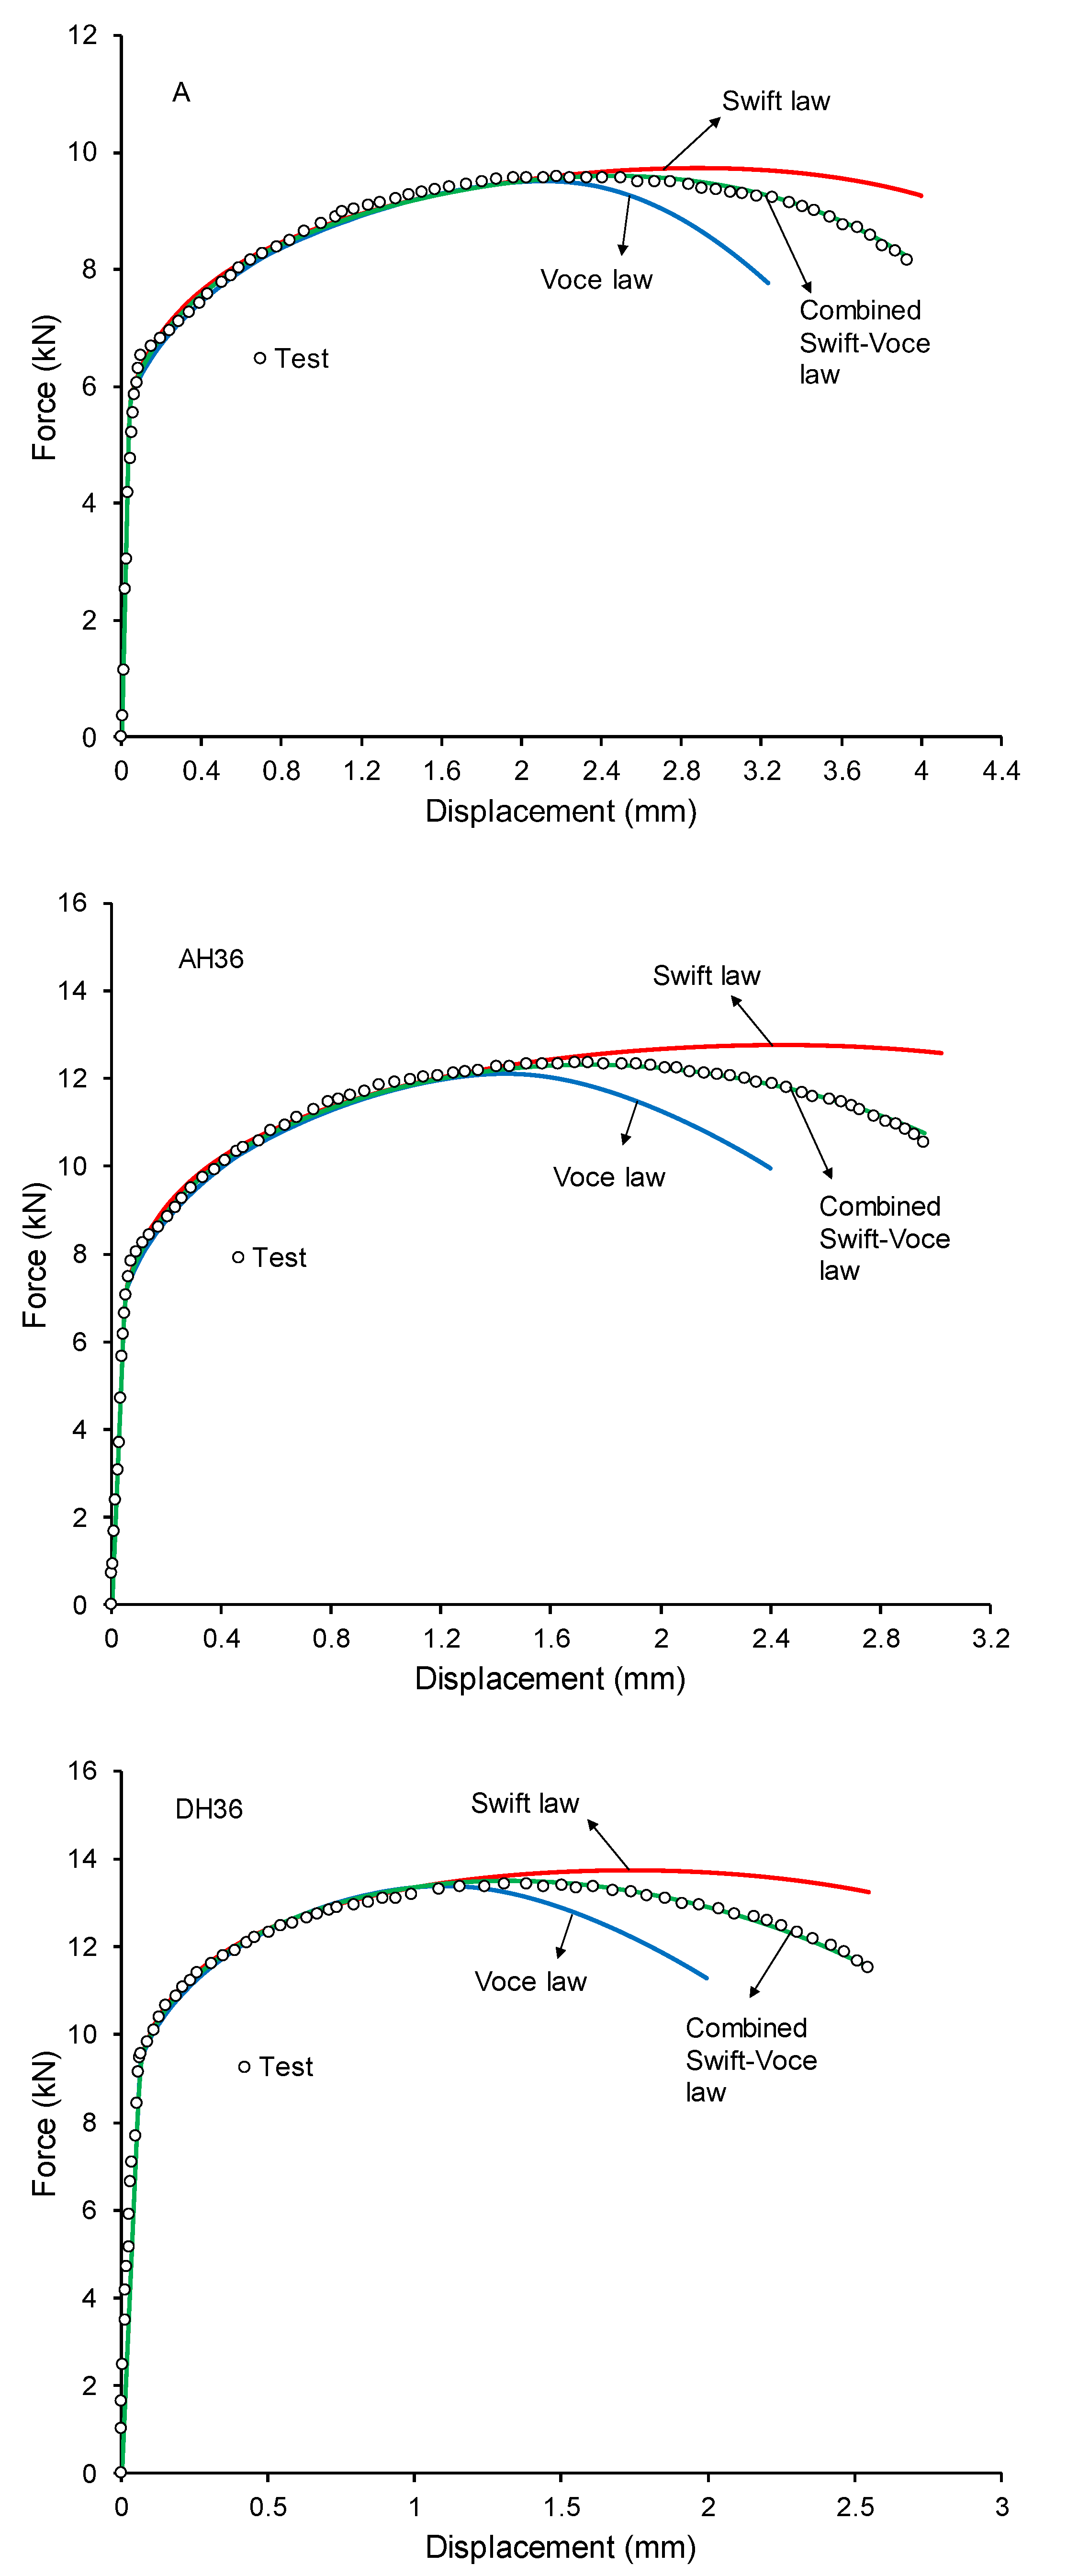
The hardening law parameters {A, ε 0 , and n}, and Voce law parameters { k 0 , Q, and β } are determined separately using the standard tension test data of flat dog-bone specimens. Only the portion up to the diffuse necking is used. Beyond that point, an iterative procedure is applied to determine the weighting factor α . The test data of NT20 specimen are used for this purpose because the location of fracture initiation in this specimen is precisely defined. Cerik et al. [32] explains this procedure and its rationale in detail. Finite element software Abaqus is used in the analysis of the tests. One eighth of the full gage section of the NT20 specimen is modeled using the symmetry conditions. The model is meshed using eight-node solid elements (C3D8R). The gauge section of the NT20 is meshed with ten elements through half of the thickness. The corresponding element edge length is 0.1 mm. This value is determined after a convergence test with regards to equivalent plastic strain in the gauge section. Figure 10 presents the corresponding hardening curves, and Figure 11 shows the simulation and test results for NT20 specimen. The Swift law overestimates the force levels after the onset of necking, whereas the Voce law yields early localization and softening. It is evident the combined Swift–Voce law provides the closest estimate for the response at large strains. Table 2 lists the final hardening law parameters.

4.2. Loading Paths

The loading paths to fracture initiation, i.e., the history of stress-state parameters ( η , θ ¯ ) at the material point where the fracture initiates, are obtained from the numerical analyses. Analysis of the fracture test specimens (CH, PST, SH) are conducted in a manner similar to NT20 specimen analysis. The same mesh size (0.1 mm) is used in all specimens. Abaqus/Explicit is used with the mass-scaling option to achieve reasonable analysis durations. The total simulation time is 0.01 s, which is long enough to keep the inertial forces negligible. This has been determined by comparing the kinetic energy of the system with the total strain energy. In a quasi-static simulation, as a rule of thumb, the ratio of these two should be lower than 5%. The assumed fracture initiation location is the element that has the maximum equivalent plastic strain at the instant where the experimental force-displacement curve exhibits a sharp decrease. The critical element in CH, PST and NT20 specimens is at the center of the specimens. In the SH specimen, it is on the free surface, slightly away from the center of the gauge.
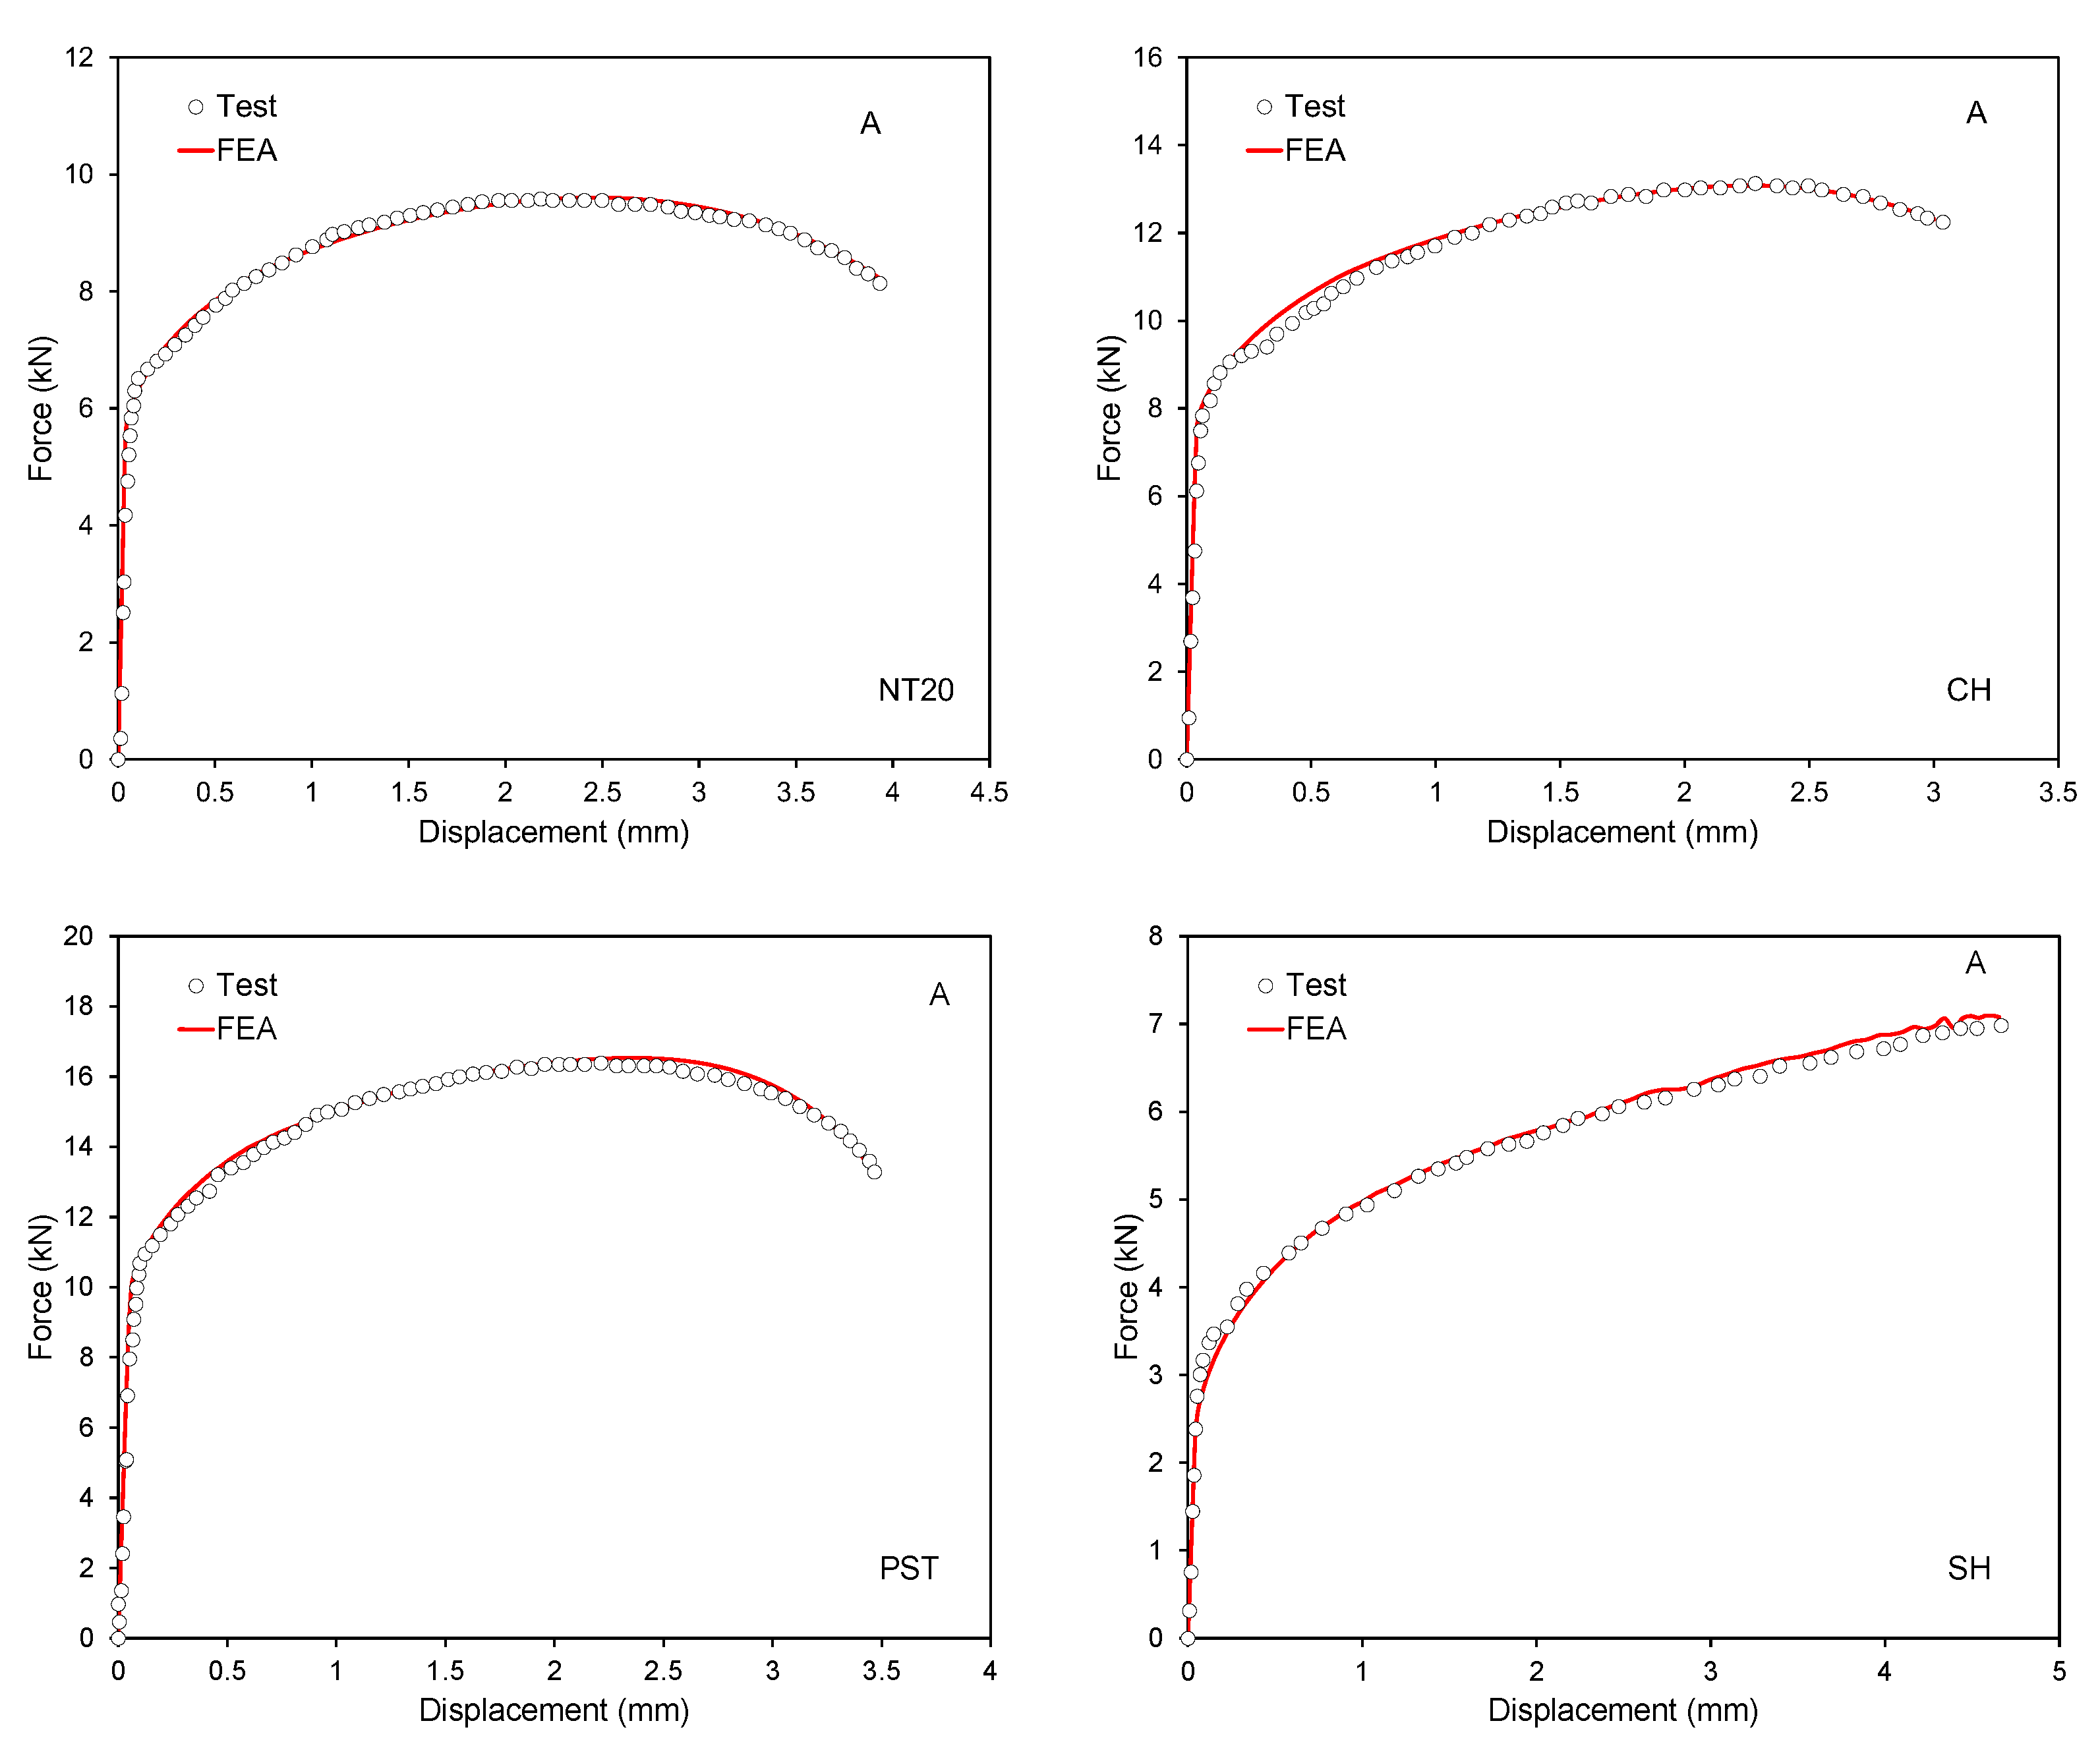
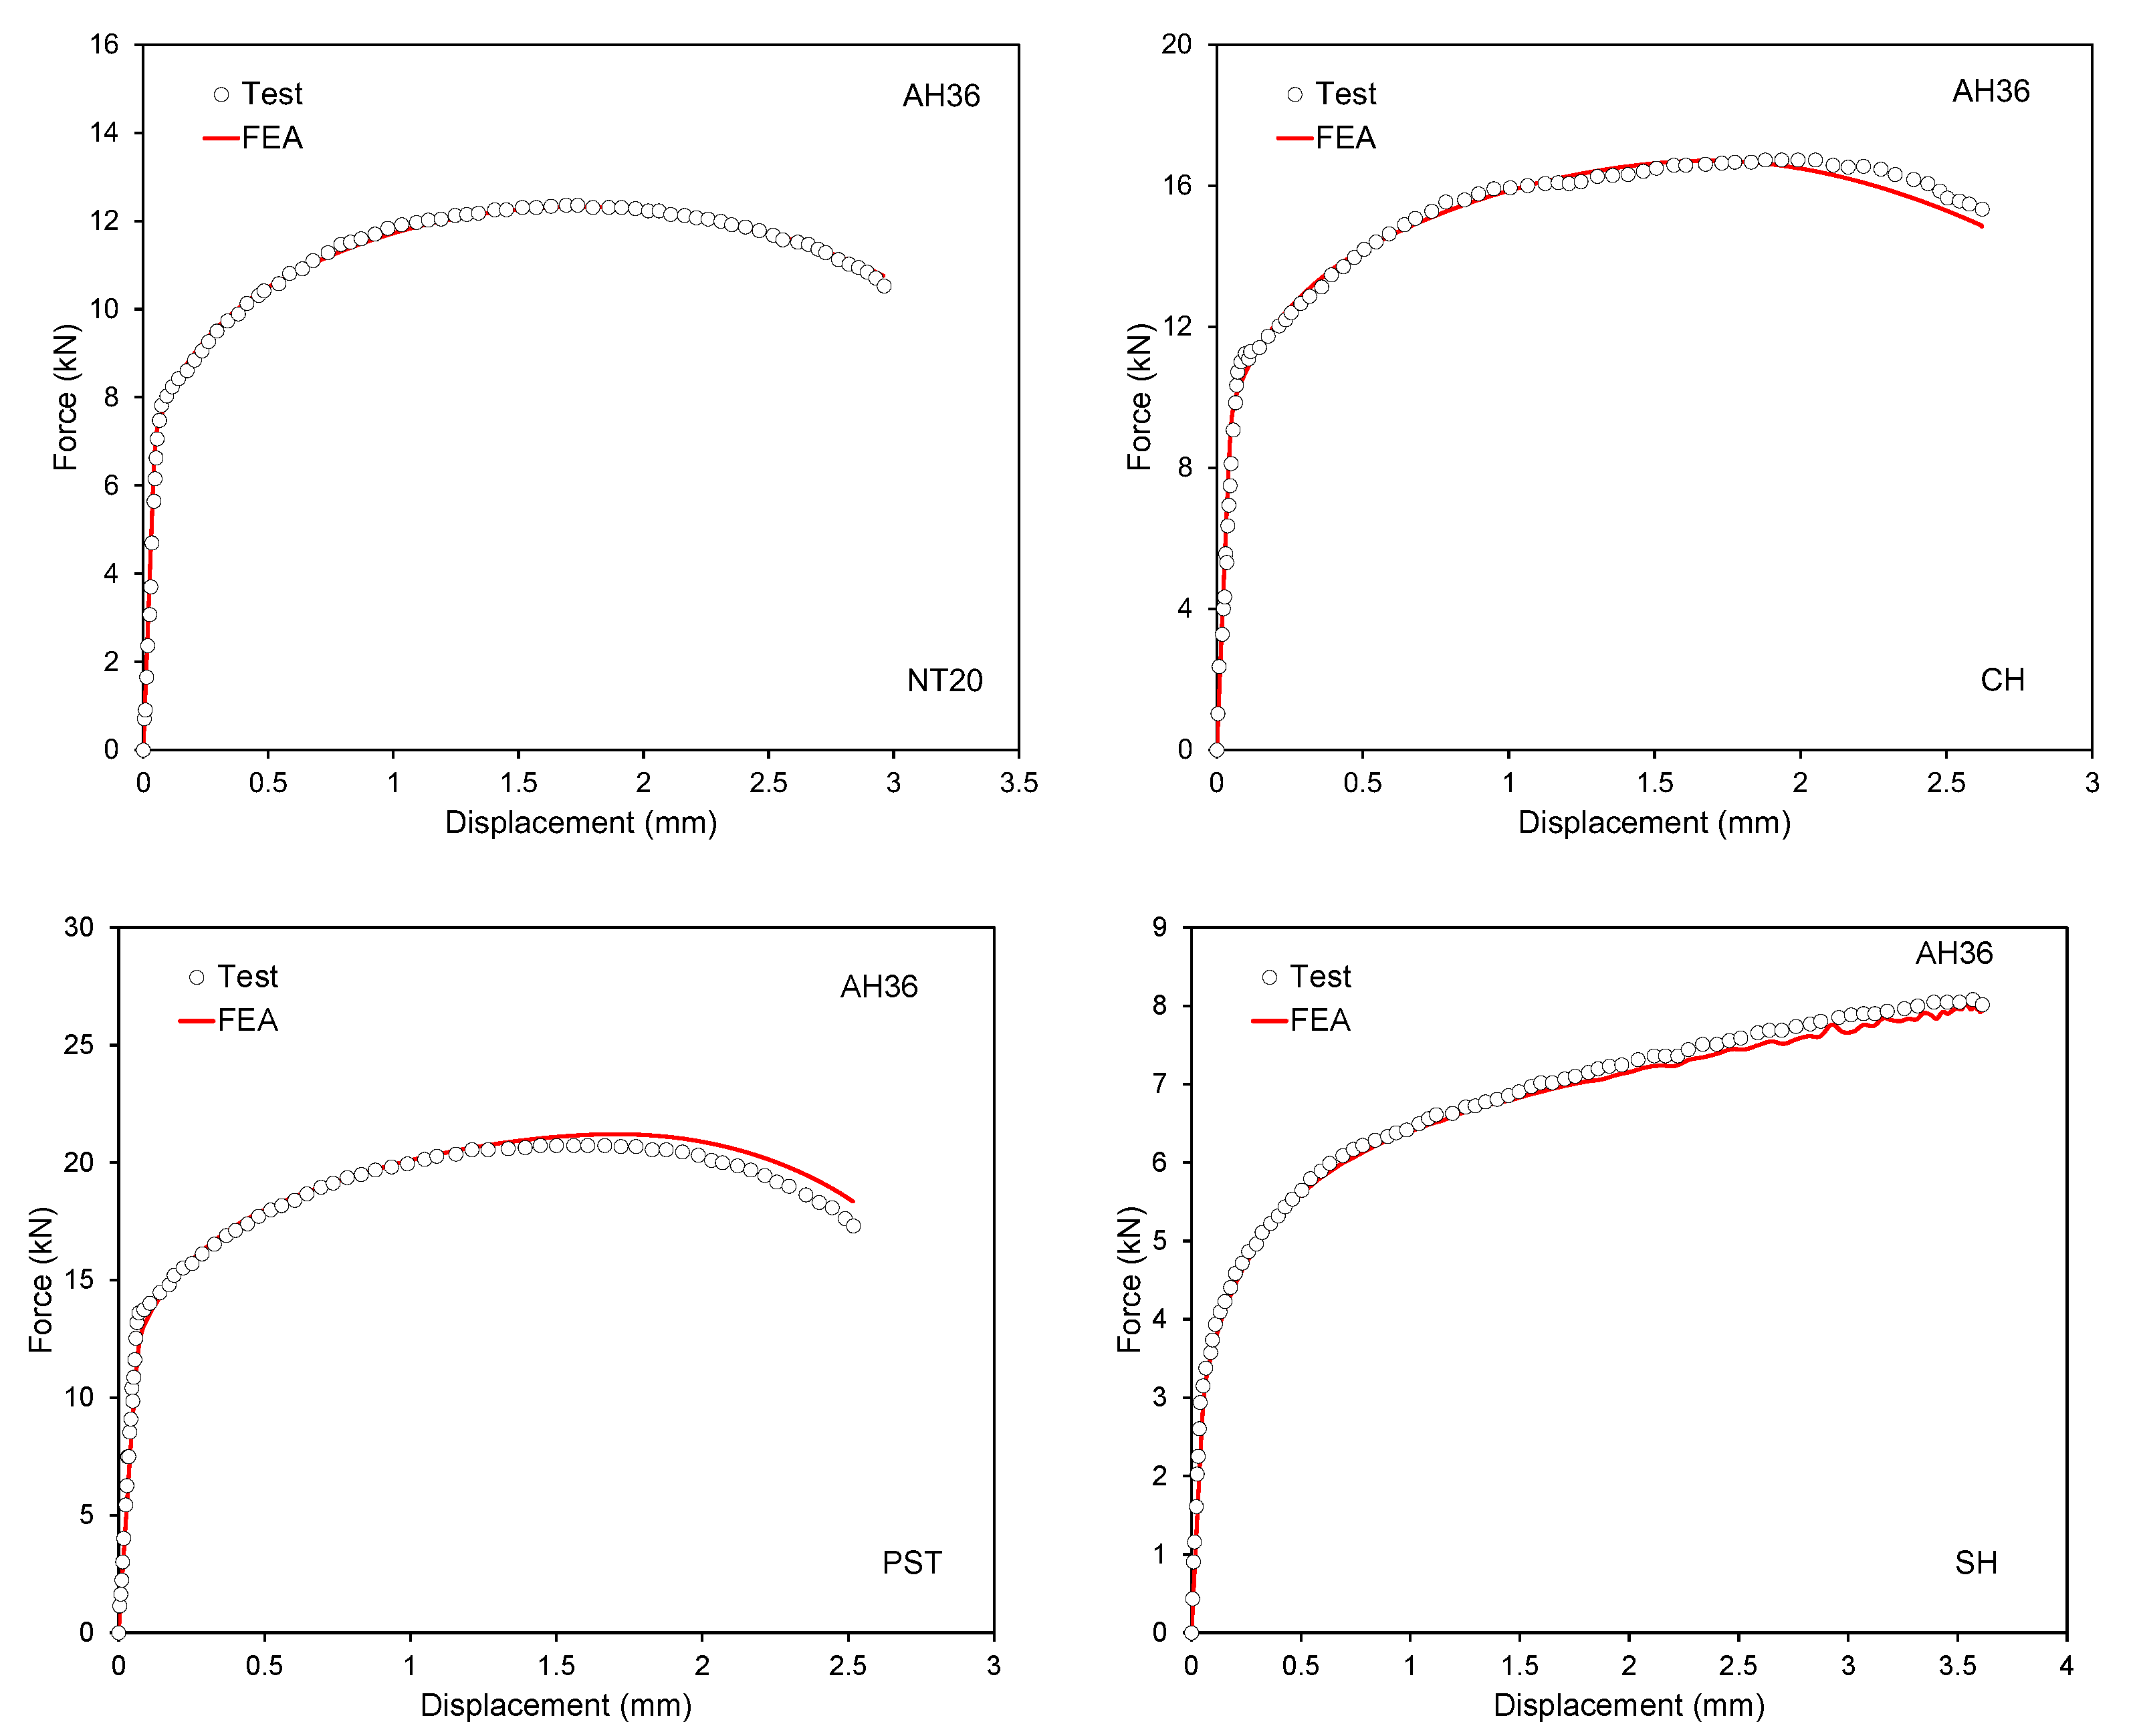
Figure 12 and Figure 13 show the predicted force-displacement curves and test results for the A and AH36 grade test specimens, respectively. It is evident that the force-displacement responses are predicted with good accuracy using the calibrated hardening curves employing combining the Swift–Voce law. Figure 14 shows the loading paths for all three steel grades. The loading paths indicate the evolution of stress-state parameters with increasing equivalent plastic strain. If the stress-state parameters are constant until fracture initiation, the loading path is called proportional. For the CH and SH specimens, the loading paths are relatively proportional, i.e., ( η , θ ¯ ) remain almost constant until fracture initiation. However, PST and NT20 specimens display non-proportional loading paths immediately after necking. Towards fracture initiation, the Lode angle parameter decreases and approaches zero. This observation is in close agreement with the proposed model, where the fracture prefers generalized shear stress states.

4.3. Determination of Fracture Model Parameters

To determine the optimal set fracture model parameters χ = C 1 , C 2 , C 3 , an optimization problem is set. The loading paths obtained from numerical simulations for each test ( η i ε ¯ p , θ ¯ i ε ¯ p ) and the corresponding fracture indicator D i = 0 ε ¯ f , i d ε ¯ p ε ¯ f p r χ , η i , θ i ¯ are used. All four specimens are considered. The cost function is defined as follows
f χ = i = 1 4 0 ε ¯ f , i d ε ¯ p ε ¯ f p r χ , η i , θ i ¯ 1 2
Hence, the optimization problem can be written as
χ = arg min χ f χ
The optimization problem is solved with the aid of the Matlab toolbox. In addition, the constraints on C 1 , C 2 and C 3 are constrained as positive values. Table 3 presents the optimal set of the model parameters. Figure 15 presents the resulting 3D fracture loci. The black curves plotted over the 3D fracture loci denote the plane stress condition. Figure 16 shows the plane stress fracture loci.
Several conclusions may be drawn from the calibrated fracture loci. Among the three steel grades, the ductility limits of normal-strength steel, grade A, showed a relatively low Lode angle dependence which could be best described by a fracture locus similar to the Cockcroft–Latham model. On the other hand, the fracture locus of AH36 elucidates the Lode angle effect. Interestingly, AH36 shows higher ductility for certain stress states, such as uniaxial tension and equi-biaxial tension, compared to A grade steel. DH36 showed the lowest ductility among the three steel grades. The fracture locus of DH36 exhibited a relatively high stress-triaxiality-dependence but moderate Lode angle effect. A similar conclusion is drawn by [32]. For negative stress triaxialities and plane strain tension, AH36 and DH36 have similar ductility levels.
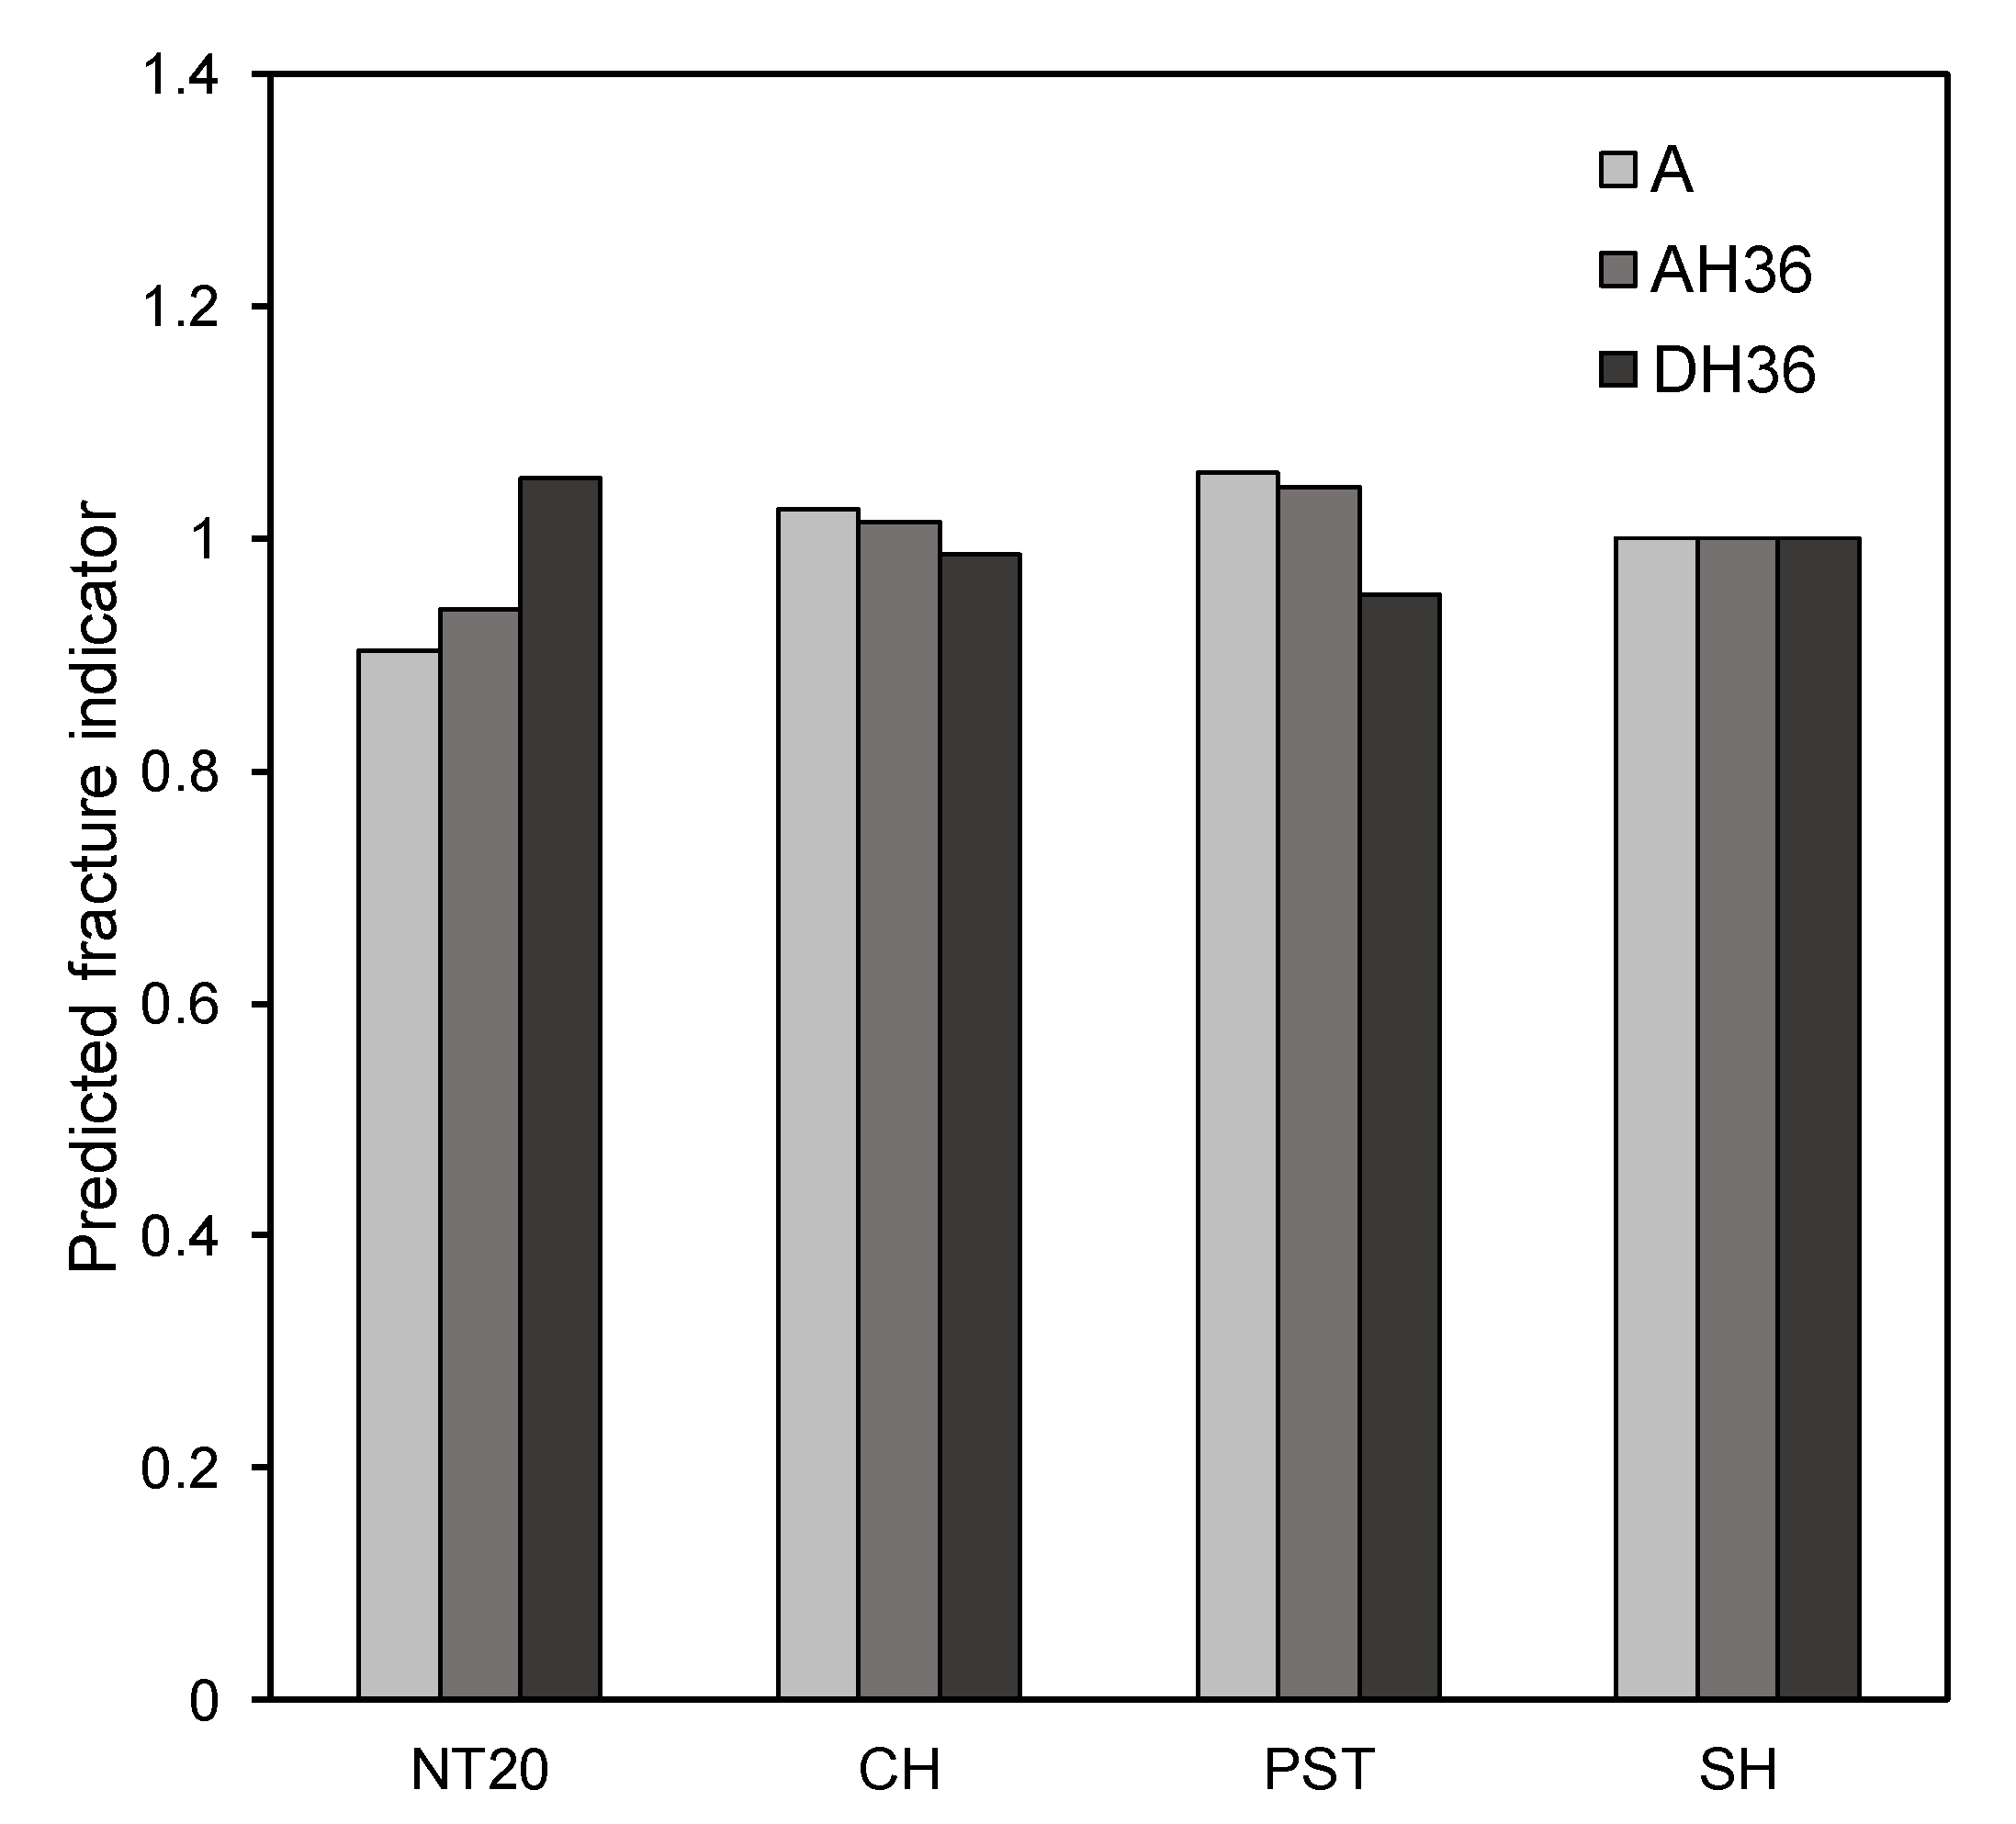
Figure 17 shows the predicted fracture indicator using the calibrated fracture model at the instant of experimental fracture initiation. Here, the prediction error should be read as deviation from unity. It is apparent that the prediction errors are very low, particularly for the case of the SH specimen. It can concluded that the proposed model could describe the experimental data accurately for all steel grades and test specimens.

5. Conclusions

The experimental results from a series of tests on three different marine structural steel sheets are used to calibrate a proposed ductile fracture initiation model, which is formulated as a weighted sum of normalized maximum shear and principal stresses. A hybrid experimental-numerical approach is adopted. As a by-product of the fracture model calibration process, the flow stresses of the three steel grades at large strains are obtained. The experimental results and simulations are compared in terms of the force-displacement curves and the onset of fracture. Based on the results obtained, the following conclusions can be drawn:
  • Ductile fracture behavior is closely associated with hardening behavior in large strains;
  • The proposed model shows good flexibility for calibration and could predict the onset of fracture accurately for all the test specimens and steel grades considered;
  • The ductility limits of normal strength steel, grade A, showed a relatively low Lode angle dependence. The Cockcroft–Latham model is appropriate for describing the ductile fracture locus of grade A steel;
  • AH36 shows considerable Lode angle sensitivity. Despite being a high-tensile strength steel, AH36 shows higher ductility as compared to mild steel A for certain stress states, such as uniaxial tension and equi-biaxial tension;
  • The fracture locus of DH36 exhibited a relatively high stress-triaxiality-dependence but moderate Lode angle effect.

Author Contributions

Conceptualization, B.C.C.; methodology, J.C. and B.C.C.; software, B.C.C.; validation, J.C. and B.C.C.; formal analysis, J.C. and B.C.C.; investigation, J.C. and B.C.C.; resources, J.C.; data curation, B.C.C.; writing—original draft preparation, B.C.C.; writing—review and editing, J.C. and B.C.C.; visualization, B.C.C.; supervision, J.C.; project administration, J.C.; funding acquisition, J.C. All authors have read and agreed to the published version of the manuscript.

Funding

This work was supported by the Korea Research Fellowship Program through the National Research Foundation of Korea (NRF) funded by the Ministry of Science and ICT (2017H1D3A1A01055137) and by an INHA Research Grant.

Conflicts of Interest

The authors declare no conflict of interest. The funders had no role in the design of the study; in the collection, analyses, or interpretation of data; in the writing of the manuscript, or in the decision to publish the results.

Abbreviations

The following abbreviations are used in this manuscript:
ASTMAmerican Society for Testing and Materials
CLCockcroft–Latham
CNCComputer numerical control
KRKorean Register
LRLloyd’s Register
MSSMaximum shear stress

Appendix A.

Appendix A.1. Definition of the Stress State

For an isotropic solid material, the stress tensor can be represented by the ordered principal stresses ( σ 1 σ 2 σ 3 ) or using its invariants
I 1 = tr σ = σ 1 + σ 2 + σ 3
J 2 = 1 2 s : s = 1 6 { ( σ 1 σ 2 ) 2 + ( σ 2 σ 3 ) 2 + ( σ 3 σ 1 ) 2 }
J 3 = det s = ( σ 1 σ m ) ( σ 2 σ m ) ( σ 3 σ m )
Here, I 1 represents the first invariant of the Cauchy stress tensor σ . The invariants of the deviatoric stress tensor, s , are denoted as J 2 and J 3 . The stress tensor may be decomposed into hydrostatic and deviatoric parts
σ = 1 3 I 1 I + s = σ m I + s
where I is the identity matrix and σ m = ( σ 1 + σ 2 + σ 3 ) / 3 is the hydrostatic stress.
The stress state is characterized by the two non-dimensional ratios of the invariants or the principal stresses. In this paper, the stress triaxiality, η , and Lode angle parameter, θ ¯ , were used as the stress state parameters. The stress triaxiality ( < η < ), which represents the first invariant, is obtained by normalizing hydrostatic stress, σ m , with the von Mises equivalent stress, σ ¯ = 3 J 2
η = σ m σ ¯ = I 1 3 3 J 2
The third invariant can be normalized as follows
ξ = 27 2 J 3 σ ¯ 3 = cos 3 θ
where θ is the Lode angle ( 0 θ π / 3 ). The normalized Lode angle, which is called the Lode angle parameter ( 1 θ ¯ 1 ), is expressed as follows
θ ¯ = 1 6 θ π = 1 2 π arccos ξ
θ ¯ = 0 designates generalized shear (e.g., pure shear or plane strain tension), whereas θ ¯ = 1 corresponds to axisymmetric tension and θ ¯ = 1 represents axisymmetric compression. An alternative measure of the third invariant is the so-called Lode parameter, L
L = σ 2 σ n τ m a x = 2 σ 2 σ 1 σ 3 σ 1 σ 3
where maximum shear stress, τ m a x , and normal stress, which acts on the same plane as maximum shear stress, σ n , are defined as follows
τ m a x = σ 1 σ 3 2
σ n = σ 1 + σ 3 2
The stress vector can be defined in the Cartesian coordinate system using the principal stresses ( σ 1 , σ 2 , σ 3 ) . Alternatively, a cylindrical coordinate system may be used based on ( σ ¯ , η , θ ) . The transformation from ( σ 1 , σ 2 , σ 3 ) to ( σ ¯ , η , θ ¯ ) is obtained as follows
σ 1 = σ ¯ η + 2 3 cos π 6 1 θ ¯
σ 2 = σ ¯ η + 2 3 cos π 6 3 + θ ¯
σ 3 = σ ¯ η 2 3 cos π 6 1 + θ ¯
In the cylindrical coordinate system, the direction of the stress vector can be defined using stress triaxiality and Lode angle parameter. If these two parameters, which define the stress state, does not vary until fracture, a proportional loading path is experienced.
Under plane stress condition σ 3 = 0 , the stress state can be represented by σ 2 / σ 1 . In that case, the following relation holds
θ ¯ = 1 2 π arccos 27 2 η η 2 1 3

Appendix A.2. Plasticity

Isotropic von Mises yield criterion is adopted. The von Mises yield surface is given as
f σ , k = σ ¯ k = 0
where k is the deformation resistance. An associated flow rule is assumed
d ε p = d ε ¯ p σ ¯ σ
where d ε p is the plastic strain increment vector The equivalent plastic strain increment, d ε ¯ p is given as the work-conjugate of the equivalent stress
σ : d ε p = σ ¯ d ε ¯ p
An isotropic strain hardening function defines the deformation resistance, k,
k = k ε ¯ p

References

  1. Matic, P.; Geltmacher, A.; Rath, B. Computational aspects of steel fracturing pertinent to naval requirements. Philos. Trans. R. Soc. A Math. Phys. Eng. Sci. 2015, 373, 20140127. [Google Scholar] [CrossRef]
  2. Takahashi, K.; Yamatoki, S.; Namegawa, T.; Kinoshita, M.; Fujioka, M. Dominant factors influencing ductile fracture on cutting surface during cold forming. In Proceedings of the ASME 2018 37th International Conference on Ocean, Offshore and Arctic Engineering, Madrid, Spain, 17–22 June 2018; American Society of Mechanical Engineers: New York, NY, USA, 2018; Volume 4: Materials Technology. [Google Scholar] [CrossRef]
  3. Kanno, K.; Nishino, S.; Ohya, K. Evaluation of the form-forming mechanism for high-tensile-strength steel plate. Mater. Trans. 2017, 58, 1708–1714. [Google Scholar] [CrossRef] [Green Version]
  4. McClintock, F.A. A criterion for ductile fracture by the growth of holes. J. Appl. Mech. 1968, 35, 363–371. [Google Scholar] [CrossRef]
  5. Rice, J.; Tracey, D. On the ductile enlargement of voids in triaxial stress fields. J. Mech. Phys. Solids 1969, 17, 201–217. [Google Scholar] [CrossRef] [Green Version]
  6. Hancock, J.; MacKenzie, A. On the mechanisms of ductile failure in high-strength steels subjected to multi-axial stress-states. J. Mech. Phys. Solids 1976, 24, 147–160. [Google Scholar] [CrossRef]
  7. Hancock, J.; Brown, D. On the role of strain and stress state in ductile failure. J. Mech. Phys. Solids 1983, 31, 1–24. [Google Scholar] [CrossRef]
  8. Gurson, A.L. Continuum theory of ductile rupture by void nucleation and growth: Part I-yield criteria and flow rules for porous ductile media. J. Eng. Mater. Technol. 1977, 99, 2–15. [Google Scholar] [CrossRef]
  9. Tvergaard, V. Influence of voids on shear band instabilities under plane strain conditions. Int. J. Fract. 1981, 17, 389–407. [Google Scholar] [CrossRef]
  10. Tvergaard, V.; Needleman, A. Analysis of the cup-cone fracture in a round tensile bar. Acta Metall. 1984, 32, 157–169. [Google Scholar] [CrossRef]
  11. Johnson, G.R.; Cook, W.H. Fracture characteristics of three metals subjected to various strains, strain rates, temperatures and pressures. Eng. Fract. Mech. 1985, 21, 31–48. [Google Scholar] [CrossRef]
  12. Cockcroft, M.G.; Latham, D.J. Ductility and the workability of metals. J. Inst. Met. 1968, 96, 33–39. [Google Scholar]
  13. Oh, S.I.; Chen, C.C.; Kobayashi, S. Ductile fracture in axisymmetric extrusion and drawing-part 2: Workability in extrusion and drawing. J. Eng. Ind. 1979, 101, 36. [Google Scholar] [CrossRef]
  14. Xue, L. Ductile Fracture Modeling: Theory, Experimental Investigation and Numerical Verification. Ph.D. Thesis, Massachusetts Institute of Technology, Cambridge, MA, USA, 2007. [Google Scholar]
  15. Bao, Y.; Wierzbicki, T. On fracture locus in the equivalent strain and stress triaxiality space. Int. J. Mech. Sci. 2004, 46, 81–98. [Google Scholar] [CrossRef]
  16. Barsoum, I.; Faleskog, J. Rupture mechanisms in combined tension and shear-experiments. Int. J. Solids Struct. 2007, 44, 1768–1786. [Google Scholar] [CrossRef] [Green Version]
  17. Clausing, D. Effect of plastic strain state on ductility and toughness. Int. J. Fract. Mech. 1970, 6. [Google Scholar] [CrossRef]
  18. Xue, L. Damage accumulation and fracture initiation in uncracked ductile solids subject to triaxial loading. Int. J. Solids Struct. 2007, 44, 5163–5181. [Google Scholar] [CrossRef] [Green Version]
  19. Xue, L. Constitutive modeling of void shearing effect in ductile fracture of porous materials. Eng. Fract. Mech. 2008, 75, 3343–3366. [Google Scholar] [CrossRef]
  20. Wierzbicki, T.; Bao, Y.; Lee, Y.W.; Bai, Y. Calibration and evaluation of seven fracture models. Int. J. Mech. Sci. 2005, 47, 719–743. [Google Scholar] [CrossRef]
  21. Bai, Y.; Wierzbicki, T. A new model of metal plasticity and fracture with pressure and Lode dependence. Int. J. Plast. 2008, 24, 1071–1096. [Google Scholar] [CrossRef]
  22. Bai, Y.; Wierzbicki, T. Application of extended Mohr-Coulomb criterion to ductile fracture. Int. J. Fract. 2010, 161, 1–20. [Google Scholar] [CrossRef]
  23. Lou, Y.; Huh, H. Extension of a shear-controlled ductile fracture model considering the stress triaxiality and the Lode parameter. Int. J. Solids Struct. 2013, 50, 447–455. [Google Scholar] [CrossRef] [Green Version]
  24. Wen, H.; Mahmoud, H. New model for ductile fracture of metal alloys. I: Monotonic loading. J. Eng. Mech. 2016, 142, 04015088. [Google Scholar] [CrossRef]
  25. Hu, Q.; Li, X.; Han, X.; Chen, J. A new shear and tension based ductile fracture criterion: Modeling and validation. Eur. J. Mech. A/Solids 2017, 66, 370–386. [Google Scholar] [CrossRef]
  26. Mu, L.; Zang, Y.; Wang, Y.; Li, X.L.; Araujo Stemler, P.M. Phenomenological uncoupled ductile fracture model considering different void deformation modes for sheet metal forming. Int. J. Mech. Sci. 2018, 141, 408–423. [Google Scholar] [CrossRef]
  27. Quach, H.; Kim, J.J.; Nguyen, D.T.; Kim, Y.S. Uncoupled ductile fracture criterion considering secondary void band behaviors for failure prediction in sheet metal forming. Int. J. Mech. Sci. 2020, 169, 105297. [Google Scholar] [CrossRef]
  28. Park, S.J.; Cerik, B.C.; Choung, J. Comparative study on ductile fracture prediction of high-tensile strength marine structural steels. Ships Offshore Struct. 2020. [Google Scholar] [CrossRef]
  29. Cerik, B.C.; Park, S.J.; Choung, J. Ductile fracture modeling of DH36 grade steels. In Proceedings of the 37th International Conference on Ocean, Offshore and Arctic Engineering, Madrid, Spain, 17–22 June 2018; ASME: New York, NY, USA, 2018; p. V11AT12A008. [Google Scholar] [CrossRef]
  30. Cerik, B.C.; Lee, K.; Park, S.J.; Choung, J. Simulation of ship collision and grounding damage using Hosford-Coulomb fracture model for shell elements. Ocean Eng. 2019, 173, 415–432. [Google Scholar] [CrossRef]
  31. Cerik, B.C.; Ringsberg, J.W.; Choung, J. Revisiting MARSTRUCT benchmark study on side-shell collision with a combined localized necking and stress-state dependent ductile fracture model. Ocean Eng. 2019, 187, 106173. [Google Scholar] [CrossRef]
  32. Cerik, B.C.; Park, B.; Park, S.J.; Choung, J. Modeling, testing and calibration of ductile crack formation in grade DH36 ship plates. Mar. Struct. 2019, 66, 27–43. [Google Scholar] [CrossRef]
  33. Cerik, B.C.; Choung, J. On the prediction of ductile fracture in ship structures with shell elements at low temperatures. Thin-Walled Struct. 2020. [Google Scholar] [CrossRef]
  34. Cerik, B.C.; Park, S.J.; Choung, J. Use of localized necking and fracture as a failure criterion in ship collision analysis. Mar. Struct. 2020, 73, 102787. [Google Scholar] [CrossRef]
  35. Cerik, B.C.; Choung, J. Rate-dependent combined necking and fracture model for predicting ductile fracture with shell elements at high strain rates. Int. J. Impact Eng. 2020, 146, 103697. [Google Scholar] [CrossRef]
  36. Park, S.J.; Lee, K.; Cerik, B.C.; Choung, J. Ductile fracture prediction of EH36 grade steel based on Hosford-Coulomb model. Ships Offshore Struct. 2019, 14, 219–230. [Google Scholar] [CrossRef]
  37. Gruben, G.; Hopperstad, O.; Børvik, T. Evaluation of uncoupled ductile fracture criteria for the dual-phase steel Docol 600DL. Int. J. Mech. Sci. 2012, 62, 133–146. [Google Scholar] [CrossRef] [Green Version]
  38. Peirs, J.; Verleysen, P.; Degrieck, J. Novel technique for static and dynamic shear testing of Ti6Al4V sheet. Exp. Mech. 2012, 52, 729–741. [Google Scholar] [CrossRef] [Green Version]
  39. Sung, J.H.; Kim, J.H.; Wagoner, R.H. A plastic constitutive equation incorporating strain, strain-rate, and temperature. Int. J. Plast. 2010, 26, 1746–1771. [Google Scholar] [CrossRef]
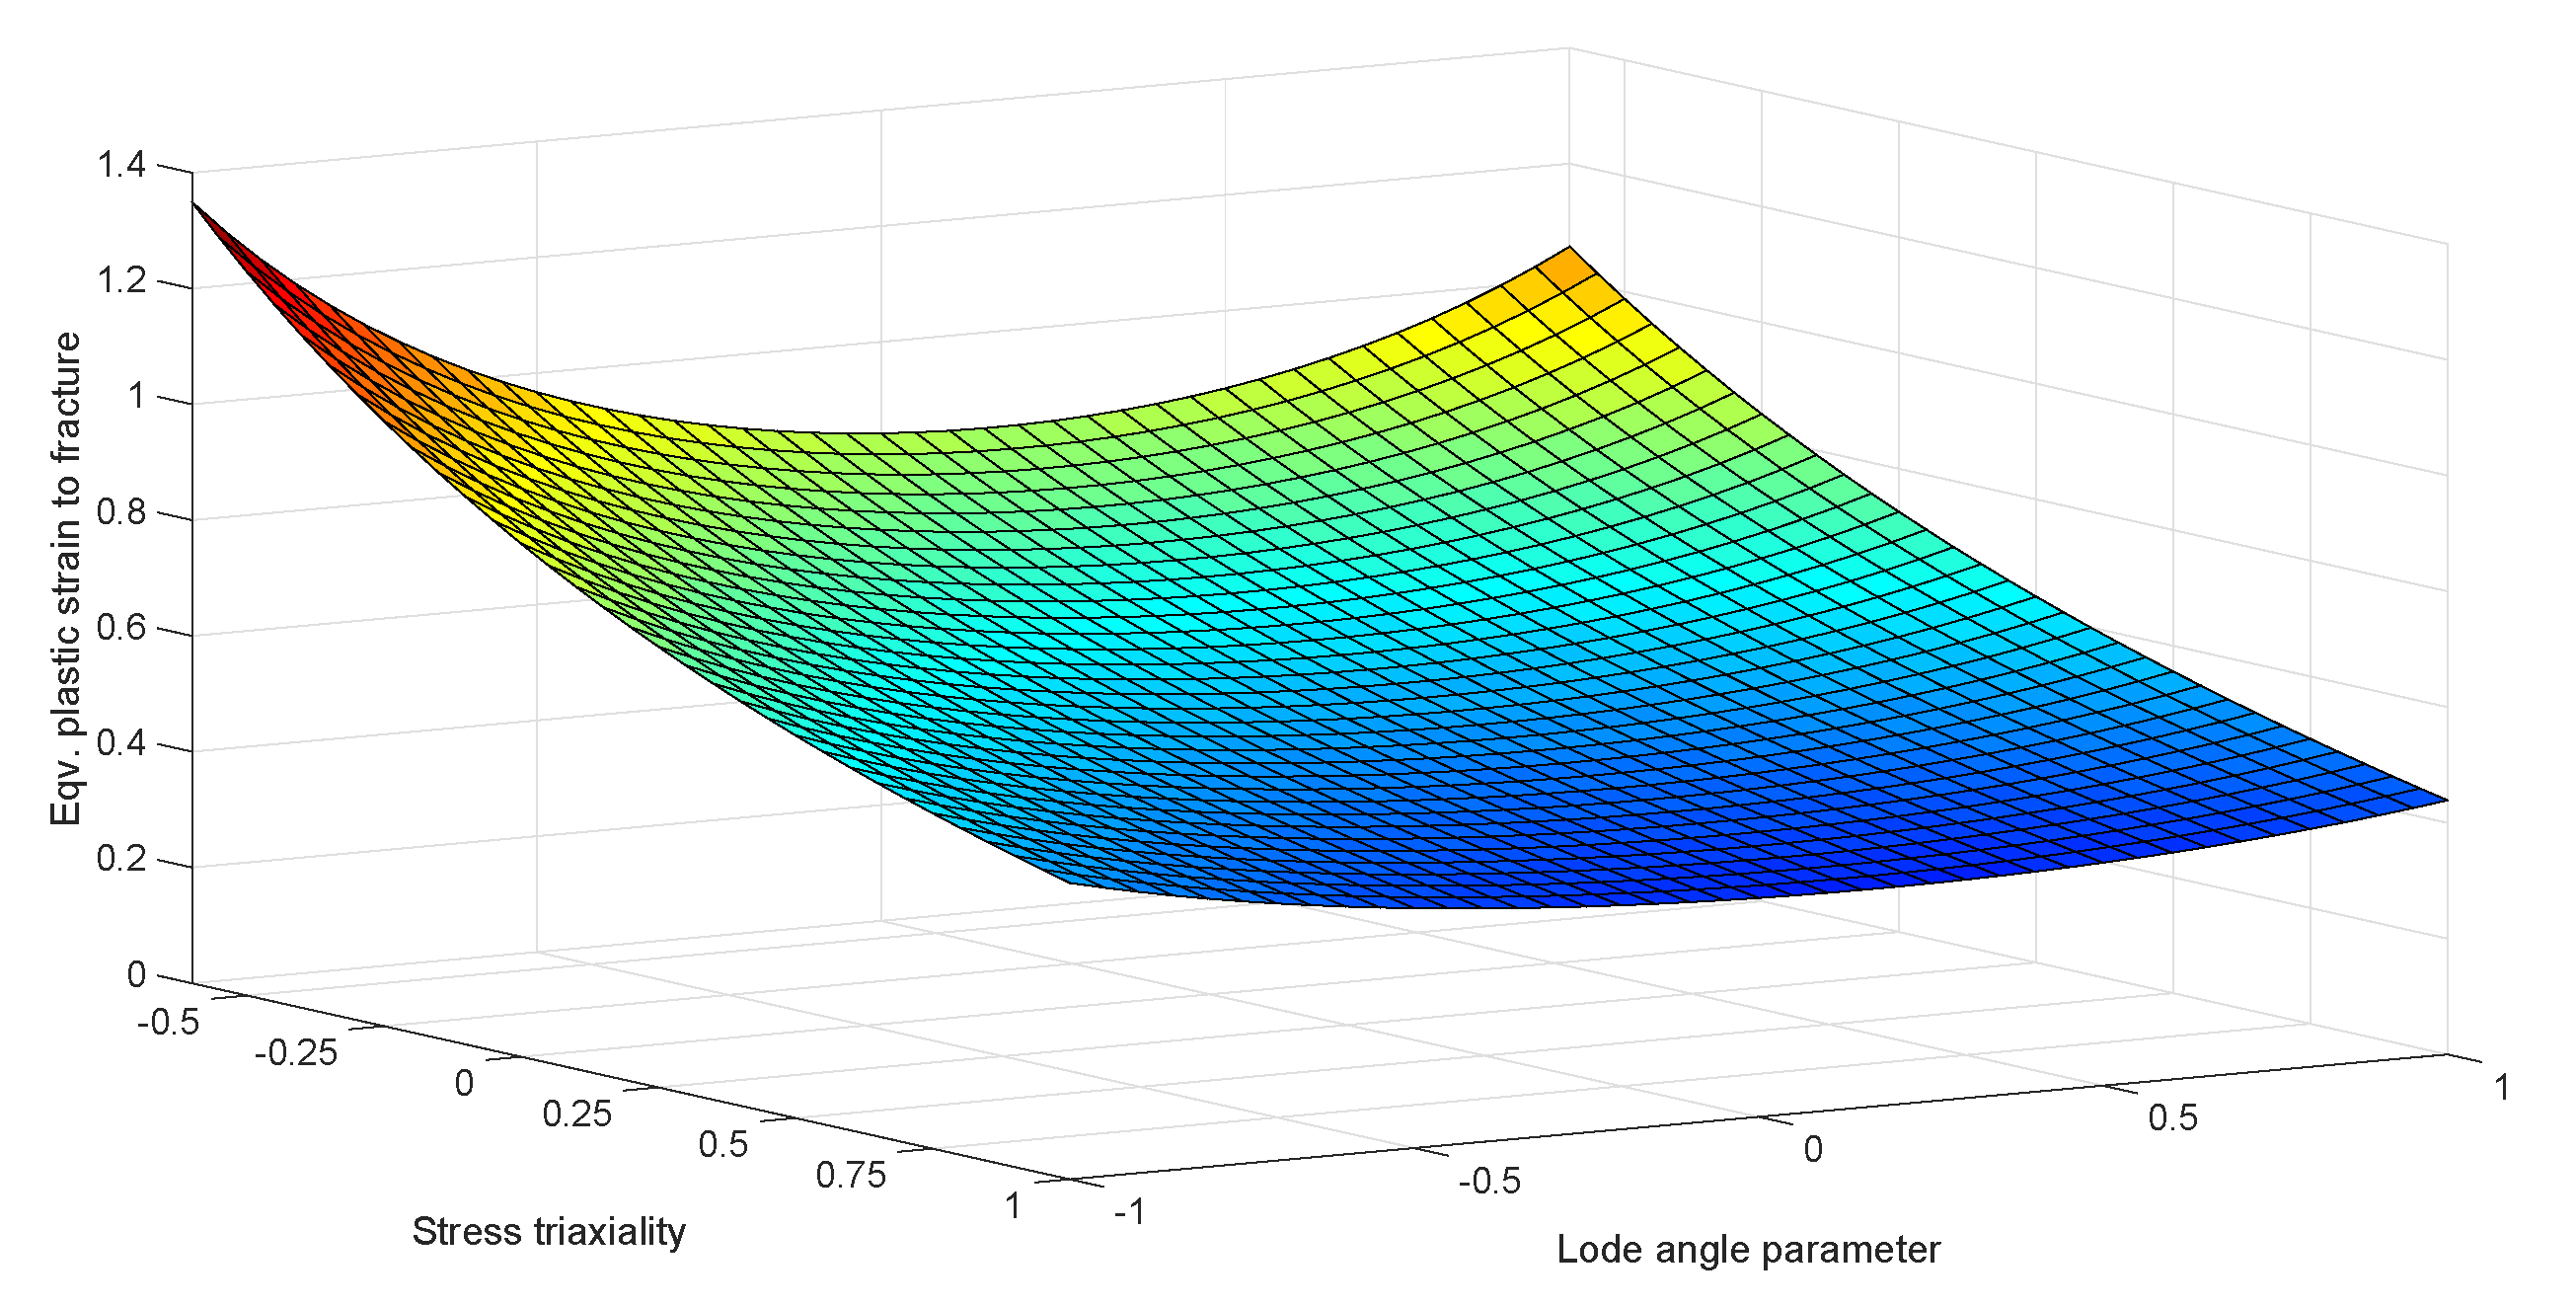
Figure 1. 3D fracture locus obtained using the proposed model with the parameters C 1 = 0.85 , C 2 = 2.0 , C 3 = 0.2 .
Applsci 10 07034 g001
Figure 2. Stress triaxiality dependence of the proposed fracture model for C 1 = 0.85 , C 2 = 2.0 , C 3 = 0.2 .
Applsci 10 07034 g002
Figure 3. Lode angle parameter dependence of the proposed fracture model for C 1 = 0.85 , C 2 = 2.0 , C 3 = 0.2 .
Applsci 10 07034 g003
Figure 4. Effect of C 1 on the proposed fracture model for C 2 = 2.0 , C 3 = 0.2 .
Applsci 10 07034 g004
Figure 5. Effect of C 2 on the proposed fracture model for C 1 = 0.8 , C 3 = 0.2 .
Applsci 10 07034 g005
Figure 6. Effect of C 3 on the proposed fracture model for C 1 = 0.8 , C 2 = 2.0 .
Applsci 10 07034 g006
Figure 7. Shape of the cut-off region of the proposed fracture model for C 1 = 0.6 .
Applsci 10 07034 g007
Figure 8. Experimentally obtained true stress-equivalent plastic strain data.
Applsci 10 07034 g008
Figure 9. Test specimen geometries (dimensions in mm).
Applsci 10 07034 g009
Figure 10. Calibrated strain hardening curves of A, AH36 and DH36 steel grades.
Applsci 10 07034 g010
Figure 11. Comparison of the measured and simulated force-displacement curves of the NT20 specimen.
Applsci 10 07034 g011
Figure 12. Comparison of force-displacement curves for the A grade steel specimens.
Applsci 10 07034 g012
Figure 13. Comparison of numerically predicted and experimentally obtained force displacement curves for the AH36 grade steel specimens.
Applsci 10 07034 g013
Figure 14. Loading paths to fracture initiation.
Applsci 10 07034 g014
Figure 15. Calibrated 3D fracture loci of the steel grades considered.
Applsci 10 07034 g015
Figure 16. Calibrated 2D fracture loci of the steel grades considered.
Applsci 10 07034 g016
Figure 17. Accuracy of the prediction of fracture initiation using the proposed model.
Applsci 10 07034 g017
Table 1. Chemical composition of the tested steels (wt.%).
GradeCSiMnPSCuCrNiMoAlNbVTi
A0.13950.1830.5110.01010.0042--------
AH360.160.341.40.0190.0050.030.020.010.00300.0020.0030.001
DH360.12540.2721.4950.01140.00380.0850.050.0900.0420.0290.0020.016
Table 2. Identified hardening law parameters.
GradeA (MPa) ε 0 n k 0 (MPa)Q (MPa) β α
A8480.0129140.2627270.5312.411.490.65
AH3610530.0054070.2194335.0340.222.140.52
DH3610580.0079860.1794444.7293.121.890.55
Table 3. Identified fracture model parameters.
Grade C 1 C 2 C 3
A0.0690.6481.154
AH360.8823.8600.148
DH360.5291.3300.633