Article

Automatic Contraction Detection Using Uterine Electromyography

by
Filipa Esgalhado
1,2,
Arnaldo G. Batista
1,3,*,
Helena Mouriño
4,
Sara Russo
1,
Catarina R. Palma dos Reis
5,6,
Fátima Serrano
5,6,
Valentina Vassilenko
1,2 and
Manuel Duarte Ortigueira
1,3
1
NOVA School of Science and Technology, NOVA University Lisbon, 2829-516 Caparica, Portugal
2
NMT, S.A., Parque Tecnológico de Cantanhede, Núcleo 04, Lote 3, 3060-197 Cantanhede, Portugal
3
Center of Technology and Systems—UNINOVA, NOVA School of Science and Technology—NOVA University Lisbon, 2829-516 Caparica, Portugal
4
Faculdade de Ciências, Universidade de Lisboa, Campo Grande, 1749-016 Lisboa, Portugal
5
Maternidade Alfredo da Costa, Rua Viriato 1, 1050-170 Lisboa, Portugal
6
Nova Medical School, Faculty of Medical Sciences, Universidade Nova de Lisboa, 1169-056 Lisboa, Portugal
*
Author to whom correspondence should be addressed.
Appl. Sci. 2020, 10(20), 7014; https://doi.org/10.3390/app10207014
Submission received: 14 September 2020 / Revised: 2 October 2020 / Accepted: 4 October 2020 / Published: 9 October 2020
(This article belongs to the Section Applied Biosciences and Bioengineering)

Abstract

:
Electrohysterography (EHG) is a promising technique for pregnancy monitoring and preterm risk evaluation. It allows for uterine contraction monitoring as early as the 20th gestational week, and it is a non-invasive technique based on recording the electric signal of the uterine muscle activity from electrodes located in the abdominal surface. In this work, EHG-based contraction detection methodologies are applied using signal envelope features. Automatic contraction detection is an important step for the development of unsupervised pregnancy monitoring systems based on EHG. The exploratory methodologies include wavelet energy, Teager energy, root mean square (RMS), squared RMS, and Hilbert envelope. In this work, two main features were evaluated: contraction detection and its related delineation accuracy. The squared RMS produced the best contraction (97.15 ± 4.66%) and delineation (89.43 ± 8.10%) accuracy and the lowest false positive rate (0.63%). Despite the wavelet energy method having a contraction accuracy (92.28%) below the first-rated method, its standard deviation was the second best (6.66%). The average false positive rate ranged between 0.63% and 4.74%—a remarkably low value.

Graphical Abstract

1. Introduction

The intrauterine pressure (IUP) method and the tocogram (TOCO) have been used for uterine contraction monitoring. Both methods present limitations regarding the assessment of uterine contraction properties and characteristics [1,2,3]. The gold standard for measuring the uterine pressure is the IUP, which provides the best information concerning uterine contractions since it is based on a pressure sensor inserted in the amniotic space. The IUP is not a routine pregnancy monitoring procedure, considering that it can only be used after membrane rupturing. As a consequence, it is mainly used in selected cases, such as when the subject is obese or is already in labor [4,5].
On the other hand, the TOCO technique, based on a strain gauge, is widely used in pregnancy and labor monitoring. The method remains unchanged since the late 1960′s. The TOCO presents a mismatch between amplitude and the strength of the uterine contraction, which leads to decreased predictive value. The TOCO acquisition also poses a problem for subjects with body mass index (BMI) higher than 30 [2]. The technique, which is often used as a uterine contraction frequency meter, is not considered an adequate methodology for routine preterm risk evaluation.
The electrohysterogram (EHG) is an alternative to the TOCO and IUP methods, and it is obtained noninvasively through electrodes placed on the abdominal surface [6,7,8,9]. The EHG has been considered an appropriate tool for long-term pregnancy and childbirth monitoring due to its non-invasive nature. Besides, it is easily obtained and can be used as early as the 20th week of gestation. Although the BMI has been reported as having an imperceptible impact on the EHG, one of its main advantages [10,11], another study [12] reports a fat-induced low-pass filtering effect. The EHG is a signal with increased complexity that often requires the application of advanced signal processing analysis techniques. There are no standards regarding electrode location, acquisition system, or feature analysis parameters [5,13,14]. Research in this field has grown with the introduction of more powerful algorithms enabled by the ever-increasing platforms’ computational power. Uterine contractions are present from as early as 20 weeks of gestational age, and they may be detected through maternal perception, TOCO, or EHG. These early pregnancy contractions may have low mechanical impact due to the poorly coordinated uterine cell-to-cell communications, and therefore may be missing in the TOCO and present in the EHG. They are ineffective as far as labor is concerned, but can convey important information in the context of preterm risk evaluation or generally for pregnancy monitoring [15,16,17,18].
As labor approaches, a preparatory process takes place in the uterine muscle, where an increase of cell-to-cell coupling is present [16,17,18]. This translates into more expressive contraction levels due to the synchronicity arising from the structural and functional cell coupling alterations [19]. It stands out that uterine contractions detected through the EHG commonly present an associated energy burst. These energy bursts above the basal activity are used herein as a contraction detector feature.
Several studies have been performed with different contraction detection methodologies in the EHG signal. Khalil et al. [20] used neural networks and wavelet analysis to perform contraction detection and classification for four event classes: Alvarez, Contractions, Foetal Movements and LDBF (Longue Durée Basse Fréquence) [21], with an overall accuracy of 80%. Horoba et al. [22] used a low-pass filter and a root mean square (RMS) computation over a 60 s window to track uterine contractions in the EHG. In this study, 87% of EHG contractions and 96% of the relative TOCO events were regarded as consistent. The same authors [23] outlined the importance of spectral analysis in the development of the EHG research. Chendeb [24] investigated the best wavelet packet tree for EHG components detection. A frequency content criterion was a central parameter. Later, Chendeb et al. [7] used wavelet packets for the same above-mentioned classes as in [20], using as the main criteria its frequential content. Wavelet packet nodes were allocated to the defined EHG contraction classes. A best basis was obtained and shown to outperform the discrete wavelet transform. Multilayer perceptron and support vector machine were used as classification methods, producing a detection rate of over 85%. Muszynski et al. [25] used a nonlinear correlation coefficient between two consecutive horizontally bipolar EHG channels as a contraction delineator. The reported detection rates were 62.5% (full detections), 37.5% (partial detections), and 100% (total detections).
In another work, Rooijakkers et al. [26] compared the IUP estimation using the RMS, the first moment of the spectrogram, and the Teager operator. It was found that the first moment of the spectrogram was the best estimation method, but also the most computationally demanding. The RMS and the Teager operator turned out to be the most computationally efficient, despite not being as accurate as the spectrogram. Furdea et al. [27] used uterine magnetomyographic recordings to delineate contractions through the application of the Hilbert transform along with an affinity propagation clustering technique. Horoba et al. [3] pinpointed the challenges about the uterine contractions detection in the TOCO, which can be related to the same procedure done on the EHG. These authors used four algorithms to determine relevant basal tones and detection levels, which were able to detect above 91% of all the referenced contractions, where less than 7% of the detected contractions were false positives. In one of the referred algorithms, contractions exceeding three minutes were submitted to reanalysis. Zaylaa et al. [13] introduced enhancements on the dynamic cumulative sum (DCS) method, using a data fusion procedure, thus improving contraction detection and segmentation. Peng et al. [28] manually extracted 7136 uterine contractions from the EHG and the same number of non-contractile events, from which a convolutional neural network (CNN) model was obtained. Liu et al. [29] used the EHGs from 20 pregnant women to report that the RMS and selected parameters of wavelet decompositions were significantly higher for uterine contraction events both in labor and non-labor cases.
For the presented work, we assumed that all contractions show an energy burst above the uterine basal signal, resulting in an elevated myometrial activity [17]. It has been demonstrated [30] that at least three different contraction types are present in the EHG, which may be related to different uterine electrophysiologic events, such as delivery triggers. Since the EHG is a non-invasive technique, it can be used for long-term pregnancy monitoring, as part of ambulatory and home-based systems associated with warning labels and automatic clinical reports. The aim of this work is to present and compare five different energy-abased EHG contraction detection methods that can be used in applications that require the input of automatically identified and delineated uterine contractions.

2. Materials and Methods
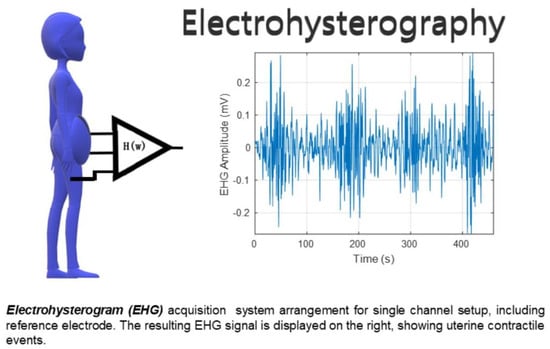
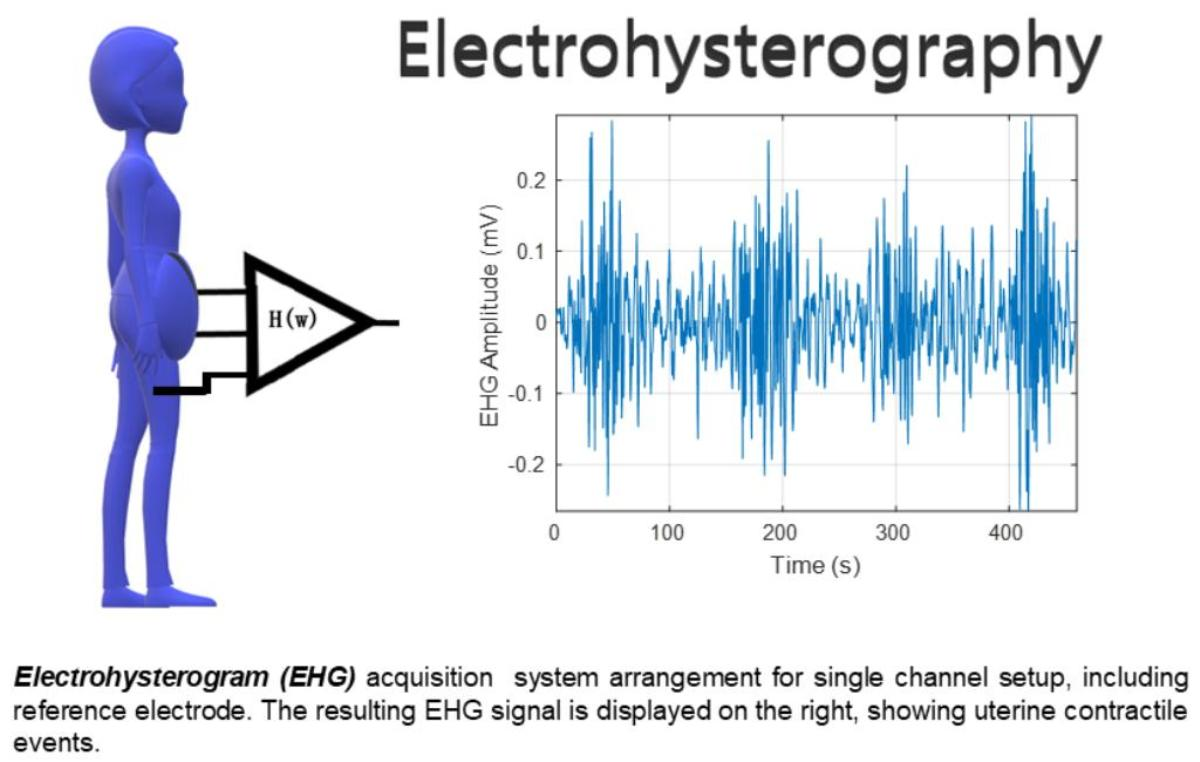
A clarification will be made regarding the semantics using power and energy descriptors in this paper. Working with sliding windows to which an operator is applied will produce different variable units. For instance, a sliding window applied over a signal using the RMS operator will produce a standard deviation value for signals with zero mean. If the same window is applied to the squared values of the signal, the result will be a power vector. If a sliding window is applied over this power vector, an energy vector will be obtained. In this work the words “power” and “energy” will be used interchangeably for the sake of simplicity.

2.1. Data

The EHG signals used in this work are from the Icelandic 16-electrode EHG database, and are available from PhysioNet [31]. The Icelandic database has 122 recordings from 45 pregnant subjects, several of whom did more than one acquisition session. This database has 4 cases of preterm birth. All the recordings were performed in the third gestational trimester. The data were recorded using 16 electrodes in a 4-by-4 grid [31]. In the present study, a bipolar channel was used. Its main advantage is the reduction of the common mode noise found in maternal electrocardiograms and the signal interference of respiratory movements. The selected bipolar channel was chosen as one that allows for a wider coverage of the uterine muscle: 1–16 or 4–13. The selected arrangement for this study was the channel 4–13, as shown in Figure 1 [32,33]. The data was processed with MATLAB® version 2019a and the respective Statistics and Machine Learning, Wavelet, and Signal Processing Toolboxes. The pre-processing steps included a sampling frequency rate reduction from the original 200 Hz to 4 Hz, a 20-s signal borders trimming to eliminate onset and offset transients, and a wavelet packet passband filtering between 0.1 and 1 Hz where most of the relevant EHG energy rests [6,18,34]. Sixteen percent of the Icelandic database subjects were selected in order to cover the available range of the gestational weeks recording times: 29 to 41. None of these cases represent labor subjects. A total of 2382 contractions obtained from 20 subjects were scored for the five energy methods.

2.2. Data Contraction Detection Methods

As mentioned earlier, the chosen methodology for detecting contractions was to use the associated energy bursts as a feature. These intervals of increased energy have a large variability that should be reduced in order to obtain a smoothed version over which the contraction detection and delineation could be performed. Five different methods were applied: wavelet energy, Teager energy, RMS, squared RMS, and Hilbert envelope, for which a brief description is provided below. For all of these methods except the wavelet energy, a smoothing window length of 70 s was selected upon on the inspection of a substantial number of application cases and evaluating its compliance with the values referred to in the relevant bibliographic references [14,34,35,36]. Knowing that a contraction duration typically spans from half a minute to several minutes, the selected window length represents an adequate resolution compromise.

2.2.1. Wavelet Energy

The scalogram of x ( s ) at time t and scale a   ( a > 0 ) , S C ( t , a ) , is the squared modulus of the continuous wavelet transform [5]:
S C ( t , a ) = 1 | a |   | + x ( s )   h *   ( s t a )   d s | 2
where h * ( s ) is the complex conjugate of the mother wavelet function, t is the time, and a   ( a > 0 ) is the scale parameter. The time marginal of a time-frequency representation is given by:
m t ( t ) = + S C ( t , f ) d f
where f is the frequency. In this context, the time marginal represents a wavelet variance estimator of the scalogram. The selected wavelet type in this work was the complex Morlet wavelet (cmor25-1). This mother wavelet has also been found to be an acceptable compromise, regarding bandwidth and length, for the contraction delineation [34].

2.2.2. Teager Energy Operator

The Teager energy operator (TE) [37] is an energy estimator that has been used in the context of EHG processing for IUP calculation [35]. The TE provides a representation similar to the mechanical process of a myometrial contraction [26]. The TE operator, denoted by Φ , is a nonlinear transformation of an input signal x ( t ) . In the continuous-time case, it is given by:
Φ [ x ( t ) ] = ( d x ( t ) / d t ) 2 x ( t )   d 2 x ( t ) d t 2
In the discrete domain, the TE operator takes the form:
Φ [ x ( n ) ] = x ( n ) 2 x ( n 1 ) x ( n + 1 )
where n is the sample index in x ( t ) . A smoothing process is required in order to reduce the transformed signal Φ [ x ( n ) ] variance, which is done using a sliding window moving average filter:
[ Φ [ x ( n ) ] ] s m o o t h = 1 M + 1   m = M / 2 M / 2 Φ [ x ( m + n ) ]
The success of the application of this operator in the EHG for energy estimation will depend on the M value [26].

2.2.3. Root Mean Square

The RMS [22,23] is a statistical concept that measures how far the signal differs from the mean—that is, the standard deviation of the input signal. In EHG, the mean value is zero due to the constant component being removed from the data using a high-pass filter. Therefore, the RMS is obtained by:
R M S =     1 n   i = 0 n x i 2
where x i is the input signal sample, i is the sample number, and n is the number of samples in the window. Typically, the application of the RMS operator to EHG consists of a sliding window operation. The same window length of 70 s was used for the reasons already presented above.

2.2.4. Squared RMS

The Squared RMS of a signal is related to its variance. It must be noted that the used signals have zero mean. It is a power estimation which might contribute to the contraction detection and delineation accuracy by increasing the peak/valley amplitude differential.
S q u a r e d   R M S =   1 n   i = 0 n x i 2

2.2.5. Hilbert Envelope

The Hilbert transform [38] returns a complex helical sequence, sometimes called the analytic signal, from a real data sequence. The Hilbert transform is useful in calculating the instantaneous attributes of a time series, especially the amplitude and the instantaneous amplitude and frequency. The instantaneous amplitude is the absolute value of the complex Hilbert transform.
The Hilbert transform is a useful method for performing time-frequency analysis of nonlinear and nonstationary data. Given the Fourier transform of f ( t ) as S   ( ω ) :
S   ( ω ) = f ( t ) e j ω t d t
and considering z ( t ) as:
z ( t ) = 1 π   0 S   ( ω ) e j ω t   d t
By replacing Equation (8) into (9) after some mathematical manipulation, the following is obtained:
z ( t ) = f ( t ) +   j π   f ( t ) t t d t
z ( t )   is called the analytic signal of f ( t ) . The real part of the second term of the right side of (10) is the Hilbert transform of the signal f ( t ) ,   H [ f ( t ) ] :
H [ f ( t ) ] =   1 π   f ( t ) t t d t
Being the analytical signal given by:
A S   [ f ( t ) ] = z ( t ) = f ( t ) + j H [ f ( t ) ]
The Hilbert envelope (HE) is the absolute value A S   [ f ( t ) ] .

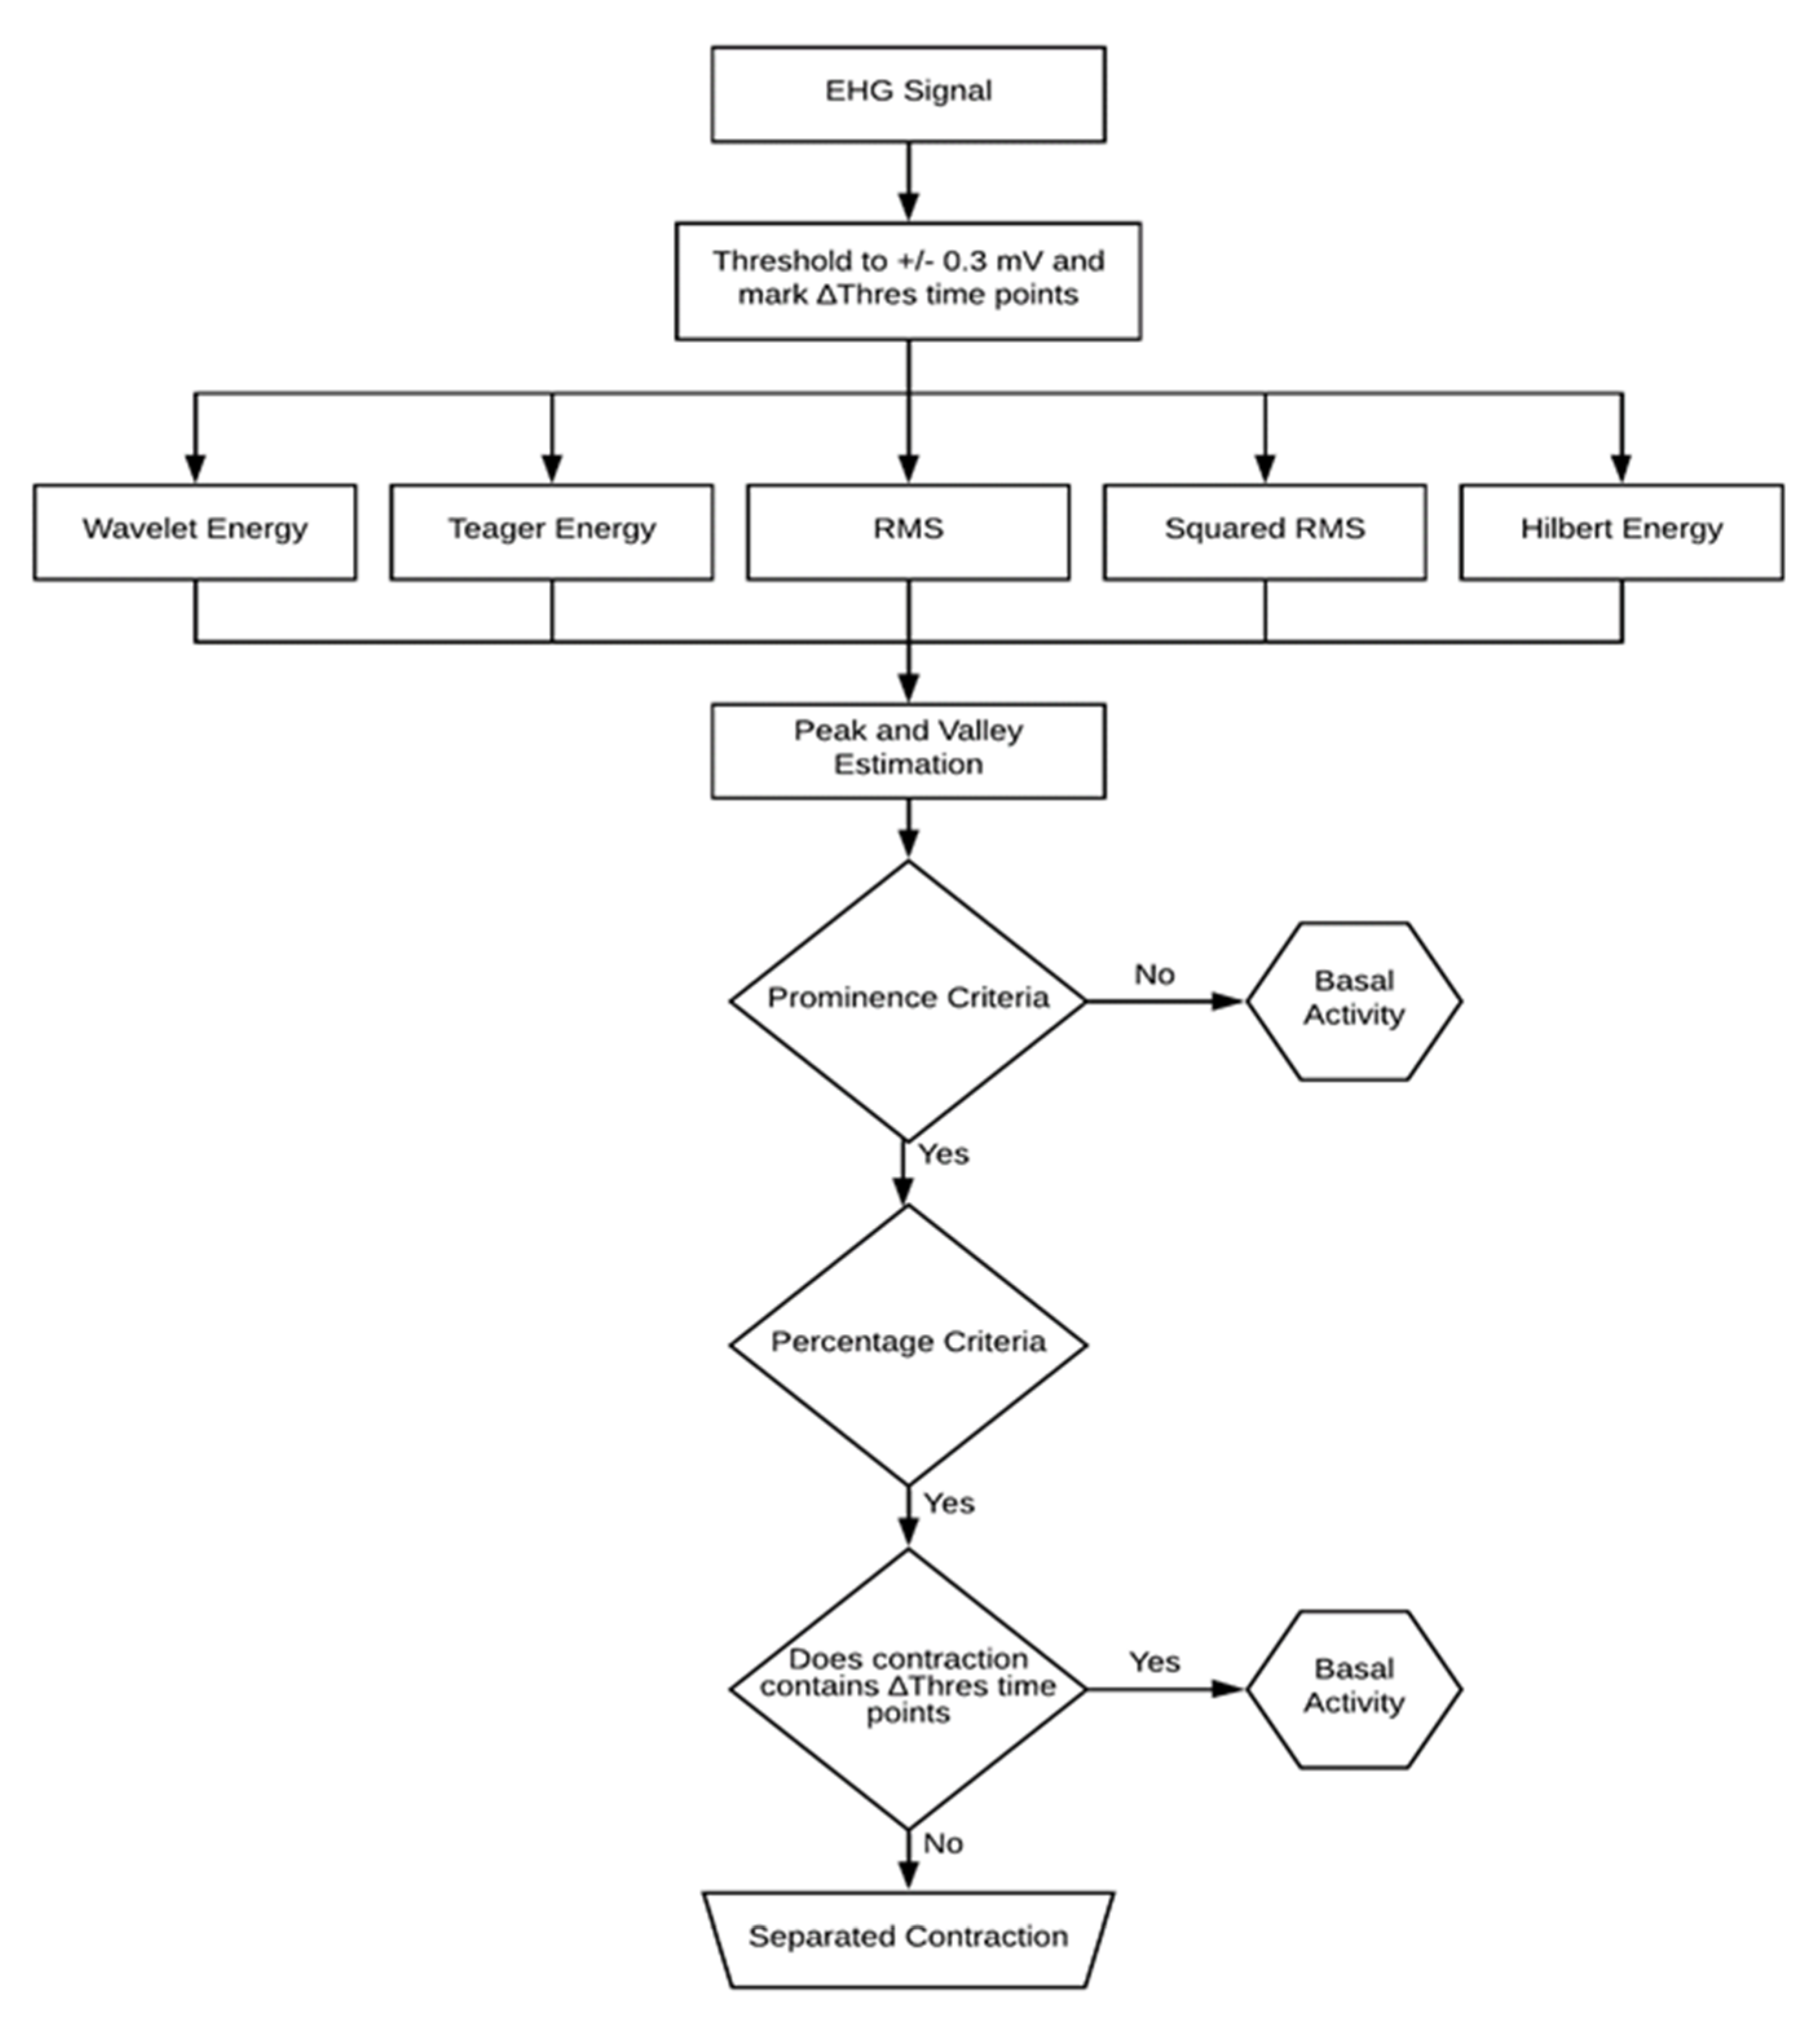
2.3. Contraction Detection Algorithm

In the EHG signal, the contractions stand out from the basal uterine activity due to the existence of energy bursts. Figure 2 displays the flowchart diagram of the contraction detection algorithm. The first step is to mark the time points for which the EHG exceeds 0.3 mV [30]. Values above this threshold are typically considered artefacts. Subsequently, all the detected contractions containing these time points were discarded.
A 70-s sample-by-sample overlapping sliding window (as mentioned in Section 2.2) operation is performed over the EHG signal using the RMS computing method. This time series is squared in order to obtain the squared RMS estimation. As far as the TE and the HE are concerned, the smoothing window operates on the respective estimations, and thus acts as a low-pass filter.
The next step is to perform a peak and valley detection over the energy estimations using a prominence criterion of 3% of the obtained differential value. This value was reached upon on a trial-and-error survey. Failing this criterion would render the segment classification as basal uterine activity. This prominence value was optimized by visually analyzing the detector behavior over a batch of EHG contractions. A non-conservative approach was used for the delineation process. It was considered that baseline leakage into the contraction would negatively impact its parameters compared to the other way around. As such, a 50% threshold was applied upon on a previous trial inspection. The contraction onset and offset are defined by 50% of the amplitude swing between the peak value and the respective left and right valley values. Since these threshold criteria are taken relatively to the basal uterine signal floor, no initial calibration is necessary. In the contraction detection algorithm, the first and the last detected contractions are disregarded to account for the possibility of the recording process starting or ending midway through a contractile event.

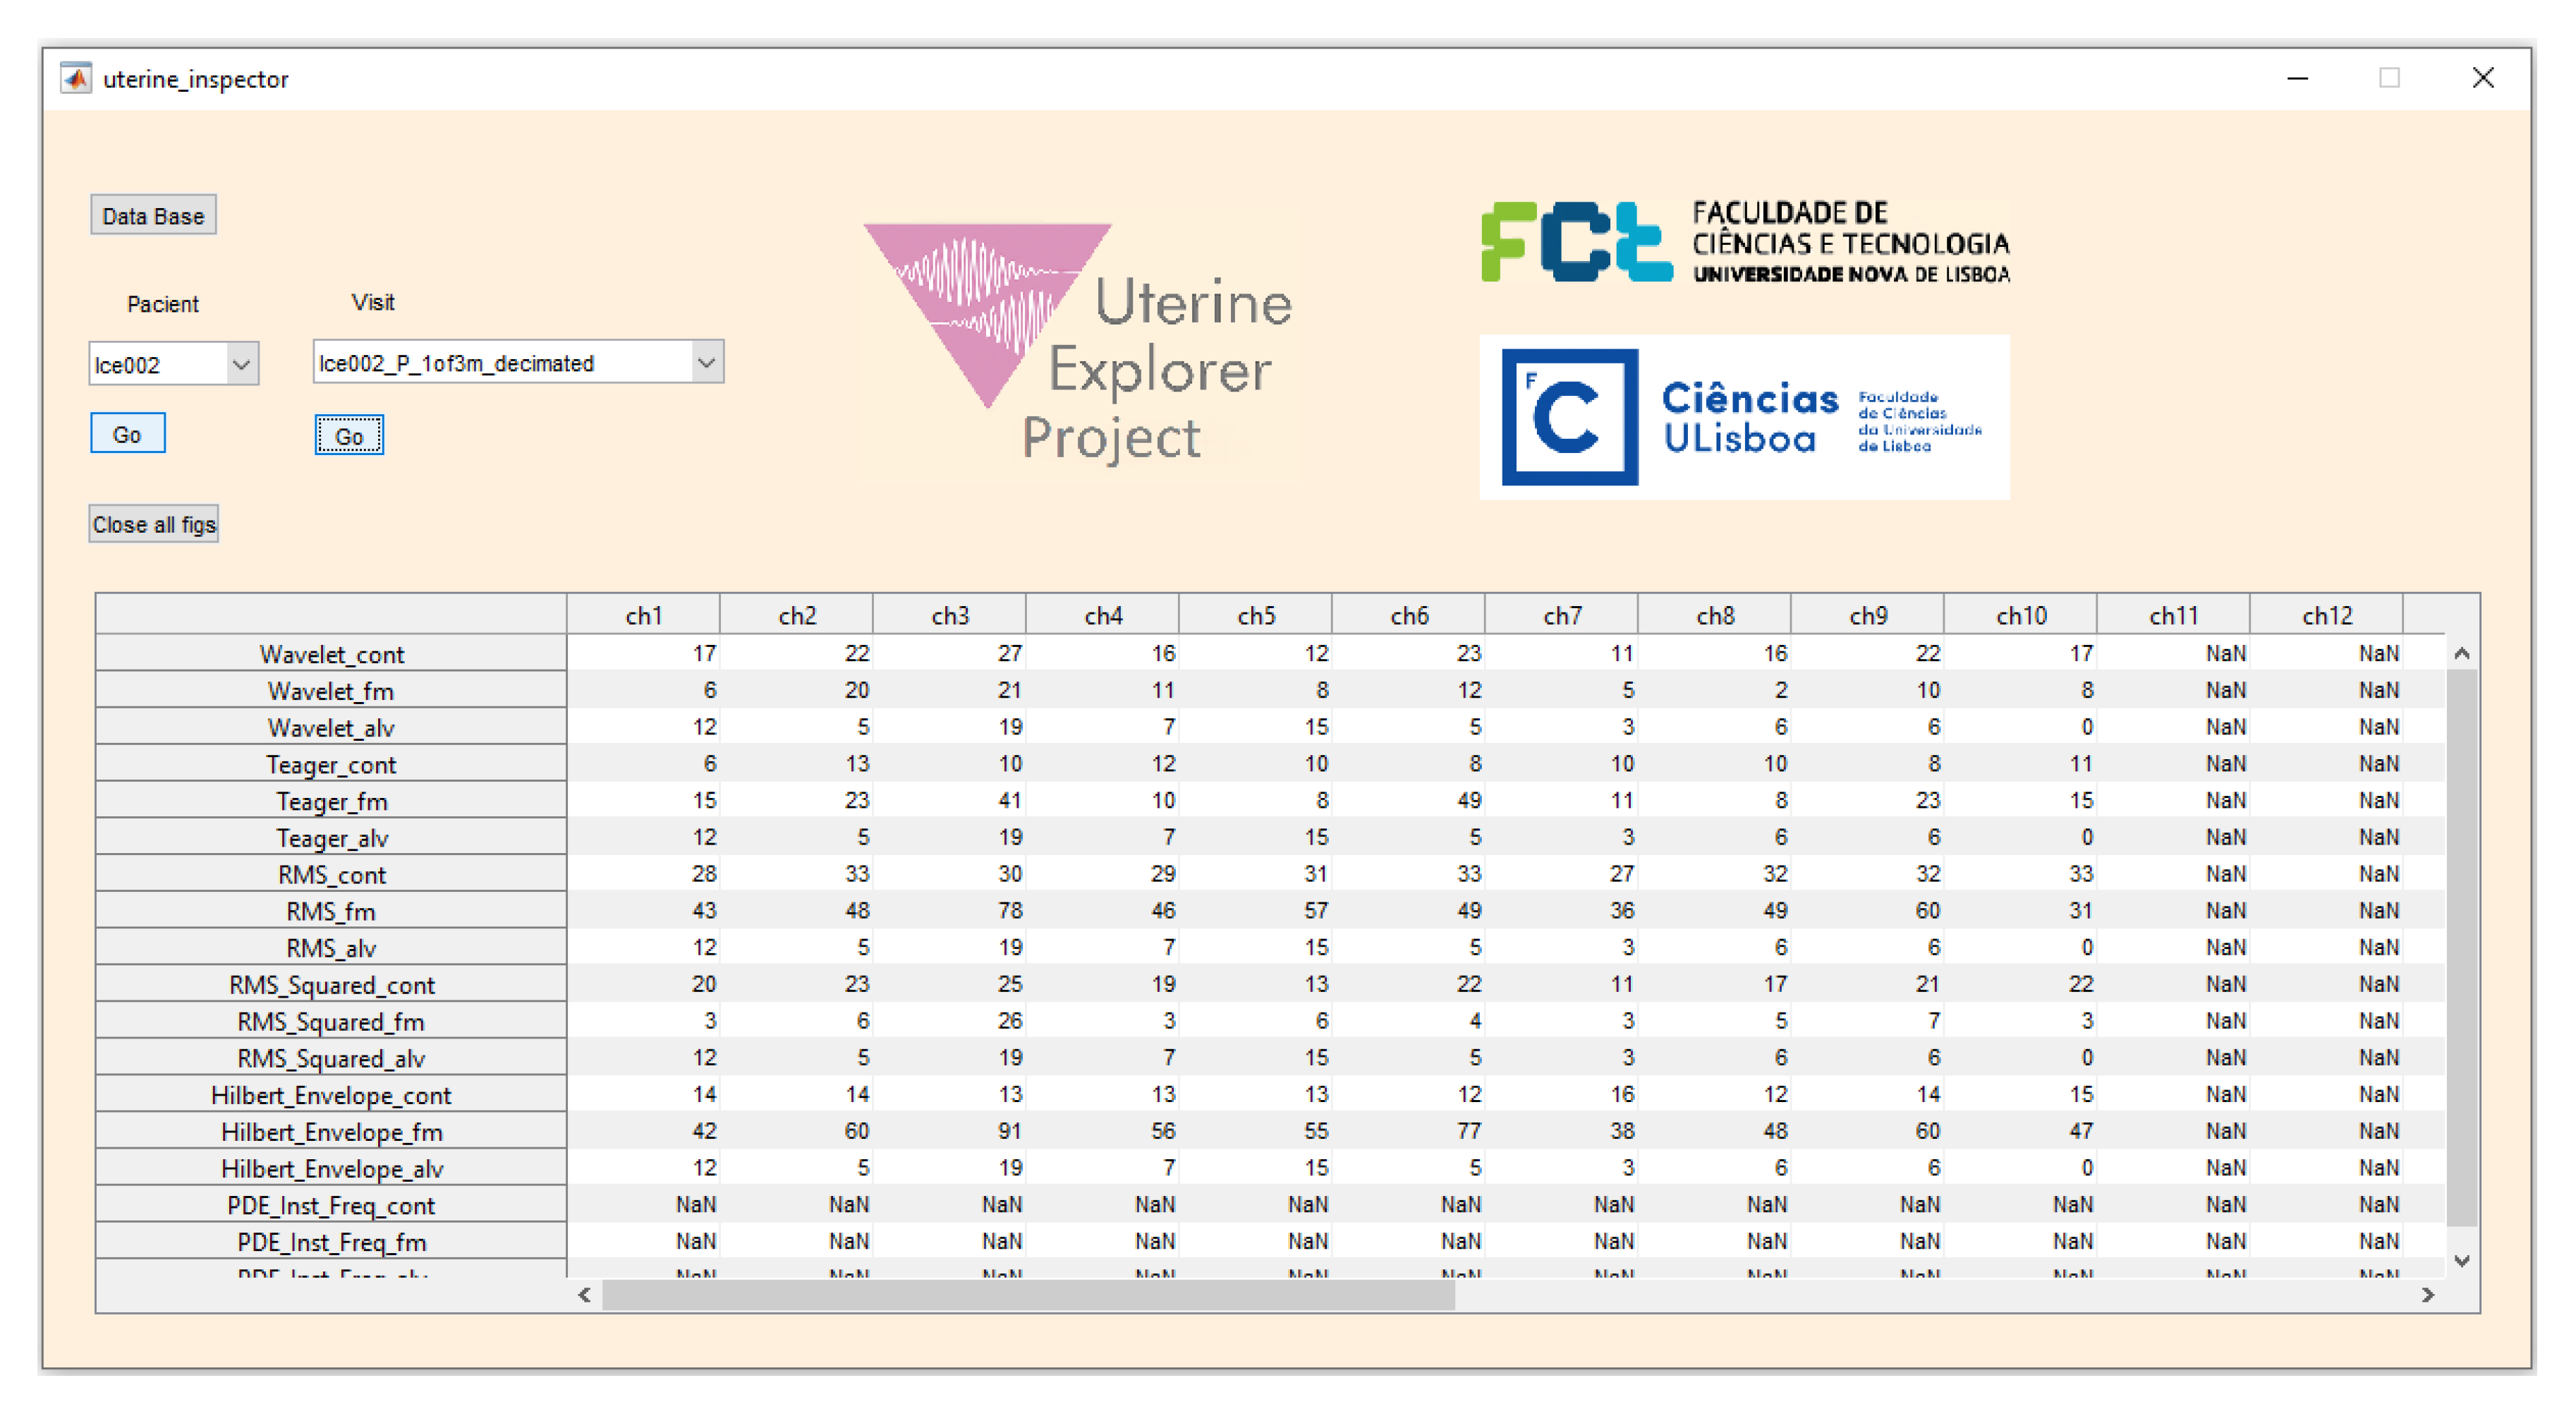
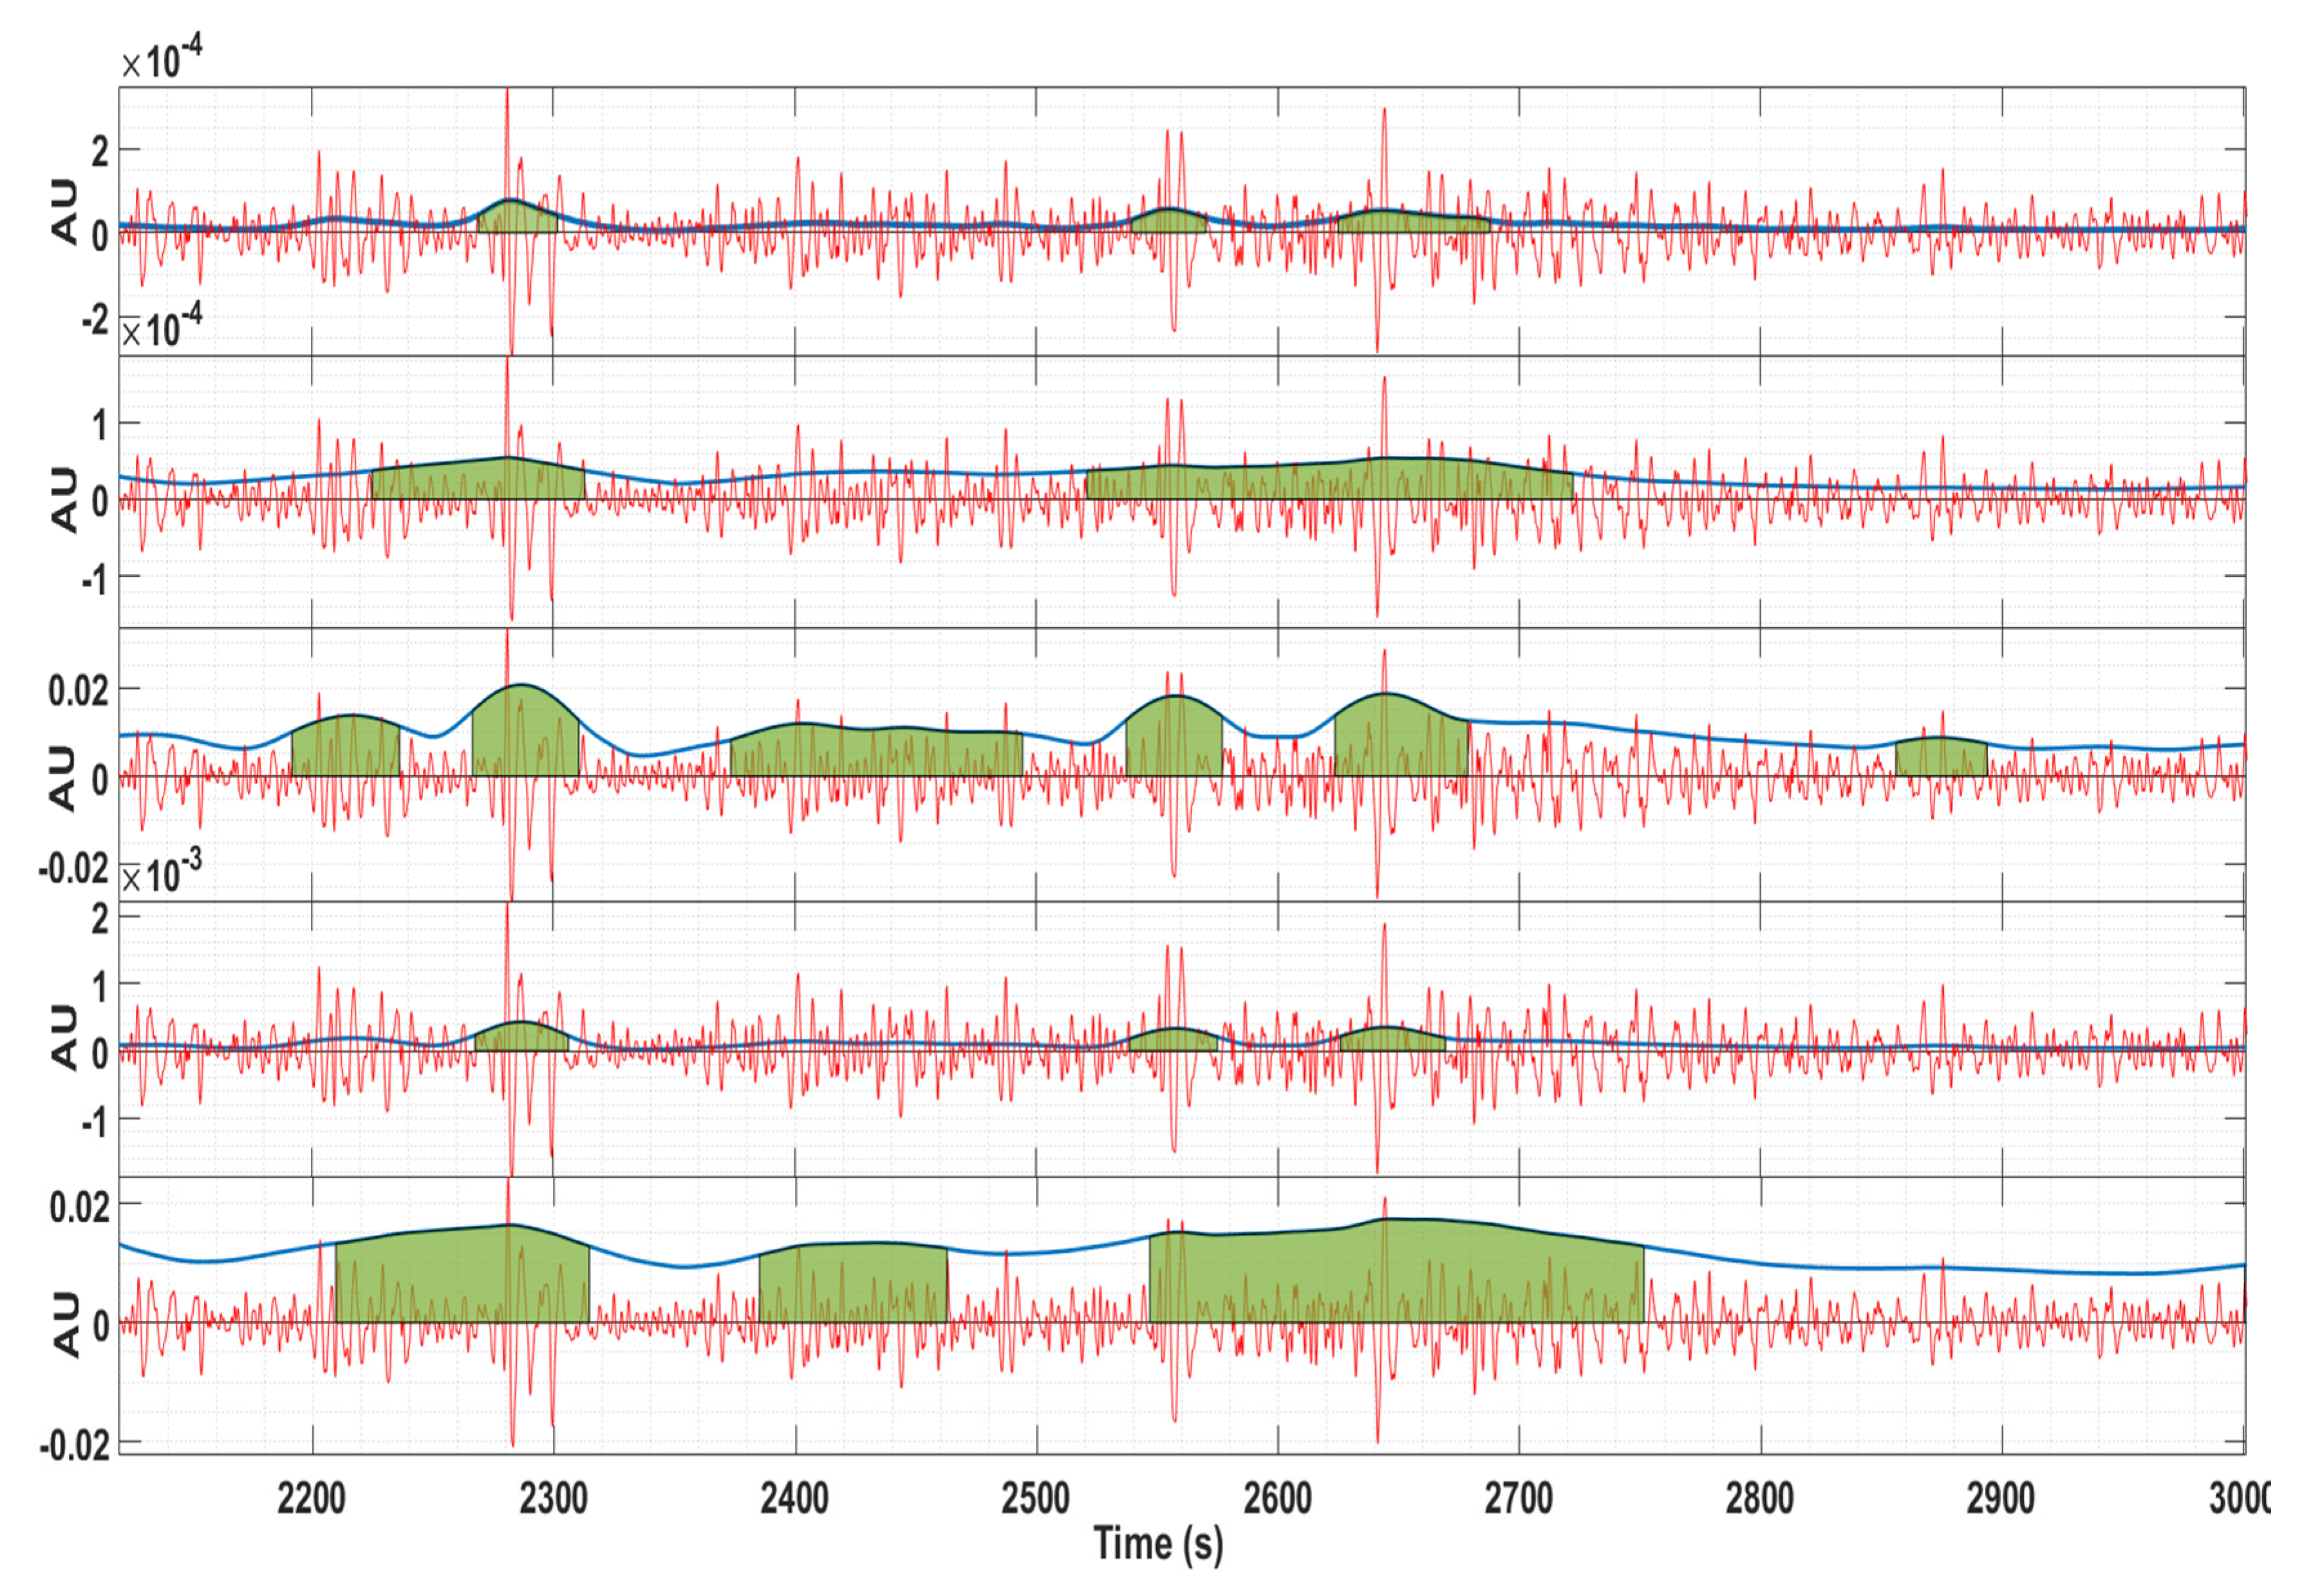
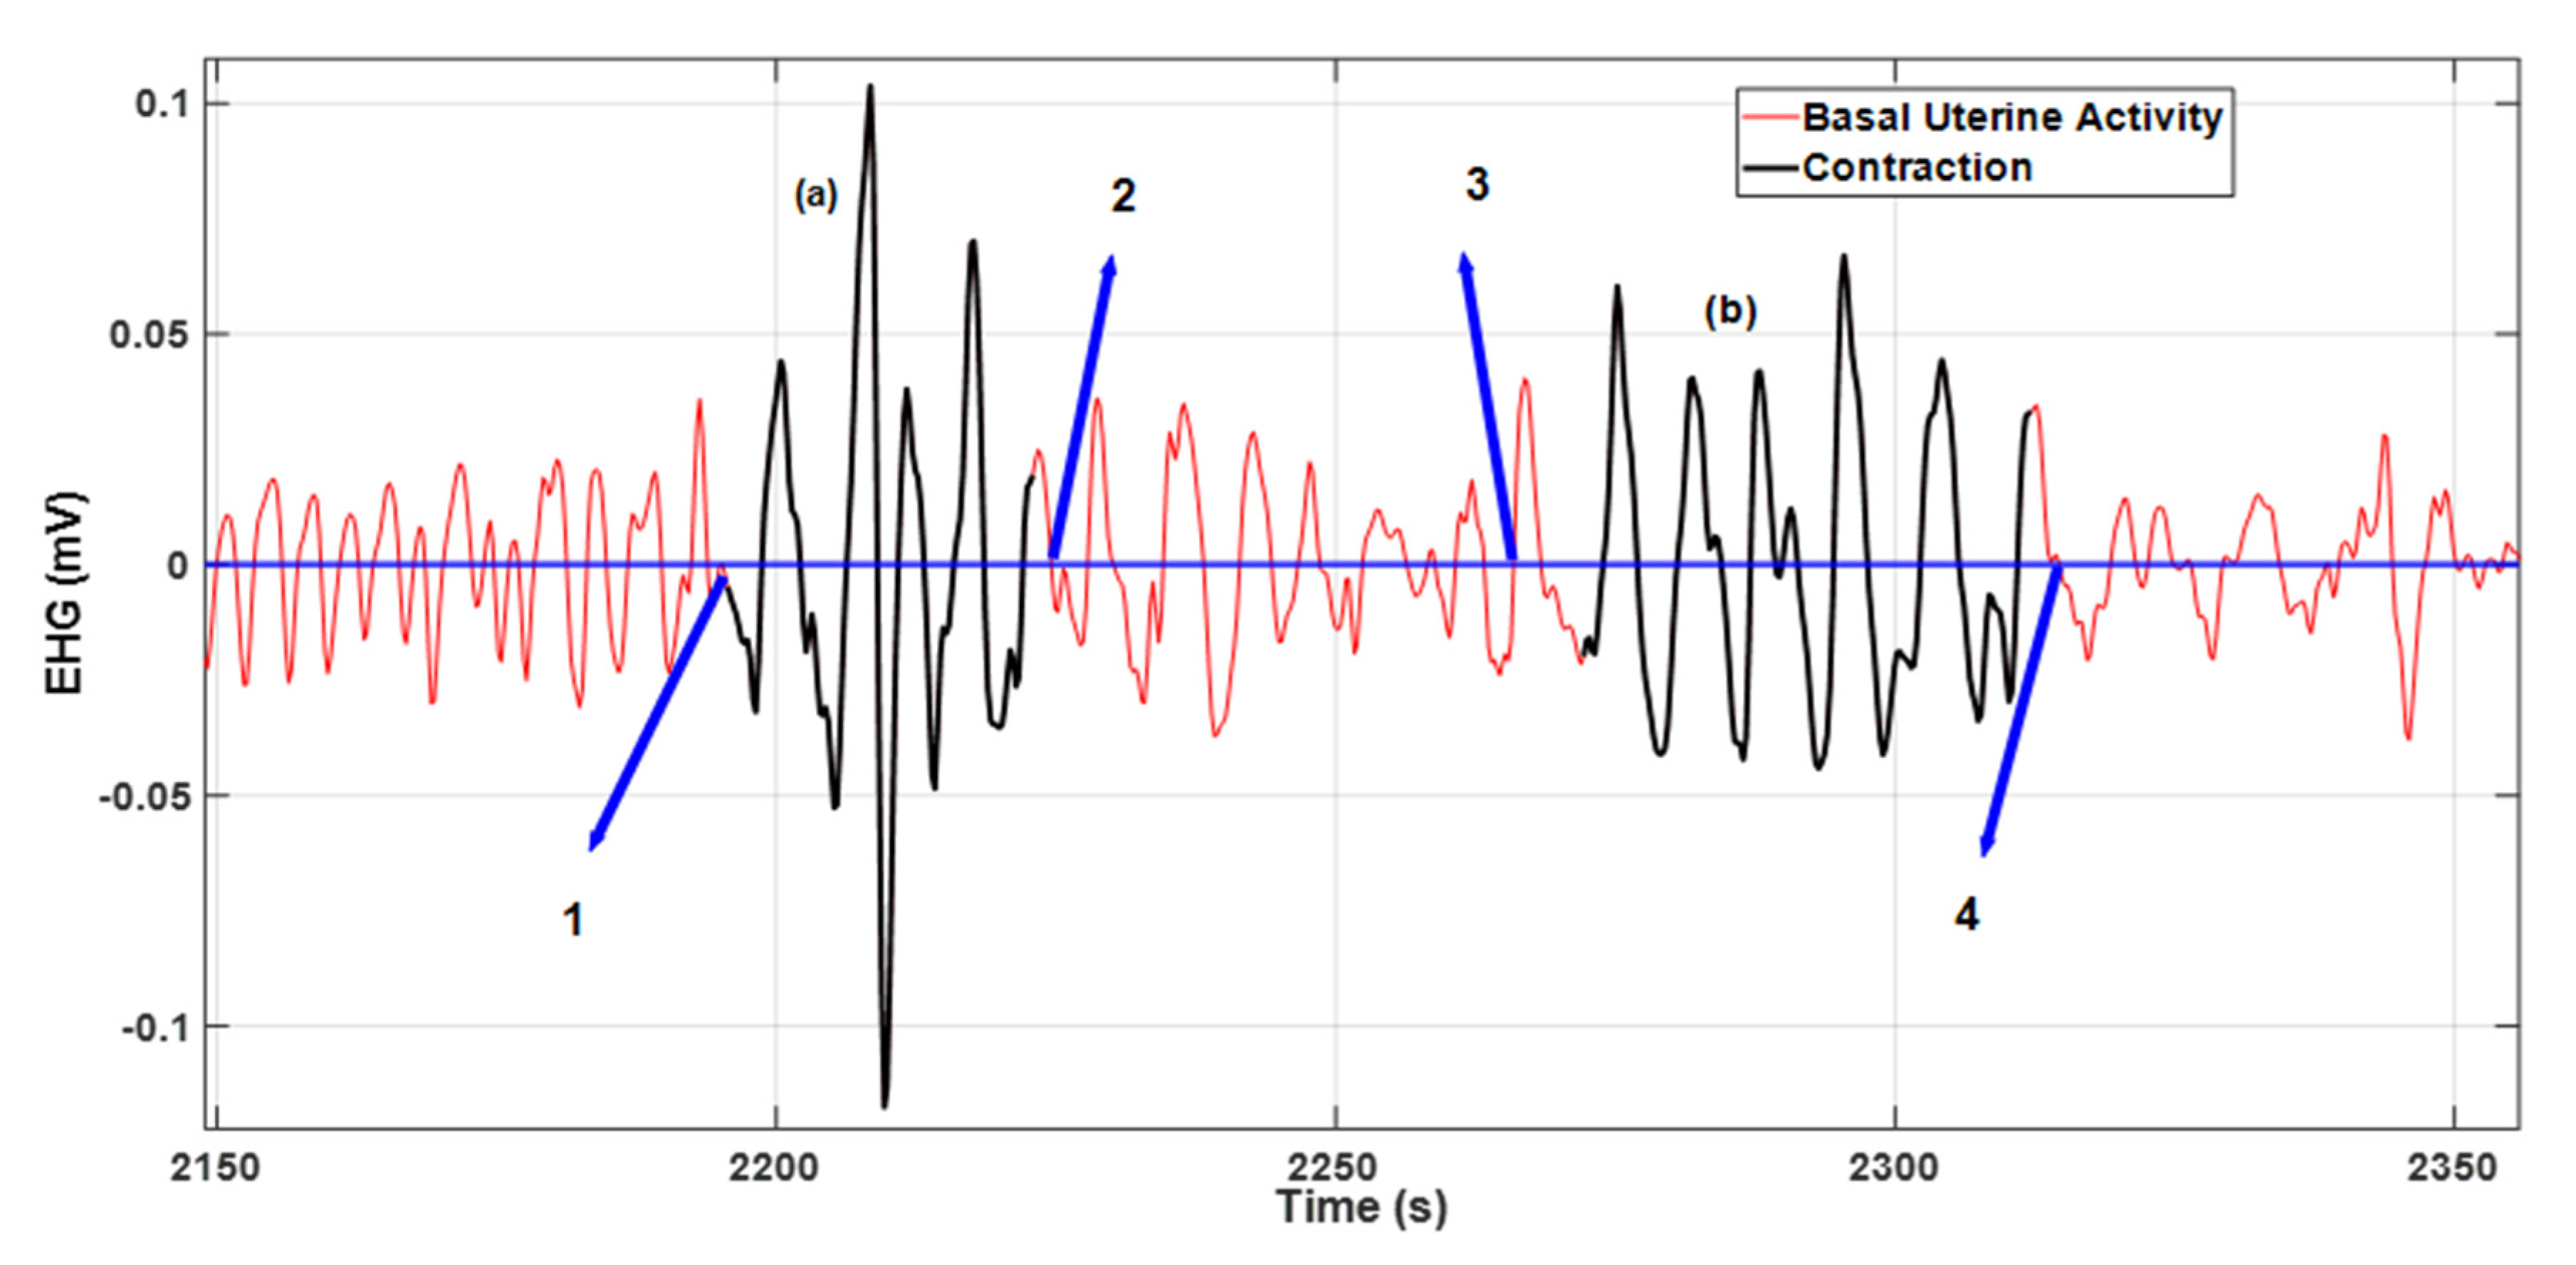
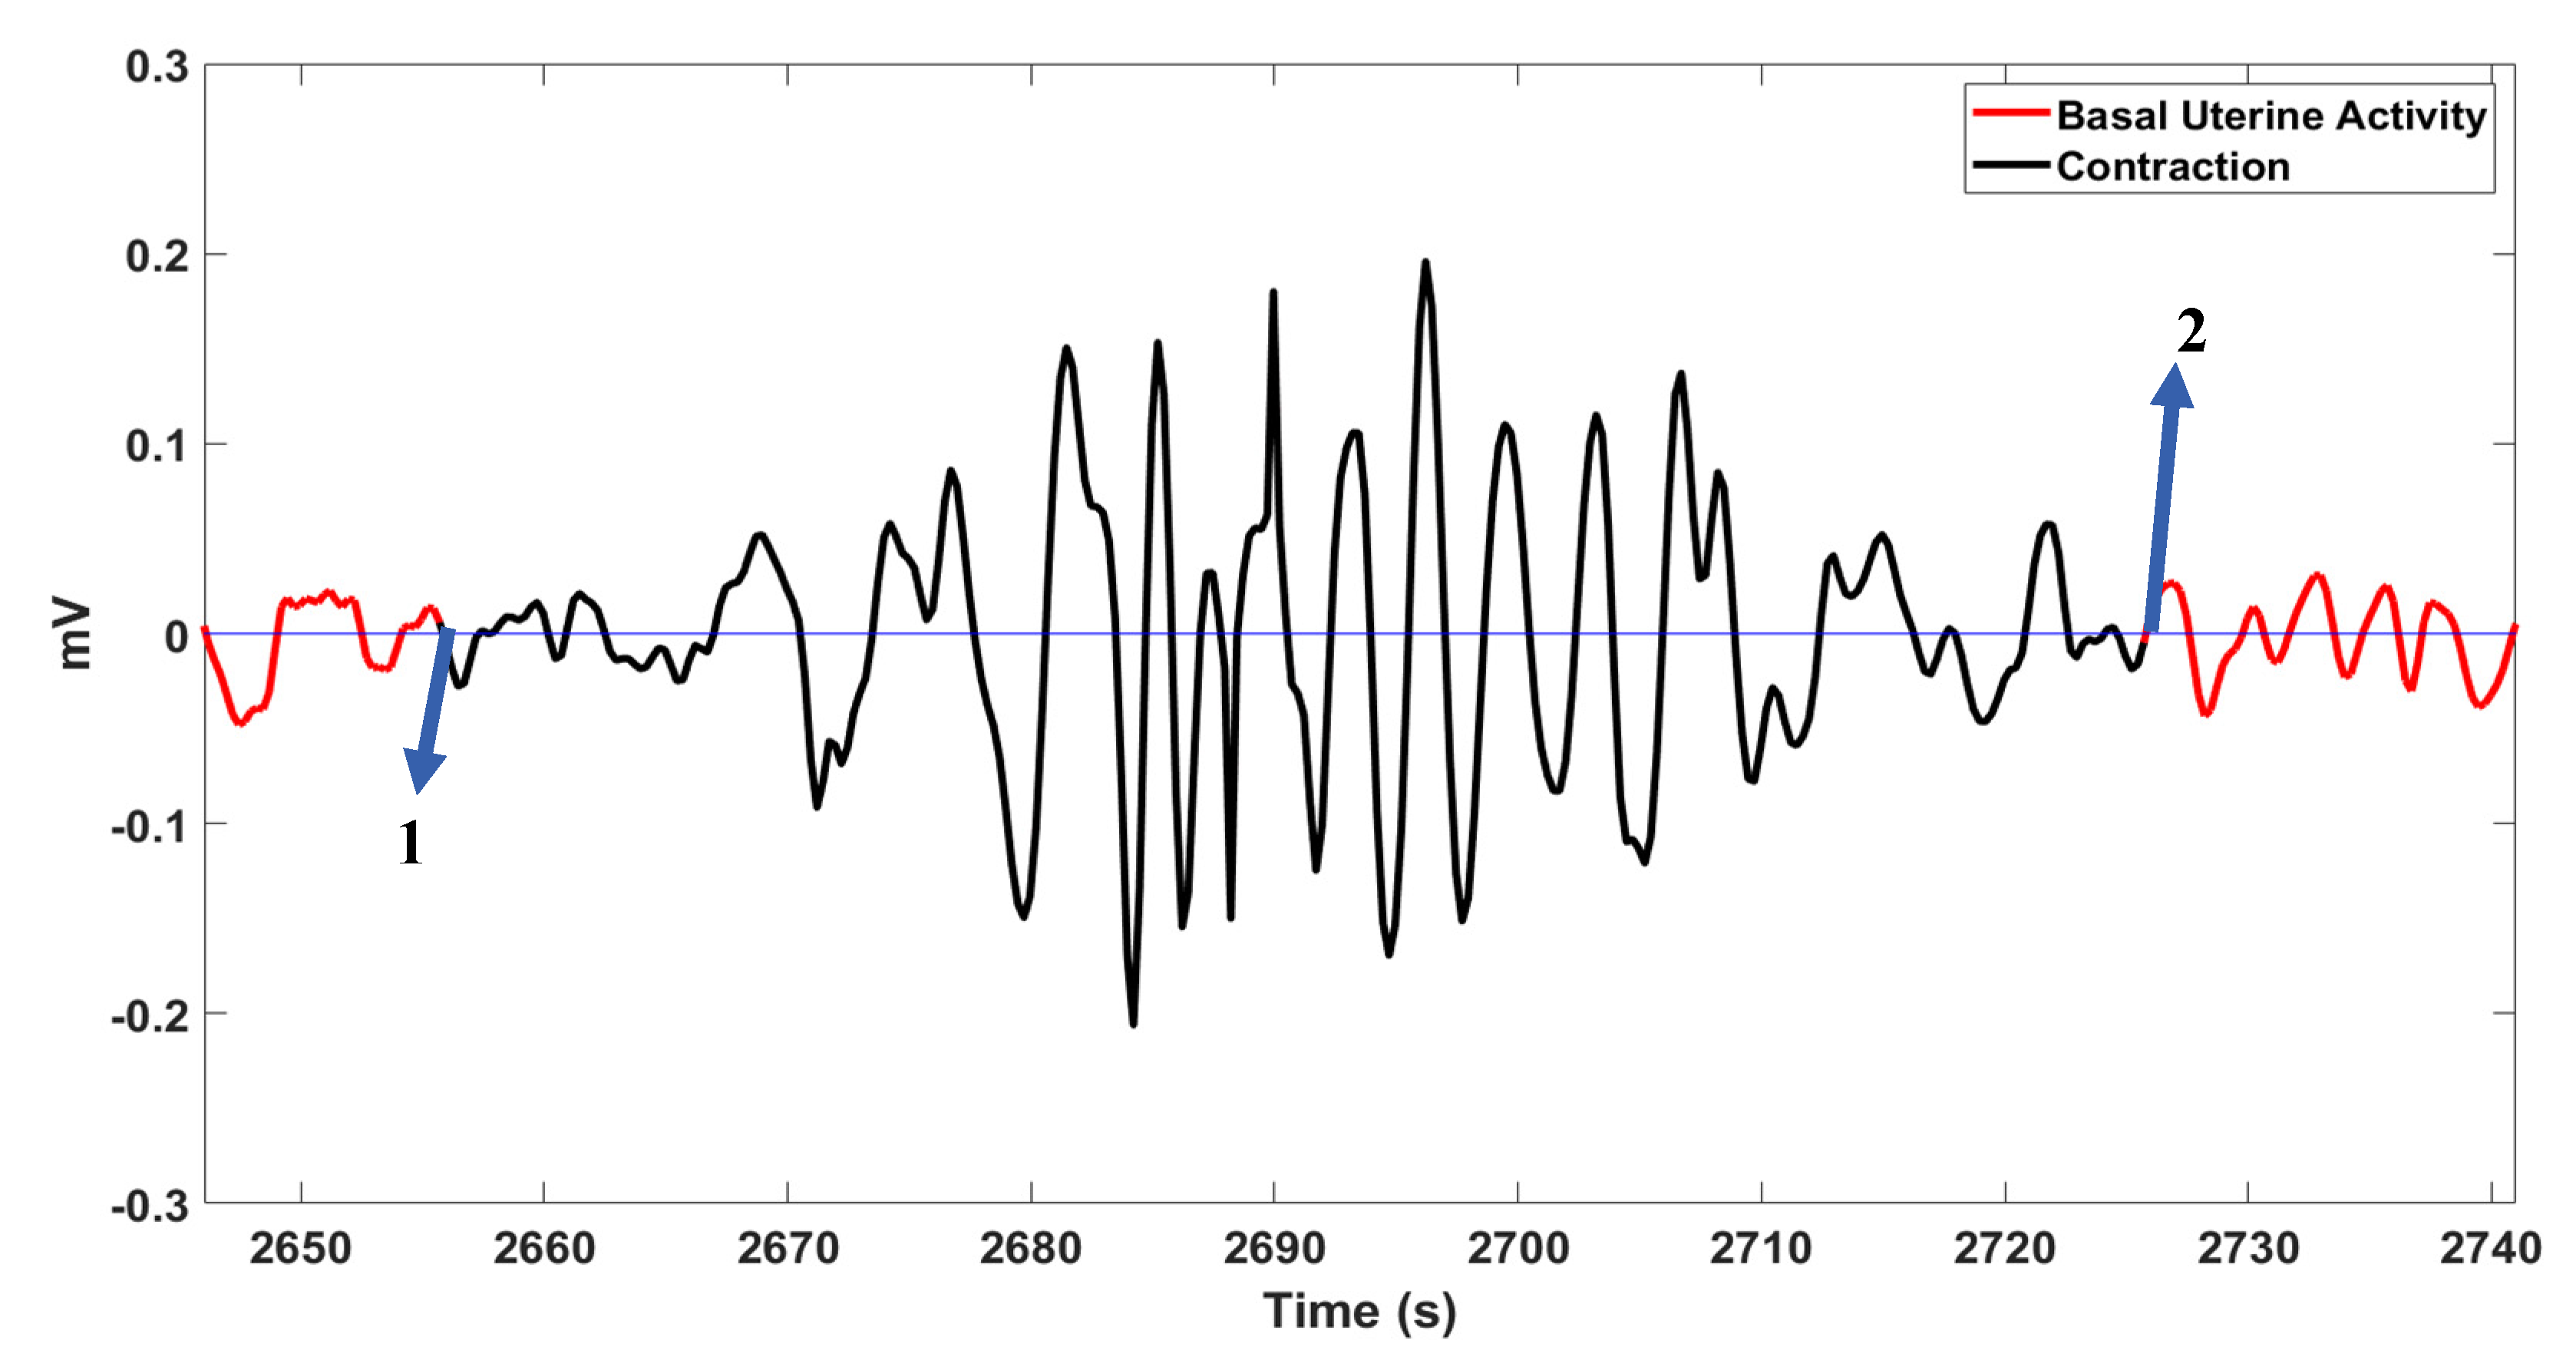
2.4. Visualization and Scoring Methodology

An application tool, the Uterine Inspector (Figure 3) was implemented to simplify the scoring operation. This tool is part of the Uterine Explorer Project [5]. The detected and delineated contractions are represented in all the recorded EHG channels, using the five selected energy methods, in different plots. The extra entries shown in the tool interface represent additional EHG events that will be processed in a future work. This tool turned out to play an important role in the process of the expert visual evaluation of the presented algorithms. Table 1 presents more detailed information about the Uterine Inspector interface.
Figure 4 shows an example of the contraction detection algorithm for bipolar channel 4–13. From top to bottom (energy estimation methods): wavelet, Teager, RMS, squared RMS, and Hilbert. It is clear that different energy estimation methods produced dissimilar contraction delineation bounds and misdetections.
For non-stationary signals such as EHG signals, the delineation accuracy is prone to have a certain degree of boundary ambiguity. Unlike the well-characterized electrocardiogram waveform, for which defined scoring rules exist, as far as components characterization and delineation are concerned, the EHG basal activity randomness makes the contraction delineation assessment a difficult task that scorers must face in order to reduce subjectivity. The use of the TOCO as a score reference was excluded in this methodology based on the following considerations: (1) the existing mismatches between TOCO amplitude and the strength of the uterine contractions produces a poor accuracy of the onset and offset of the contractile events, particularly for subjects with high BMI; (2) it has been reported [14] that the sensitivity, positive predictive value, and false positive rate for the individual contractions using TOCO and EHG relative to the IUP are: 54.0%, 84.4%, 15.6% and 94.2%, 87.6%, 12.4%, respectively. This prompted the authors of this work to justify the option of not using the TOCO as a scoring reference. It was considered that, as far as contraction onset and offset delineation are concerned, the inaccuracy of the TOCO would surpass the effect of the relative randomness of the basal uterine activity in the EHG.
It is often observed that contractile activity in the EHG is not present in the TOCO due to the limited sensitivity of its mechanical transducer. Surely, the IUP would be the gold standard reference method; however, as previously mentioned it is only used in selected labor cases after membrane rupture.
The option of using an automatic scoring algorithm is currently unrealistic, taking in account that no standards exist, and the relative energy method accuracy may be still a matter of debate due to a lack of clear benchmarks. Following the strategy also adopted in other studies, an expert scoring was performed [1,20,24]. In fact, in this context, and lacking the IUP, the visual expert scoring methodology is currently considered a gold standard [8]. Regarding the onset and offset contraction determination, a certain degree of subjectivity is expected to be unavoidable due to the random components of uterine basal activity. The expert used the criteria explained in Table 2. The delineation accuracy only includes two values (50% and 100%). The 0% value was excluded since, if the contraction was identified as such, a minimal degree of delineation is present. Contractions not detected by the energy methods contribute to the false negative rate.
Figure 5 illustrates two contractions with misaligned delineations relative to the baseline average (blue line). The contraction identified as (a) presents a misaligned right side and in contraction (b) both sides are misaligned relative to points 3 and 4. For both cases, a 50% accuracy rate was assigned.
Figure 6 shows a case with 100% delineation accuracy, and Figure 7 illustrates an undetected contraction.

3. Results

A total of 2382 contractions were scored. For each detection method the mean and standard deviation were determined regarding the contraction and the delineation accuracy. The results are presented in Table 3.
The squared RMS got the best score in all three evaluated parameters. The Teager and the Hilbert envelope methods showed the worst performance in all parameters, particularly the false negative rate. Despite the wavelet energy estimator having lower contraction accuracy compared to the RMS, its standard deviation was roughly half that of the RMS. These two operators had similar performances for delineation accuracy.
One should also consider the very low false negative rate presented by the squared RMS estimator followed by the RMS estimator. In all, the false negative rates regarding all estimations presented a remarkably low count.
It could be anticipated that, providing that most of the contraction energy is within the obtained delineation limits, its signal spectral parameters should be well represented—namely, the peaks’ locations, a feature widely used in EHG processing. In this regard, Figure 8 shows the wavelet spectrum for a selected contraction with 30% boundary variation between the five different detection methods. As far as spectral analysis is concerned, all the peaks’ location estimations overlapped for this case. It is beyond the scope of this report to produce a statistical analysis for this matter, despite its relevance, for example, for classification algorithms based on the spectral peaks’ locations. This will be addressed in future work.
The Hilbert envelope method was demonstrated to produce longer contraction estimations, thus being an interesting tool for EHG events such as the LDBF. This is clear in the last plot of Figure 4.

4. Discussion

The squared RMS produced the best results in all the evaluated parameters. Accounting for the respective standard deviations, the RMS stands below the wavelet energy operator as far as the contraction accuracy is concerned, but outperformed the latter—and all the other estimators—in terms of the delineation accuracy and false negative rate. The false negative rate of the squared RMS stands out as being substantially lower compared to the remaining estimators.
In the EHG framework, contraction detection and delineation are key subjects that may provide important information for long-term pregnancy monitoring and preterm risk evaluation algorithm development. Previous studies regarding preterm risk evaluation used the complete recorded EHG signal, thus overcoming the need for contraction detection [39]. In this case, it should be assumed that the included basal uterine activity does not impact the overall signal parameters, as was considered in a related work [40]. Nevertheless, for classification and clustering studies, it is expected to be required to work on separated contraction events. There has been an increased interest regarding the identification of the different contraction types in the EHG, for which a delineation operation should be performed. Elsewhere, the authors have published an EHG-based uterine contraction clustering analysis by means of the detected contractions using the methodologies presented herein [30]. The spectral properties of the Braxton Hicks [25] and two different types of Alvarez waves were obtained in that study [30].
In various studies, the contraction detection was visually performed, which is a time-consuming task [9,20]. Considering this, automatic contraction detection methodologies are sought as a step forward in the general framework of EHG processing—namely, in preterm risk evaluation, propagation studies, and contraction classification.
The present report describes five different contraction detectors (delineation included) based on the EHG energy bursts—a feature that stands out due to the increased cell-to-cell communication mechanisms leading to extra contractile activity.
The best result was obtained with the squared RMS estimation. Notwithstanding the relatively lower score of the Teager operator, this estimator was shown to be able to delineate long-duration EHG events, a feature that could be explored in future work. All the used estimator algorithms have low computational cost, making them a good choice for mobile platforms, having in mind home-based contraction monitoring.
A closely related study [2] that used an expert visual scoring method and the IUP as a reference reports a sensitivity of 94.2% and a positive predictive value of 87.6%. These results cannot be directly compared to those reported herein, due to the different scoring methodologies and all the subjects in the referred study being in active labor, and thus not in the context of continuous pregnancy monitoring.
In another related study [25], where a nonlinear correlation coefficient was used as a feature for contraction detection, the reported detection rates were 62.5 % (full detections), 37.5% (partial detections), and 100% (total detections). Comparatively, in the present report and selecting the best delineator/detector as the squared RMS, a contraction accuracy of 97.15 ± 4.66% and a delineation accuracy of 89.43 ± 8.10% are featured. The assessment of these comparative results should be made carefully, taking into account the different expert scoring methodologies.
The present work is a contribution to research on automatic contraction detection methodologies. It uses the most evident feature in a uterine contraction event: an energy burst. A layer of complexity is added due to the non-stationary nature of these energy bursts and the basal uterine activity from where they stand out. Unlike electrocardiograms, where predefined components whose wave shape is recognized and for which classification standards already exist, in the EHG case no benchmarks are yet available regarding wave component delineation and features. To summarize, this work presents five different energy burst delineation methods that have been widely used for other biomedical signals. Despite the low computational complexity of the presented methods, this study still fills the gap of the application of these well-known processes, with the advantage that they are fast and stable algorithms. A demand for EHG contraction detectors and delineators methods is forecast. The still-missing standardization rules regarding EHG analysis is a serious challenge in studies of this nature, and it is expected that the ever-increasing reports will eventually lead to some peer-agreed classification rules.

Author Contributions

Conceptualization, F.E., A.G.B., H.M., S.R., C.R.P.d.R., F.S., V.V. and M.D.O.; Funding acquisition, A.G.B., V.V. and M.D.O.; Investigation, F.E., A.G.B., H.M., S.R., C.R.P.d.R., F.S., V.V. and M.D.O.; Methodology, F.E., A.G.B., H.M., S.R., C.R.P.d.R., F.S., V.V., and M.D.O.; Project administration, A.B., V.V. and M.D.O.; Resources, F.E., A.G.B., V.V. and M.D.O.; Software, F.E., A.G.B., S.R. and M.D.O.; Supervision, A.G.B., H.M., V.V. and M.D.O.; Validation, F.E., H.M., S.R., C.R.P.d.R., F.S., V.V. and M.D.O.; Visualization, A.G.B., H.M., M.D.O. and F.S.; Writing—original draft, F.E. and A.B.; Writing—review and editing, F.E., A.G.B., H.M., S.R., C.R.P.d.R., F.S., V.V. and M.D.O. All authors have read and agreed to the published version of the manuscript.

Funding

This work was partially funded by Portuguese National Funds through the FCT—Foundation for Science and Technology under the projects UIDB/00066/2020 (FCT) and UID/MAT/04561/2019. In addition, it was also funded by FCT and NMT, S.A in the scope of the project PD/BDE/150312/2019.

Conflicts of Interest

The authors declare no conflict of interest.

References

  1. Alberola-Rubio, J.; Prats-Boluda, G.; Ye-Lin, Y.; Valero, J.; Perales, A.; Garcia-Casado, J. Comparison of non-invasive electrohysterographic recording techniques for monitoring uterine dynamics. Med. Eng. Phys. 2013, 35, 1736–1743. [Google Scholar] [CrossRef] [PubMed]
  2. Hadar, E.; Biron-Shental, T.; Gavish, O.; Raban, O.; Yogev, Y. A comparison between electrical uterine monitor, tocodynamometer and intra uterine pressure catheter for uterine activity in labor. J. Matern. Neonatal Med. 2015, 28, 1367–1374. [Google Scholar] [CrossRef]
  3. Horoba, K.; Wrobel, J.; Jezewski, J.; Kupka, T.; Roj, D.; Jezewski, M. Automated detection of uterine contractions in tocography signals–Comparison of algorithms. Biocybern. Biomed. Eng. 2016, 36, 610–618. [Google Scholar] [CrossRef]
  4. Alvarez, H.; Caldeyro-Barcia, R. The normal and abnormal contractile waves of the uterus during labour. Gynaecologia 1954, 138, 190–212. [Google Scholar] [CrossRef] [PubMed]
  5. Auger, F.; Flandrin, P.; Gonçalves, P.; Lemoine, O. Time-Frequency Toolbox Reference Guide; Rice University: Houston, TX, USA, 1995. [Google Scholar]
  6. Macones, G.A.; Cahill, A.; Stamilio, D.M.; Odibo, A. A new method for assessing uterine activity: Haran et al. Am. J. Obstet. Gynecol. 2012, 206, 449. [Google Scholar] [CrossRef]
  7. Chendeb, M.; Khalil, M.; Hewson, D.; Duchêne, J. Classification of non stationary signals using multiscale decomposition. J. Biomed. Sci. Eng. 2010, 3, 193–199. [Google Scholar] [CrossRef] [Green Version]
  8. Devedeux, D.; Marque, C.; Mansour, S.; Germain, G.; Duchêne, J. Uterine electromyography: A critical review. Am. J. Obstet. Gynecol. 1993, 169, 1636–1653. [Google Scholar] [CrossRef]
  9. Fele-Žorž, G.; Kavšek, G.; Novak-Antolič, Ž.; Jager, F. A comparison of various linear and non-linear signal processing techniques to separate uterine EMG records of term and pre-term delivery groups. Med. Biol. Eng. Comput. 2008, 46, 911–922. [Google Scholar] [CrossRef]
  10. Vlemminx, M.W.C.; Thijssen, K.M.J.; Bajlekov, G.I.; Dieleman, J.P.; der Jagt, M.B.v.; Oei, S.G. Could electrohysterography be the solution for external uterine monitoring in obese women? J. Perinatol. 2018, 38, 580–586. [Google Scholar] [CrossRef]
  11. Lucovnik, M.; Chambliss, L.R.; Blumrick, R.; Balducci, J.; Gersak, K.; Garfield, R.E. Effect of obesity on preterm delivery prediction by transabdominal recording of uterine electromyography. Taiwan. J. Obstet. Gynecol. 2016, 55, 692–696. [Google Scholar] [CrossRef] [Green Version]
  12. Diab, A. Study of the Nonlinear Properties and Propagation Characteristics of the Uterine Electrical Activity during Pregnancy and Labor. Ph.D. Thesis, Université de Technologie de Compiègne, Compiègne, France, 2015. [Google Scholar]
  13. Zaylaa, A.; Diab, A.; Khalil, M.; Marque, C. Multichannel EHG segmentation for automatically identifying contractions and motion artifacts. In Proceedings of the 2017 Fourth International Conference on Advances in Biomedical Engineering (ICABME), Beirut, Lebanon, 19–21 October 2017; pp. 1–4. [Google Scholar] [CrossRef] [Green Version]
  14. Rabotti, C.; Mischi, M.; van Laar, J.O.E.H.; Oei, S.G.; Bergmans, J.W.M. Myometrium electromechanical modeling for internal uterine pressure estimation by electrohysterography. In Proceedings of the 2009 Annual International Conference of the IEEE Engineering in Medicine and Biology Society, Minneapolis, MN, USA, 3–6 September 2009; pp. 6259–6262. [Google Scholar] [CrossRef] [Green Version]
  15. Bregar, A.T.; Lucovnik, M.; Verdenik, I.; Jager, F.; Gersak, K.; Garfield, R.E. Uterine electromyography during active phase compared with latent phase of labor at term. Acta Obstet. Gynecol. Scand. 2016, 95, 197–202. [Google Scholar] [CrossRef] [PubMed]
  16. Sims, S.M.; Daniel, E.E.; Garfield, R.E. Improved electrical coupling in uterine smooth muscle is associated with increased numbers of gap junctions at parturition. J. Gen. Physiol. 1982, 80, 353–375. [Google Scholar] [CrossRef] [PubMed]
  17. Miller, S.M.; Garfield, R.E.; Daniel, E.E. Improved propagation in myometrium associated with gap junctions during parturition. Am. J. Physiol. Physiol. 1989, 256, C130–C141. [Google Scholar] [CrossRef] [PubMed]
  18. Verhoeff, A. Myometrial Contractility and Gap junCtions: An Experimental Study in Chronically Instrumented Ewes; Erasmus University Rotterdam: Rotterdam, The Netherlands, 1985. [Google Scholar]
  19. Miyoshi, H.; Boyle, M.B.; MacKay, L.B.; Garfield, R.E. Gap junction currents in cultured muscle cells from human myometrium. Am. J. Obstet. Gynecol. 1998, 178, 588–593. [Google Scholar] [CrossRef]
  20. Khalil, M.; Duchene, J. Uterine EMG analysis: A dynamic approach for change detection and classification. IEEE Trans. Biomed. Eng. 2000, 47, 748–756. [Google Scholar] [CrossRef]
  21. Marque, C.; Gondry, J.; Rossi, J.; Baaklini, N.; Duchêne, J. Surveillance des grossesses à risque par électromyographie utérine. RBM-News 1995, 17, 25–31. [Google Scholar] [CrossRef]
  22. Horoba, K.; Jezewski, J.; Wrobel, J.; Graczyk, S. Algorithm for detection of uterine contractions from electrohysterogram. In Proceedings of the 23rd Annual International Conference of the IEEE Engineering in Medicine and Biology Society, Istanbul, Turkey, 25–28 October 2001. [Google Scholar] [CrossRef] [Green Version]
  23. Jezewski, J.; Horoba, K.; Matonia, A.; Wrobel, J. Quantitative analysis of contraction patterns in electrical activity signal of pregnant uterus as an alternative to mechanical approach. Physiol. Meas. 2005, 26, 753–767. [Google Scholar] [CrossRef]
  24. Chendeb, M. Détection et Classification des Signaux non Stationnaires par Utilisation des Ondelettes. Application aux Signaux Électromyographiques Utérins. Ph.D. Thesis, Université de Technologie de Troyes, Troyes, France, 2006. [Google Scholar]
  25. Muszynski, C.; Happillon, T.; Azudin, K.; Tylcz, J.B.; Istrate, D.; Marque, C. Automated electrohysterographic detection of uterine contractions for monitoring of pregnancy: Feasibility and prospects. BMC Pregnancy Childbirth 2018, 18, 1–8. [Google Scholar] [CrossRef] [Green Version]
  26. Rooijakkers, M.J.; Song, S.; Rabotti, C.; Oei, S.G.; Bergmans, J.W.; Cantatore, E.; Mischi, M. Influence of electrode placement on signal quality for ambulatory pregnancy monitoring. Comput. Math. Methods Med. 2014, 2014. [Google Scholar] [CrossRef]
  27. Furdea, A.; Eswaran, H.; Wilson, J.D.; Preissl, H.; Lowery, C.L.; Govindan, R.B. Magnetomyographic recording and identification of uterine contractions using Hilbert-wavelet transforms. Physiol. Meas. 2009, 30, 1051–1060. [Google Scholar] [CrossRef]
  28. Peng, J.; Hao, D.; Liu, H.; Liu, J.; Zhou, X.; Zheng, D. Preliminary Study on the Efficient Electrohysterogram Segments for Recognizing Uterine Contractions with Convolutional Neural Networks. Biomed Res. Int. 2019, 2019. [Google Scholar] [CrossRef] [PubMed] [Green Version]
  29. Liu, Z.; Hao, D.; Zhang, L.; Liu, J.; Zhou, X.; Yang, L.; Yang, Y.; Li, X.; Zhang, S.; Zheng, D. Comparison of electrohysterogram characteristics during uterine contraction and non-contraction during labor. In Proceedings of the 2017 39th Annual International Conference of the IEEE Engineering in Medicine and Biology Society (EMBC), Jeju Island, Korea, 11–15 July 2017; pp. 2924–2927. [Google Scholar] [CrossRef]
  30. Esgalhado, F.; Batista, A.G.; Mouriño, H.; Russo, S.; Dos Reis, C.R.; Serrano, F.; Vassilenko, V.; Ortigueira, M. Uterine contractions clustering based on electrohysterography. Comput. Biol. Med. 2020, 123, 103897. [Google Scholar] [CrossRef] [PubMed]
  31. Alexandersson, A.; Steingrimsdottir, T.; Terrien, J.; Marque, C.; Karlsson, B. The Icelandic 16-electrode electrohysterogram database. Sci. Data 2015, 2, 1–9. [Google Scholar] [CrossRef] [PubMed] [Green Version]
  32. Sousa, C. Electrohysterogram Signal Component Cataloging with Spectral and Time-Frequency Methods. Master’s Thesis, Universidade Nova de Lisboa, Lisbon, Portugal, 2015. [Google Scholar]
  33. Esgalhado, F. Uterine Contractions Clustering Based on Surface Electromyography: An Input for Pregnancy Monitoring. Master’s Thesis, Lisbon University, Lisbon, Portugal, 2018. [Google Scholar]
  34. Batista, A.G.; Najdi, S.; Godinho, D.M.; Martins, C.; Serrano, F.C.; Ortigueira, M.D.; Rato, R.T. A multichannel time–frequency and multi-wavelet toolbox for uterine electromyography processing and visualisation. Comput. Biol. Med. 2016, 76, 178–191. [Google Scholar] [CrossRef]
  35. Rooijakkers, M.J.; Rabotti, C.; Oei, S.G.; Aarts, R.M.; Mischi, M. Low-complexity intrauterine pressure monitoring by Teager energy estimation. In Proceedings of the 2013 35th Annual International Conference of the IEEE Engineering in Medicine and Biology Society (EMBC), Osaka, Japan, 3–7 July 2013; pp. 7424–7427. [Google Scholar] [CrossRef]
  36. Rabotti, C.; Mischi, M.; van Laar, J.O.E.H.; Oei, G.S.; Bergmans, J.W.M. Estimation of internal uterine pressure by joint amplitude and frequency analysis of electrohysterographic signals. Physiol. Meas. 2008, 29, 829–841. [Google Scholar] [CrossRef]
  37. Kaiser, J.F. On a Simple Algorithm to Calculate the ‘energy’ of a Signal. In Proceedings of the International Conference on Acoustics, Speech, and Signal Processing, Albuquerque, NM, USA, 3–6 April 1990. [Google Scholar]
  38. Chen, L.; Hao, Y. Feature Extraction and Classification of EHG between Pregnancy and Labour Group Using Hilbert-Huang Transform and Extreme Learning Machine. Comput. Math. Methods Med. 2017, 2017. [Google Scholar] [CrossRef]
  39. Jager, F.; Libenšek, S.; Geršak, K. Characterization and Automatic Classification of Preterm and Term Uterine records. PLoS ONE 2018, 13, e0202125. [Google Scholar] [CrossRef] [Green Version]
  40. Hassan, M. Analysis of the Propagation of Uterine Electrical Activity Applied To Predict Preterm Labor. Ph.D. Thesis, Université de Technologie de Compiègne, Compiègne, France, 2015. [Google Scholar]
Figure 1. Representation of the Icelandic electrohysterogram (EHG) database channels disposition [31]. The blue arrow is the selected channel for this work.
Applsci 10 07014 g001
Figure 2. Diagram of the contraction detection algorithm. Five different detection methods are used along with amplitude threshold criteria and a final outlier eliminative process.
Applsci 10 07014 g002
Figure 3. Uterine Inspector application for contraction database management, visualization, and evaluation. This tool was used for the expert scoring of contraction detection. Table 1 provides details about the entries shown in the interface.
Applsci 10 07014 g003
Figure 4. Example of the contraction detection algorithm for channel 4–13. Red: EHG signal; Blue line: energy estimation; Green: contraction delineation. From top to bottom (energy estimation methods): wavelet, Teager, RMS, squared RMS, and Hilbert. The vertical axis is represented in arbitrary units.
Applsci 10 07014 g004
Figure 5. The contraction identified as (a) was ranked with a 50% delineation accuracy rate accounting for the misaligned right-side margin relative to point 2. The same applies to contraction (b), where both sides are misaligned relative to points 3 and 4.
Applsci 10 07014 g005
Figure 6. A contraction with 100% delineation rate as shown by arrows 1 and 2.
Applsci 10 07014 g006
Figure 7. The double arrow identifies a contraction that was not detected by the energy method.
Applsci 10 07014 g007
Figure 8. Wavelet spectrum for the same contraction, using the five delineation methods. The curve overlap shows that, despite a 30% difference in contraction cut-offs, the energy contents are representative of the event.
Applsci 10 07014 g008
Table 1. Interpretation of the Uterine Inspector output table (Figure 3).
Detection Method in the Respective EHG Channel
Wavelet_contNumber of contractions detected with wavelet energy method
Teager_contNumber of contractions detected with Teager method
RMS_contNumber of contractions detected with RMS method
RMS_Squared_contNumber of contractions detected with squared RMS method
Hilbert_Envelope_contNumber of contractions detected with Hilbert envelope method
Table 2. Criteria for contraction and delineation accuracy.
Classification (%)Definition
Contraction Accuracy0Contraction was detected
50Contraction was partially detected
100Contraction was not detected
Delineation Accuracy100Contraction delineation is correct
50Contraction delineation is partially correct
Table 3. Contraction and delineation accuracy for each energy-based method.
Detection MethodContraction Accuracy (%)Delineation Accuracy (%)False Negative Rate (%)
Wavelet Energy92.28 ± 6.6679.19 ± 13.601.93
Teager Energy65.57 ± 25.0571.12 ± 10.614.74
RMS93.64 ± 12.0883.99 ± 12.671.51
Squared RMS97.15 ± 4.6689.43 ± 8.100.63
Hilbert Envelope73.00 ± 19.8571.99 ± 13.594.41

