Article

The Seepage and Soil Plug Formation in Suction Caissons in Sand Using Visual Tests

College of Civil Engineering, Tongji University, Shanghai 200092, China
*
Author to whom correspondence should be addressed.
Appl. Sci. 2020, 10(2), 566; https://doi.org/10.3390/app10020566
Submission received: 4 December 2019 / Revised: 8 January 2020 / Accepted: 8 January 2020 / Published: 13 January 2020
(This article belongs to the Special Issue Buildings and Structures under Extreme Loads)

Abstract

:
The rapid development of offshore wind energy in China is becoming increasingly relevant for movement toward green development. This paper presents the results of visual tests of a suction caisson used as foundation for offshore wind turbines. The distribution of hydraulic gradients of sand at the mudline in the caisson was obtained to find out the relationship with the heights of soil plugs. The relationship equation was proposed and obtained by using quadratic regression, guiding project designs, and construction. It was found that there was no soil plug in the caisson when small suction was applied during the suction penetration. The relationship between the heights of the soil plugs and the hydraulic gradient of the soil was proposed and obtained by using quadratic regression to predict (roughly) the height of soil plugs in suction caissons in sand during suction penetration. The influence of settlement outside caissons on the soil plug was found to decrease as the buried depth rose.

1. Introduction

In the past few decades, it has become increasingly important to rapidly develop the offshore wind industry, which provides practical sources of energy with a low carbon footprint [1,2]. Foundations play an important role in guaranteeing the safe operation of offshore wind turbines [3]. The suction caisson, being installed economically and efficiently into soil deposits, has been increasingly used as a competitive foundation for offshore wind turbines in deep water [4,5]. A suction caisson is a large cylindrical structure that is typically made of steel, open at the bottom and closed at the top [6]. To set up a perfect offshore wind turbine, two aspects need to be considered for the engineering design of this foundation: suction installation and in-service performance [7]. The capacity of suction caissons as the foundation for offshore wind turbines is enhanced by means of peripheral embedded thin walls, which confine the internal soil [8]. A caisson is installed by penetrating the seabed under its own weight, and then by pumping water out of the caisson to create suction that forces the foundation into the seabed [9].
During suction penetration, the induced seepage flow through highly permeable sand into the caisson interior can create some negative effects. To investigate these effects, a number of studies have been completed, and they show that the seepage facilitates the installation process at the caisson tip and along the inner wall [10,11,12,13]. Erbrich and Tjelta [14] presented a series of finite element analyses and found that the suction forced water to migrate through the soil from outside to the inner caisson. Previous research [15,16] still has certain issues, in that the seepage around the suction was assumed to follow Darcy’s law, which requires that we carry on further discussion. Experimental investigations in sand have revealed that soil plugs are likely to occur during suction-assisted installation [15,17,18]. A series of centrifuge tests on the installation of suction caissons were carried out by Tran et al. [19,20], who found that the soil plugs heave up to 20% of the caisson penetration as excessive suction, and they developed a void ratio–permeability relationship to check the sand heave against the plugs. There is no previous study on the relationship between soil plugs and the seepage velocity of sand around suction caissons.
This paper presents the results of visual tests of a suction caisson used as a foundation for offshore wind turbines. The process of suction installation of the caisson foundations with axisymmetric geometry is simplified to a plane problem. In order to study their composition, the heights of the final soil plugs in the caisson were measured. The distribution of the hydraulic gradient of sand at the mudline in the caisson was obtained to find out its relationship with the heights of the soil plugs. The relationship between the heights of soil plugs and the hydraulic gradient of soil was proposed and obtained by using quadratic regression, guiding project designs, and construction.

2. Experimental Program

The process of suction installation of the caisson foundations (shown in Figure 1a) with axisymmetric geometry is simplified to a plane problem in this paper. Due to the fact that the soil was replaced by the walls of the soil tank in tests, it is assumed that the forces of water adhesion to the walls are equal to that of the sand around the suction caissons. A soil tank (shown in Figure 1), as used in tests, has dimensions of 20 × 0.5 cm in its plan view, and a depth of 28 cm. Transparent fiberglass was used to make the soil tank, with a thickness of 1.0 cm. The two pumping outlets in the soil tank were connected to the suction loading system by a thin pipe and a drainpipe, respectively. Figure 1b shows the diagram of the test device, with a constant suction S in the caisson caused by the suction loading system creating the different head H. The value of the applied constant suction can be expressed as S = γwH, where γw is the unit weight of water (10 kN/m3).
The suction caisson with an external diameter D of 12 cm had a height of 17.5 cm L and a thickness T of 0.5 cm. In order to create an enclosed compartment between the soil tank, the suction caisson, and the soil, UV glue was used to stick the soil tank and the suction caisson together. The suction caisson model was located at a distance 7.5 cm from the bottom of the soil tank.
The siliceous sand shown in Figure 2 was used in tests because it is commercially available and shows a deep contrast with the carmine stain. The void ratio e of the soil was determined according to the standard soil testing methods, and can be written as e = ρwGs/ρd-1, where ρd is the dry density of the sand and Gs is the specific gravity of the sand. Table 1 shows the properties of the siliceous sand in tests. The siliceous sand particles had an average radius of 0.748 mm, and they obeyed uniform distribution, with a ratio of maximum to minimum radii of 2.0. The pluviation method and the compaction method were used to prepare uniform sand specimens in layers in the soil tank. The permeability coefficient of the siliceous sand was obtained by using an empirical equation, k = 2d102e2 [21], where d10 is the effective size of the sand. Due to the uniform particle size of the sand, it is suggested that d10 is equal to the average particle size (0.718 mm). Before carrying out every test, the sand specimen was left to stand for 24 h.
The seepage field around the suction caisson model was visualized by the tracer titration system, which consisted of an infusion system and carmine stain. The infusion system was made of a medical syringe with a thin pipe (radius of 2 mm), shown in Figure 1b. Three holes were drilled in the soil tank at points A, B, and C, connecting to the infusion system with the thin pipes. At points A, B, and C, the carmine stain was released with pinpoint accuracy by the infusion system. To reduce the effect of turbulence, the carmine stain was injected into the soil used in tests as slowly as possible.
The suction caisson model had a buried depth h (5, 10, and 15 cm) before each test, to simulate the process of suction installation. The influence of the temperatures of the environment and the water were not considered in the tests. A video camera was used to collect images of the experimental phenomena of seepage and the soil plug in the suction caisson. At the end of the trial, the height of the soil plug did not seem to change. The testing programs are listed in Table 2 in tests. The pre-test results show that seepage failure took place in the sand when the suction in the caisson with buried depths of 5, 10, and 15 cm were greater than 2.0, 3.5, and 4.0 kPa, respectively.

3. Test Results and Discussion

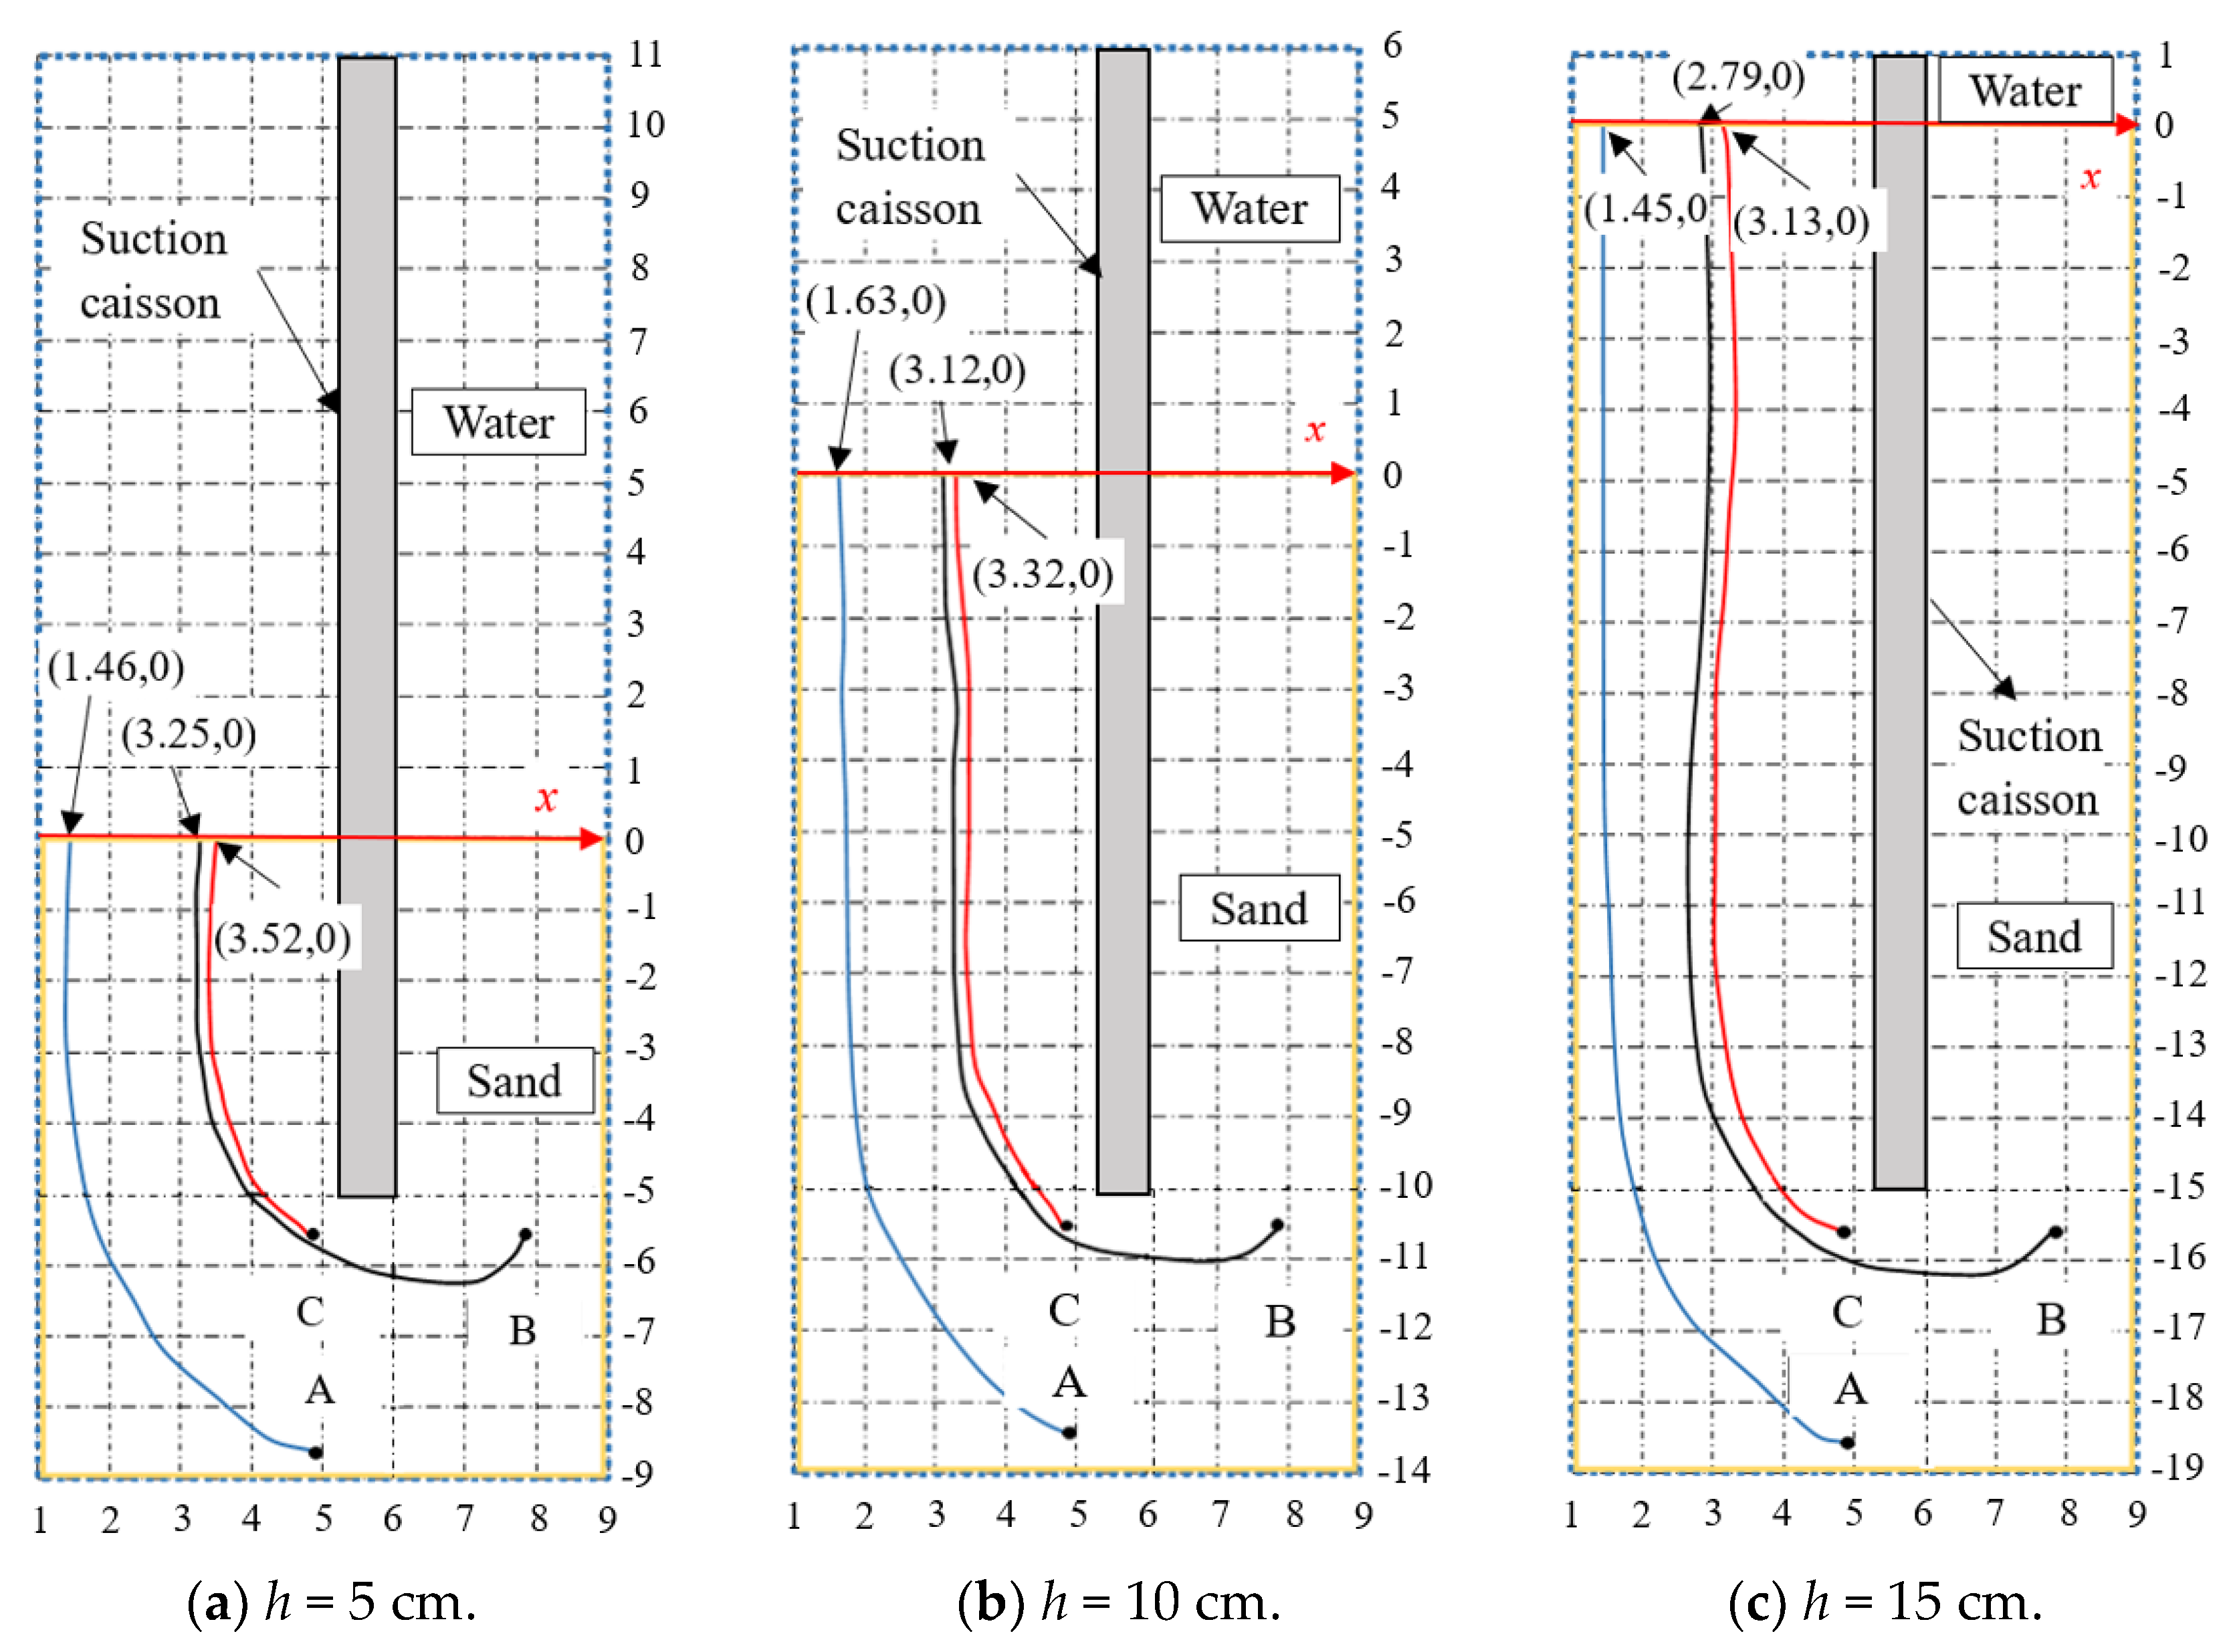
3.1. Visual Seepage Paths

The seepage field can be visualized where the carmine stain flows along streamlines in the soil around the suction caisson. Figure 3 shows the visualization of the seepage flow at point B as h = 15 cm and S = 0.5 kPa. It was observed that the visual tests achieved good results to study the seepage of sand around a suction caisson during suction penetration. It took 500 s for the carmine stain to move from point B to the mudline, and the length of the seepage path was 3.21 cm. Tests revealed that the seepage paths of soil with different S in suction caissons had the same motion path. The results indicated that the seepage path of soil is unrelated to the S applied in the caisson and is affected by the penetration depth during the installation of the foundation. The seepage paths of the carmine stain in sand are plotted with a plane coordinate system, shown in Figure 4. It can be seen that there is an obvious trend: the streamline dyed by carmine stain moves toward the wall of the caisson model. Additionally, the larger the penetration depth, the more obvious was the streamline–adherent trend. It was observed that the seepage path lengths were 1.95 and 1.34 h when the penetration depths were equal to 5 and 15 cm, respectively. The distance between the carmine stain in the mudline and the inner wall of the caisson model was 0.375 times the diameter of the suction caisson, for h = 0.42, 0.83, and 1.25 L, respectively.

3.2. Hydraulic Gradient Analysis

In this paper, the test results prove that Darcy’s law is not applicable, and this phenomenon was also observed from the large test pressure difference found in the literature [22]. For the seepage velocity v, it was assumed that the streamlines around the caissons were stable and not affected by each other. The path lengths of the carmine stain were measured from test images. All results are presented in terms of dimensionless forms. The seepage velocity v of the sand was assumed to be affected by x/D and S/γ’h. The hydraulic gradient v/k of the sand in tests at the mudline was proposed by using the regression function, and can be expressed as follows:
v k = 0.163 [ 0.94 D S ( 0 . 5 D x ) γ h ] 0.76
where x is the abscissa value in Figure 1 and γ’ is the effective unit weight of soil.
The comparison of actual values and calculated values is shown in Figure 5. It can be seen that the fitted values agree well with the actual values. Compared with v/k obtained from tests, the fitted values have a residual sum of squares of about 1.467.
Figure 6 shows the hydraulic gradient of sand around a suction caisson with different x/D when the suction in the caisson is equal to 1.5 kPa. It can be seen that the hydraulic gradient v/k increases with the increase of x/D. The results indicated that the seepage velocity is larger as the streamline moves toward the wall of the suction caissons. The hydraulic gradient v/k, with x/D = 0.2675 and h/D = 1.25, is shown in Figure 7. It can be observed that the v/k increases with the increase of S/γ’h and the fitted values of the v/k agree well with the test results. The v/k when S/γ’h = 2.451 is 5.85 times greater than when S/γ’h = 0.351 in tests. The minimum relative error is 5.05% for Equation (1) when S/γ’h = 5.478. When h/D = 0.42, the streamline around the suction becomes disordered as a result of the larger applied suction (S = 1.5 kPa). Due to the assumption that the streamlines are stable and not affected by each other, the seepage velocity obtained is smaller than the actual situation, leading to large deviations as compared with Equation (1).

3.3. Soil Plug and Settlement Formation

During suction penetration, a part of the soil in the caissons gets into the open-ended hollow caisson cavity, forming a soil plug [23]. The final soil plugs in the caisson at the buried depth of 5 cm (caused by the caisson) are shown in Figure 8. The test results show that there is no soil plug in the caissons with small suction applied during suction penetration. The maximum heights of soil plugs in the suction caisson models with buried depths of 5, 10, and 15 cm are 0.169, 0.085, and 0.087 times the buried depths, respectively. It was observed that the suction caused settlement of the surrounding soils outside the caisson. The maximum soil settlement appeared a certain distance from the outer wall of a suction caisson due to caisson–soil friction.
Figure 9 shows the curves of the heights of soil plug hsp and of soil settlement hsettlement outside the caisson. Other test conditions not drawn in Figure 9 did not have the obvious soil plug and soil settlement around the suction caisson model. There is no obvious soil settlement outside the suction caisson with a buried depth of 15 cm. The height of soil plug hsp increases with the increase of x as a result of the distribution of seepage velocity, which is greater as it moves toward the wall of suction caissons.
The volume of soil plug Vsp and that of soil settlement Vsettlement were measured by using the volume formula after obtaining the size of the soil plug and settlement from the images. The comparison between the volume of soil plug Vsp and that of soil settlement Vsettlement in tests is shown in Table 3. The soil plug consists of the soil heaved by seepage force into the caisson, and the soil from outside into the caisson, leading to soil settlement around the foundation. It can be seen that the influence of settlement outside the caisson on the soil plug decreases as the buried depth rises. The soil plug is mainly influenced by the soil from outside into the caisson, and Vsettlement/Vsp = 1.581 due to the decrease in the void ratio of soil around the caisson caused by the seepage force during suction penetration when h = 5 cm and S = 1.0 kPa. The influence of the soil heaved by the soil plug increases with the increase of h. The volume of soil heaved begins to rise as the velocity of seepage reaches a certain value.

3.4. Prediction of Soil Plug Height

The relationship between the height of the soil plug hsp and the hydraulic gradient v/k was proposed by using quadratic regression, and can be expressed as follows:
h s p h = A + B S γ h + C ( S γ h ) 2 + D v k + E ( v k ) 2 + F S v γ h k ,
where AF are constant coefficients (given in Table 4). Figure 10 shows the comparison of actual values and fitted values for the dimensionless soil plug hsp/h. Fitted values are evenly distributed around the actual values. Compared with the actual values, the fitted values have an average relative error of about 28.74%.
Figure 11 shows the relationship between hsp/h and v/k when h = 15 cm. It is shown that the dimensionless soil plug hsp/h first increases and then decreases with the increase of v/k. The reason behind the decreased trend is that the soil plug is subjected to downward friction applied by the inner wall of the suction caisson. The combination of Equations (1) and (2) is used to predict roughly the height of soil plugs in suction caissons in sand during suction penetration, guiding project designs, and construction.

4. Conclusions

A series of model tests were conducted in this study to investigate the visualization of suction caisson penetration in sand. The following conclusions can be drawn:
(1)
The seepage field can be visualized while the carmine stain flows along a streamline in the soil around the suction caisson. The seepage velocity is larger as the streamline moves toward the wall of the suction caissons. The pre-test results show that the seepage failure took place in the sand when the suction in the caisson with buried depths of 5, 10, and 15 cm was greater than 2.0, 3.5, and 4.0 kPa, respectively. The results indicated that the seepage path of the soil is unrelated to S applied in the caisson and is affected by the penetration depth during the installation of the foundation.
(2)
The hydraulic gradient v/k of the sand in tests at the mudline was proposed by using the regression function. It can be seen that the fitted values agree well with the actual values. Darcy’s law is not applicable, and the hydraulic gradient v/k increases with the increase of x/D. The results indicated that the seepage velocity is larger as the streamline moves toward the wall of the suction caissons. The v/k when S/γ’h = 2.451 is 5.85 times greater than when S/γ’h = 0.351 in tests. The minimum relative error is 5.05% for Equation (1) when S/γ’h = 5.478.
(3)
There is no soil plug in the caissons with small suction applied during suction penetration. The maximum heights of the soil plugs in the suction caisson models with buried depths of 5, 10, and 15 cm are 0.169, 0.085, and 0.087 times the buried depths, respectively. The height of soil plug hsp increases with the increase of x as a result of the distribution of seepage velocity, which is greater as it moves toward the wall of suction caissons. The influence of the soil heaved by the soil plug increases with the increase of h. The volume of the soil heaved begins to rise as the velocity of the seepage reaches a certain value. The dimensionless soil plug hsp/h first increases and then decreases with the increase of v/k.

Author Contributions

Conceptualization, S.M. and L.X.; methodology, L.X. and S.M.; validation, T.L.; formal analysis, T.L. and S.M.; investigation, T.L. and S.M.; resources, data curation, T.L. and S.M.; writing original draft preparation, T.L. and S.M.; visualization, T.L. and S.M; supervision L.X.; project administration, L.X.; funding acquisition, L.X. All authors have read and agreed to the published version of the manuscript.

Funding

This work was financially supported by the Chinese National Natural Science Foundation (No. 51479137).

Conflicts of Interest

The authors declare no conflict of interest.

Notation

SApplied suction in the caisson
HWater head
γwUnit weight of water (10 kN/m3)
DExternal diameter of the suction caisson
LHeight of the suction caisson
TThickness of the wall of the suction caisson
ρdDry density of the sand
GsSpecific gravity of the sand
d10Effective size of the sand
eVoid ratio of the sand
γsatSaturated weight of the sand
kPermeability coefficient
hBuried depth of the suction caisson
xAbscissa value in Figure 1
γEffective unit weight of soil
cCohesion of soil
φAngle of internal friction
hspHeight of soil plug
hsettlementSoil settlement outside the caisson

References

  1. Jalbi, S.; Arany, L.; Salem, A.; Cui, L.; Bhattacharya, S. A method to predict the cyclic loading profiles (one-way or two-way) for monopile supported offshore wind turbines. Mar. Struct. 2019, 63, 65–83. [Google Scholar] [CrossRef] [Green Version]
  2. Chen, J.; Hu, Z.; Liu, G.; Wan, D. Coupled aero-hydro-servo-elastic methods for floating wind turbines. Renew. Energy 2019, 130, 139–153. [Google Scholar] [CrossRef] [Green Version]
  3. Li, D.; Ma, S.; Zhang, Y. Undrained pullout capacity of modified suction caisson in clay by finite element limit analysis. Mar. Georesour. Geotechnol. 2019, 37, 291–300. [Google Scholar] [CrossRef]
  4. Guo, Z.; Jeng, D.; Guo, W.; Wang, L. Failure mode and capacity of suction caisson under inclined short-term static and one-way cyclic loadings. Mar. Georesour. Geotechnol. 2018, 36, 52–63. [Google Scholar] [CrossRef] [Green Version]
  5. Lee, J.; Tran, N.X.; Kim, S. Development and field application of GFRP suction pile. Ocean Eng. 2019, 173, 308–318. [Google Scholar] [CrossRef]
  6. Li, D.; Ma, S.; Zhang, Y.; Chen, F. Lateral Bearing Capacity of Modified Suction Caissons Determined by Using the Limit Equilibrium Method. China Ocean Eng. 2018, 32, 461–466. [Google Scholar] [CrossRef]
  7. Byrne, B.W.; Houlsby, G.T. Experimental Investigations of the Response of Suction Caissons to Transient Combined Loading. J. Geotech. Geoenviron. 2004, 130, 240–253. [Google Scholar] [CrossRef] [Green Version]
  8. Kourkoulis, R.S.; Lekkakis, P.C.; Gelagoti, F.M.; Kaynia, A.M. Suction caisson foundations for offshore wind turbines subjected to wave and earthquake loading: Effect of soil-foundation interface. Géotechnique 2014, 64, 171. [Google Scholar] [CrossRef] [Green Version]
  9. Ukritchon, B.; Wongtoythong, P.; Keawsawasvong, S. New design equation for undrained pullout capacity of suction caissons considering combined effects of caisson aspect ratio, adhesion factor at interface, and linearly increasing strength. Appl. Ocean Res. 2018, 75, 1–14. [Google Scholar] [CrossRef]
  10. Chen, F.; Lian, J.; Wang, H.; Liu, F.; Wang, H.; Zhao, Y. Large-scale experimental investigation of the installation of suction caissons in silt sand. Appl. Ocean Res. 2016, 60, 109–120. [Google Scholar] [CrossRef] [Green Version]
  11. Houlsby, G.T.; Byrne, B.W. Design procedures for installation of suction caissons in sand. Proc. Inst. Civil Eng. Geotechnol. 2005, 158, 135–144. [Google Scholar] [CrossRef]
  12. Senders, M.; Randolph, M.F. CPT-Based Method for the Installation of Suction Caissons in Sand. J. Geotech. Geoenviron. 2009, 135, 14–25. [Google Scholar] [CrossRef]
  13. Andersen, K.H.; Jostad, H.P.; Dyvik, R. Penetration Resistance of Offshore Skirted Foundations and Anchors in Dense Sand. J. Geotech. Geoenviron. 2008, 134, 106–116. [Google Scholar] [CrossRef]
  14. Erbrich, C.T.; Tjelta, T.I. Installation of bucket foundations and suction caissons in sand-geotechnical performance. In Proceedings of the Offshore Technology Conference 1999, Houston, TX, USA, 3–6 May 1999. [Google Scholar]
  15. Harireche, O.; Mehravar, M.; Alani, A.M. Suction caisson installation in sand with isotropic permeability varying with depth. Appl. Ocean Res. 2013, 43, 256–263. [Google Scholar] [CrossRef] [Green Version]
  16. Tran, M.N.; Randolph, M.F.; Airey, D.W. Study of Sand Heave Formation in Suction Caissons Using Particle Image Velocimetry (PIV). In Frontiers in Offshore Geotechnics, Proceedings of the 1st International Symposium on Frontiers in Offshore Geotechnics, Perth, Australia, 19–21 September 2005; Francis: London, UK, 2005; pp. 259–265. [Google Scholar]
  17. Harireche, O.; Mehravar, M.; Alani, A.M. Soil conditions and bounds to suction during the installation of caisson foundations in sand. Ocean Eng. 2014, 88, 164–173. [Google Scholar] [CrossRef] [Green Version]
  18. Allersma, H. Centrifuge Research on Suction Piles: Installation and Bearing Capacity. In BGA International Conference on Foundations: Innovations, Observations, Design and Practice, Proceedings of the International Conference Organised by British Geotechnical Association and Held in Dundee, Dundee, UK, 2–5 September 2003; Thomas Telford Publishing: London, UK, 2003; pp. 91–98. [Google Scholar]
  19. Tran, M.N.; Randolph, M.F.; Airey, D.W. Installation of Suction Caissons in Sand with Silt Layers. J. Geotech. Geoenviron. 2007, 133, 1183–1191. [Google Scholar] [CrossRef]
  20. Tran, M.N.; Airey, D.W.; Randolph, M.F. Study of Seepage Flow and Sand Plug Loosening in Installation of Suction Caissons in Sand. In Proceedings of the Fifteenth International Offshore and Polar Engineering Conference, Seoul, Korea, 19–24 June 2005; International Society of Offshore and Polar Engineers: Mountain View, CA, USA, 2005. [Google Scholar]
  21. Lu, T.; Liu, Z. Advanced Soil Mechanics; China Machine Press: Beijing, China, 2006. [Google Scholar]
  22. Wang, L.; Li, Y.; Zhao, G.; Chen, N.; Xu, Y. Experimental Investigation of Flow Characteristics in Porous Media at Low Reynolds Numbers (Re→0) under Different Constant Hydraulic Heads. Water 2019, 11, 2317. [Google Scholar] [CrossRef] [Green Version]
  23. Guo, W.; Chu, J.; Kou, H. Model tests of soil heave plug formation in suction caisson. Proc. Inst. Civil Eng. Geotechnol. 2016, 169, 214–223. [Google Scholar] [CrossRef]
Figure 1. Test devices.
Applsci 10 00566 g001
Figure 2. The siliceous sand in tests.
Applsci 10 00566 g002
Figure 3. The visualization of seepage flow at point B with h = 15 cm and S = 0.5 kPa.
Applsci 10 00566 g003
Figure 4. The seepage path of the carmine stain in sand.
Applsci 10 00566 g004
Figure 5. The comparison of actual values and fitted values for v/k.
Applsci 10 00566 g005
Figure 6. The hydraulic gradient with S = 1.5 kPa.
Applsci 10 00566 g006
Figure 7. The hydraulic gradient with x/D = 0.2675 and h/D = 1.25.
Applsci 10 00566 g007
Figure 8. The soil plug in the caisson.
Applsci 10 00566 g008
Figure 9. The height of soil plug and soil settlement outside the caisson.
Applsci 10 00566 g009
Figure 10. The comparison of actual values and fitted values for the dimensionless soil plug hsp/h.
Applsci 10 00566 g010
Figure 11. The relationship between hsp/h and v/k when h = 15 cm.
Applsci 10 00566 g011
Table 1. Properties of siliceous sand.
PropertySpecific Gravity
Gs
Void Ratio
e
Saturated Weight
γsat (kN/m3)
Permeability Coefficient
k (cm/s)
Cohesion
c (kPa)
Angle of Internal Friction
φ (°)
Value2.660.7519.50.28031
Table 2. List of visual tests on suction caissons.
Buried Depth h (cm)Suction S (kPa)
50.51.01.5----
100.51.01.52.02.53.0-
150.51.01.52.02.53.03.5
Table 3. The volume of soil plug and soil settlement in tests.
h = 5 cmh = 10 cmh = 15 cm
S = 0.1 kPaS = 1.5 kPaS = 2.5 kPaS = 3.0 kPaS = 3.5 kPaS = 4.0 kPa
Vsettlement (cm3)0.5440.9700.0200.4730.0000.000
Vsp (cm3)0.3441.5200.5191.9540.8492.827
Vsettlement/Vsp1.5810.6380.0390.2420.0000.000
Table 4. Optimal value of constant coefficients for hsp/h.
ABCDEF
0.57495−0.493700.097590.05075−0.021680.02252

