Article

Key Strata Identification of Overburden Based on Magnetotelluric Detection: A Case Study

1
School of Energy Science and Engineering, Henan Polytechnic University, Jiaozuo 454003, China
2
Huizhou Urban Transportation Planning Institute, Guangdong 516000, China
3
Synergism Innovative Centre of Coal Safety Production in Henan Province, Jiaozuo 454003, China
4
Henan Jinghui Technology Co., Ltd., Zhengzhou 450000, China
*
Author to whom correspondence should be addressed.
Appl. Sci. 2020, 10(2), 558; https://doi.org/10.3390/app10020558
Submission received: 13 November 2019 / Revised: 8 January 2020 / Accepted: 10 January 2020 / Published: 12 January 2020

Abstract

:
The severe overburden failure induced by high-intensity mining is the essence of eco-environmental problems in Northwest China, and the degree of overburden failure is closely related to the location and failure of key strata (KS), which controls part of the strata in the overburden. In order to solve the problems of traditional KS based on mechanical parameters and numerical simulation methods that are time consuming, complex, expensive, and work intensive, it is necessary to find a simple and fast KS identification method. Based on the KS theory, which has been successfully applied in the field practice for nearly 30 years, and its current identification method by calculation or software, the magnetotelluric (MT) detection method was selected. According to the principle of MT detection method, the main influencing factors were analyzed. By summing up the relationship between the geological characteristics of the KS and its apparent resistivity (AR), the AR trends of ten kinds of lithology are given, and the identification mechanism of the MT detection method is revealed. Through the field measurement in Daliuta coalmine and the accuracy verification by the theory calculation, the KS obtained by the two methods are consistent. The results show that the MT detection method can be used to quickly identify the KS, and it is simple, convenient, and fast. It provides a reference for optimizing mining technology, mine pressure control, and mine precision.

1. Introduction

China is a large coal producer and energy consumer, which is mainly because coal is the primary energy source and provides the basis of the energy infrastructure necessary for long-term, rapid economic growth [1]. With the continuous development of mining methods, technical equipment, and the Internet, the high-intensity mining of thick coal seams has become an important development direction of China’s coal mining technology, especially in the fragile eco-environment area of Northwest China [2]. However, the exploitation of coal resources can lead to a series of serious environmental problems, the essence of which is that the overburden failure is relatively severe [3,4]. Moreover, the degree of overburden failure is closely related to the location and failure of key strata (KS) [5,6,7,8,9,10]. As is well-known, the overburden is composed of different strata with variable characteristics; thus, the mining effects on each stratum is different. For the hard and thick strata, they may have a stronger bearing capacity, supporting those weak and thin strata that only act as loads. Based on these differences, the KS theory was proposed [11]. According to the KS theory, the hard and thick stratum is named KS; as a result, overburden has at least one KS. If there are more than two KS, as shown in Figure 1 [12], the top KS is named the primary KS (PKS), as it bears the entire load from its roof to ground surface. Correspondingly, the other KS is named the sub-key strata (SKS), that controls partial overburden strata [13].
At present, the identification method of KS mainly relies on the lithology calculation, ground drilling, and laboratory simulation. Wen et al. [14] found that the key stratum has a significant impact on the behavior of the strata in a stope by theoretical calculation, and divided it into a “single key stratum” structure and a “double key strata” structure. Ju et al. [15] adopted in-situ investigation of surface boreholes and found a strong correlation between dislocation inside the boreholes and the location of the key strata, from which the fracture and movement of the key strata with the advancing process of the working face was inverted. Kuang et al. [16] carried out an in-situ investigation to determine the law of fracture and movement of a key stratum. Li et al. [17] defined the movement type of SKS by theoretical analysis and numerical simulation, and verified the correctness of the support working resistance formula under different types by field measurement. Xie and Xu [18] used numerical simulation methods to study the key strata with different thicknesses and heights, and got the relationship between the key strata and the abutment pressure. Meanwhile, Xu and Qian [19] developed the distinguishing software of key strata with the C# language.
Based on the existing references, the identification of KS needs to be calculated according to the rock’s mechanical parameters. However, for the mining areas with unknown mechanical parameters, it is important to find a proper way to accurately identify the KS in order to avoid the time-consuming, complex, and labor-intensive of the laboratory simulation method, so as to ensure the safety production and mine pressure control. Combined with the development of geophysical exploration, it has become a hot topic in detecting overburden structure and failure [20,21,22,23]. Among the methods, magnetotelluric (MT) detection is a simple and convenient one, which has been applied to the identification and detection of water-rich coal seams, thin interbeds, overburden failure, geothermal resources, karst, collapse areas, fault structures, and overburden fractures in the goaf area. Some engineering application examples of MT detection method in coalmines are shown in Table 1.
As shown in Table 1, the detection depth is less than 1500 m, mostly less than 600 m though. Moreover, the detection results are basically consistent with the actual situation, which provides technical support for the MT detection technique to analyze key strata of overlying strata. Therefore, it is necessary to study whether MT detection can be applied to the identification of KS.

2. MT Detection Method

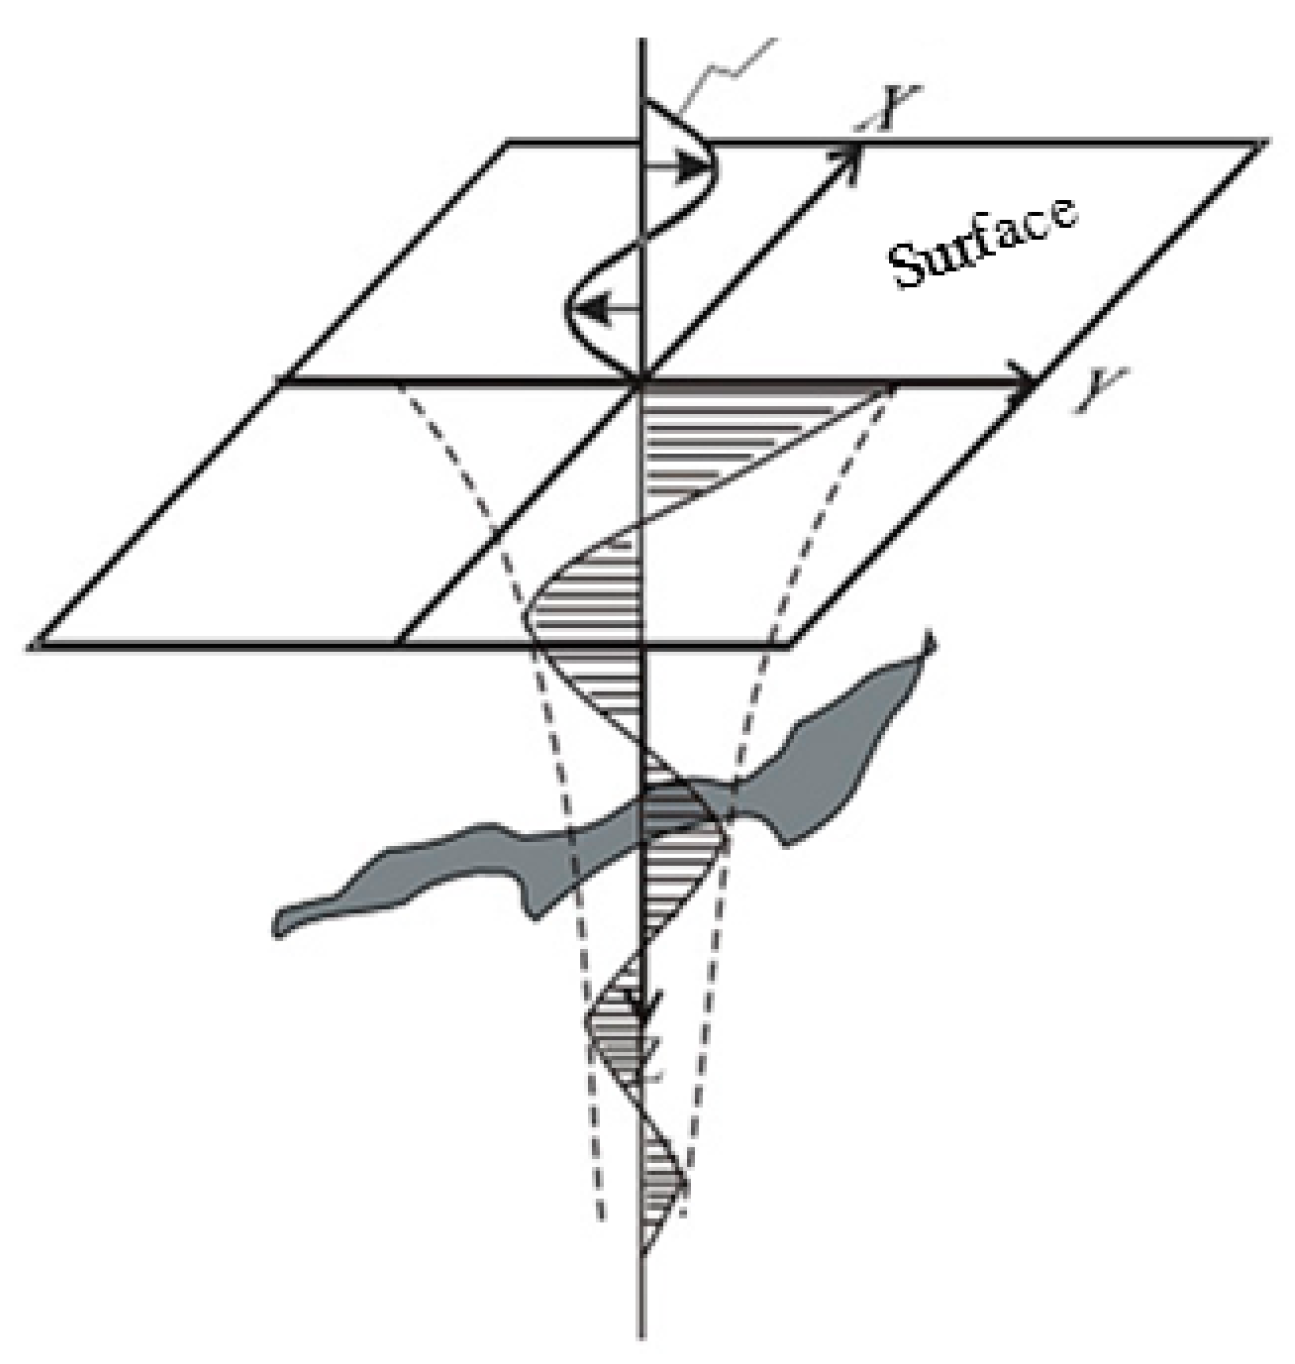
2.1. Technical Principle

With the development of MT detection technique, new technical means have been provided for the detection of overburden structure and fractures. It is an important geophysical means to study the electrical structure of the earth’s interior with the natural electromagnetic field as the field source [24]. Although rock resistivity is affected by many factors, under certain conditions, its resistivity is a constant value and has certain regularity. For example, the resistivity of rocks in the same area, age, and lithology is generally similar. Therefore, as long as the resistivity characteristics of various rocks are mastered, geological sections can be divided. The results of data inversion technology reveal that the geological characteristics of rock strata are visual, accurate, and efficient. Different lithology has obvious differences in material composition, cements, and consolidation. According to the skin theory, different strata contain their corresponding frequencies and amplitudes. By detecting the electromagnetic wave signal, lithology and fluid information of different depth strata, the underground lithology interface, and the structure can be analyzed. Therefore, its basic principle is to analyze the surface material depth and electrical structures of electromagnetic waves with different frequencies when they pass through the strata, and to obtain the electromagnetic response array of the earth with these frequencies from high to low, as shown in Figure 2. This is because different strata have different compositional, cement, and consolidation properties [25], which can be used to analyze the overburden nature, activity, interface, coal seam, aquifer, geothermal activity, and geological structure.
Based on its technical principle, it has the advantages of higher resolution, great depth detection, low cost, and easy construction. In theory, wave impedance is a ratio that electric field E and horizontal component of magnetic field H in the uniform and horizontal layered strata (Equations (1)–(3)).
Z = | E H | e i ( φ E φ H )
ρ x y = 1 5 f | Z x y | 2 = 1 5 f | E x H y | 2
ρ y x = 1 5 f | Z y x | 2 = 1 5 f | E y H x | 2 ,
where: f—frequency, Hz; ρ—resistivity, Ω m; E—electric field intensity, mv/km; H—magnetic field intensity, nT; φE—electric filed phase; φH—magnetic field phase, mrad.
The skin depth (δ) is propagation depth when the amplitude attenuation of electromagnetic wave (E, H) decays to 1/e of the initial value in the strata, as shown in Formula (4).
δ = 503 ρ f
According to the above formula, skin depth varies with resistivity and frequency. It can be seen that when the resistivity is a constant, the propagation depth or detection depth of electromagnetic wave is inversely proportional to the frequency; i.e., high frequency corresponds to electrical property features in shallow strata, and vice versa. Therefore, the different frequency electromagnetic waves can be used to identify the strata depth. Moreover, the apparent resistivity (AR) and apparent phase can be calculated by observing the electric and magnetic field information in the broadband. Subsequently, the geoelectric characteristics and strata structure can be determined. Based on the characteristics of key strata, the relationship between the geological characteristics of overburden KS and its AR response are shown in Figure 3. Therefore, based on its basic principle, combined with inversion analysis and visualization technology, the KS of overburden can be identified.

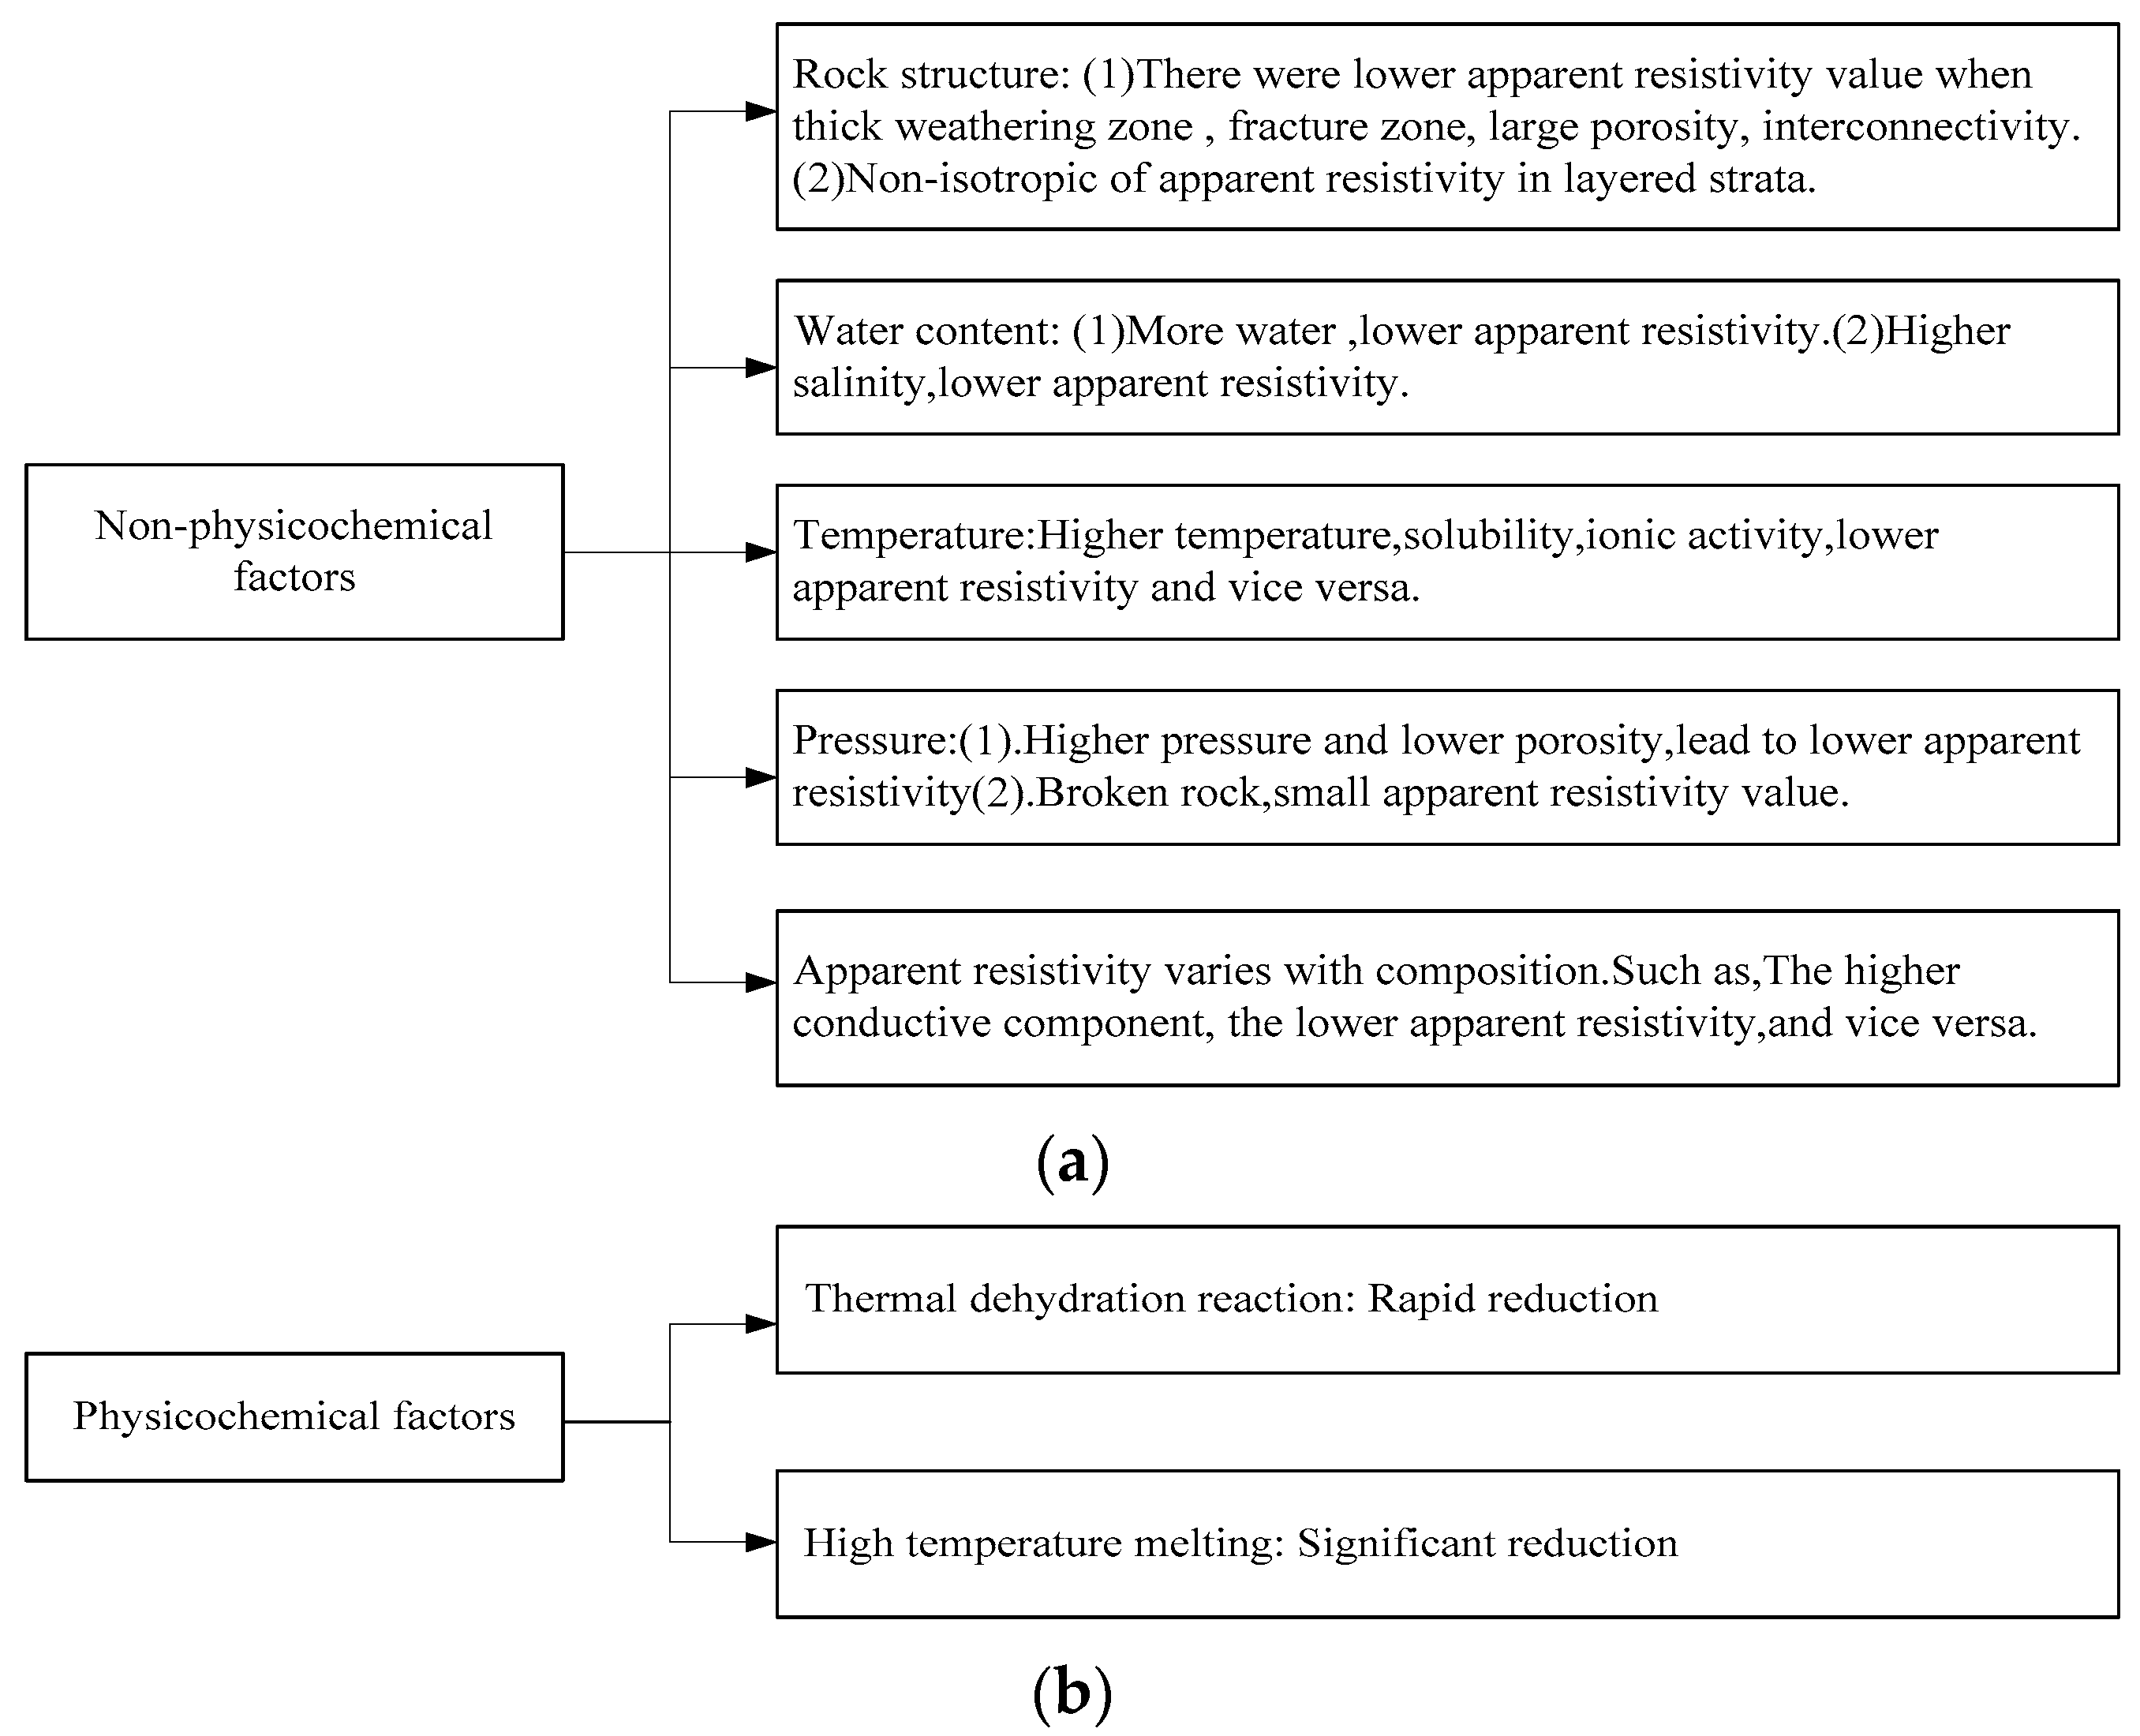
2.2. Influencing Factors

Resistivity is a parameter used to describe the physical properties of rocks under ideal conditions. Under natural conditions, in addition to rock components, there are many factors that affect the rock’s resistivity, including structure, porosity, water content, etc. [26]. Due to a stratum being a combination of many materials and structures, it is difficult to accurately calculate its resistivity. Consequently, resistivity is replaced by AR in the research and engineering. Thus, AR is not a real resistivity value, but a parameter reflecting the comprehensive characteristics of overlying strata, and a comprehensive product that reflects the conductivity and topography of strata. Formula (5) is the calculation of AR.
ρ s = K Δ U M N I ,
where K is electrode coefficient; I is measured current, A; ΔUMN is potential difference, V.
Because there are a large number of fractures, structures, water, and other fluids or other conductive media in the strata, the resistivity value of a stratum is less than its AR. The AR of overlying strata with high porosity and permeability obviously depends on the fluid and conductivity. In general, dense strata have fewer pores, fluids, and higher AR, and vice versa. Meanwhile, the main influencing factors of AR are shown in Figure 4.

3. Identification Mechanism of MT Detection

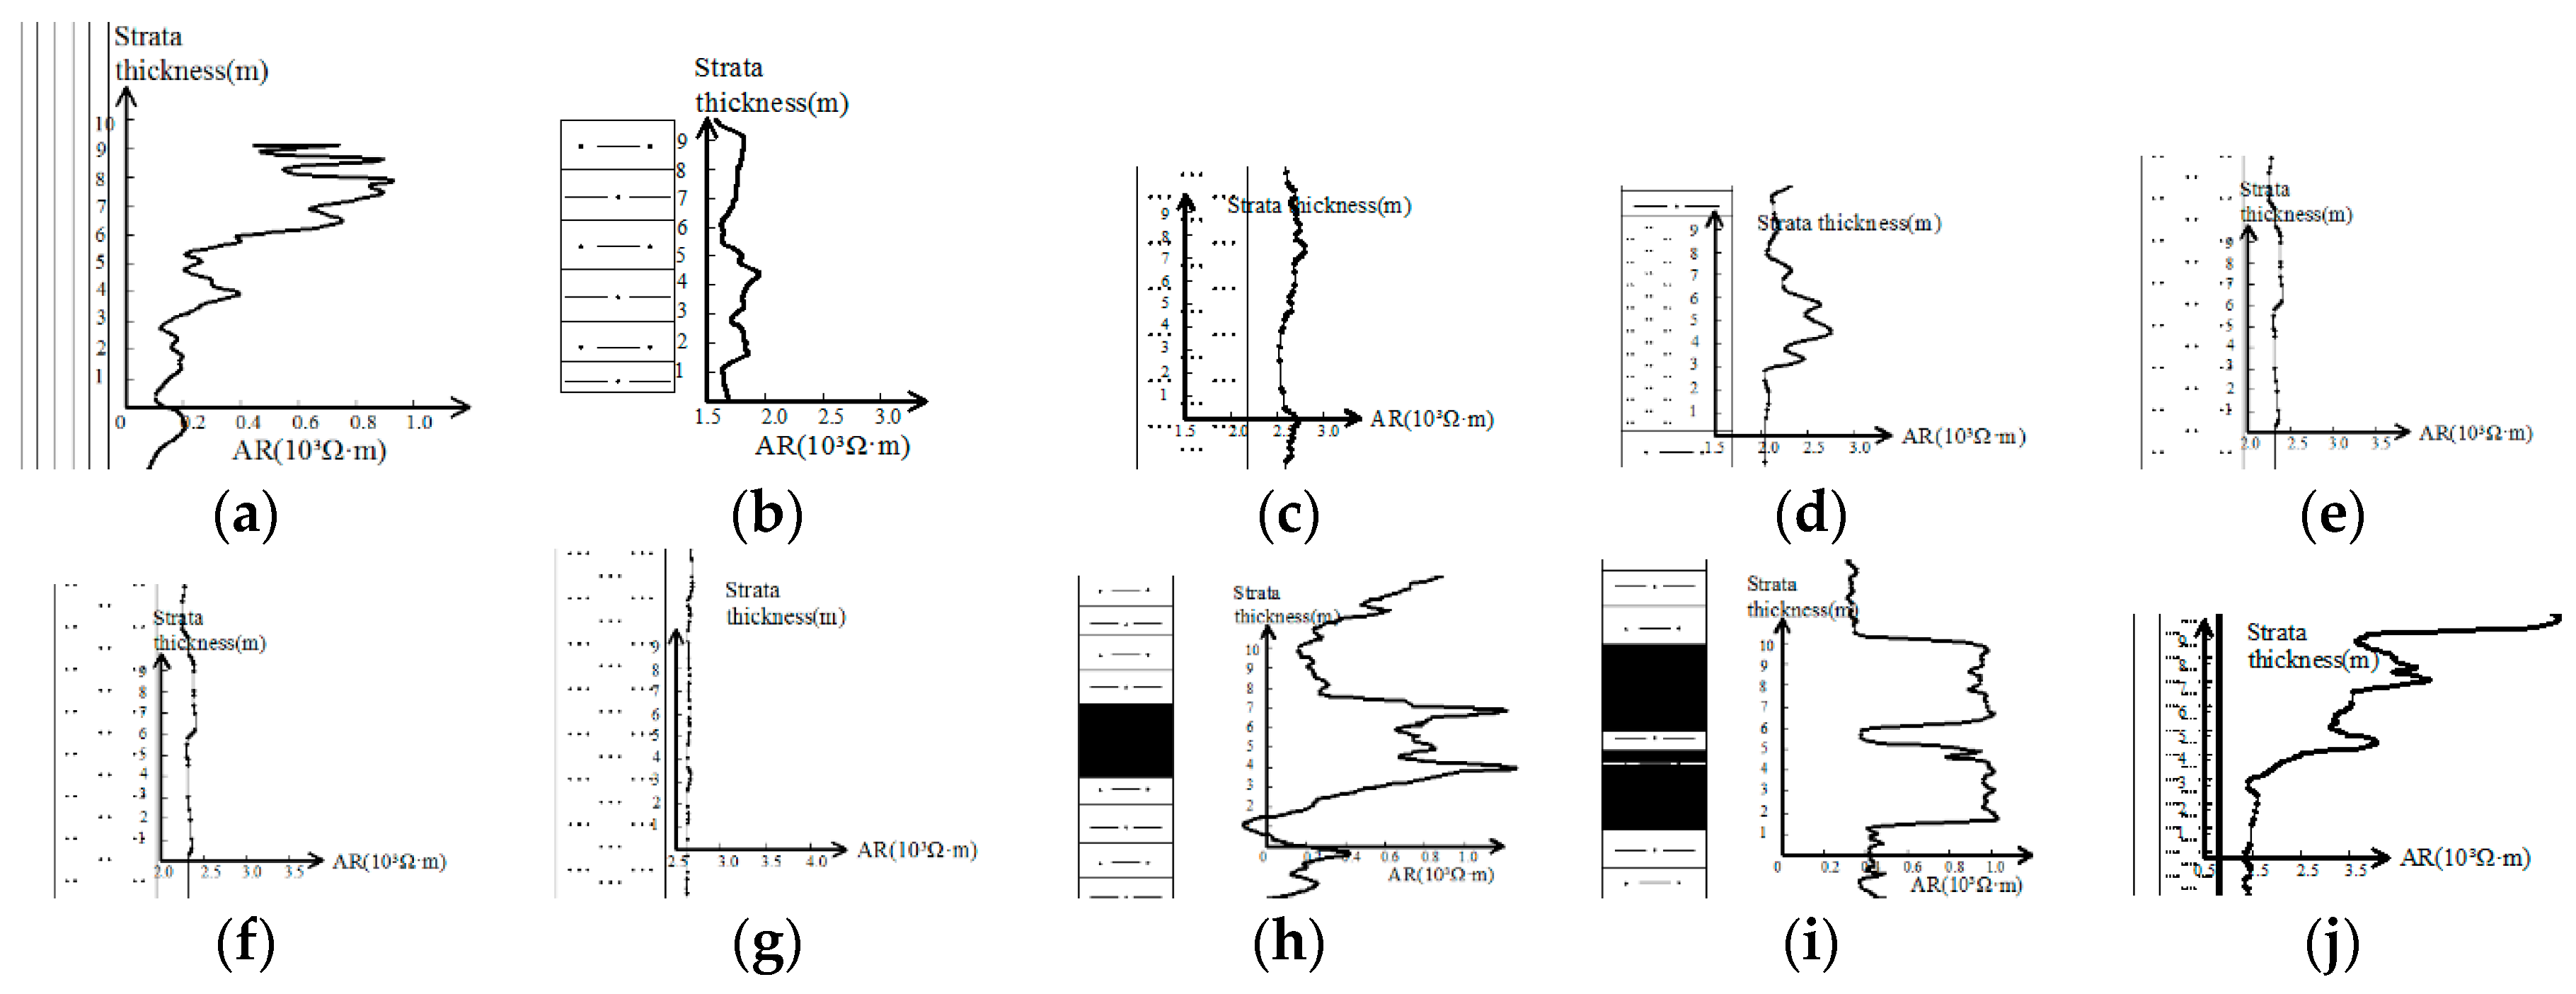
3.1. The Characteristics of Overburden AR

The characteristics of overburden AR can be obtained by using the inversion technology [27]. The instrument used this time was a CAN-I MT lithology detector produced by Zhengzhou City, Henan Province, China. Through the comparison and analysis of the detected characteristic points and the borehole histogram, the relationship between the AR and the stratum lithology was obtained. For the mining area without accurate mechanical parameters, the AR characteristics of different strata can be used to determine the lithology of strata. Figure 5 shows the AR characteristic of 10 kinds of rock strata, which come from the Buertai coalmine near the study area.
As shown in Figure 5, it can be seen that the AR of different strata have different trends. The AR curve of a dense and single component stratum is smooth, and the curve fluctuation is small, while the unconsolidated layer has a significant fluctuation because of its porosity and many components. In addition, under the dry condition, the denser the stratum is, the larger the AR is, and vice versa.

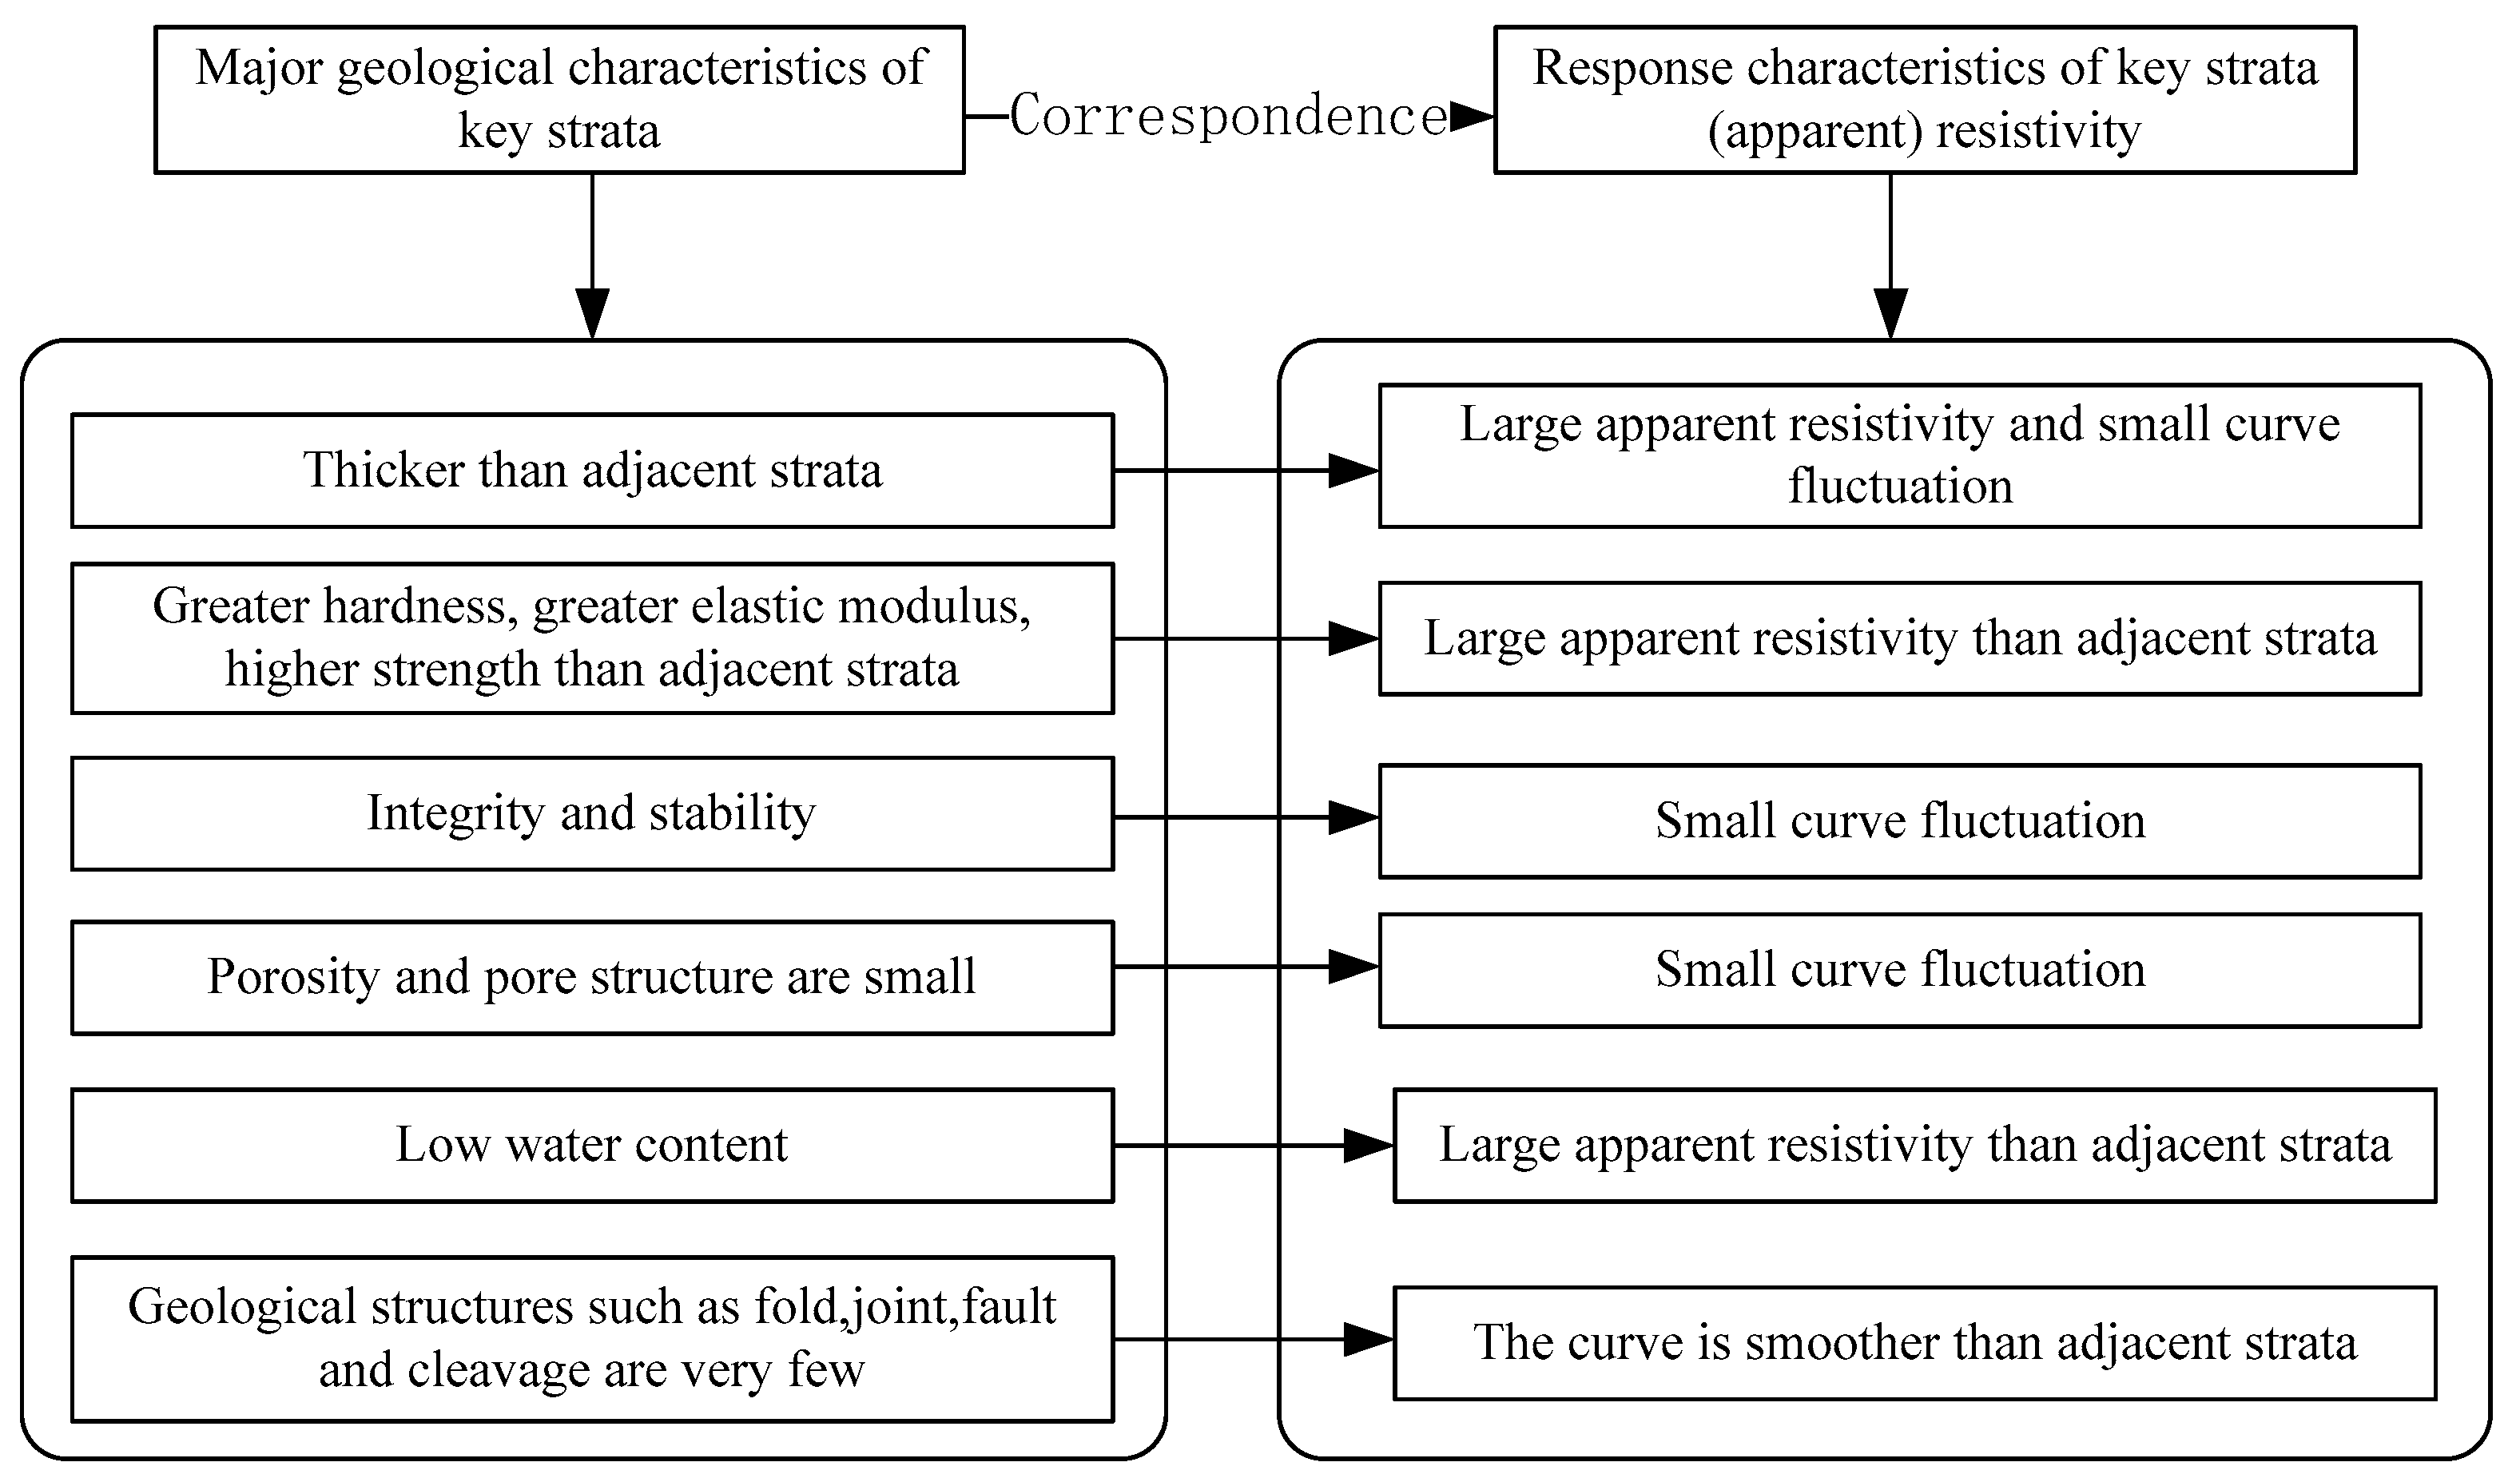
3.2. Strata Identification Mechanism

In order to identify strata, many researchers have studied the “threshold value” of AR [28,29]. Based on the basic principle of MT detection, the lithology and thickness of strata can be determined by studying the characteristics of AR curve of different strata, so as to identify each stratum. According to the principle of relative error of AR in one-dimensional medium model, a method of identifying strata is provided, as shown in Equation (6).
η = | i 1 n ρ i n ρ n ρ | × 100 % ,   ( i = 1 , 2 , 3 n ) .
Generally, ρ is uniform half-space resistivity without thin layer; i is each frequency point’s AR in the presence of a thin layer. In this paper, the relative error of 5% AR is taken as the resolution standard; that is, when the relative error of overburden AR is greater than 5%, it will be regarded as a distinguishable anomaly.

4. Engineering Application

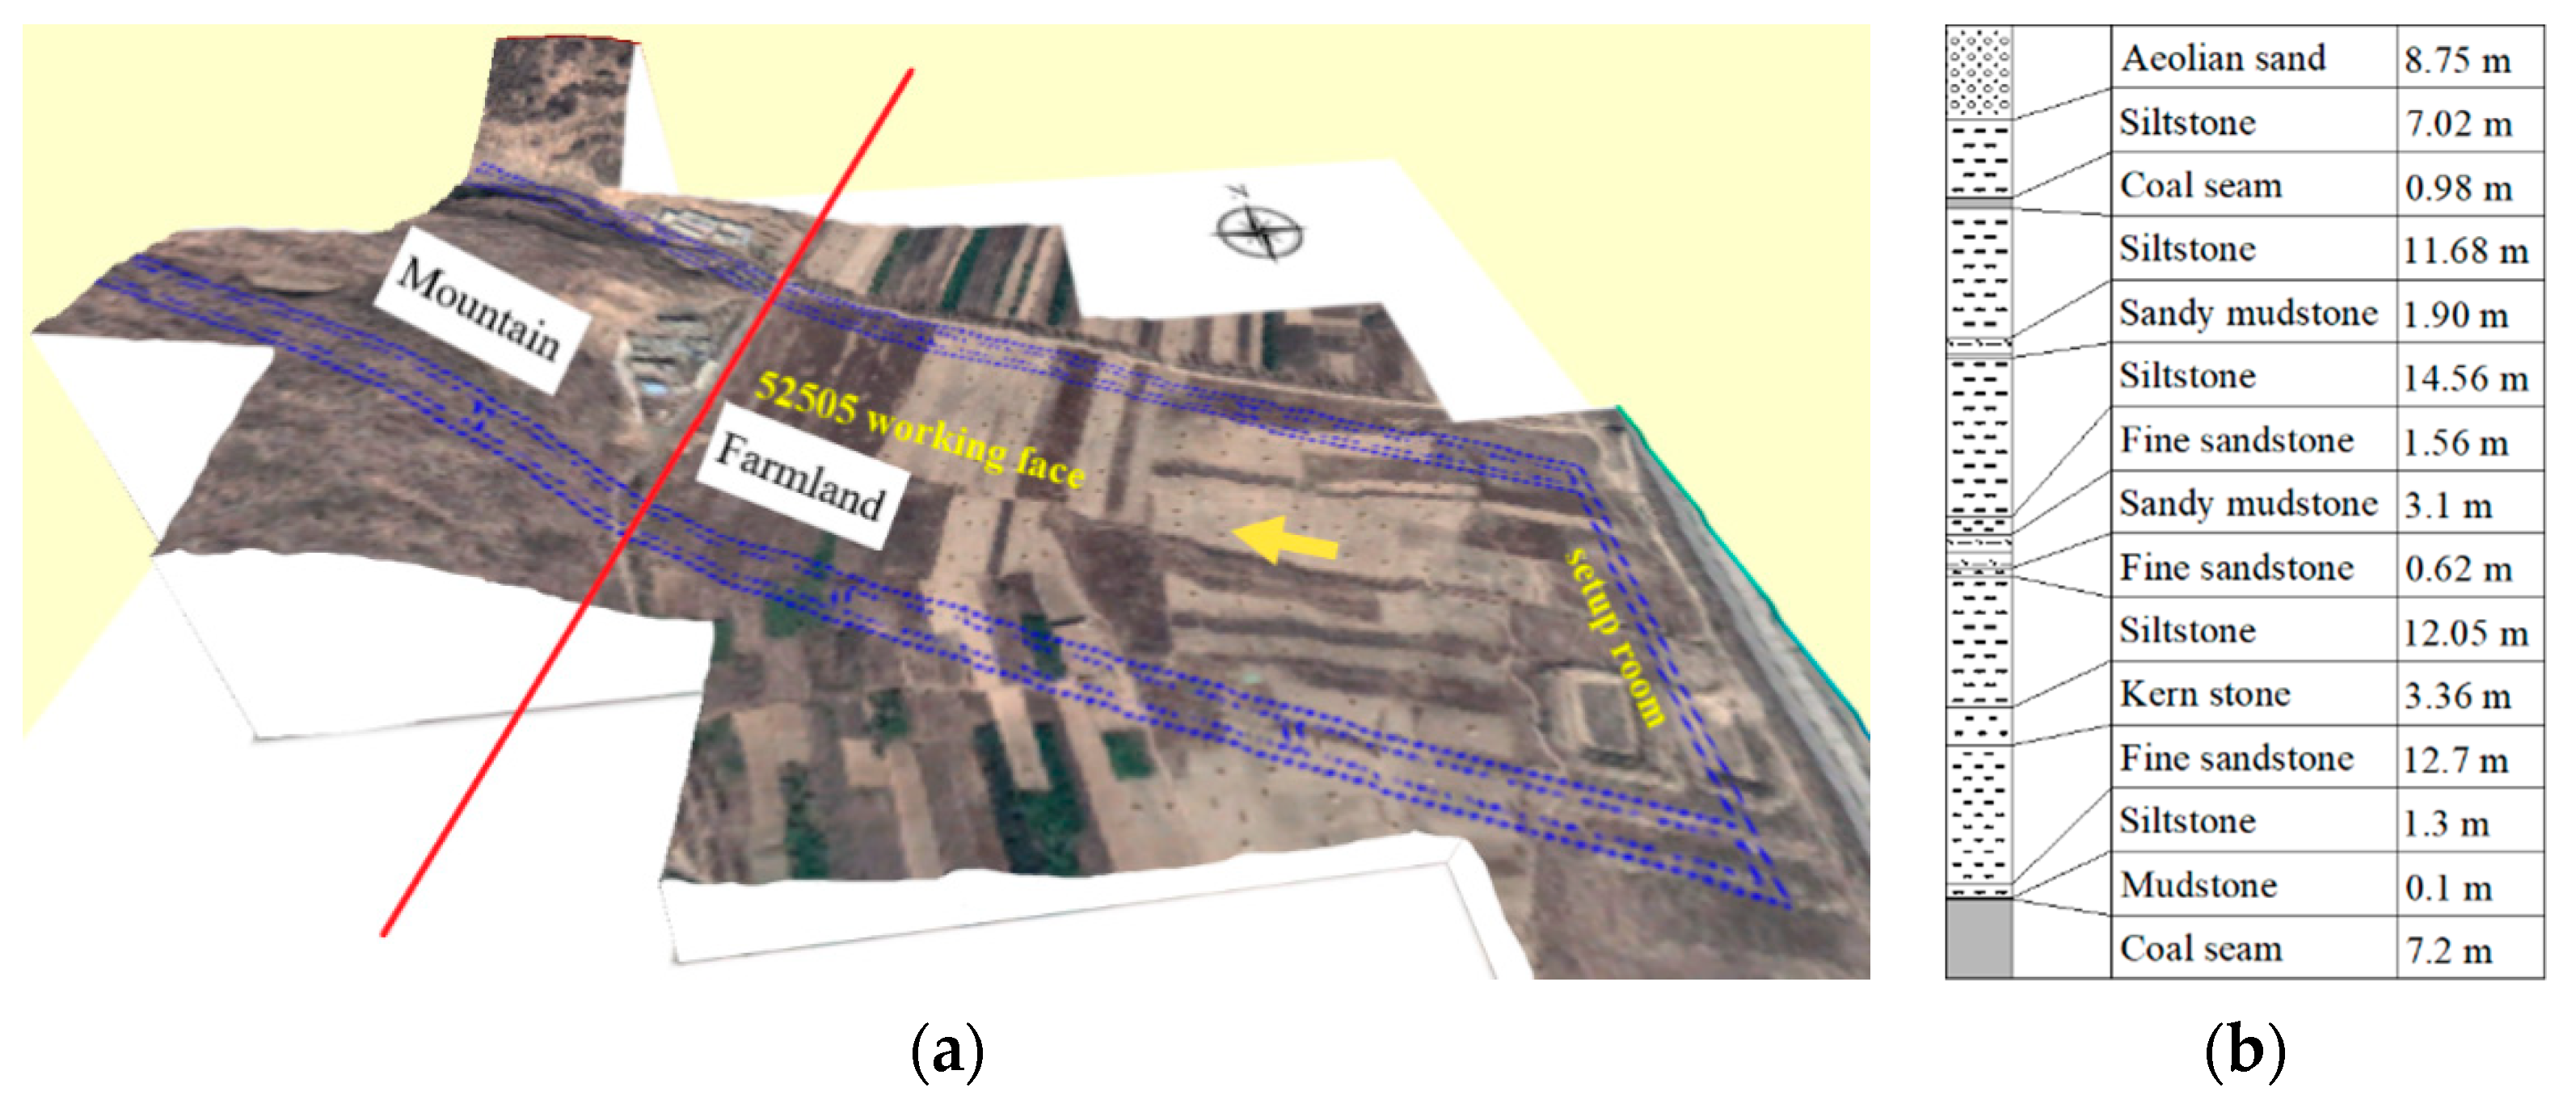
4.1. Region Overview

The Daliuta coalmine (in Shenmu District, China) has a designated capacity of 21.7 million t/a. The mineable coal is the number 52 coal seam of the Yan’an Formation of the Triassic system with an average thickness of 7.2 m and average buried depth of 90 m; it has a stable horizon and simple structure. According to the concept of high-intensity mining [30], the 52,505 working face, located in the number 5 panel, belongs to high-intensity mine with a length of 4268 m, a width of 301 m, and a mining speed is 13.84 m/d. The working face adopts large mining height technology and the caving method to manage the roof. The surface topography above the working face and the drilling histogram of working face are shown in Figure 6.
Based on the engineering design and the high-intensity mining technique characteristics [2,31], the overburden and surface will be seriously damaged after the 52,505 working face has mined, which could easily lead to geological disaster and environmental damage. Therefore, it is suitable for MT detection.

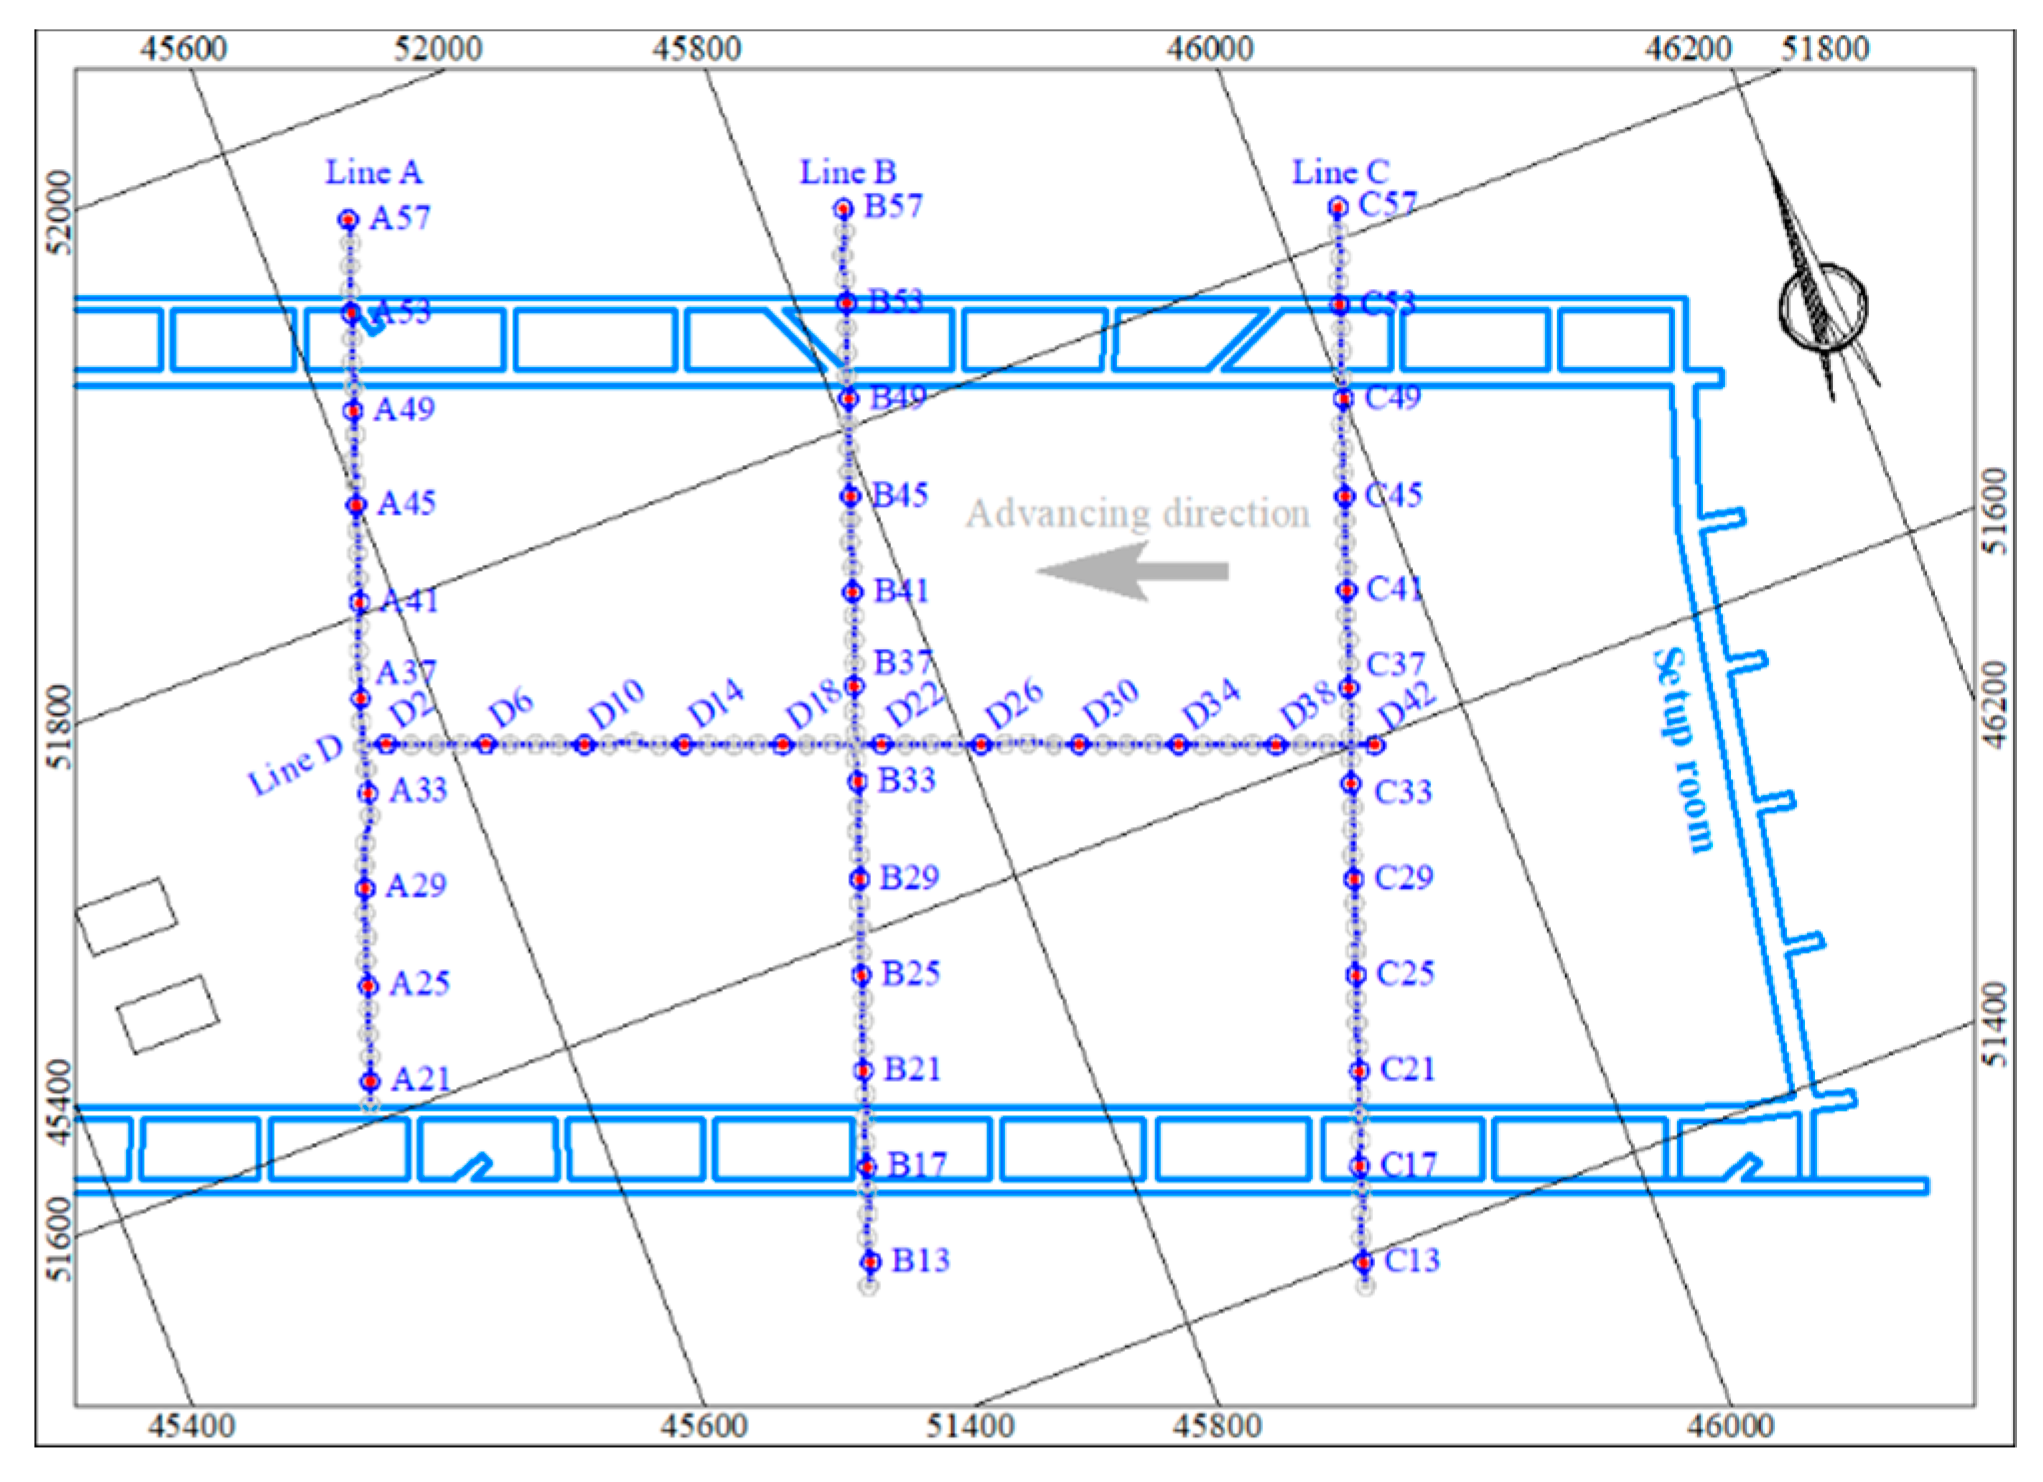
4.2. Observation Scheme

According to the geological condition and its surface topography, it is a convenient area for MT detection from setup room to 550 m of the advancing length of working face, while the area from 550 m to 4268 m is not suitable for detection because of it is aeolian sand gully area with a drop of up to 140 m. Consequently, the relatively flat area above the setup room of working face was selected for MT detection to identify the KS. Four detection lines were set on the ground surface (as shown in Figure 7), wherein the A, B, and C lines were parallel to the width of working face, and the distance between adjacent two lines was 200 m. The D line was parallel to the length of working face and located at center. The distance between measuring points was 10 m.

4.3. Key Strata Analysis and Discussion

In order to study the KS characteristics of working face, two MT detections have been carried out with an interval of 60 days. The analysis of AR from characteristic points, major sections, and KS, is as follows.

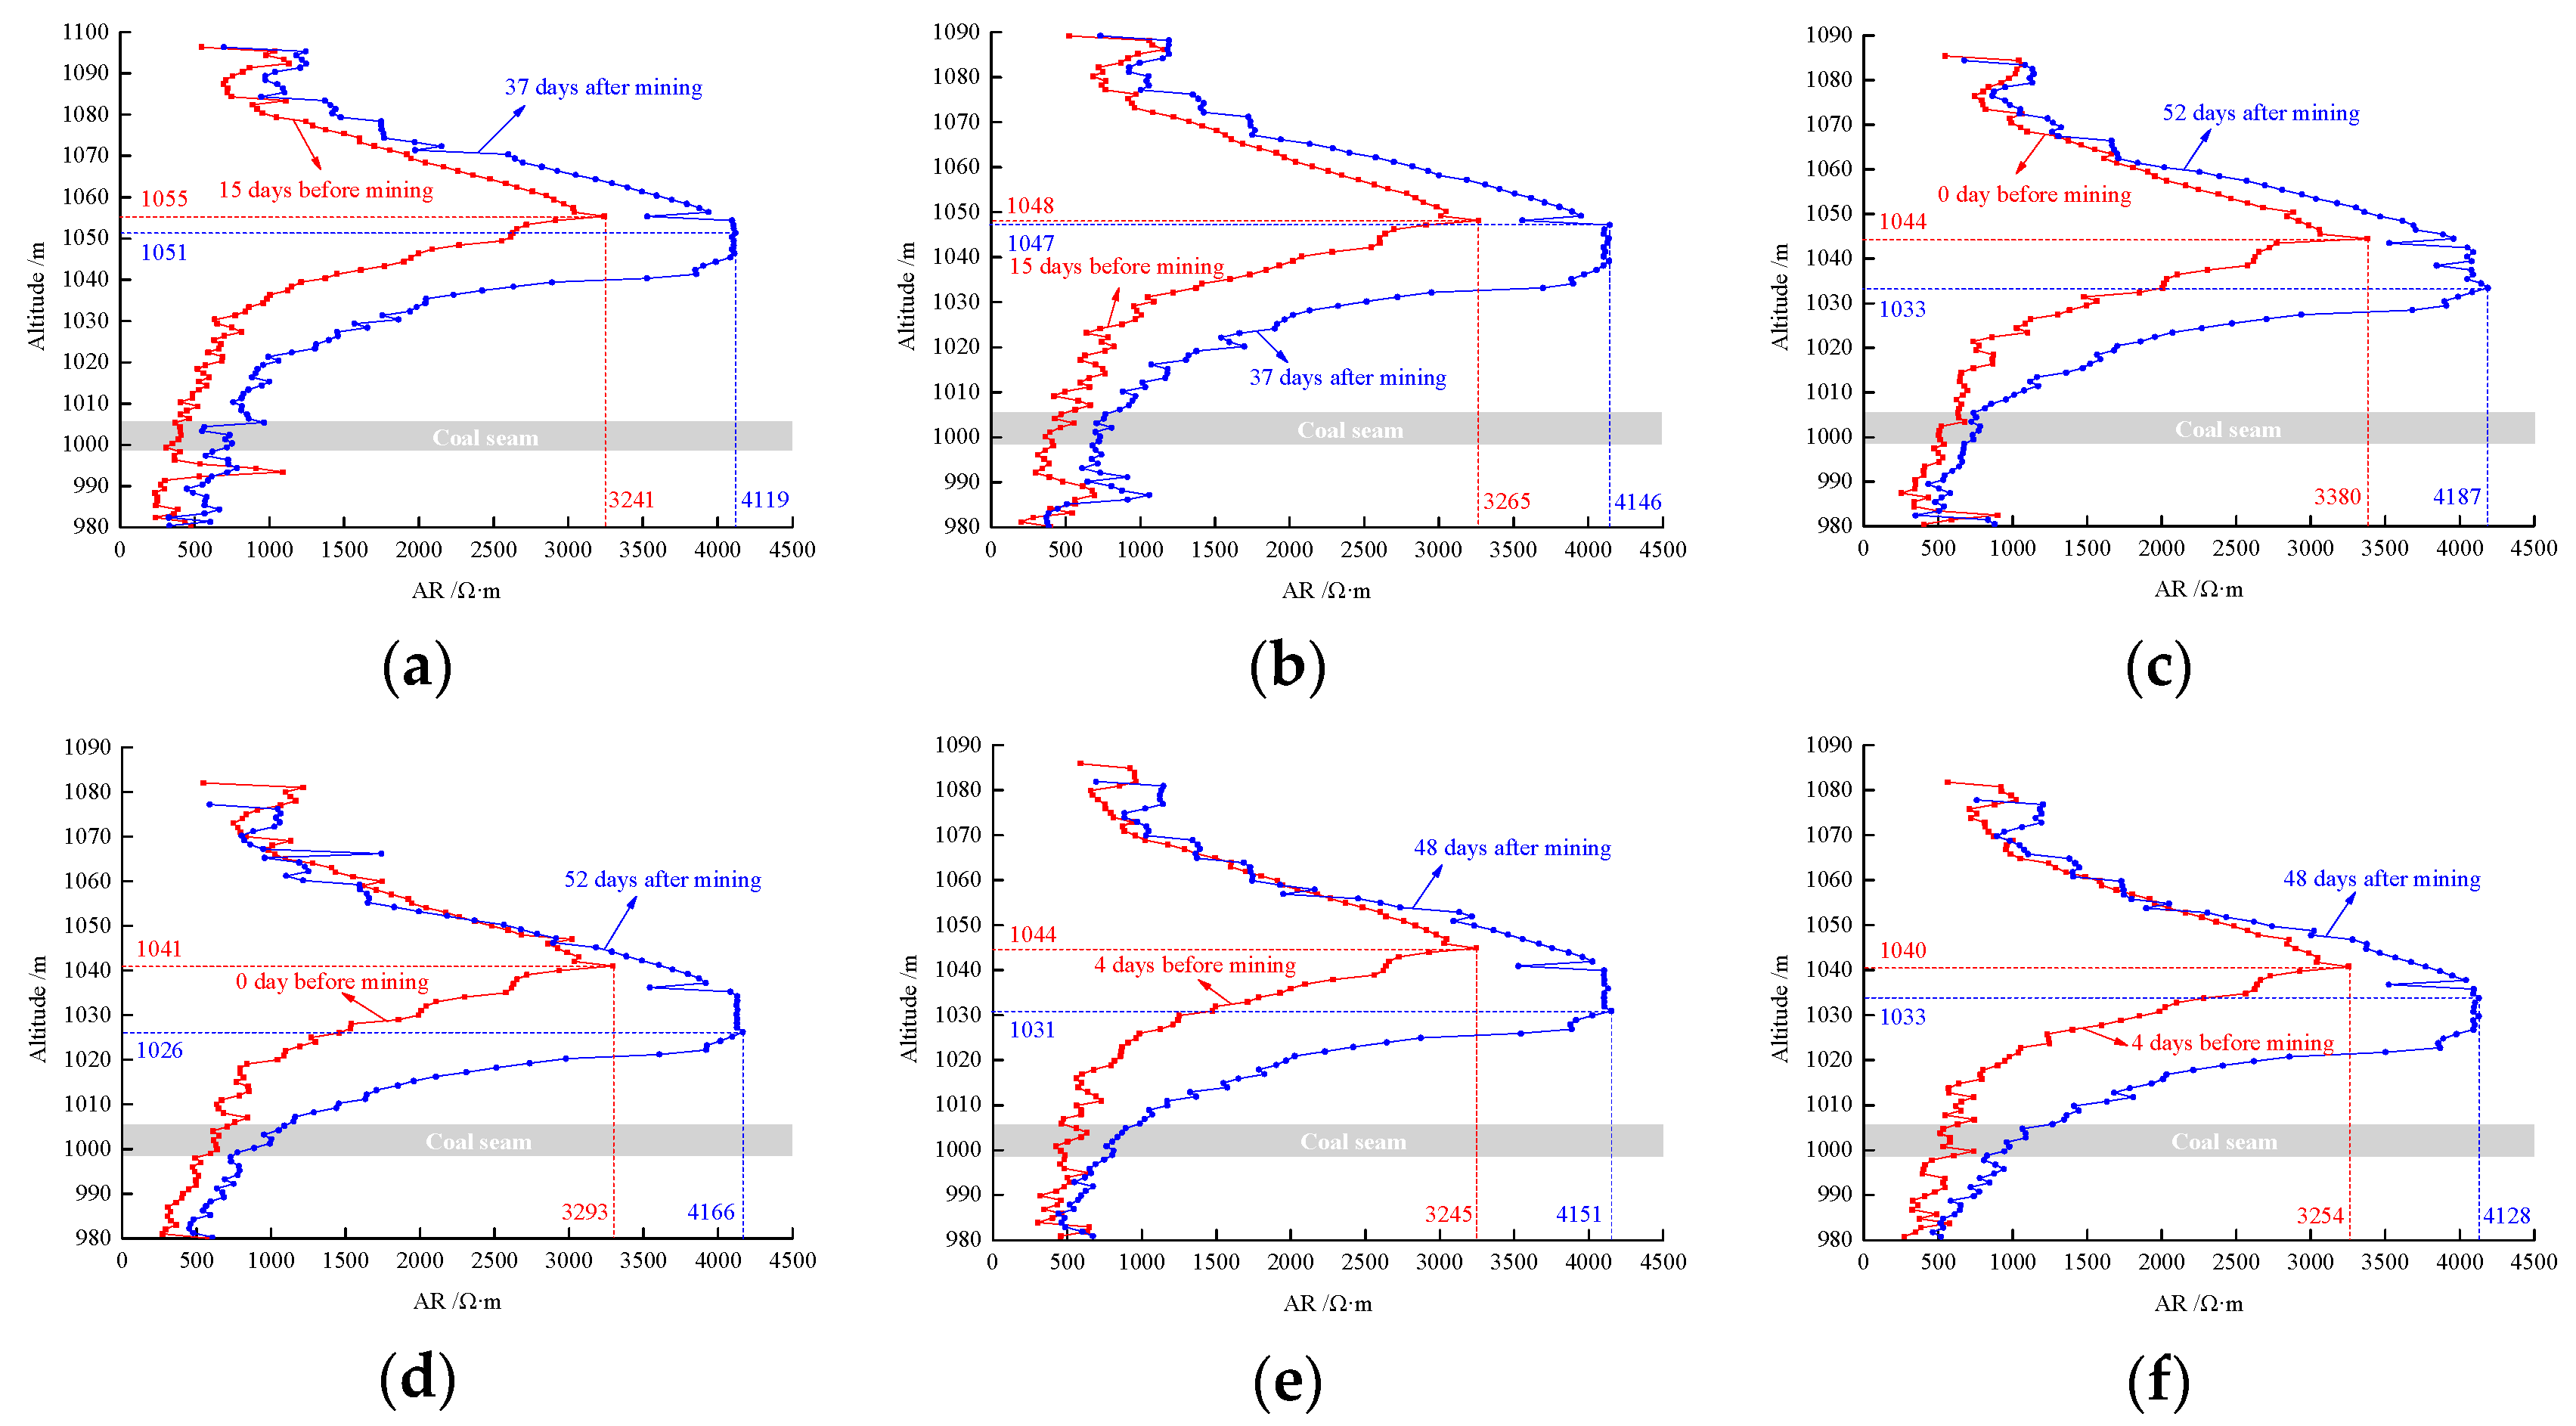
4.3.1. AR of Characteristic Points

According to the characteristics of surface deformation and the KS failure, the inflection point of surface subsidence curve is located at the boundary of goaf; the maximum surface subsidence is located at the middle of working face under the condition of horizontal coal seam. Therefore, the measuring points located in these two positions can be regarded as characteristic points, which is most conducive to identifying the overburden KS; namely, A21, A35, B20, B35, D16, and D26. The AR distribution of characteristic points before and after mining are shown in Figure 8.
From the above figure, the AR distribution trend of characteristic points is basically the same before mining. The maximum AR is at altitude of 1040–1050 m. But it decreases rapidly on both sides of the curve in the maximum area and loose layer. According to the influencing factors of AR and MT response characteristics, it can be seen that the geological characteristics were simple and the strata were stable. However, at an altitude of 1040–1050 m, the AR trend is different with the adjacent strata. Through the analysis of AR before and after mining, the following results can be obtained: (1) the AR values after mining are larger than before mining at the same depth; (2) the position of the maximum AR moves down before mining, and the trend is the same as overburden failure; (3) the AR curve could be divided into two parts after mining: small change zone and large change zone. The boundary of the two parts is clear. Based on the KS failure characteristics and above analysis, the KS can be preliminarily determined near the position of the maximum AR before mining.

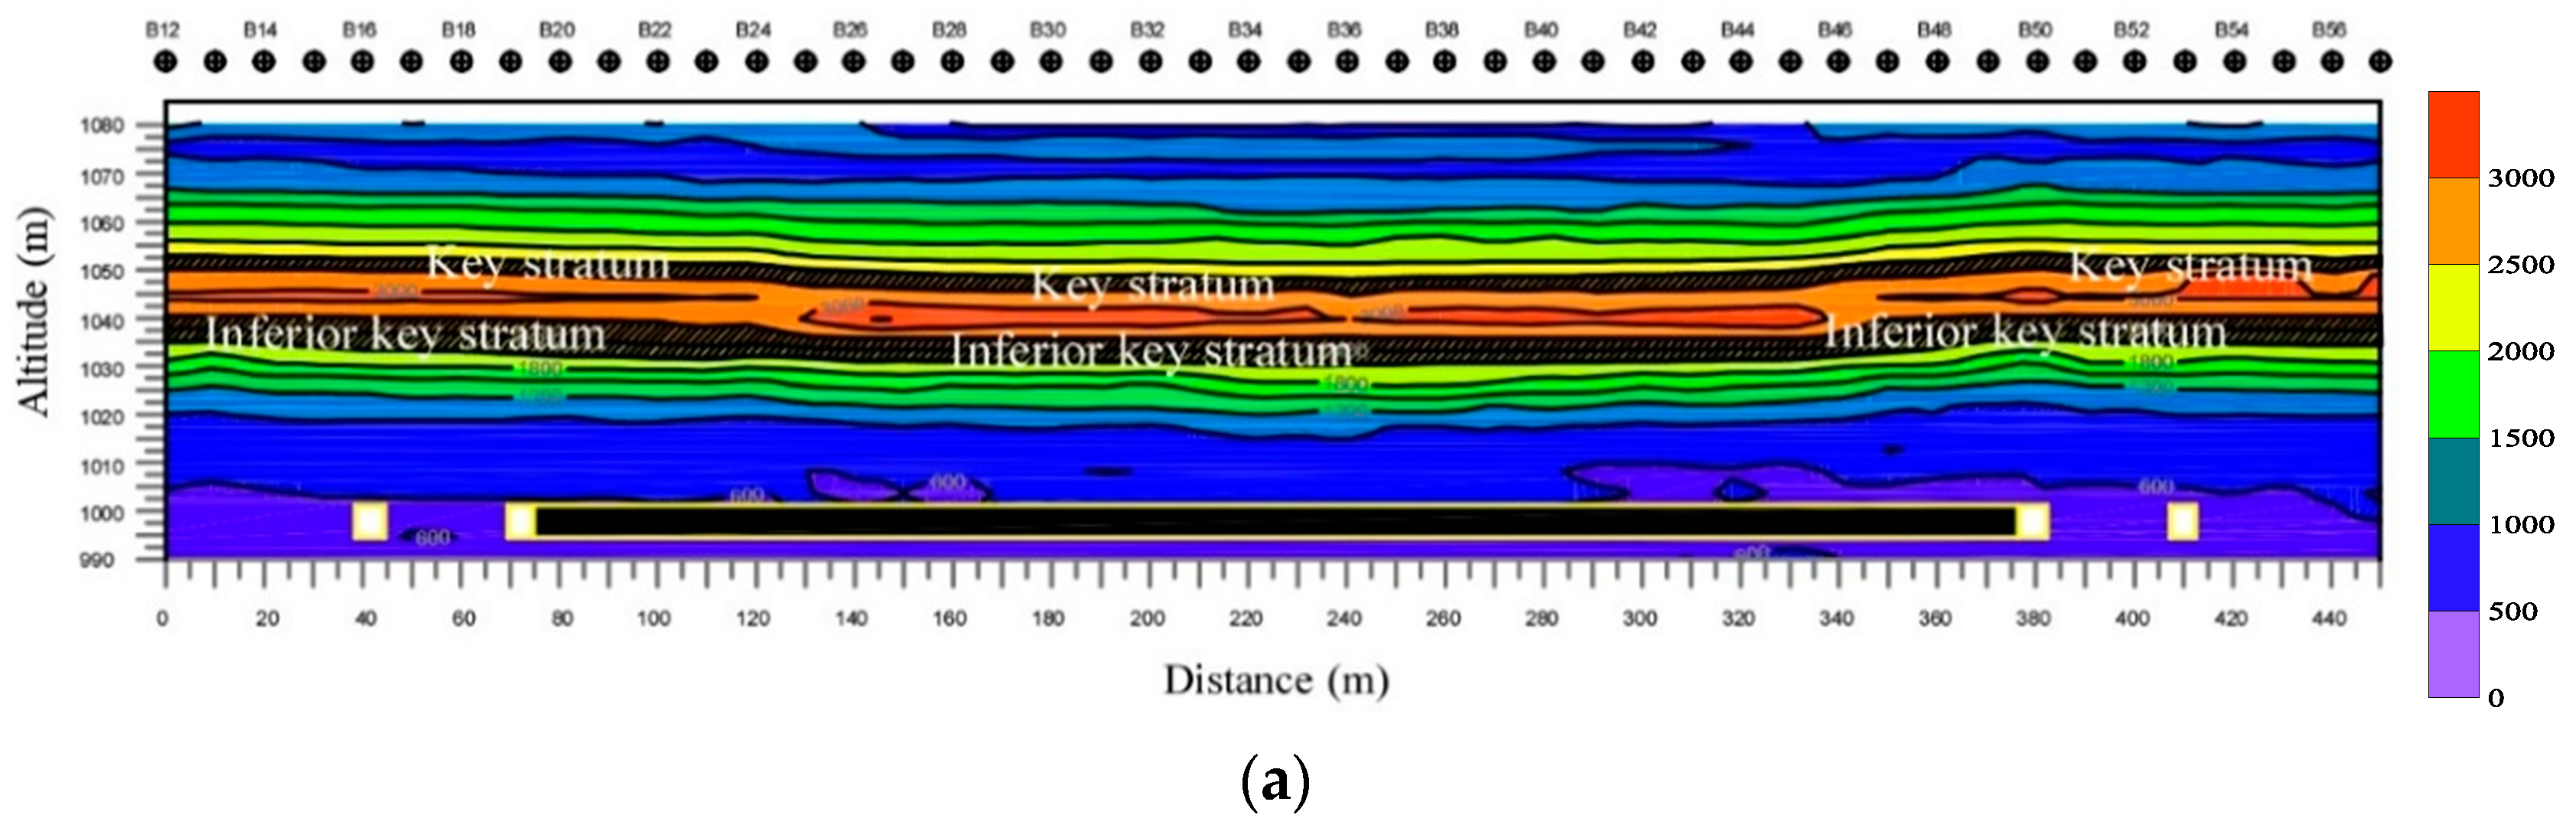
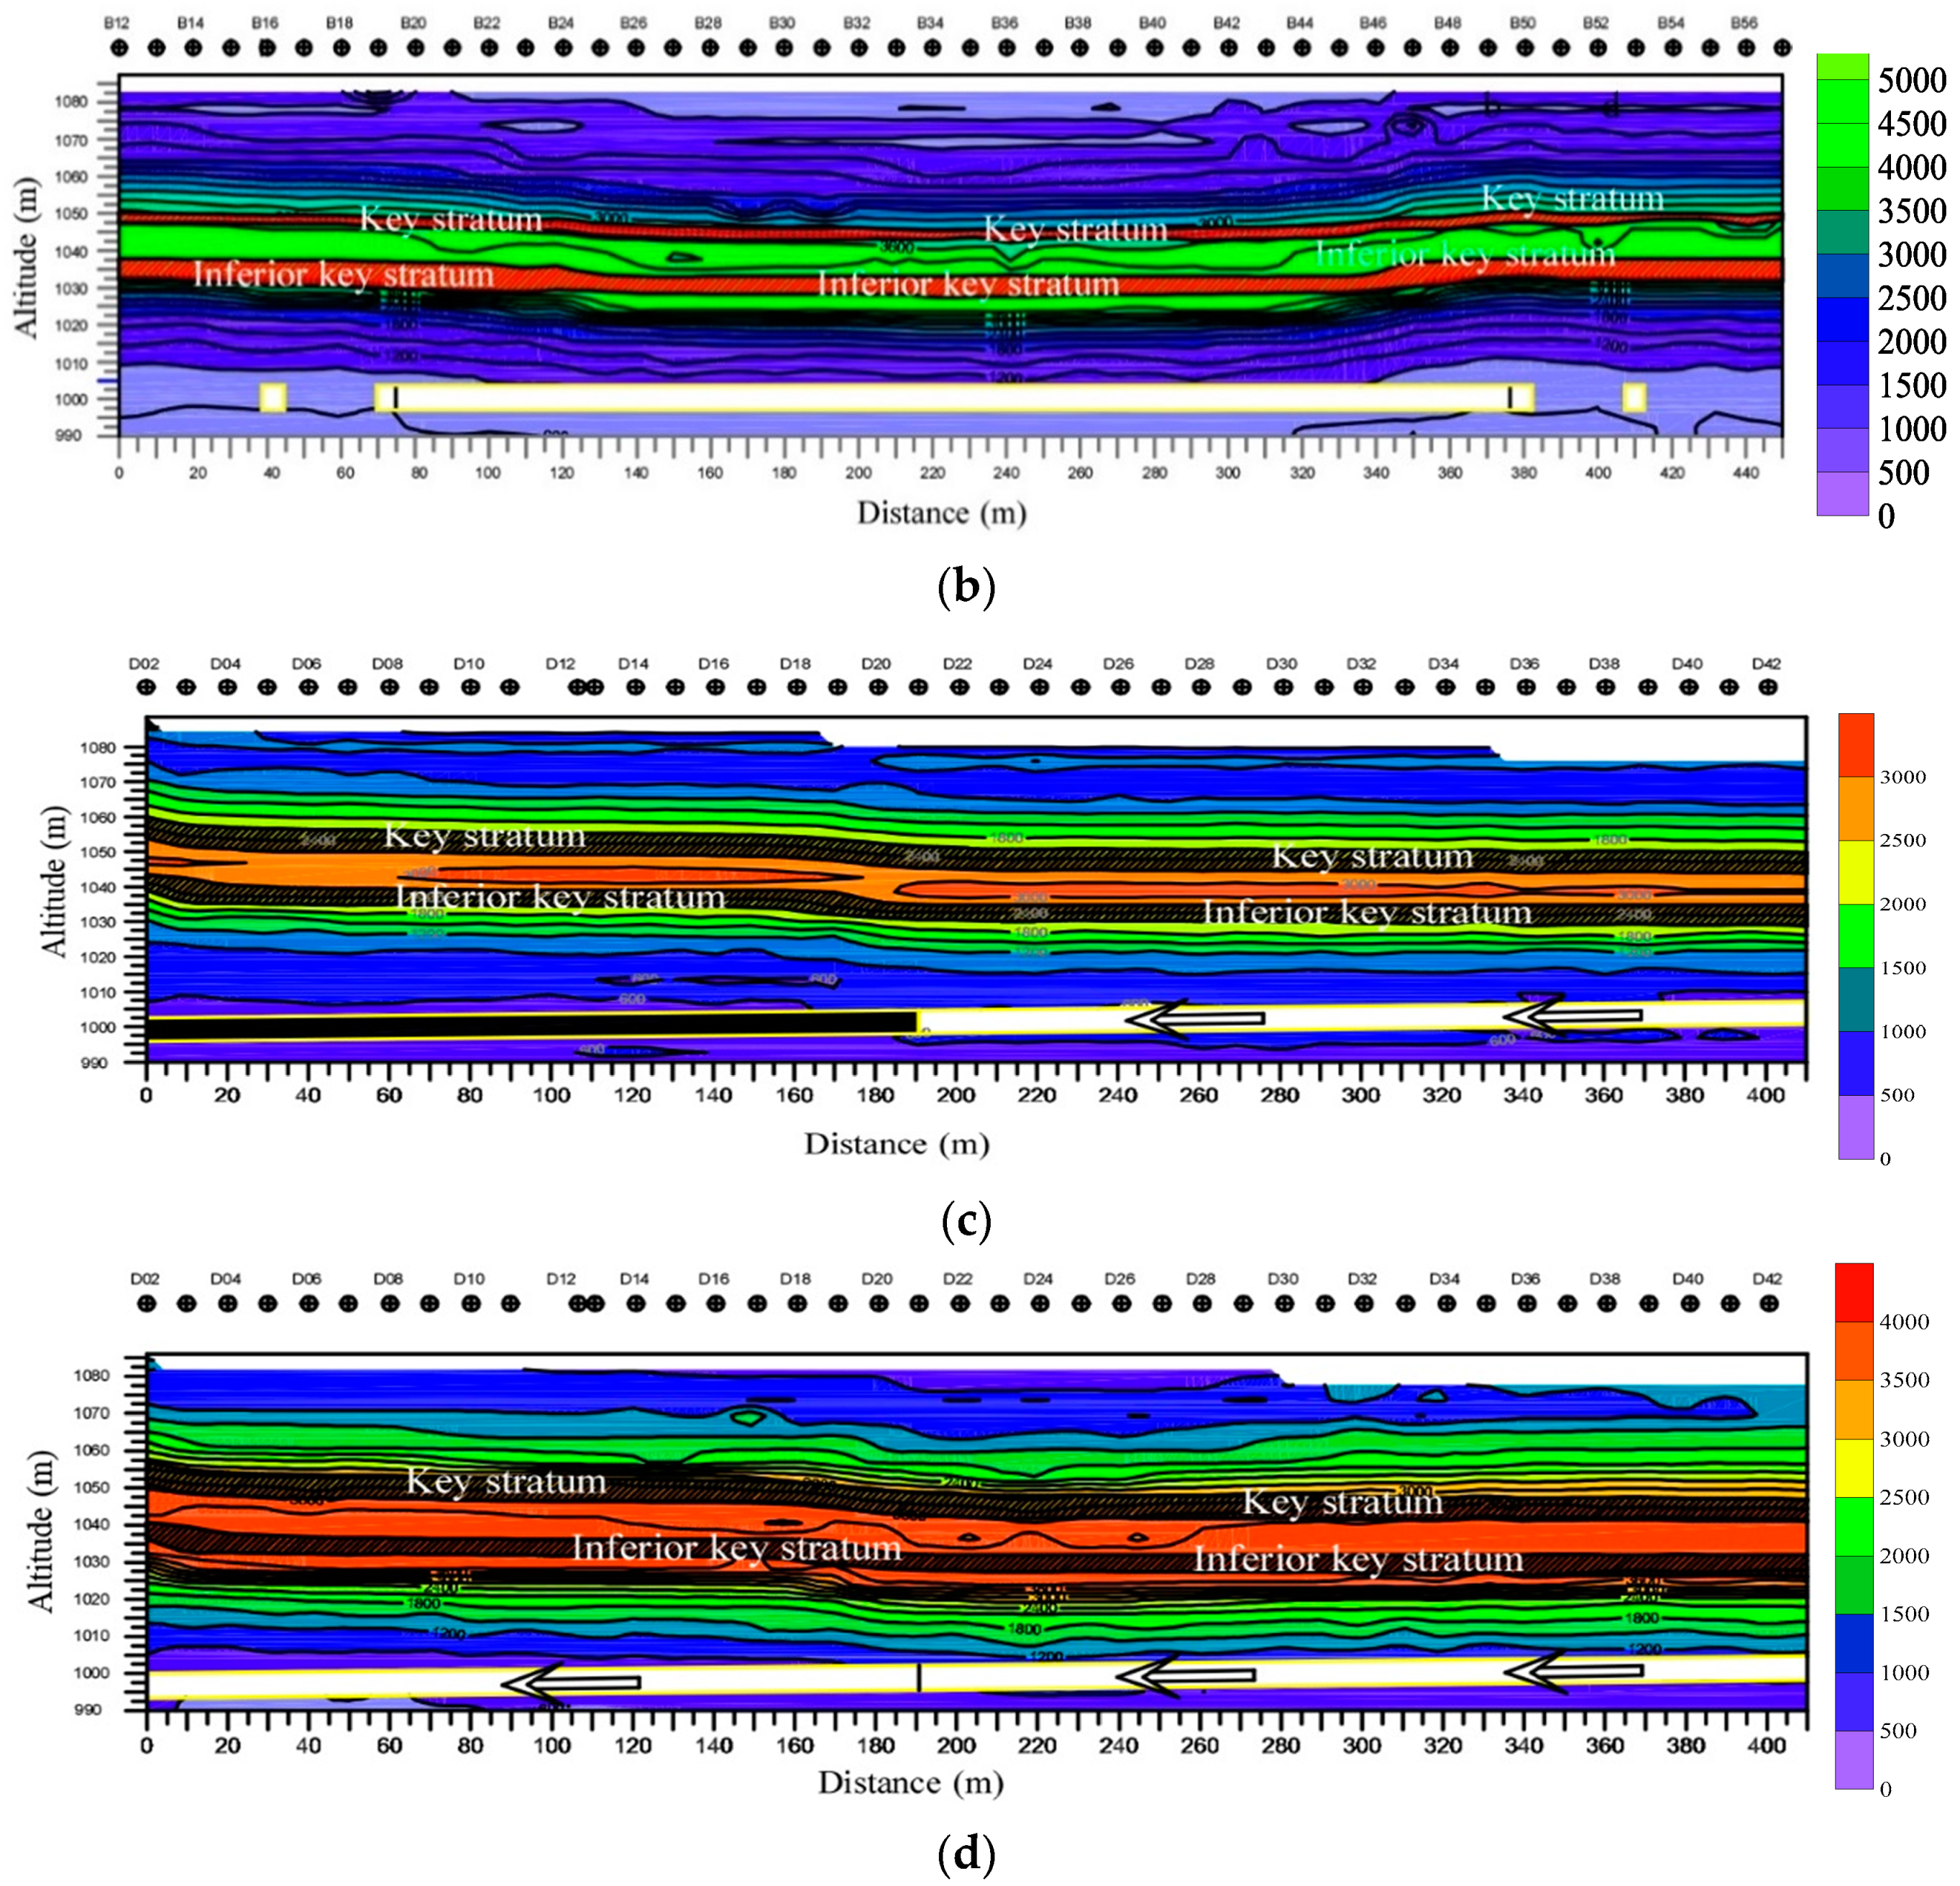
4.3.2. AR of the Major Section

In order to obtain the characteristics of KS, the AR characteristics of line B and line D are analyzed (as shown in Figure 9).
From the Figure 9, the maximum AR of these two lines is at an altitude of 1042.5–1052.5 m before mining, and the strata are locally discontinuous. According to the basic principle of MT detection, the strata may have initial fracture or tectonic fracture in this area, but the strata located the upper and lower have a better layered structure before mining. Based on the KS characteristics and its function on the overburden failure, the area (1042.5–1052.5 m) with a large AR and initial fissure is not suitable for KS. However, the strata located the upper and lower are suitable.

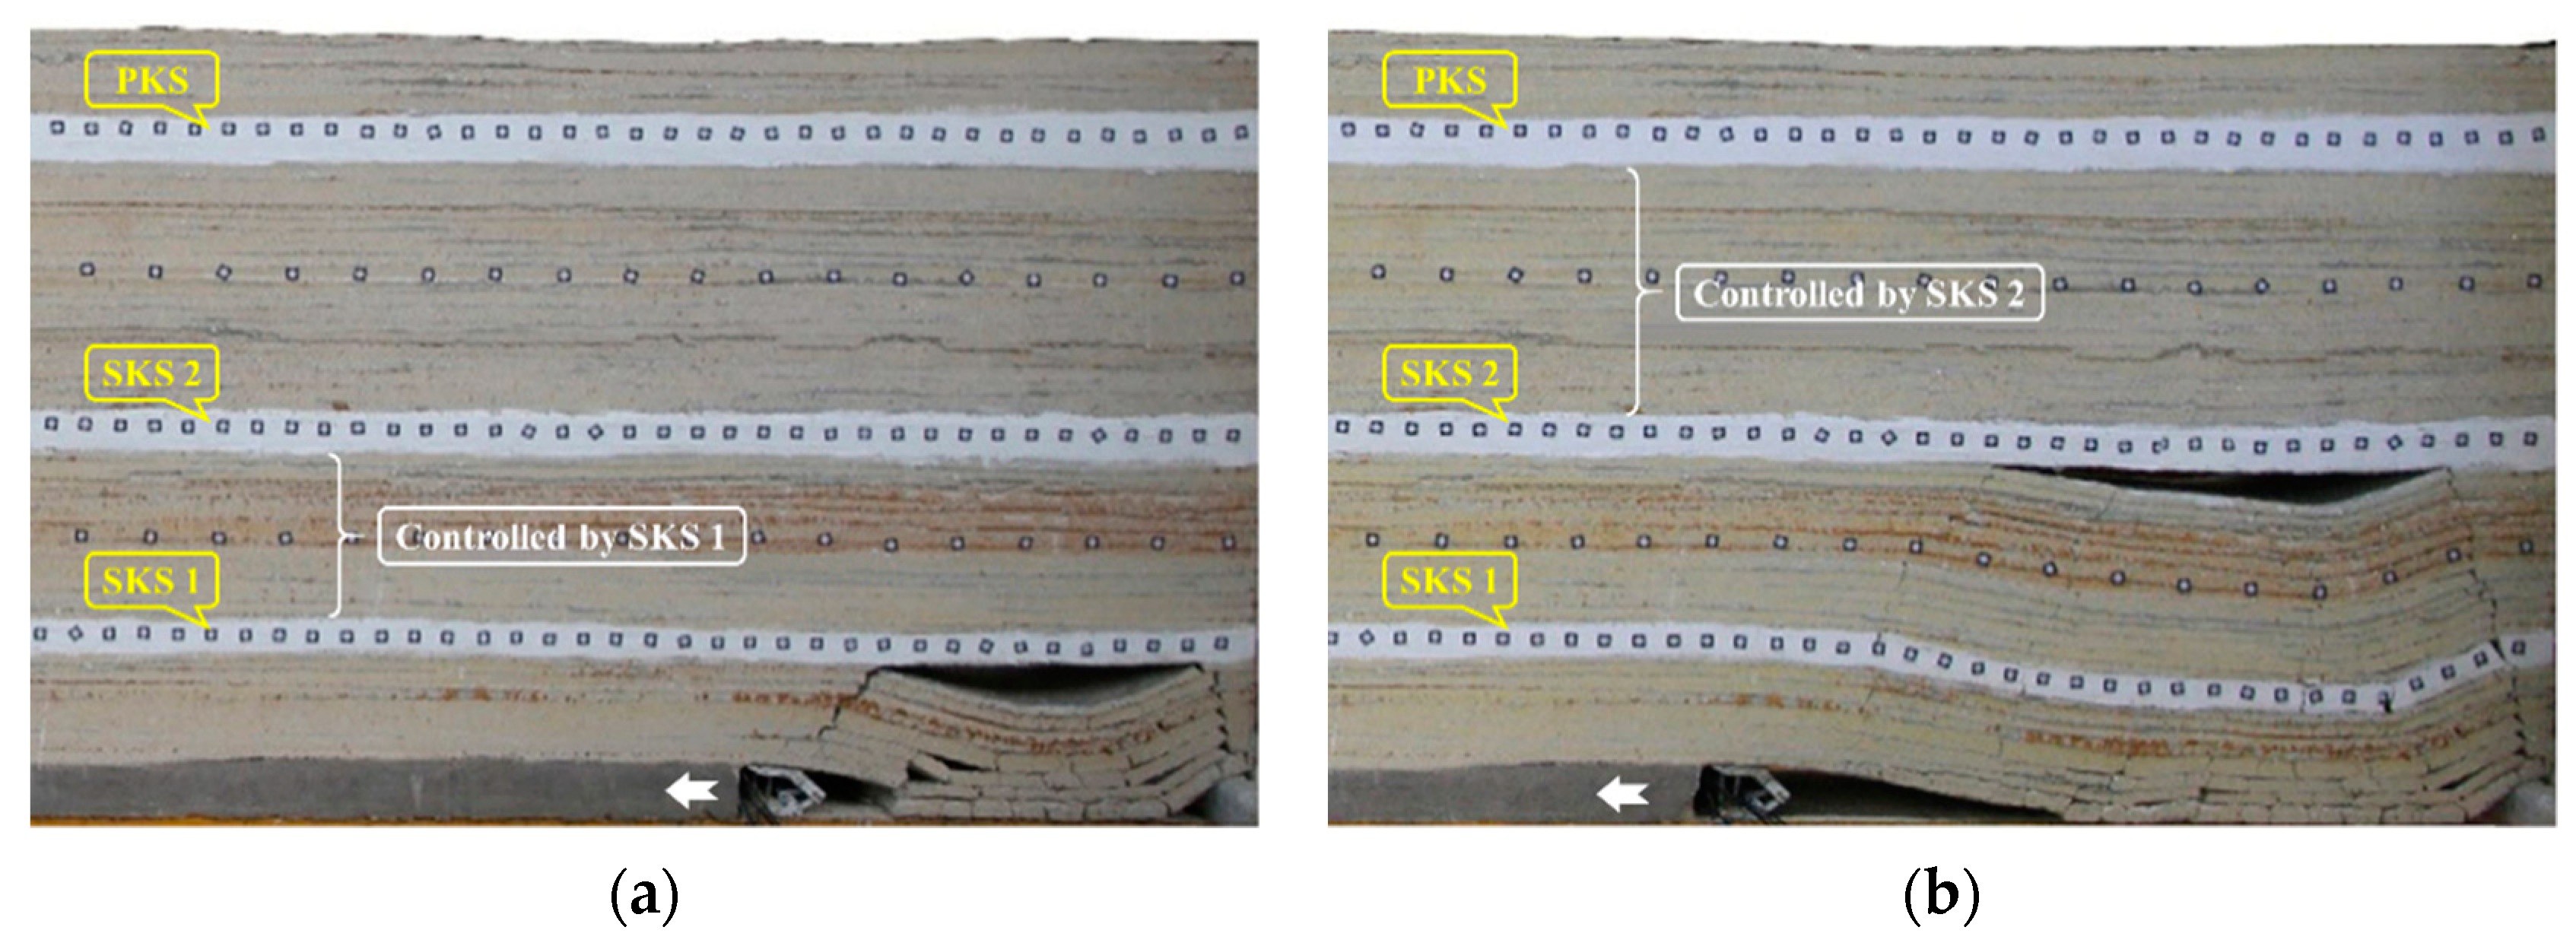
4.3.3. KS Characteristics

According to the identification mechanism of MT detection in the working face, there are two KS in the overburden: one is of the average thickness 7.1 m at the altitude of 1048.3–1055.4 m (average depth is 32.11 m); the other is of the average thickness 7.6 m at the altitude of 1034.9–1042.5 m (average depth is 44.48 m). The average distance is 8.6 m between the PKS and SKS. Based on the AR characteristics, the densification of isogram near the KS after mining in Figure 9b,d is caused by the closure of primary fracture or the loss of groundwater after the strata re-compacts with the failure of KS. That is, the PKS and SKS have played an important role in the process of overburden failure, which is also consistent with the KS theory.

4.4. Reliability Verification

In order to verify the credibility of MT detection, a theoretical calculation of KS was selected for comparison. Based on the KS theory, the KS can be calculated according to the mechanical parameters, such as thickness, bulk density, elastic modulus, and tensile strength. Therefore, the parameters and results are shown in Table 2.
It can be seen that the buried depths of KS are 30.33 and 47.66 m, respectively, and the spacing between them is 8.94 m. That is basically consistent with the result of MT detection, indicating that MT detection can be used to identify KS quickly and conveniently.

5. Conclusions

(1)
Overburden failure will inevitably lead to the changing of electromagnetic characteristics. Due to the different degrees of failure, the overburden AR characteristics with different buried depths are different. In theory, the more severe of overburden failure after mining, the greater change of apparent resistivity.
(2)
According to the field application, the strata characteristics revealed by MT detection are consistent with KS, especially in the aspect of lithology, mechanical properties, failure characteristics, and electromagnetic response characteristics, which provides a basis for the analysis of KS in MT detection.
(3)
Based on the comparison between field application and analysis, MT detection can be used as a convenient and fast method to identify the overburden KS by analyzing the AR characteristics, which provides a new technical support for the mine pressure control, construction of digital model, and precise mining.

Author Contributions

Conceptualization, Y.W. (Yunguang Wang), W.G., and E.B.; formal analysis, Y.W. (Yunguang Wang), W.G., and E.B.; funding acquisition, W.G.; investigation, Y.W. (Yunguang Wang), E.B., and Y.W. (Yuxi Wang); methodology, W.G.; software, Y.W. (Yuxi Wang); supervision, W.G.; writing—original draft, Y.W. (Yunguang Wang) and E.B. All authors have read and agreed to the published version of the manuscript.

Funding

This research was financially supported by the National Natural Science Foundation of China (51774111), the Key Project of the National Natural Science Foundation of China (U1810203), and the Innovation and Outstanding Talent Project of Henan Province Science and Technology (184200510003).

Acknowledgments

This research was financially supported by the National Natural Science Foundation of China (51774111), the Key Project of the National Natural Science Foundation of China (U1810203), and the Innovation and Outstanding Talent Project of Henan Province Science and Technology (184200510003). The authors thank the anonymous reviewers for their careful work and thoughtful suggestions that have helped improve this paper substantially.

Conflicts of Interest

The authors declare no conflict of interest.

References

  1. Lin, B.Q.; Liu, J.H. Estimating coal production peak and trends of coal imports in China. Energy Policy 2010, 38, 512–519. [Google Scholar] [CrossRef]
  2. Guo, W.B.; Bai, E.H.; Yang, D.M. Study on the technical characteristics and index of thick coal seam high-intensity mining in coalmine. J. China Coal Soc. 2018, 43, 2117–2125. [Google Scholar]
  3. Hsieh, C.S.; Shih, T.Y.; Hu, J.C.; Tung, H.; Huang, M.H.; Angelier, J. Using differential SAR interferometry to map land subsidence: A case study in the Pingtung Plain of SW Taiwan. Nat. Hazards 2011, 58, 1311–1332. [Google Scholar] [CrossRef]
  4. Bai, E.H.; Guo, W.B.; Tan, Y. Negative externalities of high-intensity mining and disaster prevention technology in China. Bull. Eng. Geol. Environ. 2019, 78, 5219–5235. [Google Scholar] [CrossRef]
  5. Chen, L.; Zhang, F.W.; Yao, H.C.; Han, Z.T.; Qian, L.; Chen, L.; Jiang, C.C. Using of key stratum theory to study the structural development of roof aquifer. Acta Geol. Sin. (Engl. Ed.) 2015, 89, 2091. [Google Scholar]
  6. Liang, S.; Elsworth, D.; Li, X.H.; Fu, X.H.; Sun, B.Y.; Yao, Q.L. Key strata characteristics controlling the integrity of deep wells in longwall mining areas. Int. J. Coal Geol. 2017, 172, 31–42. [Google Scholar] [CrossRef]
  7. Ju, J.F.; Xu, J.L. Structural characteristics of key strata and strata behaviour of a fully mechanized longwall face with 7.0 m height chocks. Int. J. Rock Mech. Min. Sci. 2013, 58, 46–54. [Google Scholar] [CrossRef]
  8. Dou, L.M.; He, X.Q.; He, H.; He, J.; Fan, J. Spatial structure evolution of overlying strata and inducing mechanism of rockburst in coal mine. Trans. Nonferrous Met. Soc. China 2014, 24, 1255–1261. [Google Scholar] [CrossRef]
  9. Yuan, Y.; Tu, S.H.; Zhang, X.G.; Li, B. Dynamic effect and control of key strata break of immediate roof in fully mechanized mining with large mining height. Shock Vib. 2015, 2015, 657818. [Google Scholar]
  10. Zhou, D.W.; Wu, K.; Bai, Z.H.; Hu, Z.Q.; Li, L.; Xu, Y.K.; Diao, X.P. Formation and development mechanism of ground crack caused by coal mining: Effects of overlying key strata. Bull. Eng. Geol. Environ. 2019, 78, 1025–1044. [Google Scholar]
  11. Qian, M.G.; Miao, X.X.; Xu, J.L. Key strata theory in strata control. J. China Coal Soc. 1996, 21, 225–230. [Google Scholar]
  12. Li, Z.; Xu, J.L.; Ju, J.F.; Zhu, W.B.; Xu, J.M. The effects of the rotational speed of voussoir beam structures formed by key strata on the ground pressure of stopes. Int. J. Rock Mech. Min. Sci. 2018, 108, 67–79. [Google Scholar] [CrossRef]
  13. Zhu, W.B.; Xu, J.M.; Xu, J.L.; Chen, D.Y.; Shi, J.X. Pier-column backfill mining technology for controlling surface subsidence. Int. J. Rock Mech. Min. Sci. 2017, 96, 58–65. [Google Scholar] [CrossRef]
  14. Wen, Z.J.; Xing, E.R.; Shi, S.S.; Jiang, Y.J. Overlying strata structural modeling and support applicability analysis for large mining-height stopes. J. Loss Prev. Process Ind. 2019, 57, 94–100. [Google Scholar] [CrossRef]
  15. Ju, J.F.; Xu, J.L.; Xu, J.M. A case study of surface borehole wall dislocation induced by top-coal longwall mining. Energies 2017, 10, 2100. [Google Scholar] [CrossRef] [Green Version]
  16. Kuang, T.J.; Li, Z.; Zhu, W.B.; Xie, J.L.; Ju, J.F.; Liu, J.R.; Xu, J.M. The impact of key strata movement on ground pressure behaviour in the Datong coalfield. Int. J. Rock Mech. Min. Sci. 2019, 119, 193–204. [Google Scholar] [CrossRef]
  17. Li, B.; Liang, Y.P.; Zou, Q.L. Determination of working resistance based on movement type of the first subordinate key stratum in a fully mechanized face with large mining height. Energies 2019, 7, 777–798. [Google Scholar] [CrossRef] [Green Version]
  18. Xie, J.L.; Xu, J.L. Effect of key stratum on the mining abutment pressure of a coal seam. Geosci. J. 2017, 21, 267–276. [Google Scholar] [CrossRef]
  19. Xu, J.L.; Qian, M.G. Method to distinguish key strata in overburden. J. China Univ. Min. Technol. 2000, 29, 463–467. [Google Scholar]
  20. Asaue, H.; Sasahara, M.; Yoshinaga, T.; Obara, Y.; Uchida, K.; Matsumoto, H. Clarifying geological structure for coal and marsh gas development using magnetotelluric method. Acta Geodyn. Geomater. 2013, 10, 155–162. [Google Scholar] [CrossRef] [Green Version]
  21. Nigel, R.; Graham, H.; Lars, K. Magnetotelluric monitoring of coal seam gas depressurization. Geophysics 2016, 81, 423–432. [Google Scholar]
  22. Li, J.; Pang, Z.H.; Kong, Y.L.; Lin, F.L.; Wang, Y.L.; Wang, G.J.; Lv, L.H. An integrated magnetotelluric and gamma exploration of groundwater in fractured granite for small-scale freshwater supply: A case study from the Boshan region, Shandong Province, China. Environ. Earth Sci. 2017, 76, 163. [Google Scholar] [CrossRef]
  23. Zhang, R.Z.; Li, T.L.; Zhou, S.; Deng, X.H. Joint MT and gravity inversion using structural constraints: A case study from the Linjiang copper mining area, Jilin, China. Minerals 2019, 9, 407. [Google Scholar] [CrossRef] [Green Version]
  24. Chen, L.; Qin, Q.; Wang, N.; Bai, Y.B.; Zhao, S.S. Review of the forward modeling and inversion in magnetotelluric sounding field. Acta Sci. Nat. Univ. Pekin. 2014, 50, 979–984. [Google Scholar]
  25. Wei, W.; Luo, X.Z.; Cai, J.C.; Hu, X.J.; Li, Y.N. Fractal study on skin depth of electromagnetic wave through porous rocks. Progress Geophys. 2014, 29, 2416–2421. [Google Scholar]
  26. Zhang, Z.; Zhang, J.; Yin, B.B. Analysis of apparent resistivity characteristics and influence factors of the sphere model. Comput. Tech. Geophys. Geochem. Explor. 2010, 32, 402–407. [Google Scholar]
  27. Chen, X.B.; Lv, Q.T.; Zhang, K. Review of magnetotelluric data inversion methods. Progress Geophys. 2011, 26, 1607–1619. [Google Scholar]
  28. Evjen, H.M. Depth factor and resolving power of electrical measurements. Geophysical 1938, 3, 78–95. [Google Scholar] [CrossRef]
  29. Huang, H.P. Depth of investigation for small broadband electromagnetic sensors. Geophysical 2005, 70, 135–142. [Google Scholar] [CrossRef]
  30. Guo, W.B.; Wang, Y.G. The definition of high-intensity mining based on green coal mining and its index system. J. Min. Saf. Eng. 2017, 34, 616–623. [Google Scholar]
  31. Bai, E.H.; Guo, W.B.; Zhang, D.S.; Tan, Y.; Guo, M.J.; Zhao, G.B. Using the magnetotelluric method for detecting aquifer failure characteristics under high-intensity mining of thick coal seams. Energies 2019, 12, 4397. [Google Scholar] [CrossRef] [Green Version]
Figure 1. Control effect of key strata (KS) in overlying strata movement; (a) the control effect of sub-key strata 1 (SKS1) from the SKS1 roof to the SKS2 floor; (b) the control effect of SKS2 from the SKS2 roof to the primary KS (PKS) floor.
Applsci 10 00558 g001
Figure 2. A sketch of the MT detection principle.
Applsci 10 00558 g002
Figure 3. Relationship between KS characteristics and its apparent resistivity (AR) response.
Applsci 10 00558 g003
Figure 4. The main influencing factors of AR: (a) non-physicochemical factors; (b) physicochemical factors.
Applsci 10 00558 g004
Figure 5. Characteristics of MT responses of common overlying strata: (a) quaternary loose layer; (b) sandy mudstone; (c) fine-sandstone; (d) medium sandstone; (e) coarse sandstone; (f) mudstone; (g) siltstone; (h) coal seam; (i) coal-rock interbed; (j) conglomerate.
Applsci 10 00558 g005
Figure 6. Surface topography above the working face and the drilling histogram of working face: (a) surface topography and landform of panel; (b) borehole columnar section.
Applsci 10 00558 g006
Figure 7. Plane position diagram of MT detection lines and working face.
Applsci 10 00558 g007
Figure 8. The AR distribution of characteristic points before and after mining: (a) Point A21; (b) Point A35; (c) Point B20; (d) Point B35; (e) Point D16; (f) Point D26.
Applsci 10 00558 g008
Figure 9. The AR characteristics of lines B and D: (a) line B before mining; (b) line B after mining; (c) line D before mining; (d) line D after mining.
Applsci 10 00558 g009aApplsci 10 00558 g009b
Table 1. Examples with magnetotelluric (MT) detection technique in mines.
YearSitePurposeDepth (m)
2007Jiaozuo mining section of South-to-North Water Diversion Project, HenanGoaf distribution410
2008Concealed mine area, Fujian“Three-under” coal mining1500
2009Bauxite mining area of Mianchi county, HenanIdentifying thin interbed600
2010Hongliu Coalmine, NingxiaHeight of water flowing fracture zone350
2011Panyi Coalmine, AnhuiOverburden failure characteristics360
2012Coalmines of Xinjiang & ShanxiGoaf location and aquifer distribution400
2014Jingdong Coalmine, ShanxiGoaf distribution200
2015Tectonic fault basin, Northeast Inner MongoliaCoal mining500
2016Liudong Coaimine, AnhuiStructure exploration900
Table 2. Mechanical parameters of overlying strata and KS location.
NumberLithologyThickness h (m)Bulk Density γ (kg/m3)Elastic Modulus E (GPa)Tensile Strength σc (MPa)KS Location
1Aeolian sand8.751600//
2Siltstone7.022650403.83
3Coal0.981400/0.80
4Siltstone11.682650403.83
5Sandy mudstone1.92520181.53
6Siltstone14.562650403.83PKS
7Fine sandstone1.562680372.70
8Sandy mudstone3.12520181.53
9Fine sandstone0.622680372.70
10Siltstone12.052650403.83SKS
11Kern stone3.362580272.10
12Fine sandstone12.72680372.70
13Siltstone1.32650403.83SKS
14Mudstone0.1225081.23

