Technical Note

Pore Distribution Characteristics of Thawed Residual Soils in Artificial Frozen-Wall Using NMRI and MIP Measurements

1
State Key Laboratory of Geomechanics and Geotechnical Engineering, Institute of Rock and Soil Mechanics, Chinese Academy of Sciences, Wuhan 430071, China
2
School of Engineering Science, University of Chinese Academy of Sciences, Beijing 100049, China
*
Author to whom correspondence should be addressed.
Appl. Sci. 2020, 10(2), 544; https://doi.org/10.3390/app10020544
Submission received: 5 December 2019 / Revised: 7 January 2020 / Accepted: 9 January 2020 / Published: 11 January 2020

Abstract

:
Artificial ground freezing method is widely applied in the construction of metro tunnel and significantly impact the microstructure of soils in artificial frozen-walls. To delve into the pore distribution characteristics of thawed residual soils, Nuclear Magnetic Resonance Imaging (NMRI) measurements were performed to investigate the relaxation time (T2) spectrums and T2-weighted images of saturated samples after freezing at different temperatures. The pore volume distributions were determined from T2 spectrums based on the surface relaxation coefficient ( ρ 2 ) and the pore structures were visualized by T2-weighted images. Subsequently, the pore size distribution curves from NMRI were compared and validated by mercury intrusion porosimetry (MIP) tests. According to the results, the peak areas of T2 spectrums were linearly related to freezing temperatures in a positive manner. Pore volume distribution curves of thawed soils have two peaks, which are the major peaks with diameters of 0.5–20 μm and the secondary peaks with diameters of 20–500 μm. As the freezing temperature drops, the volumes of pores with different diameters all increased. The damage degree of microstructure in thawed soils increases as the temperature drops, according to the visualized pore structure. Besides, NMRI measurements of saturated soils are more accurate to reflect the full diameter range of pores, compared to MIP method.

1. Introduction

Granite residual soils are extensively distributed in southeast coastal areas of China [1,2]. Under the hot and rainy climate in tropical and subtropical areas, the residual soils exhibit a special grain distribution from clay to gravel due to physical and chemical weathering processes [3]. Currently, the distributed areas of granite residual soils are generally encountered in the engineering problems of subway tunnel excavation [4]. To guarantee the safety of the tunnel construction in residual soil distributed areas, the artificial freezing method, which highlights a good sealing performance, high strength and other advantages, has been widely applied in in practical engineering. The artificial freezing method can improve the strength and stability of soils by using the artificially ground freezing technique to sharply reduce the temperature of soils to form a temporary supporting and strengthening structure for tunnel excavation [5].
However, during the construction of metro tunnels with the artificial ground freezing method, the freezing process will affect the engineering properties of soils in subway wall. Lackner et al. [6] found that the macroscopic viscoelastic behaviors of soils after artificial freezing treatments are related to the microscopic properties such as soil particles, water and ice contents. Cui et al. [7] experimentally found that the dynamic behavior of silty clay in Shanghai metro tunnel altered significantly after the artificial freezing process. As Tang et al. [8] reported, the void ratio decreased while the mean pore diameter and hydraulic conductivity increased after freeze-thaw treatment of the soils in metro frozen-wall. It has been commonly recognized that the artificial freezing method significantly impacts the microstructures in soils, thereby causing its physical and mechanical properties to vary [9]. Nevertheless, the evolution patterns of pore distributions of soils under freezing-thawing effects remain unclear. Accordingly, the study on the pore distributions of thawed soil after freezing process is of great implication to gaining comprehensive insights into its damage mechanism of soils under freezing effects [10].
The pore size distribution (POSD), as a vital intrinsic property of soils, is associated with the microstructure and seriously impacts the physical, hydraulic and mechanical properties of soils, namely permeability, soil-water characteristic curves and shear strength [11,12,13]. Various testing methods, including mercury injection porosimeter (MIP) tests, X-ray computed tomography (CT) and Nuclear magnetic resonance scans (NMR), have been employed to analyze the microstructures of soils [14,15,16,17]. The MIP test, a most commonly used method, requires freezing treatment that can to some extent cause damage to the microstructure of the sample [18]. X-ray CT tests consist of a tedious procedure for sample preparation, and the result of pore measurement in a micron level exhibits relatively low precision [19]. The low magnetic field nuclear magnetic resonance imaging (NMRI) techniques have been extensively employed in microstructure detections of porous media for their rapidity, efficiency and non-destructiveness [20]. In recent years, the NMRI technique have been frequently adopted to study geotechnical engineering to ascertain the porosity, the damage degree caused by freezing-thawing cycles, as well as the free water content in a frozen soil at different saturations [21,22,23,24]. However, reports on the application of NMRI method to investigate the pore structure of frozen-thawed soils in subway tunnel excavations are exceedingly rare.
The freezing temperature is an important factor affecting the microstructure of thawed soils. Though several NMR-based researches have been conducted to characterize pore water distributions in saturated soils, the effect of freezing temperatures on the microstructure in the thawed soils has not been systematically studied using the NMRI technique. It continues to be challenging to quantitatively characterize pore size distributions of thawed soils in subway wall. Since the relaxation time (T2) spectrums from NMRI of targeted molecules reveal the pore structures of surrounding water molecules, it is expected that the measurement of T2 spectrums may be beneficial to elucidate the microscopic mechanisms of pore structure variations in thawed soils at different freezing temperatures [25]. Moreover, the NMRI technique has been of higher importance to exploring the pore water distributions in porous material for its visualization function [26]. Thus, the measurement of NMRI technique acts as a promising method to interpret the pore distribution characteristics of thawed soils after the process of artificial freezing.
The main purpose of the present study is to assess the effect of freezing temperatures on evolution patterns of microstructure in granite residual soils based on NMRI measurements. First, the pore volume distribution curves of soils at different freezing temperatures were obtained based on T2 spectrums. Subsequently, the T2-weighted cross-sectional images, which intuitively demonstrated the pore structures, were captured and studied. Lastly, the validity and accuracy of the NMRI measurements were verified by MIP testing results.

2. Theoretical Background of NMRI Analysis

The result from NMRI analysis includes the T2 spectrums from low field nuclear magnetic resonance (LFNMR) measurements and T2-weighted image from magnetic resonance imaging (MRI) measurements [27]. The NMR scan was consistent with the physical phenomenon that a spin nuclei system (e.g., protons) in a strong magnetic field absorbs energy from externally matched radio frequency (RF) field energy, which is identical to the spin nuclear system [28,29]. The NMRI technique is easily affected by hydrogen fluids in porous media as a non-invasive method to characterize the pore distribution of residual soils. The signal amplitude can indicate the present protons in water or can be associated with pore characteristic while the relaxation time (T2) is a measure of the rate at which the precession of hydrogen nuclei in the formation pore water gradually decay in the presence of an inhomogeneous magnetic field, providing information of pore structures [30]. The value of T2 is complex since it is regulated by three relaxation mechanisms (the bulk, surface and diffusion relaxations). Given this, the total transverse relaxation time in the porous media can be expressed by:
1 T 2 = 1 T 2 B + 1 T 2 S + 1 T 2 D ,
where T2 denotes the total relaxation time of the water in pores that was ascertained by the Carr-Purcell-Meiboom-Gill (CPMG) sequence; T2B is the bulk fluid relaxation time; T2S is the surface relaxation time and T2D indicates the diffusion relaxation time and accounts for the transverse relaxation in a uniform magnetic field.
Equation (1) suggests that the total T2 relaxation time is determined by pore sizes, fluid properties and testing parameters, as well as the magnetic field properties. Nevertheless, the diffusion relaxation can be ignored in a low and uniform magnetic field. Besides, the bulk relaxation can also be ignored because it is much more time-consuming than surface relaxation for non-viscous fluid within nonmagnetic materials. Thus, the T2 relaxation time ascertained in this test is primarily regulated by the surface relaxation, so Equation (1) can be simplified as [31]:
1 T 2 = 1 T 2 S = ρ 2 ( S V ) p o r e ,
where ρ 2 refers to the surface relaxation coefficient, associated with the specific combination of pore fluid and mineral grains for a particular soil. It is also proved that ρ 2 values are proportional to the pore sizes in a linear manner. ( S V ) p o r e denotes the ratio of the surface area S to the pore volume V. and the value of ( S V ) p o r e is dependent of the pore shape. According to a study by Tian et al. [32], pores in soils can be considered some cylindrical pores, so Equation (2) can be written as:
1 T 2 = ρ 2 4 D ,
where, D (μm) is the diameter of a cylindrical pore.
Equation (3) suggests that the value of ρ 2 acts as a critical parameter to characterize the pore sizes. Though ρ 2 varies with the mineralogical composition of soil, it is a constant for a specific soil and has not association with temperatures and pressures in external environments. Equation (2) indicates that there is a linear relation between the relaxation time T2 and the pore diameter D. Thus, it is recognized that to calculate the pore diameters in a porous mediums based on its ρ 2 value. In several researches, ρ 2 values were calculated by comparing the T2 spectrum curves with POSD results from mercury injection porosimetry technique as presented by Chen et al. [33] and nitrogen gas adsorption technique as presented by Jahwar et al. [34]. Besides, the ρ 2 values can be calculated by empirical formulas of permeability. In the present study, a well approved permeability-based empirical equation, known as the Schlumberger-Doll Research (SDR) equation was adopted to calculate the surface relaxation coefficient ( ρ 2 ), as expressed in Equations (4) and (5) [35].
K S = C ϕ 4 T 2 L M 2 ,
where the constant (C) is approximately equated with the square of the surface relaxation coefficient ( C = ρ 2 2 ). Given the research conclusion drawn by Daigle and Dugan (2009) [35], the equation is written as:
K S = ρ 2 2 ϕ 4 T 2 L M 2 ,
The equation can also be expressed as:
ρ 2 = ( k s ϕ 4 T 2 L M 2 ) 1 / 2 ,
where K S (μm2) represents the permeability of the soil; ϕ denotes the porosity of the soils and T2LM (ms) denotes the weighted geometric mean value of the T2 spectrum.
Thus, the diameter of the cylindrical pore D (μm) in thawed soils can be calculated as expressed in Equation (7).
D = 4 ρ 2 T 2 .
Then, the pore volume Vi with a certain diameter is given as [36]:
V i = A i A i m w ρ w = A i A i m s m d ρ w ,
where Ai denotes the amplitude of the corresponding signal in a T2 spectrum, mw denotes the mass of pore water in the tested sample, ms denotes the total mass of saturated soil sample and md denotes the mass of thoroughly dried soil sample after dry-out treatment in an air oven. ρ w denotes the density of water, which is 1.0 g/cm3 approximately. Equation (3) provides the basis to convert the measured T2 spectrum to the pore volume distributions of the tested sample.
To describe the pore structure characteristics as comprehensive as desired, the images from NMRI scans were measured by a spin-echo (SE) sequence, which is particularly dedicated to materials with short transverse relaxation time (T2) such as porous media. The MRI scans allow selecting several cross-sectional slices along the axis of the tested sample. These slices reflect the distributions of pore water at different heights of the sample.

3. Materials and Methods

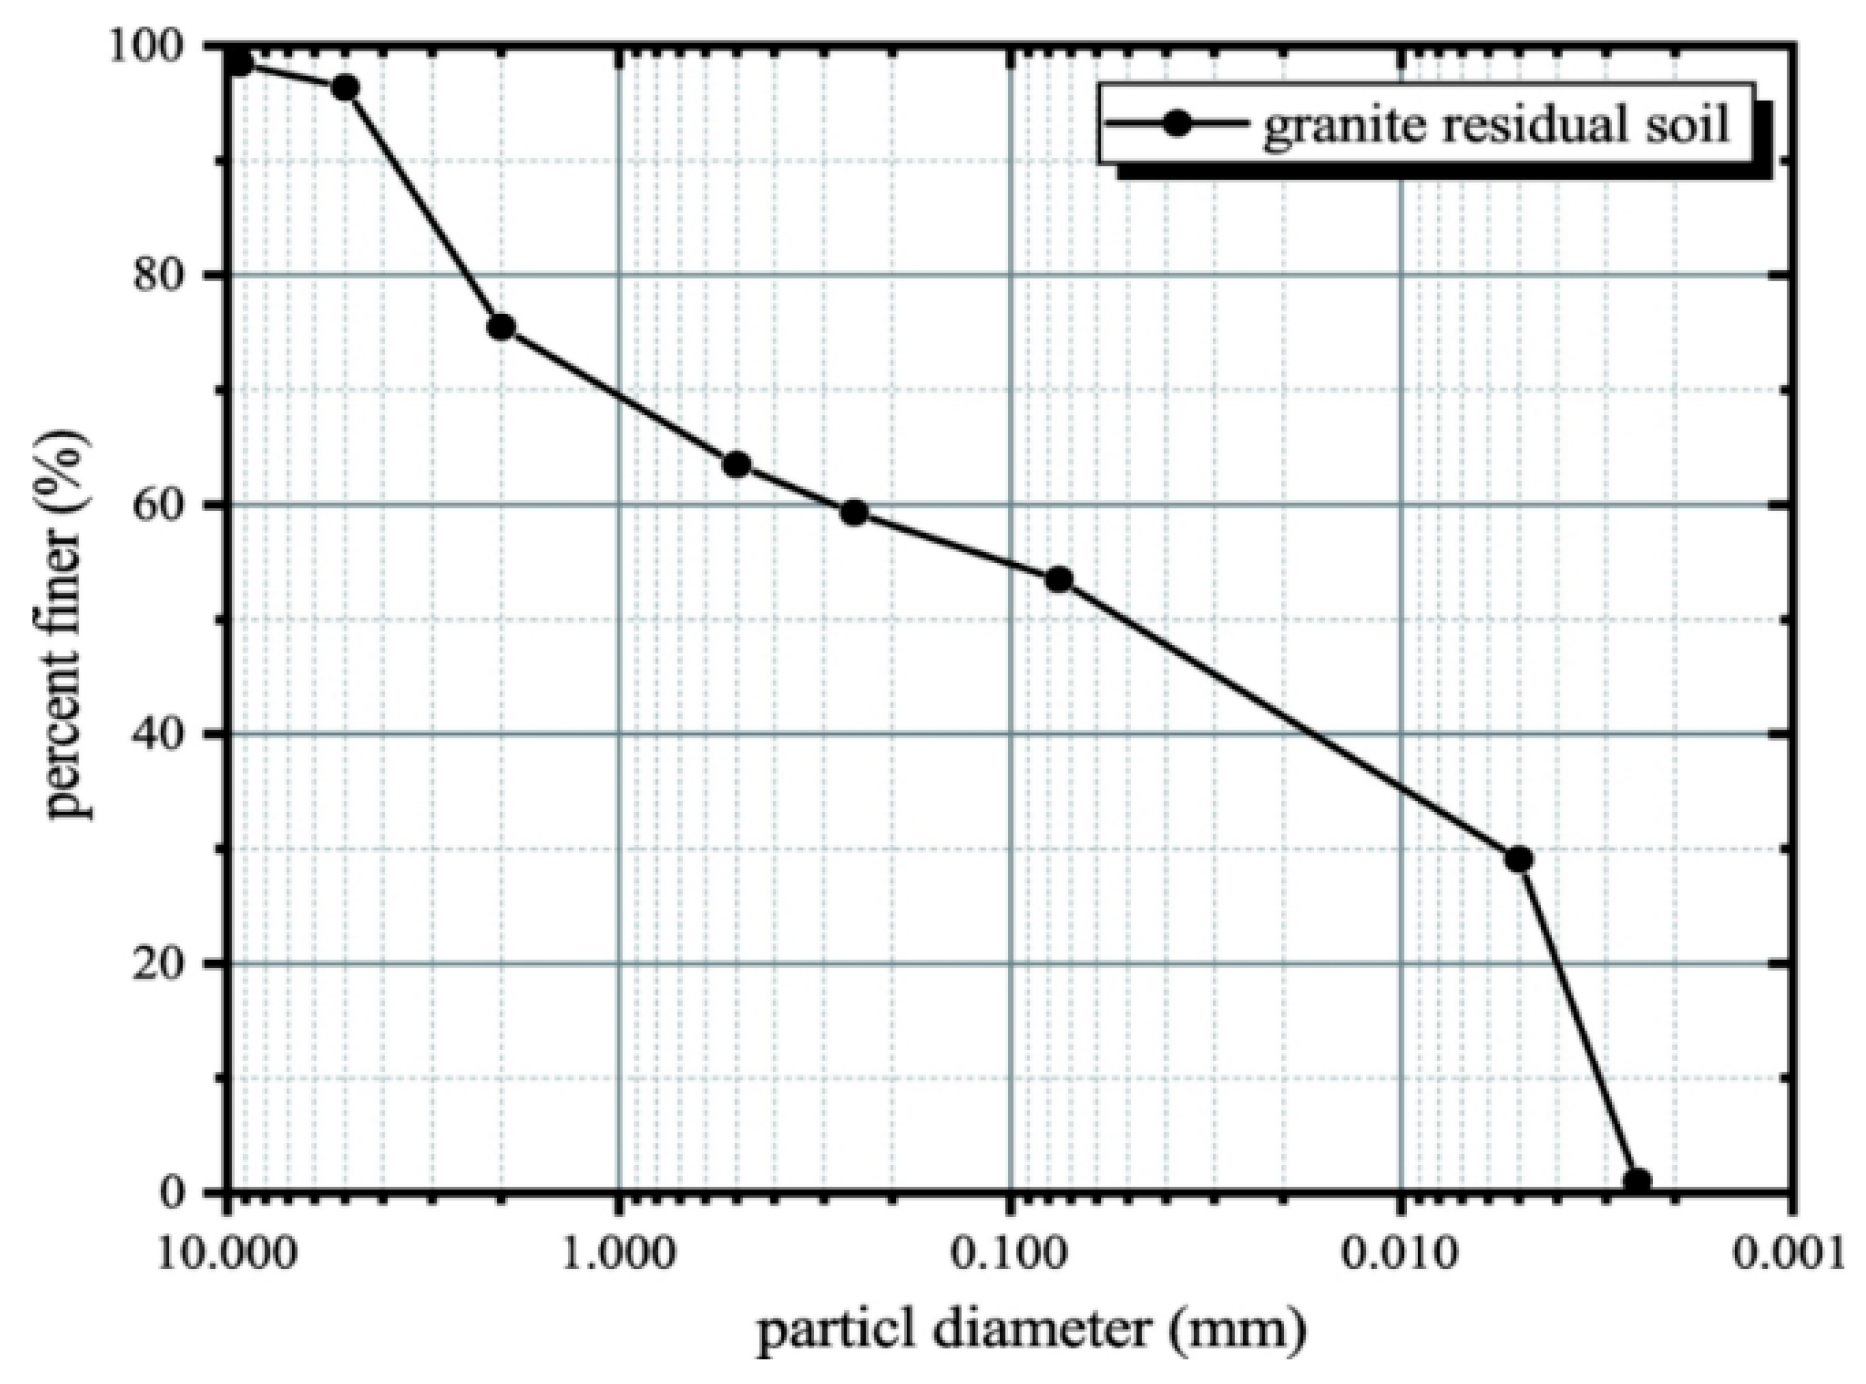
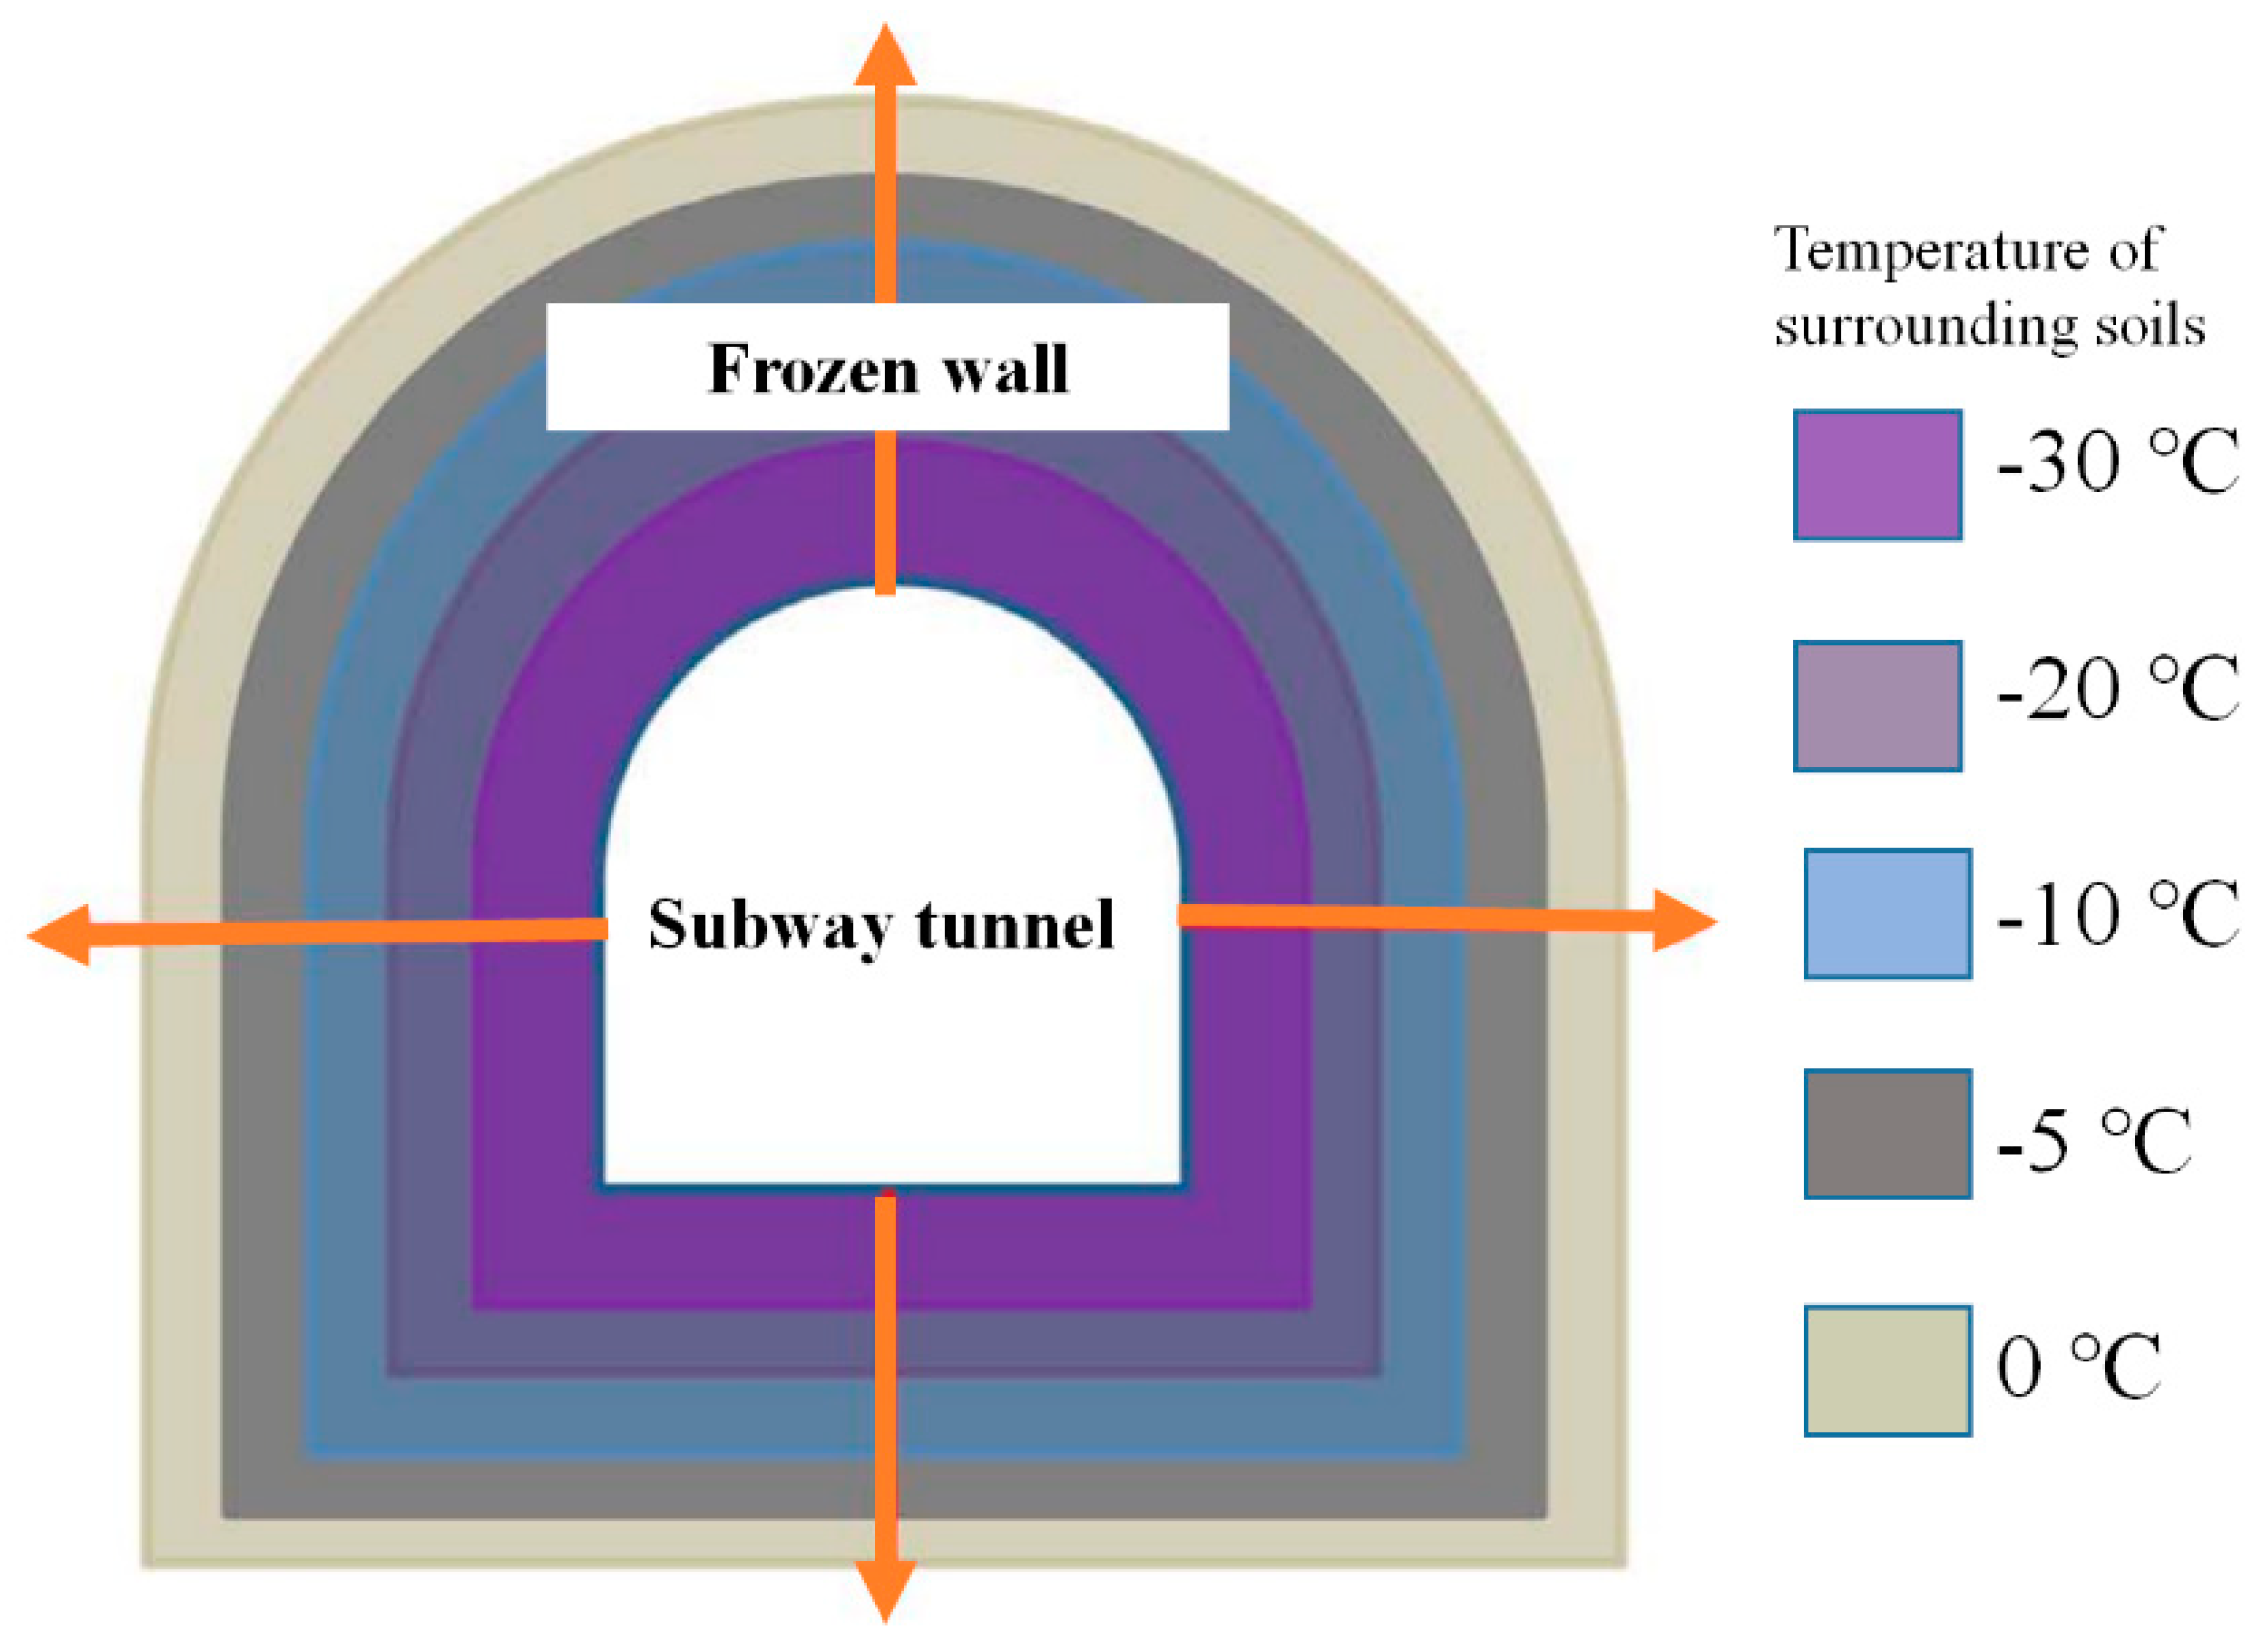
3.1. Sample Preparation

The granite residual soils tested in the present study were obtained from underground tunnel excavation interval areas in Xiamen city (latitude 24°26′ N, longitude 118°04′ E). In consideration of the disturbing characteristic of granite residual soils, undisturbed samples were used for testing. The basic parameters of residual soils were measured in laboratory and given in Table 1. The density, water content, liquid limit, plastic limit and plasticity index of the soil were measured to be 1.98 g/cm3, 58.6%, 28.9% and 29.7%, respectively. According to XRD diffraction pattern measurements performed using an AXS D8-Focus X-Ray Diffraction instrument produced by Bruker Company from Germany, it is found that the soil is largely composed of clay minerals (e.g., kaolinite and illite) as well as non-clay minerals (e.g., quartz and a trace of hematite). Figure 1 shows the grain compositions of residual soils which were measured in the laboratory by referring to the standard ASTM-D422, 2007 [37]. As an intermediate soil between coarse-grained and fine-grained soils, the granite residual soil contains high proportions of clay and gravel particles in its particle size distribution. By conducting the permeability and porosity measurement using the KXD-II combined tester, the porosity and permeability of undisturbed residual soils were ascertained.
During artificial freezing process, the cooling effect kept the soils around tunnel pipes at low-temperatures. The temperature dropped as the distance between pipes and soils decreased as shown in Figure 2. Generally, the freezing temperature at the surface tunnel pipe was controlled around −30 °C. Namely, along the perpendicular direction to the tunnel axis, which is the heat conducting direction, the soil varying to its location encountered a freezing and thawing cycle under a certain low-temperature [38]. In order to simulate the freezing circumstance of the frozen-wall by laboratory experiments, it was simplified into four low-temperature groups of −5 °C, −10 °C, −20 °C and −30 °C, in consideration of the freezing effects on microstructures in residual soils in this experimental investigation. Before the experiments, four groups of cylinder samples from undisturbed residual soils (38 mm in diameter and 80 mm in height, respectively) were prepared. Then, the tested sample was frozen up to −5 °C, −10 °C, −20 °C and −30 °C respectively and kept frozen for 48 h in a programmable cryogenic freezer. Subsequently, the frozen sample with different temperature was defrosted at a room temperature of 25 °C for 24 h and fully saturated by using a vacuum saturation device for 72 h.

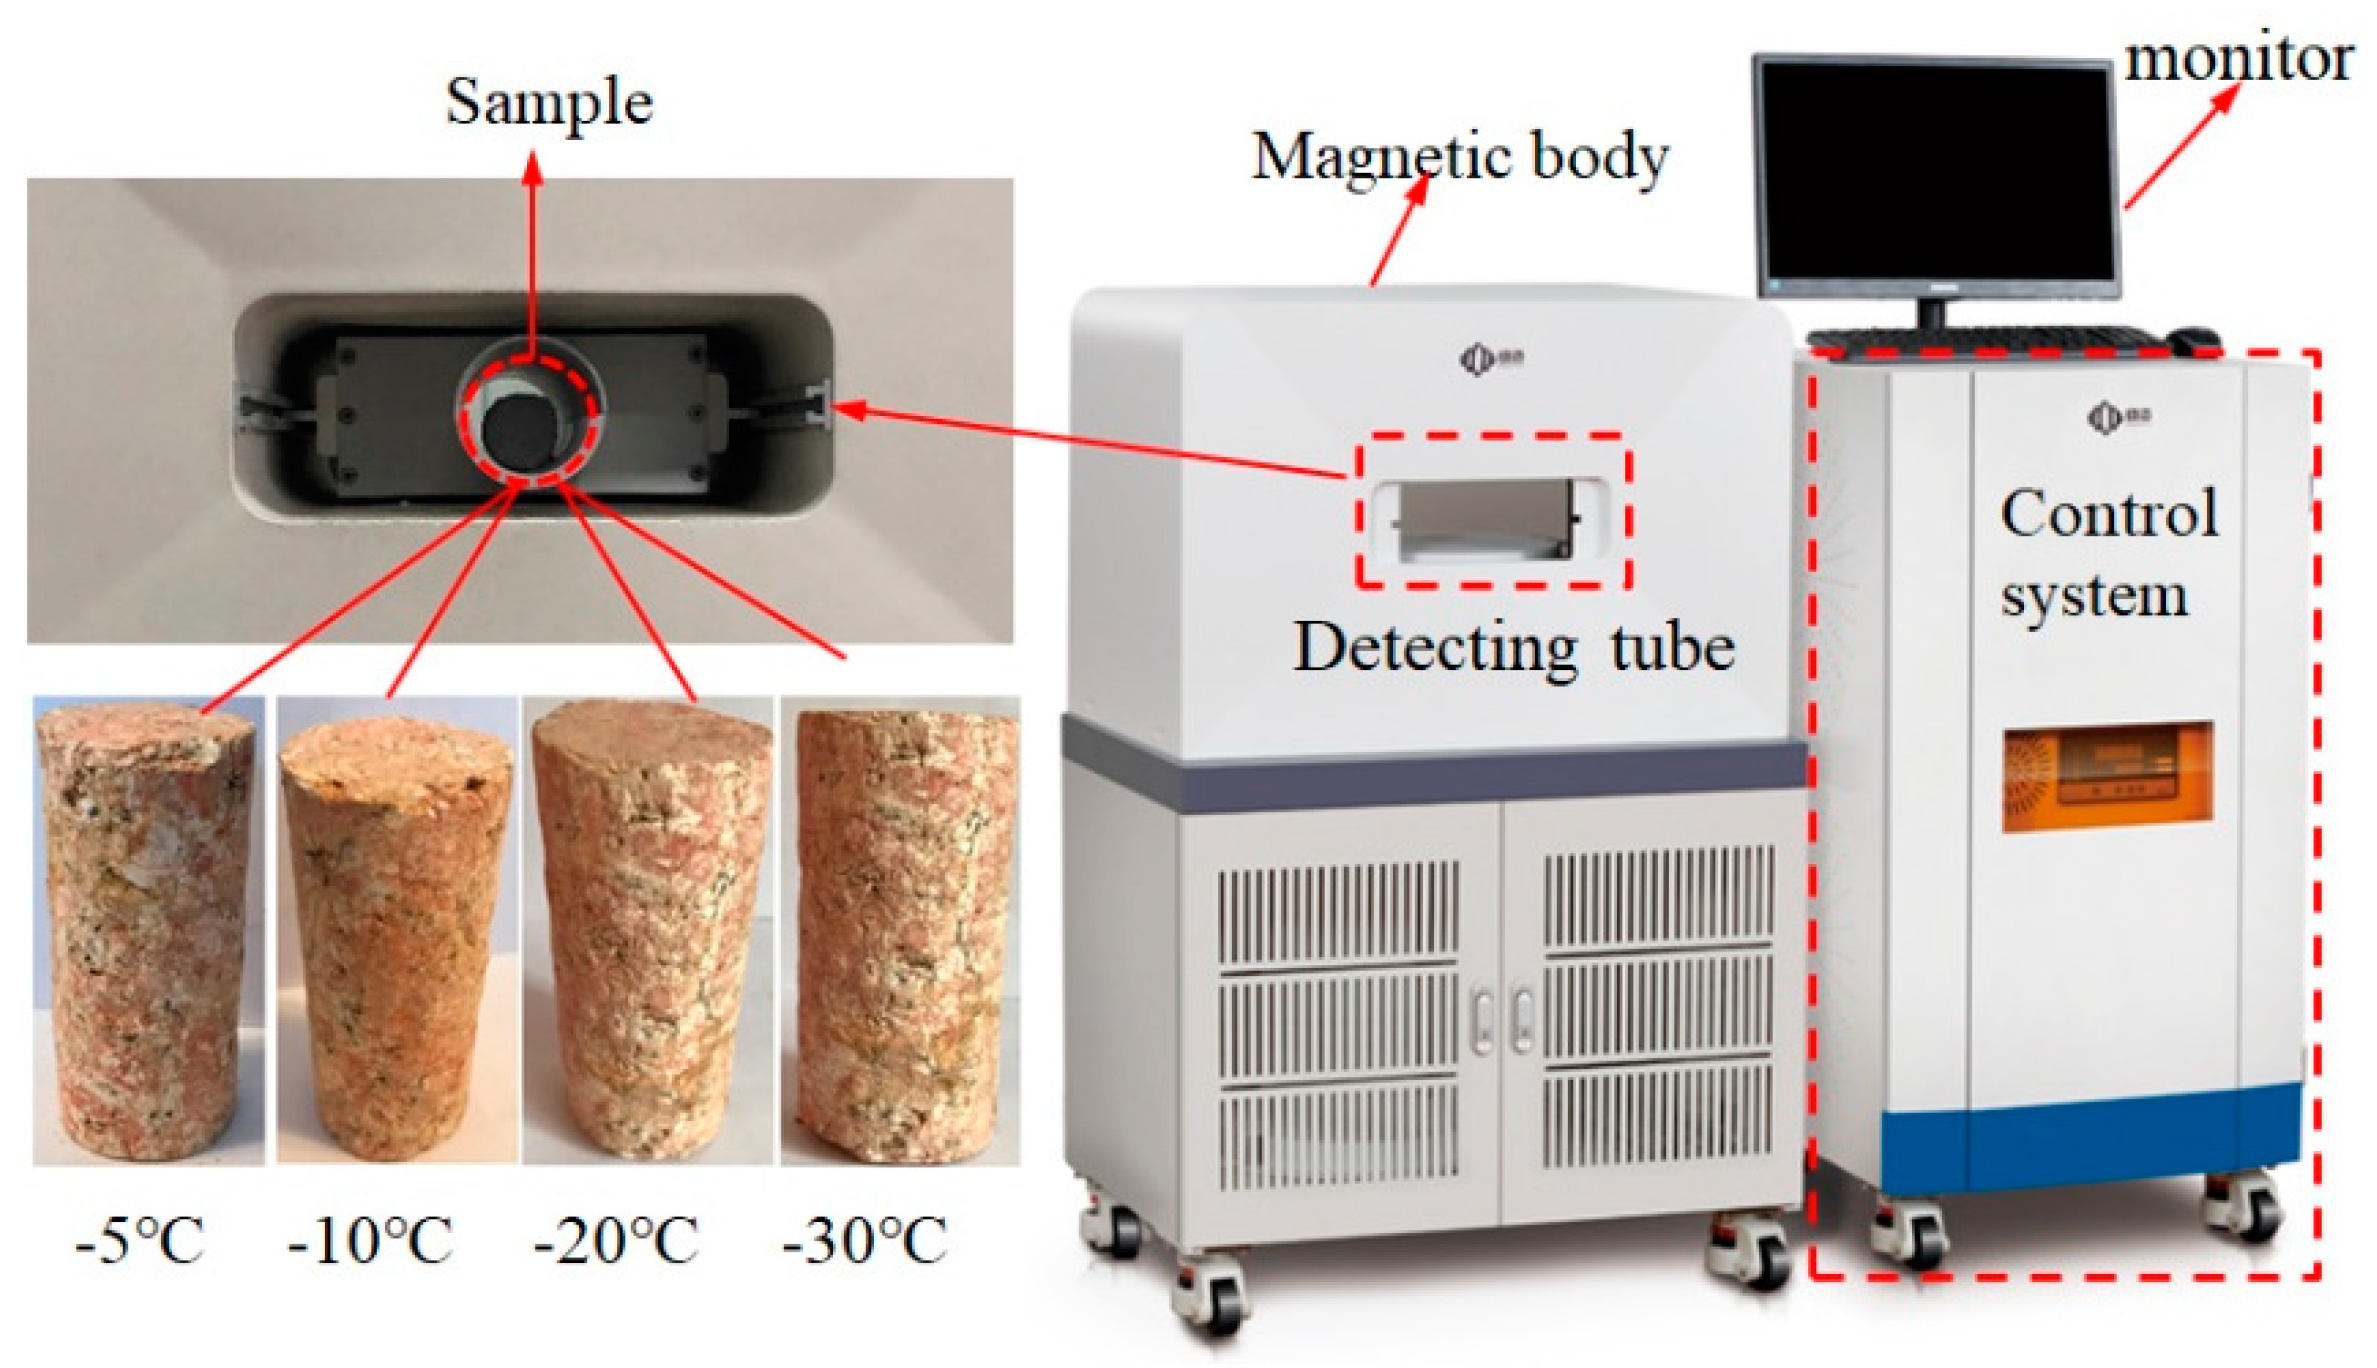
3.2. Testing Apparatus and Procedures

To study the microstructures in residual soils in the constructing process of artificial freezing method, the porosity and transverse relaxation time (T2) measurements were performed using a AniMR-150 NMR imaging system (Suzhou Niumag Analytical Instrument Co., Suzhou, Jiangsu, China) with 0.5T permanent magnet corresponding to a proton resonance frequency of 25.76 MHz at 25 °C. The photo of the NMRI equipment and the tested samples after freezing and thawing treatments were presented, as illustrated in in Figure 3. After the freezing and thawing treatments, the saturated samples were tested by a NMR scan to ascertain the T2 spectrum of thawed residual soils. Afterwards, the sample received the MRI measurement to obtain pseudo-color slices of pore water.
After NMRI tests, the pore distribution information of the residual soil after freezing at −5 °C were also measured by conducting a MIP test with an AutoPore IV 9505 tester (geological laboratory of Hebei scoilmic company Ltd., Cang zhou, Hebei, China) according to the standard ASTM-D2166, 2000.

4. Results and Discussions

In this section, the measuring results of T2 spectrum curves and cross-sectional images of pore distributions were analyzed to study the pore structure variations of thawed soils under different freezing temperatures, and then the validity of NMRI measurements was discussed by the results of MIP tests.

4.1. Analysis of Pore Size Distributions

In this present section, the distribution curves of relaxation times T2 were analyzed, and the peak areas were determined. The T2 spectrum curves that exhibit two different peaks were plotted in Figure 4. It is clear that the major peak was significantly higher than the secondary peak in each T2 spectrum curve. As the freezing temperature dropped, the maximum value of the major and secondary peak increased noticeably. The values of peak area that were calculated from T2 spectrum curves indicate the pore water volumes in the tested sample. With the freezing temperature drops from −5 to −30 °C, the maximum value of the major peak increased from 525 to 633, and the secondary peak increased from 12 to 45, approximately. As illustrated in Figure 5, the relation between freezing temperatures and peak areas was studied by linear regression analysis since the value of peak area increased linearly with the drop in the freezing temperature. Besides, the linear function presented in Figure 5 could approximately express the correlation between temperatures and peak areas because the square of correlation coefficients R2 was 0.8724.
In the T2 spectrum curves, the X-coordinate (T2) and the Y-coordinate (NMR signal amplitude) reflect the pore volume and the distribution frequency of pores with a corresponding volume, respectively. On that basis, the pore size distribution of the thawed soils could be further analyzed. From the investigations on properties presented in Table 1, it shows that the permeability was 0.9012 μm2 and the porosity was 0.3098. Besides, the weighted mean geometric value T2LM of its T2 spectrum curve was 1.072 ms. Based on Equation (5), the coefficient ρ 2 of granite residual soils was calculated as 0.3098 μm/ms. Therefore, according to Equations (7) and (8), the volume distributions of pores with different diameters were obtained from T2 spectrum curves, as presented in Figure 6. Besides, according to the pore volume distribution curves, the accumulative pore volume distribution curves were plotted, also presented in Figure 6. In the pore volume distribution curves, the major peaks representing small pores were mainly distributed from 1 to 20 μm, while the secondary peaks representing large pores were distributed from 30 to 200 μm. From the accumulative pore volume distribution curves, the total pore volume of the sample under different freezing temperatures was 30.85 cm3, 32.26 cm3, 35.51 cm3 and 38.38 cm3, respectively. Besides, the volume of the major peaks and secondary peaks both increased with the drops of freezing temperatures. It is suggested that the pore volume contents of the residual soils significantly varied under the effect of artificial freezing process.
Based on the pore volume distributions from NMRI measurements, the pores in thawed soils can be divided into three different grades by diameters: macro-pores (<5 µm), meso-pores (5–10 µm) and macro-pores (>10 µm). The corresponding result of the pore classification is demonstrated in Figure 7. It can be observed that the volumes of pores with the full range of diameters increased when the freezing temperature decreased. The increasing rate of the micro-pore, meso-pore and macro-pore from temperature −5 to −30 °C was 16.82%, 22.23% and 45.19% approximately. Thus, the volume of macro-pores (diameter >10 µm) showed the most significant increases as the freezing temperature dropped. Under the temperature of −5 °C, −10 °C, −20 °C and −30 °C, the macro-pores in the thawed soils occupied a volume of 6.56 cm3, 7.02 cm3, 8.49 cm3 and 9.51 cm3, respectively. This phenomenon revealed that under the effect of artificial freezing treatments, considerable micro-pores in thawed soils were gradually expanded and connected into macro-pores.

4.2. Magnetic Resonance Images

The pore water distributed space in the thawed soils is discerned with NMRI scans visually according to the T2-weighted images. In this study, the transverse cross-sectional images of the saturated soils were captured to investigate the variations of pore water signal intensities of thawed soils after the artificial freezing process. Three T2 weighted cross-sectional images at different heights (namely the upper, middle and bottom of the tested sample) as well as the profile of the saturated sample were observed respectively, as shown in Figure 8. The pore structures reflected in pseudo-color images show a rising trend in areas of bright spots, revealing an enhancement of water-retainment capacity as the freezing temperature drops. It can be seen from Figure 8a that after the freezing treatment at −5 °C, the T2-weighted image is comparatively dark. Besides, the fringe areas of the image are apparently brighter than the central areas, indicating that the pores at the soil brims contain much free water. Figure 8b shows that after the freezing treatment at −10 °C, a few bright spots appear at the central areas of the image, which reflects the formation of secondary pores within the thawed soils. The changes in pore structures of soils after frozen at −10 °C are presented in the Figure 8c, which shows that the freezing and thawing effect at −20 °C has reinforced the expansion of pores within soils and consistently damages pore structures, especially for the pores in the centre of samples. When the freezing temperature of soils dropped to −30 °C, the bright areas of pore water gradually covered the entire cross-sections at different heights and the profile of the tested sample (Figure 8d). The heterogeneous features of pore water distributions in the image decreased distinctly, which proved that the pore structure in thawed soil became more homogeneous at an extremely low temperature. Thus, the results indicated that the structural damage of thawed soils was aggravated as continuously dropping the freezing temperature. Thus, the developing trend of the pore structure was verified based on NMRI measurements from a visual perspective.

4.3. Comparative Analysis of the NMRI and MIP Measurements

The mercury injection porosimetry (MIP) test, which was widely used in pore distribution analysis of thawed soils, was applied to measure the frequency distribution curve of pore diameter of a cylinder sample with its diameter of 20 mm and height of 20 mm after the artificial freezing treatment of −5 °C. The distributed frequency of pores under a diameter was calculated as Equation (9) and the NMRI-based pore size frequency distributed curve of thawed soils after an artificial freezing treatment of −5 °C was obtained to compare with the MIP result, as shown in Figure 9. It can be seen that the shape and peak positions of the two curves were in a good consistency. Moreover, the optimal pore diameters by NMRI and MIP were about 5.6 μm and 5.8 μm, which werequite close to each other. Thus, it is reasonable to use T2 spectrums from NMRI measurements to analyze pore size distribution characteristics of thawed soils.
f i = V i V i × 100 % ,
where fi denotes the distributed frequency of the pore with a certain diameter.
Theoretically, both NMRI and MIP results reflect pore structures in porous mediums so the pore size distribution curves from these two methods should keep completely consistent [39]. However, the pore size distributions obtained by the two methods have relatively obvious difference in the distribution of pores with diameter over 20 μm. This is because the method for obtaining pore size distribution by MIP and NMR has a difference of their physical principles. For the MIP test, the pore distributed condition in soils to the maximum mercury inlet pressure can only be measured by mercury injection. However, the connectivity of pores in soils is complicated and it is difficult for the mercury saturation of macro-pores to reach 100% [40]. The response of MIP results to the larger pore structure was limited, resulting in insufficient measurements of the connected macro-pores corresponding to the pore radius of mercury injection. Accordingly, the distributed frequency of large pores was underestimated while the frequency of small pores was relatively overestimated from the MIP measurements. Meanwhile, the NMRI method measured the total volume of pore water in saturated soils. For a fully saturated sample, the volume of pore water was approximately equal to the total pore volume, so the measurement from NMRI was extremely close to the actual pore structure in the tested sample. Besides, the NMRI scan was completely non-destructive to the internal structure of the tested sample while the mercury injection process during MIP measurements caused damage to the internal structure. Through data analysis, it was found that the average relative error of frequencies with different pore diameters between MIP and NMR was 18.16%, approximately. It is therefore concluded that the NMRI was more accurate than MIP measurements, as a new method to quantitatively study pore distribution characteristics of soils.

5. Conclusions

This study investigated the effect of artificial freezing treatments on pore structure characteristics of thawed residual soils in frozen-wall by conducting NMRI scans. On the basis of analysis, the following conclusions were drawn:
(1)
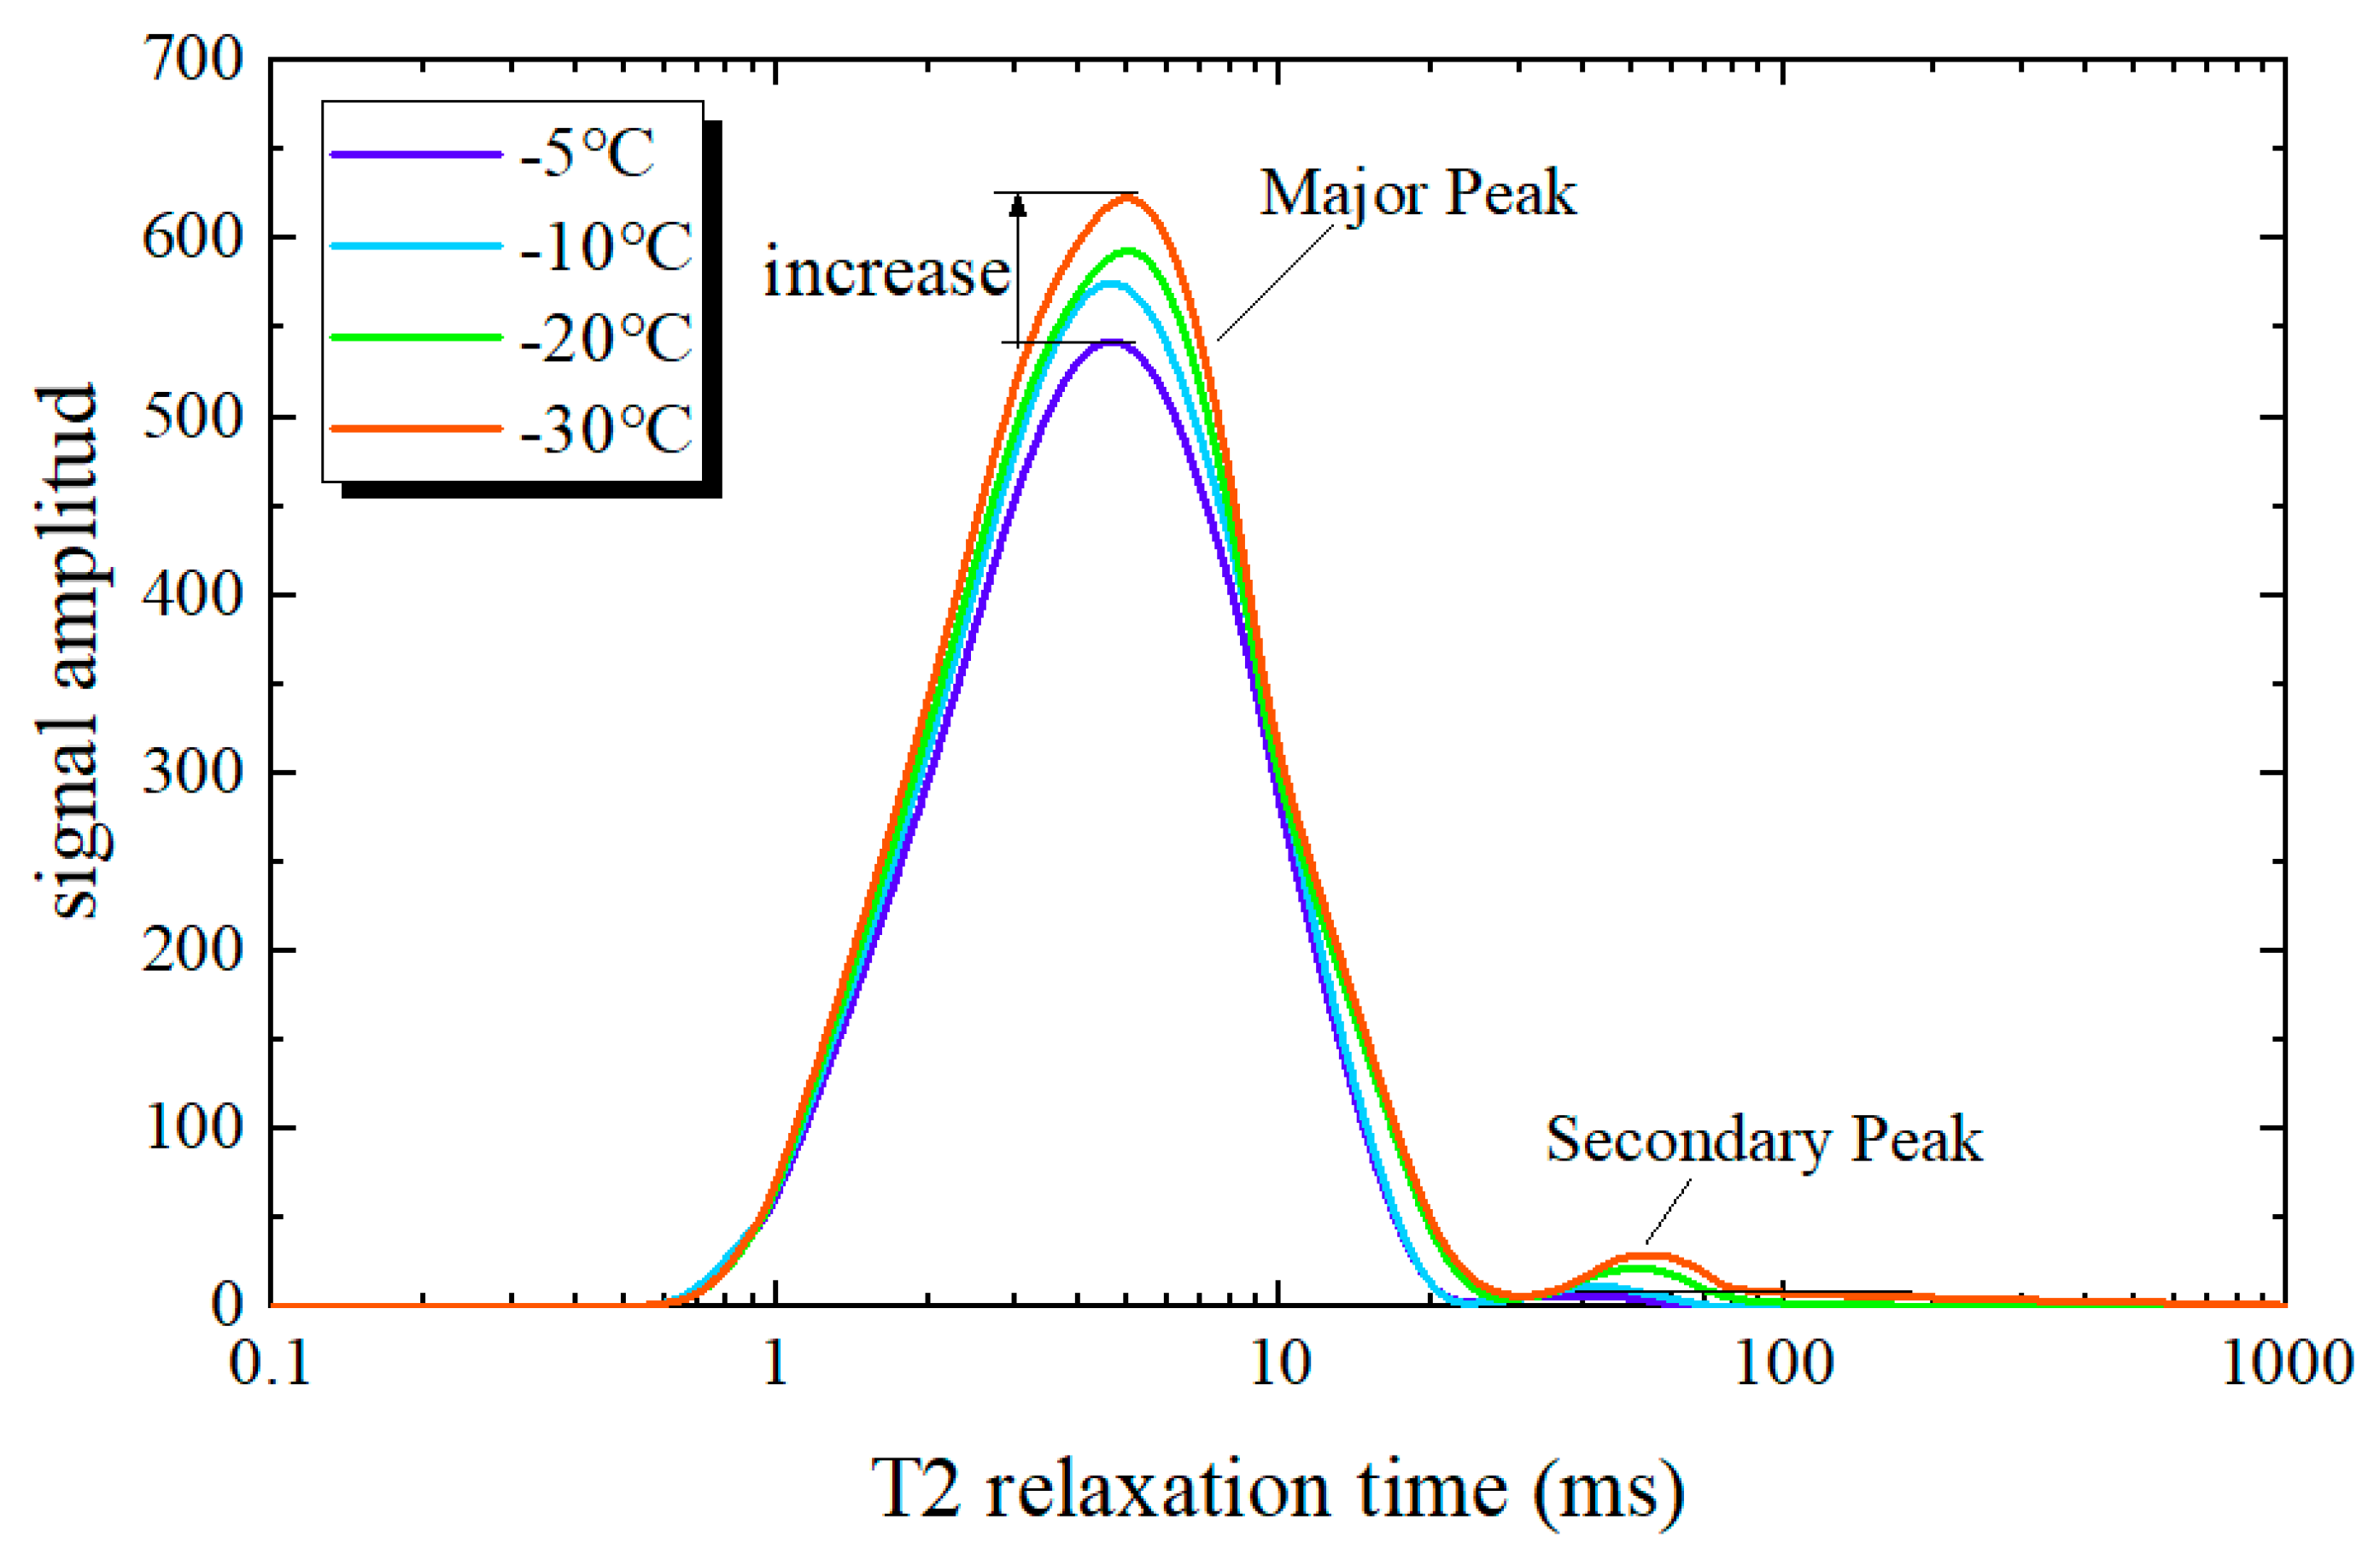
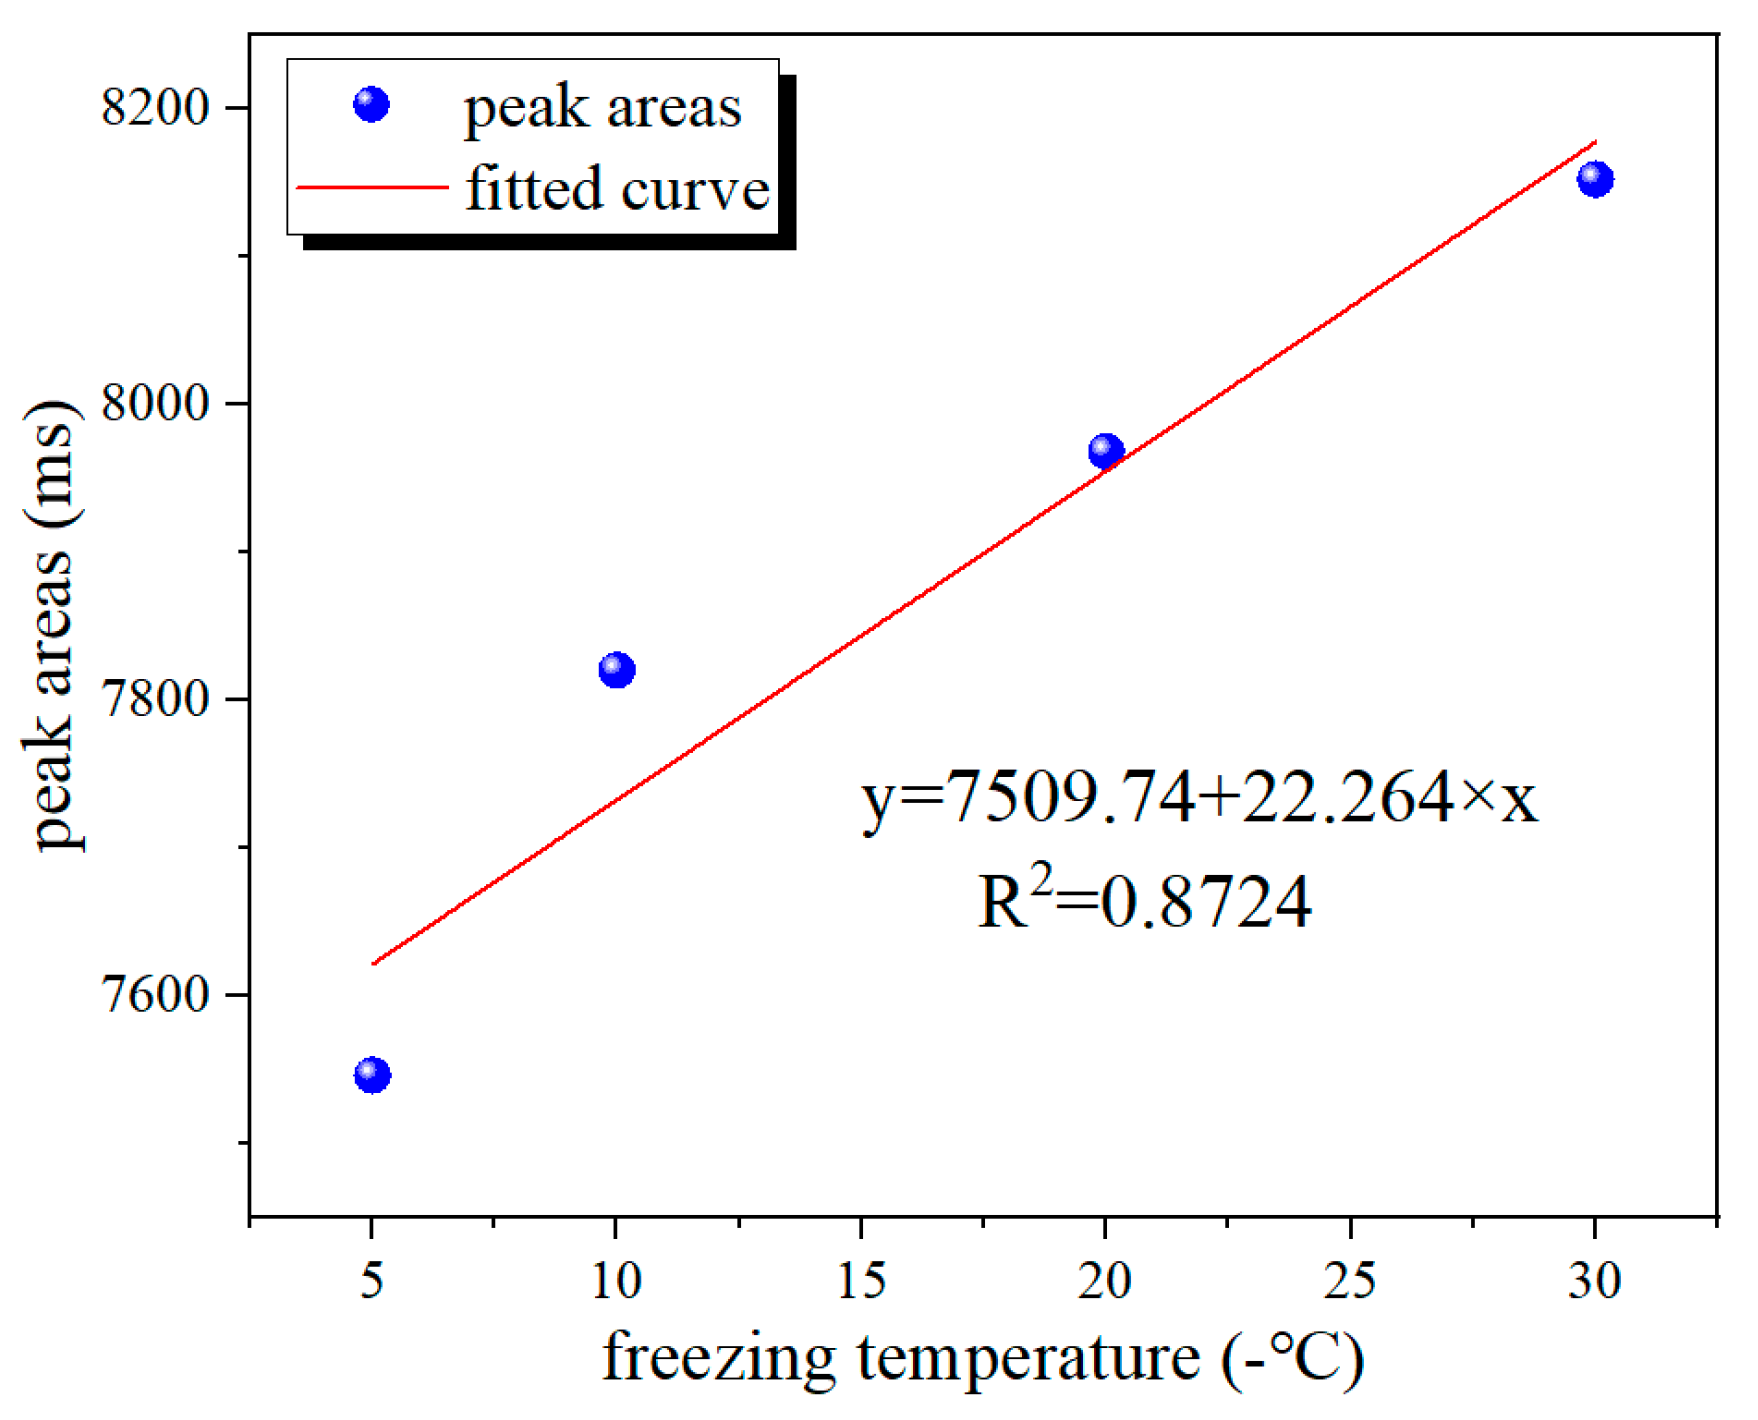
After conducting artificial freezing at different temperatures, which were −5, −10, −20 and −30 °C, the T2 spectrums which exhibit a bimodal distribution from NMRI measurements on thawed residual soils have a significant variation. With the freezing temperature dropped from −5 to −30 °C, the maximum value of the major peak in the T2 spectrum increases from 525 to 633, and the secondary peak increased from 12 to 45, approximately. Besides, the peak areas of T2 spectrums increase linearly with the freezing temperatures.
(2)
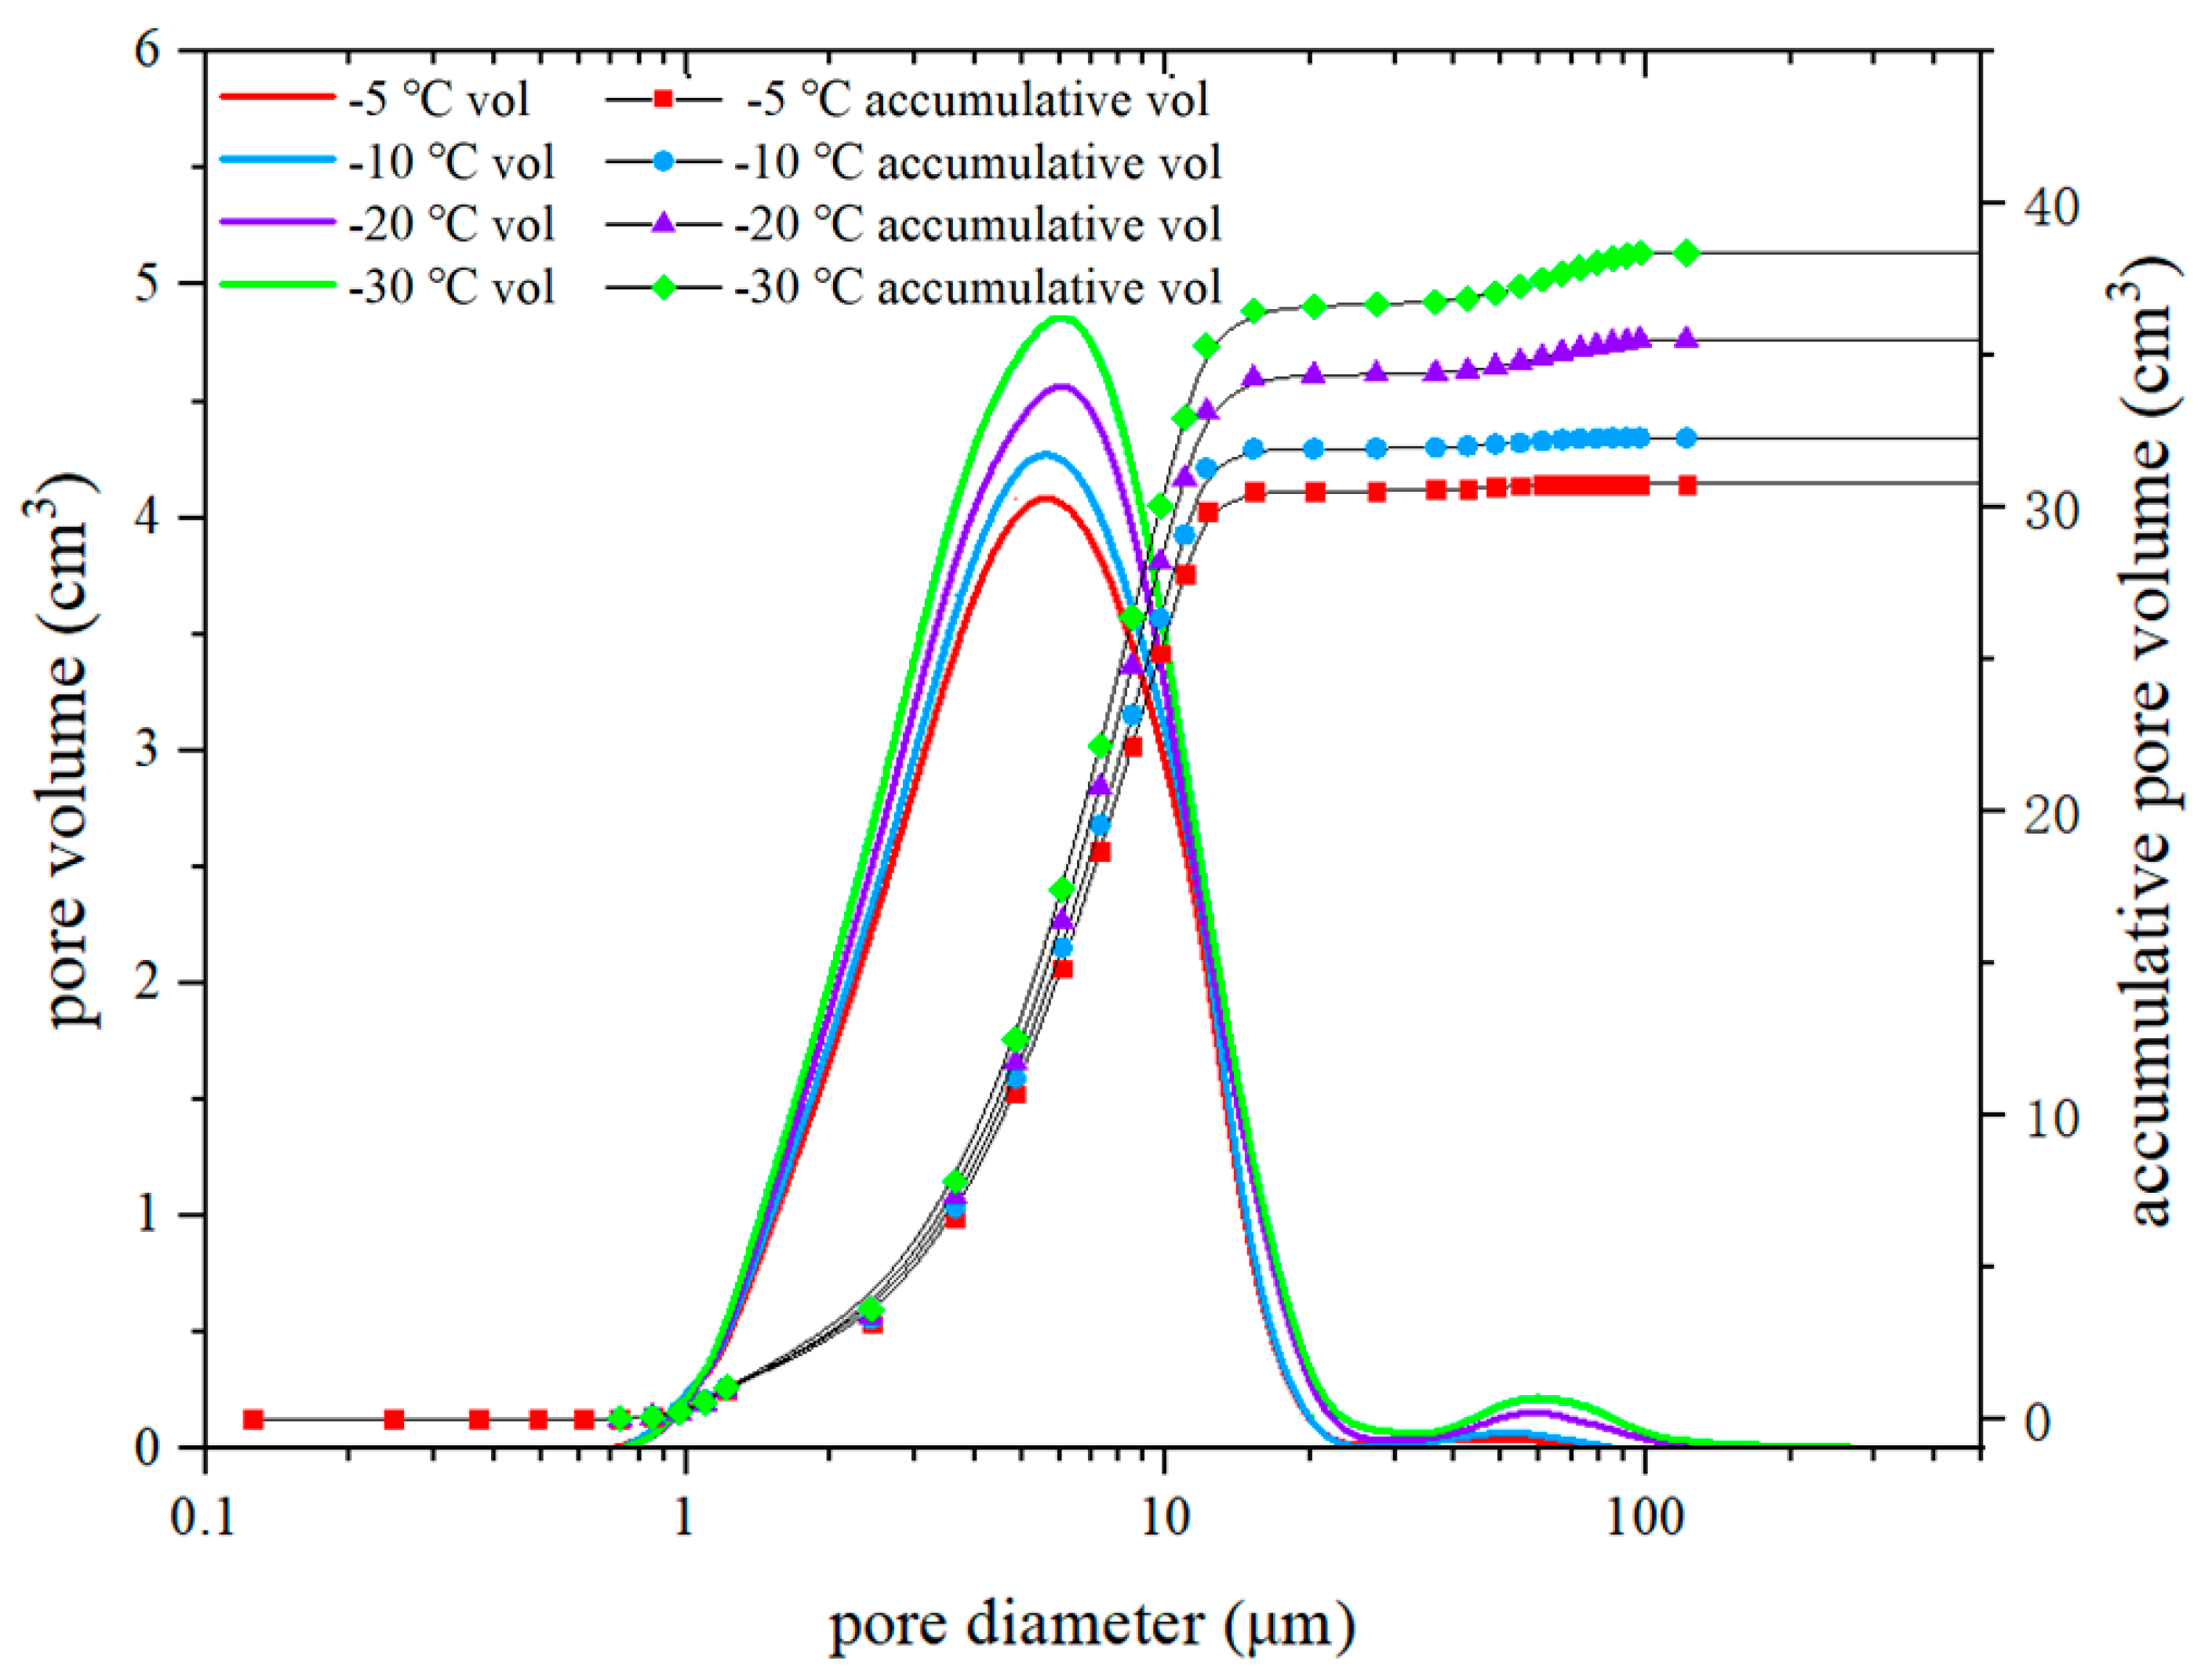
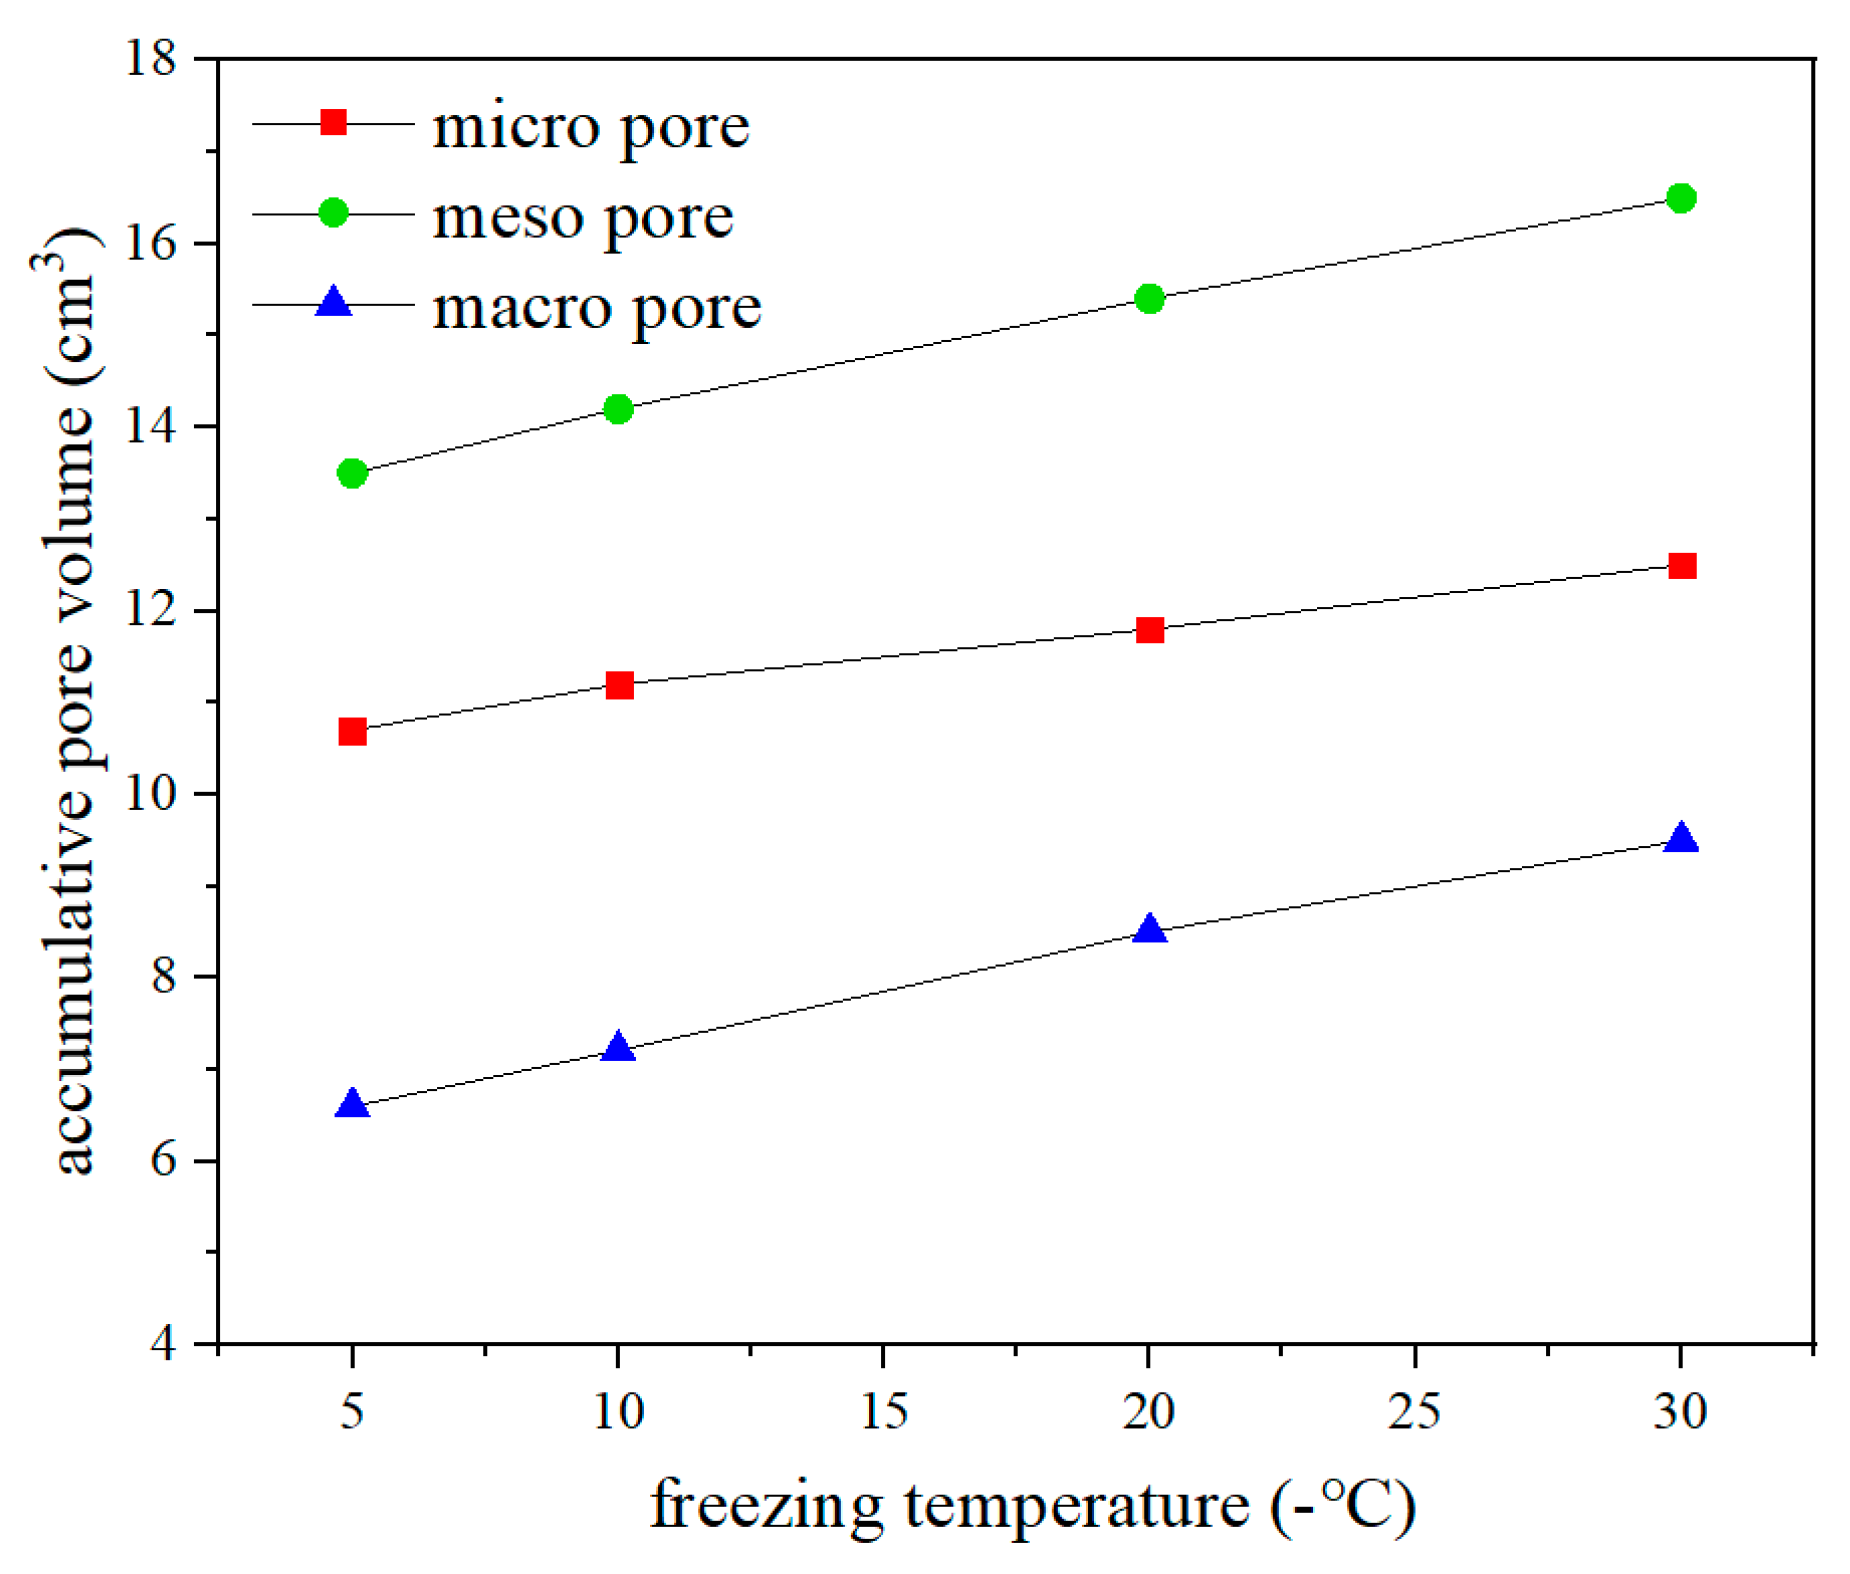
The T2 spectrums from NMRI tests could be used for the assessment of pore volume distributions of thawed residual soils by introducing the surface relaxation coefficient ( ρ 2 ). From the obtained pore volume distributions, pores in thawed soils could be divided into three different grades by diameters, which are micro-pores, meso-pores and macro-pores. The volume of pores with the full range of diameters all increased as the freezing temperature decreases.
(3)
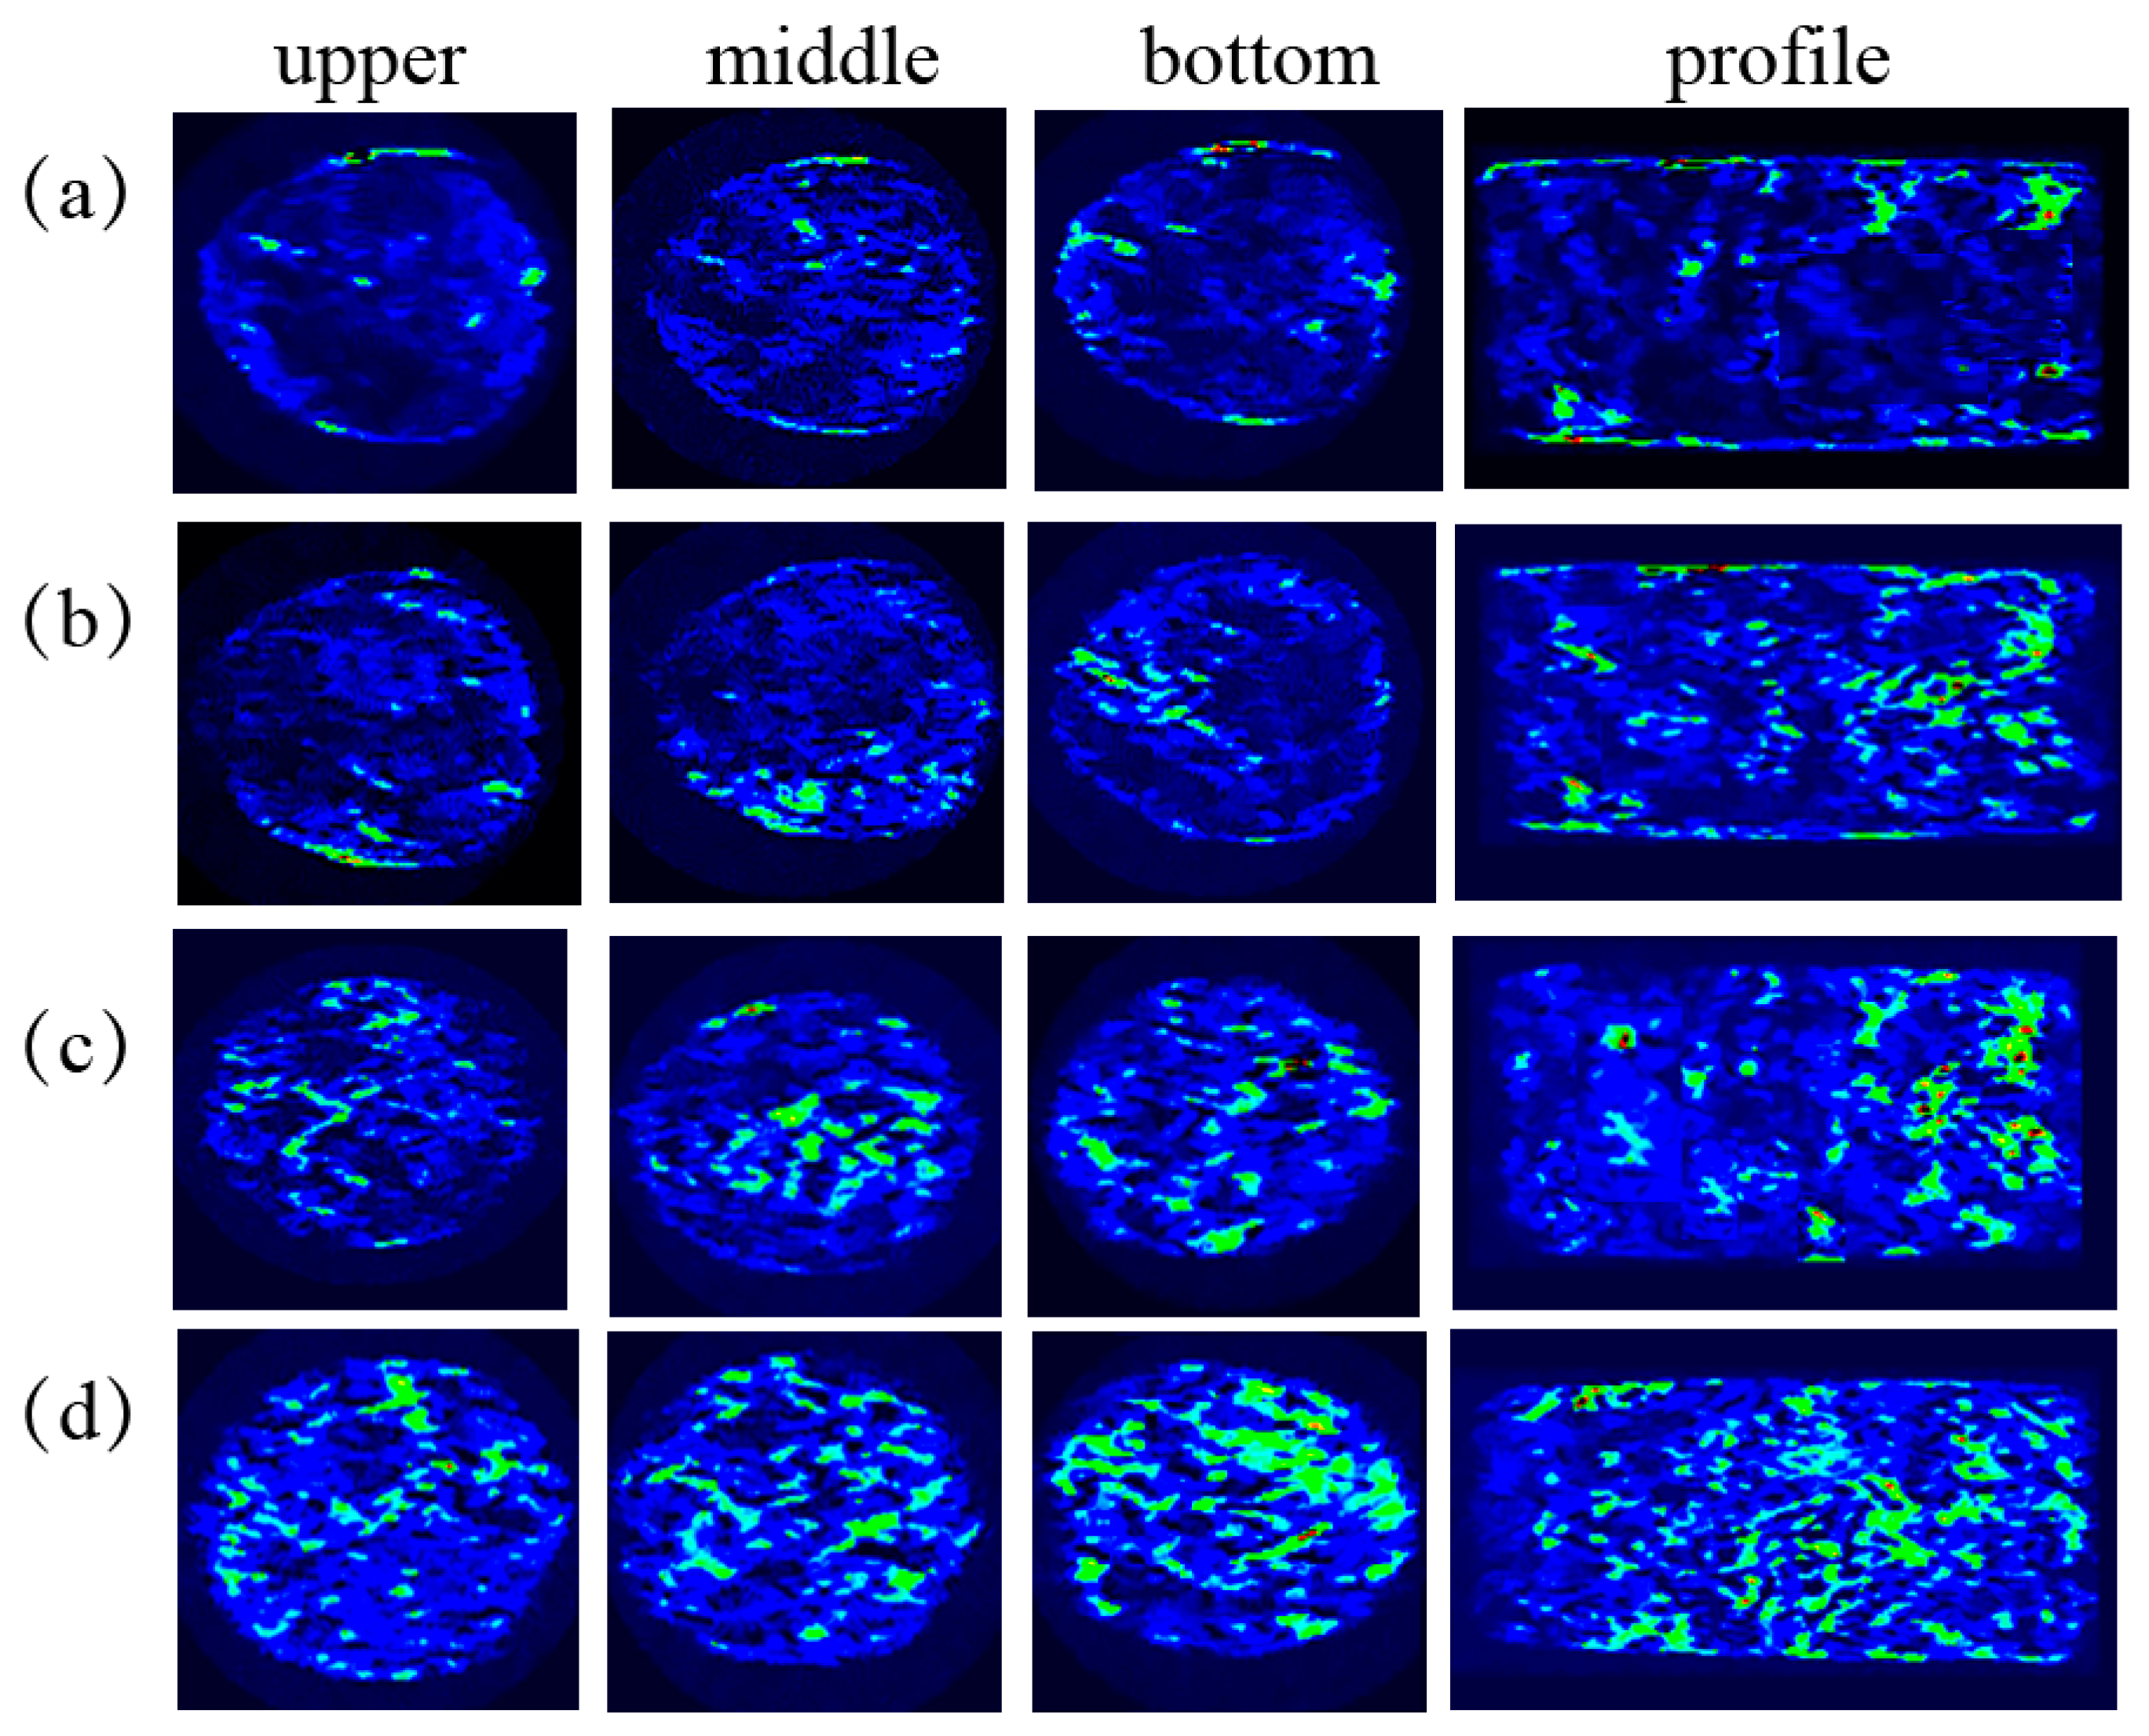
The NMRI test provided a visual result of pore structures in residual soils after freezing and thawing. According to the pore structures observed from T2-weighted images, the microstructural damage of thawed soils evolved from the surface to the interior of soils as the freezing temperature continuously drops.
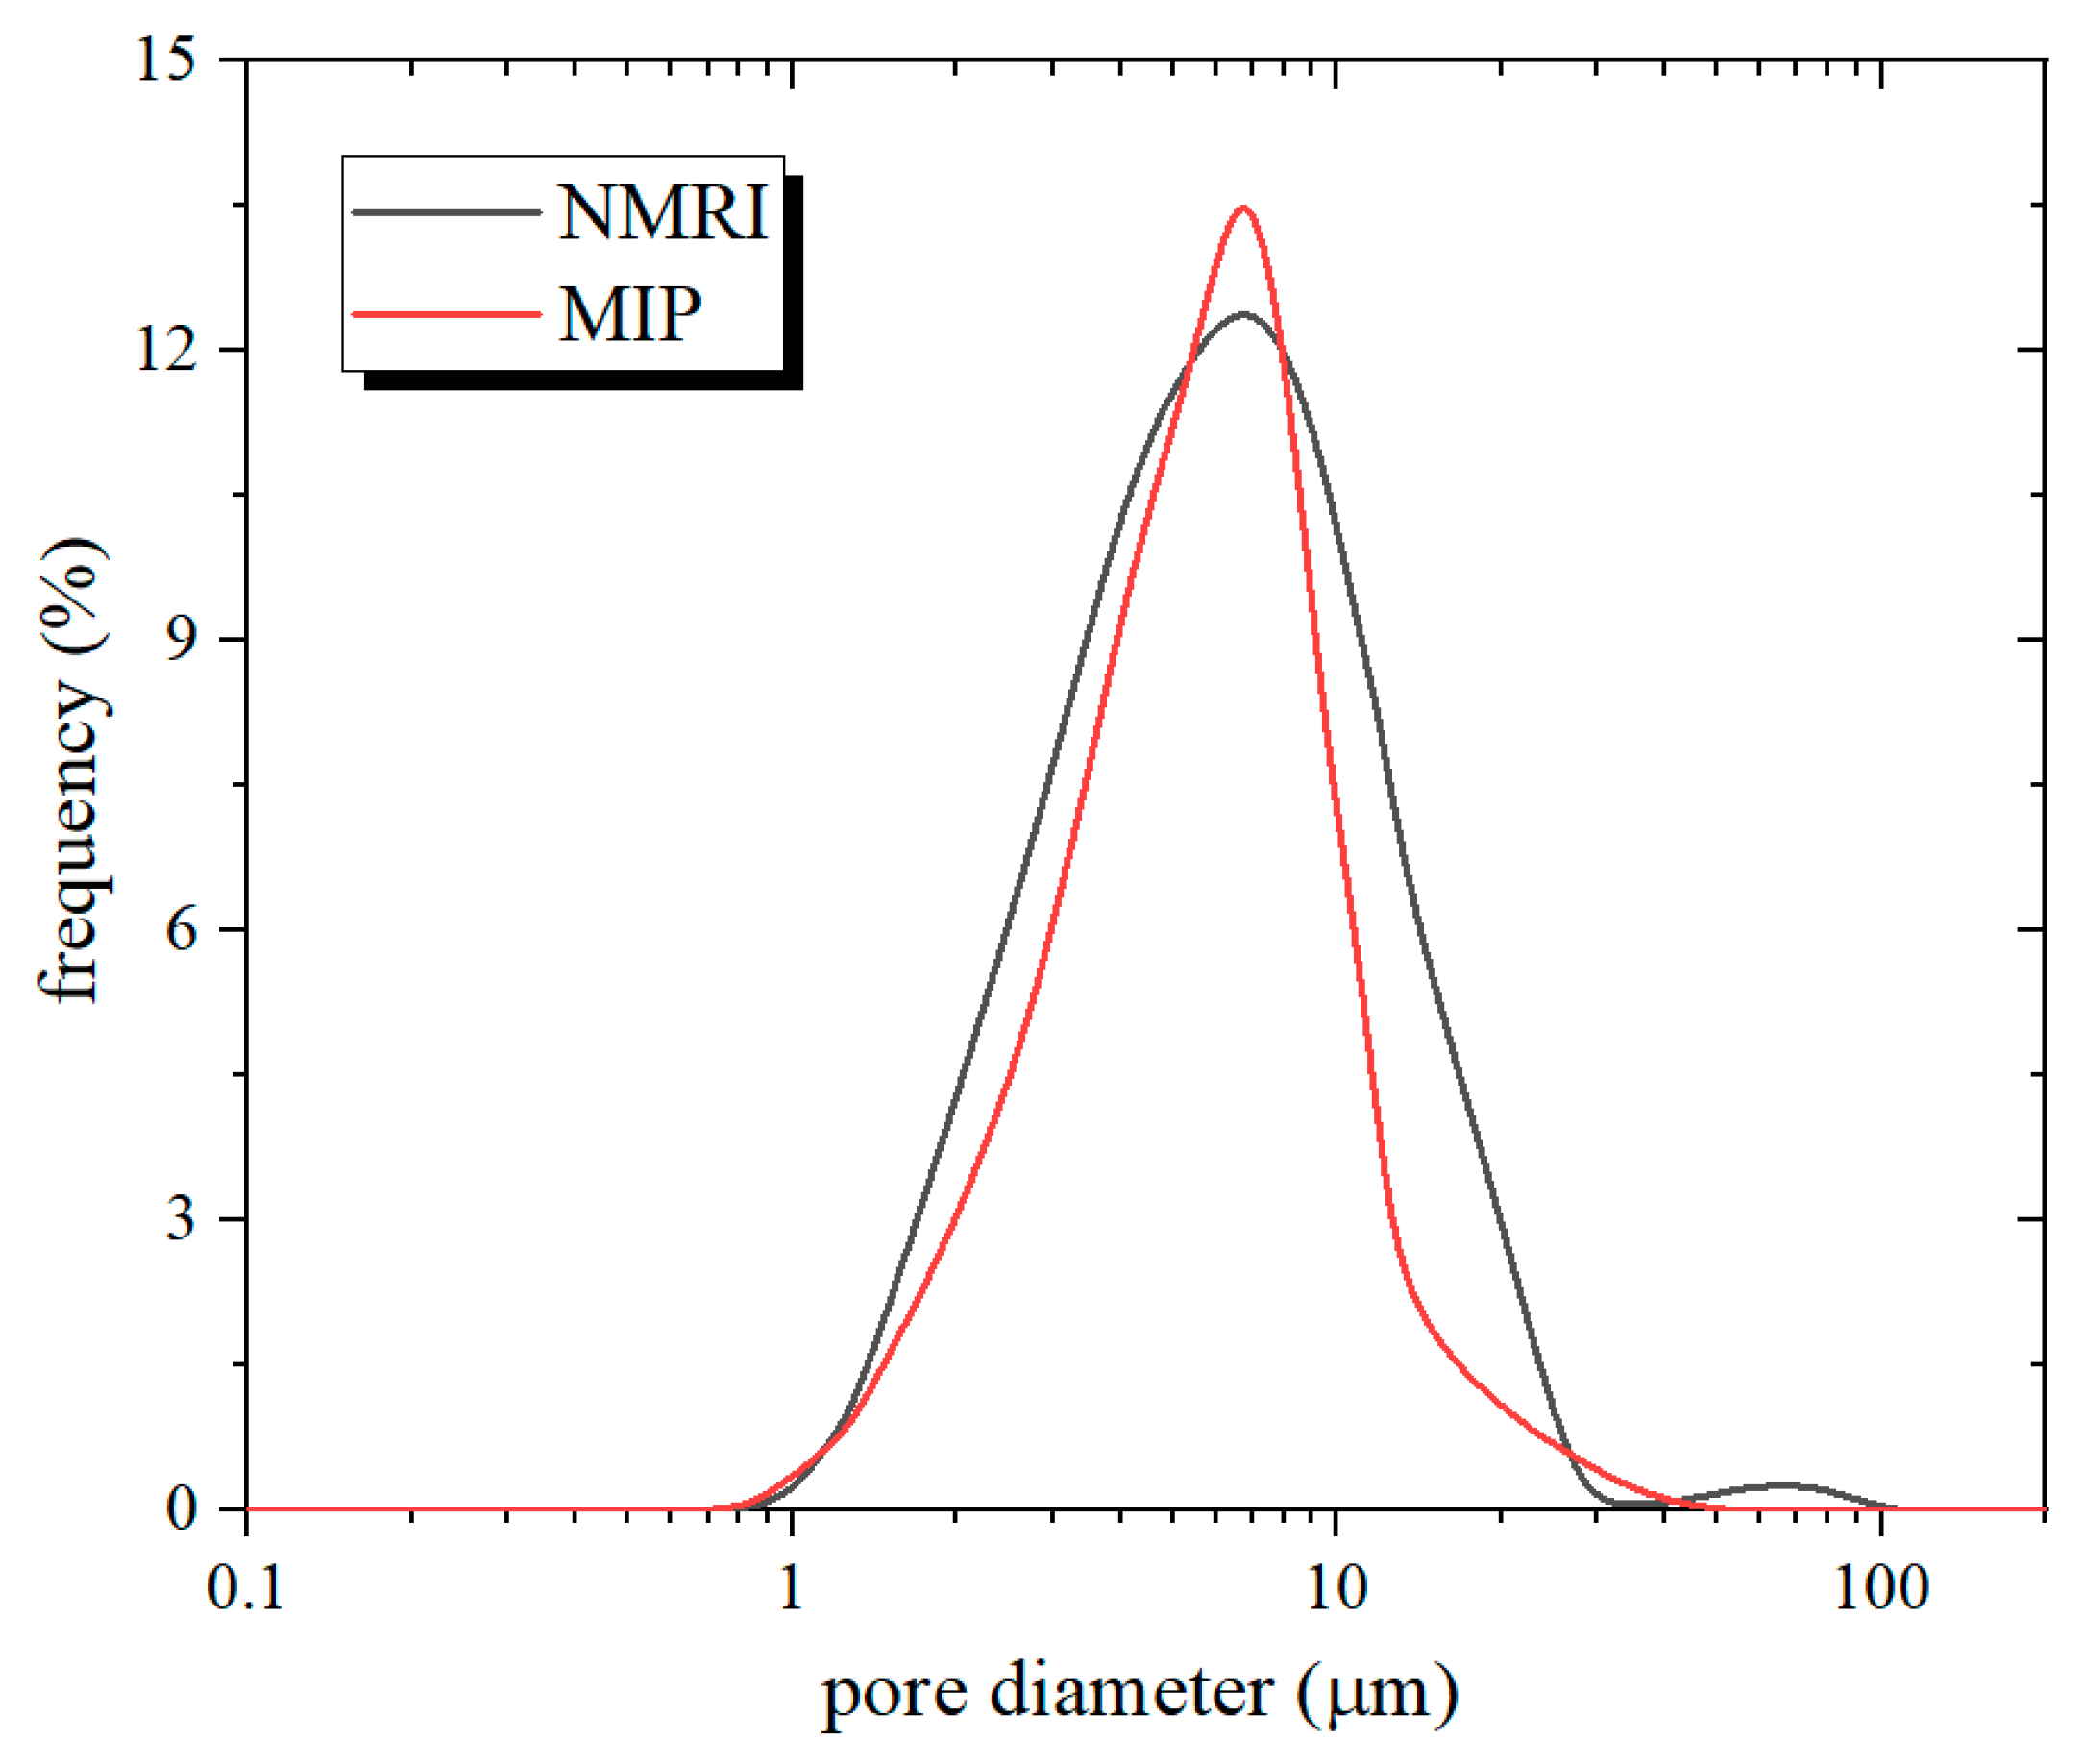
(4)
By comparing the pore size distribution curves obtained from the NMRI and MIP method respectively, the shape and peak positions of two curves were proved to have good consistency. However, the volume of macro-pores measured by MIP was significantly less than the result of NMRI, as a result of insufficient measurements of the macro-pores corresponding to the pore radius of mercury injection. Therefore, the NMRI scan was more accurate than the MIP measurement, as a new method to quantitatively study pore distribution characteristics of soils.

Author Contributions

The paper was written by R.A. under the guidance of L.K. The formal analysis and pre-literature research were carried out by R.A. and L.K. The laboratory tests were carried out by R.A. and C.L. All authors have read and agreed to the published version of the manuscript.

Funding

This research received no external funding

Acknowledgments

This research was funded by the financial support of the National Natural Science Foundation of China (Grant No. 11692320 and 41372314).

Conflicts of Interest

The authors declare that they have no conflicts of interest.

List of Symbols

Aiamplitude of NMR signal
Csquare of relaxation coefficient
D(μm)diameter of pores
fi(%)distributed frequency of pores with a certain diameter
IPplasticity index
Ks(μm2) permeability
md(g) mass of thoroughly dried soil sample
ms(g) total mass of saturated sample
mw(g) mass of pore water in the tested sample
S(μm2) surface area
T2(ms) relaxation time
T2B(ms) bulk fluid relaxation time
T2D(ms) diffusion relaxation time
T2LM(ms) geometric mean value of T2 spectrum
T2S(ms) surface relaxation time
V(μm3) pore volume
Vi(μm3) pore volume
w(%) moisture content
WL(%) liquid limit
WP(%) plastic limit
ρ2(μm/ms) relaxation coefficient
ρw(g/cm3)density of water
ϕ (%)porosity

References

  1. Zhang, X.W.; Kong, L.W.; Yin, S.; Chen, C. Engineering geology of basaltic residual soil in Leiqiong, southern China. Eng. Geol. 2017, 220, 196–207. [Google Scholar] [CrossRef]
  2. An, R.; Kong, L.W.; Guo, A.G.; Zhang, X.W. A Proposed Method to Determine In-Situ Shear Modulus and Shear Strain Decay Curves in Different Structured Soils. In Proceedings of the 7th International Symposium on Deformation Characteristics of Geomaterials, Glasgow, UK, 25–28 June 2019. [Google Scholar]
  3. Mohamedzein, E.A.; Aboud, M.H. Compressibility and shear strength of a residual soil. Geotech. Geol. Eng. 2006, 24, 1385–1401. [Google Scholar] [CrossRef]
  4. Fu, J.Y.; Yang, J.S.; Zhang, X.M.; Klapperich, H.; Abbas, S.M. Response of the ground and adjacent buildings due to tunnelling in completely weathered granitic soil. Tunn. Undergr. Space Technol. 2014, 43, 377–388. [Google Scholar] [CrossRef]
  5. Zhou, J.; Tang, Y. Practical model of deformation prediction in soft clay after artificial ground freezing under subway low-level cyclic loading. Tunn. Undergr. Space Technol. 2018, 76, 30–42. [Google Scholar] [CrossRef]
  6. Lackner, R.; Pichler, C.; Kloiber, A. Artificial ground freezing of fully saturated soil: Viscoelastic behavior. J. Eng. Mech. 2008, 134, 1–11. [Google Scholar] [CrossRef] [Green Version]
  7. Cui, Z.D.; Zhang, Z.L. Comparison of dynamic characteristics of the silty clay before and after freezing and thawing under the subway vibration loading. Cold Reg. Sci. Technol. 2015, 119, 29–36. [Google Scholar] [CrossRef]
  8. Tang, Y.Q.; Yan, J.J. Effect of freeze—Thaw on hydraulic conductivity and microstructure of soft soil in Shanghai area. Environ. Earth Sci. 2015, 73, 7679–7690. [Google Scholar] [CrossRef]
  9. Pichler, C.; Lackner, R.; Mang, H.A. Continuum-micromechanics approach for determination of frost heave in artificial ground freezing. Comput. Fluid Solid Mech. 2003, 578–581. [Google Scholar] [CrossRef]
  10. Hu, X.; Wu, Y.; Li, X. A field study on the freezing characteristics of freeze-sealing pipe roof used in ultra-shallow buried tunnel. Appl. Sci. 2019, 9, 1532. [Google Scholar] [CrossRef] [Green Version]
  11. Neithalath, N.; Sumanasooriya, M.S.; Deo, O. Characterizing pore volume, sizes, and connectivity in pervious concretes for permeability prediction. Mater. Charact. 2010, 61, 802–813. [Google Scholar] [CrossRef]
  12. Cheng, W.C.; Xue, Z.F.; Wang, L. Effects of pore structures of different maceral compositions on methane adsorption and diffusion in anthracite. Appl. Sci. 2019, 9, 5206. [Google Scholar] [CrossRef] [Green Version]
  13. Gutierrez, N.H.M.; Nóbrega, T.; Vilar, O.M. Influence of the microstructure in the collapse of a residual clayey tropical soil. Bull. Eng. Geol. Environ. 2009, 68, 107–116. [Google Scholar] [CrossRef]
  14. Olson, K.R. Characterization of Pore Size Distribution within Soils by Mercury Intrusion and Water-release Methods. Soil Sci. 1985, 139, 400–404. [Google Scholar] [CrossRef]
  15. Lyu, C.; Ning, Z.; Wang, Q.; Chen, M. Application of NMR T2 to pore size distribution and movable fluid distribution in tight sandstones. Energy Fuels 2018, 32, 12218–12230. [Google Scholar] [CrossRef]
  16. Sun, H.F.; Yang, Z.K.; Xing, M.X.; Ju, Y.; Yang, Y.M. CT investigation of fracture mechanism of soil-rock mixtures. Appl. Mech. Mater. 2012, 204–208, 67–71. [Google Scholar] [CrossRef]
  17. Yu, S.; Jia, M.; Zhou, J.; Zhao, C.; Li, L. Micro-Mechanism of Spherical Gypsum Particle Breakage under Ball–Plane Contact Condition. Appl. Sci. 2019, 9, 4795. [Google Scholar] [CrossRef] [Green Version]
  18. Yao, Y.; Liu, D. Comparison of low-field NMR and mercury intrusion porosimetry in characterizing pore size distributions of coals. Fuel 2012, 95, 152–158. [Google Scholar] [CrossRef]
  19. Li, C.; Kong, L.; Guo, A.; Zhang, X. X-ray Microscopic Study on Disintegration of Granite Residual Soil. In Proceedings of the 7th International Symposium on Deformation Characteristics of Geomaterials, Glasgow, UK, 25–28 June 2019. [Google Scholar]
  20. Gao, F.; Wang, Q.; Deng, H. Coupled effects of chemical environments and freeze-thaw cycles on damage characteristics of red sandstone. Bull. Eng. Geol. Environ. 2016, 76, 1481–1490. [Google Scholar] [CrossRef]
  21. Leij, F.J.; Ghezzehei, T.A.; Or, D. Analytical models for soil pore-size distribution after tillage. Soil Sci. Soc. Am. J. 2002, 66, 1104–1114. [Google Scholar] [CrossRef] [Green Version]
  22. Stingaciu, L.R.; Weihermueller, L.; Haberpohlmeier, S.; Stapf, S.; Vereecken, H.; Pohlmeier, A. Determination of pore size distribution and hydraulic properties using nuclear magnetic resonance relaxometry: A comparative study of laboratory methods. Water Resour. Res. 2010, 46. [Google Scholar] [CrossRef] [Green Version]
  23. Haber-Pohlmeier, S.; Stapf, S.; Pohlmeier, A. NMR fast field cycling relaxometry of unsaturated soils. Appl. Magn. Reson. 2014, 45, 1099–1115. [Google Scholar] [CrossRef]
  24. Li, J.L.; Rennie, K.B.; Zhou, K.P. Experimental investigations on the effects of ambient freeze-thaw cycling on dynamic properties and rock pore structure deterioration of sandstone. Cold Reg. Sci. Technol. 2018, 154, 133–141. [Google Scholar] [CrossRef]
  25. Liyun, T.; Ke, W.; Long, J.; Gengshe, Y.; Hailiang, J.; Assaad, T. A resistivity model for testing unfrozen water content of frozen soil. Cold Reg. Sci. Technol. 2018, 153, 55–63. [Google Scholar] [CrossRef]
  26. Tan, M.; Lin, Z.; Zu, Y.; Zhang, J.; Tian, W.G.; Ke, B. Effect of multiple freeze-thaw cycles on the quality of instant sea cucumber: Emphatically on water status of by LF-NMR and MRI. Food Res. Int. 2018, 109, 65–71. [Google Scholar] [CrossRef] [PubMed]
  27. Rahardjo, H.; Lim, T.T.; Chang, M.F. Shear-strength characteristics of a residual soil. Can. Geotech. J. 1995, 32, 60–77. [Google Scholar] [CrossRef]
  28. Ge, X.; Fan, Y.; Cao, Y.; Xu, Y.; Liu, X.; Chen, Y. Reservoir Pore Structure Classification Technology of Carbonate Rock Based on NMR T2 Spectrum Decomposition. Appl. Magn. Reson. 2014, 45, 155–167. [Google Scholar] [CrossRef]
  29. Sun, T.; Yan, W.; Wang, H.; Golsanami, N.; Zhang, L. Developing a new NMR-based permeability model for fractured carbonate gas reservoirs. J. Nat. Gas Sci. Eng. 2016, 35, 906–919. [Google Scholar] [CrossRef]
  30. Xiao, L.; Zou, C.C.; Mao, Z.Q.; Jin, Y.; Zhu, J.C. A new technique for synthetizing capillary pressure (pc) curves using NMR logs in tight gas sandstone reservoirs. J. Pet. Sci. Eng. 2016, 145, 493–501. [Google Scholar] [CrossRef]
  31. Liu, M.; Xie, R.; Guo, J.; Jin, G. Characterization of pore structures of tight sandstone reservoirs by multifractal analysis of the NMR T2 distribution. Energy Fuels 2018, 32. [Google Scholar] [CrossRef]
  32. Tian, H.; Wei, C.; Wei, H. An NMR-Based Analysis of Soil-Water Characteristics. Appl. Magn. Reson. 2014, 45, 49–61. [Google Scholar] [CrossRef]
  33. Chen, M.; Dai, J.; Liu, X.; Kuang, Y.; Qin, M.; Wang, Z. Contributions of pore-throat size distribution to reservoir quality and fluid distribution from NMR and MIP in tight sandy conglomerate reservoirs. Arabian J. Geosci. 2019, 12. [Google Scholar] [CrossRef]
  34. Jahwar, J.; Hessel, L.C.; Marie-Claire, B.; John, D.; Rachida, S. Studies of water and ice in hydrophilic and hydrophobic mesoporous silicas: Pore characterisation and phase transformations. Phys. Chem. Chem. Phys. 2010, 12, 2838–2849. [Google Scholar] [CrossRef] [Green Version]
  35. Daigle, H.; Dugan, B. Extending NMR data for permeability estimation in fine-grained sediments. Mar. Pet. Geol. 2009, 26, 1419–1427. [Google Scholar] [CrossRef]
  36. Xiong, H.; Yuan, K.; Wen, M.; Yu, A.; Xu, J. Influence of pore structure on the moisture transport property of external thermal insulation composite system as studied by NMR. Constr. Build. Mater. 2019, 228, 116815. [Google Scholar] [CrossRef]
  37. ASTM-D422. Standard Test Method for Particle-Size Analysis of Soils. In Annual Book of ASTM Standards; ASTM: West Conshohoken, PA, USA, 2007. [Google Scholar]
  38. Vitel, M.; Rouabhi, A.; Tijani, M.; Guérin, F. Modeling heat transfer between a freeze pipe and the surrounding ground during artificial ground freezing activities. Comput. Geotech. 2015, 63, 99–111. [Google Scholar] [CrossRef]
  39. Yao, Y.; Liu, D.; Cai, Y.; Li, J. Advanced characterization of pores and fractures in coals by nuclear magnetic resonance and X-ray computed tomography. Sci. China Earth Sci. 2010, 53, 854–862. [Google Scholar] [CrossRef]
  40. Muller, A.C.A.; Scrivener, K.L. A reassessment of mercury intrusion porosimetry by comparison with, 1h NMR relaxometry. Cem. Concr. Res. 2017, 100, 350–360. [Google Scholar] [CrossRef]
Figure 1. The grain composition curve of residual soils used in this study.
Applsci 10 00544 g001
Figure 2. The mechanism of the artificial ground freezing circumstance in tunnel constructions.
Applsci 10 00544 g002
Figure 3. The photo of the NMRI equipment and the sample after freezing and thawing treatments.
Applsci 10 00544 g003
Figure 4. The T2 spectrum curves of thawed soils under different freezing temperatures.
Applsci 10 00544 g004
Figure 5. The curve of relation between freezing temperature and peak area of thawed soils.
Applsci 10 00544 g005
Figure 6. The pore volume distributions of thawed soils under different freezing temperatures.
Applsci 10 00544 g006
Figure 7. The curves of proportion with different pore sizes of thawed soils under different freezing temperatures.
Applsci 10 00544 g007
Figure 8. The T2—weighted images of the thawed soils under different freezing temperatures: (a) −5 °C; (b) −10 °C; (c) −20 °C and (d) −30 °C.
Applsci 10 00544 g008
Figure 9. The frequency distribution curve of pore diameter.
Applsci 10 00544 g009
Table 1. Basic parameters of the tested residual soils.
Density (g/cm3)Moisture Content w (%)Porosity ϕ (%)Permeability Ks (μm2)Atterberg Limits (%)Mineral Composition (%)
WLWPIPKaoliniteIllite QuartzHematite
1.9826.030.33010.94258.6 28.9 29.753.6 5.2 38.5 2.5

