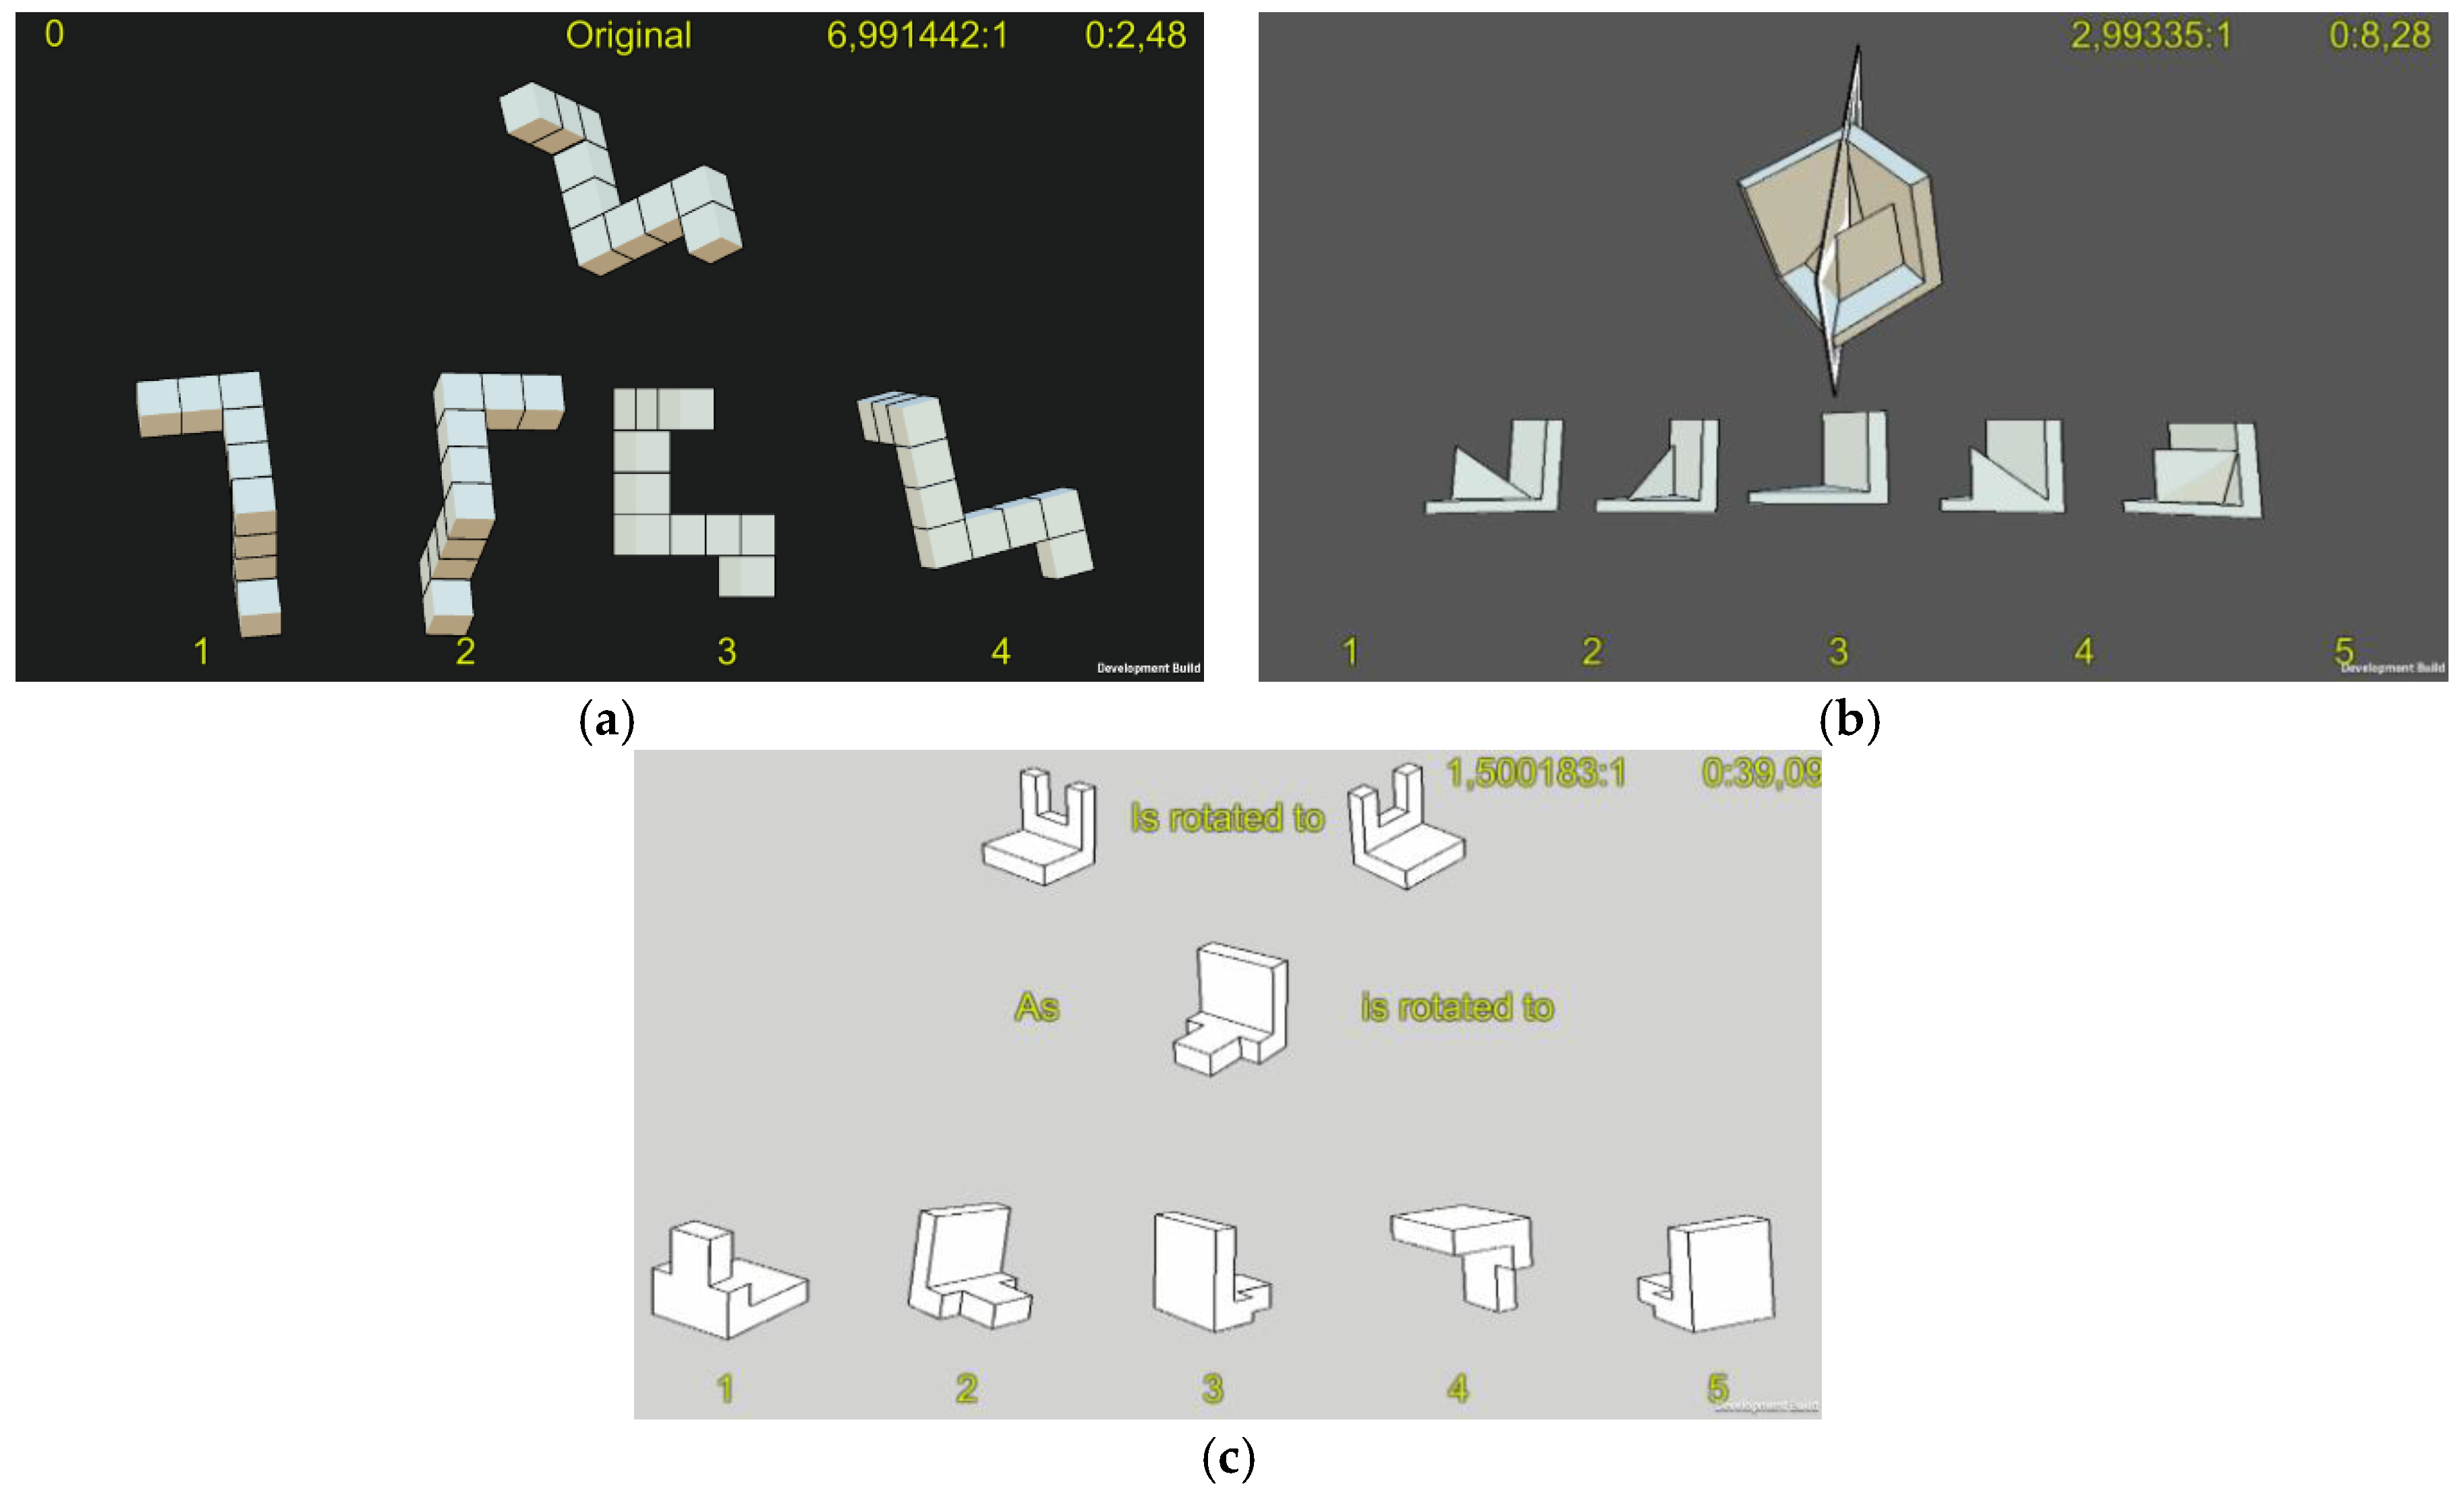
Figure 1.
(a) The MRT test with an orthographic camera, 7:1 contrast ratio, shadows turned on and no extra rotation; (b) The MCT test with a perspective camera, a 60° field of view, 3:1 contrast ratio, shadows turned on and no extra rotation; (c) The PSVT test with a perspective camera, a 45° field of view, 1.5:1 contrast ratio, shadows turned off and no extra rotation.
Table 1.
The results of logistic regression by investigating the effect of camera type.
Table 1.
The results of logistic regression by investigating the effect of camera type.
| Camera Type | Estimate | Standard Error | z Value | Pr (>|z|) |
|---|
| Intercept | 0.62452 | 0.01597 | 39.113 | <2 × 10⁻¹⁶ |
| Perspective | 0.15670 | 0.02239 | 6.999 | 2.57 × 10⁻¹² |
Table 2.
The results of the logistic regression analysis concerning the camera field of view as variable.
Table 2.
The results of the logistic regression analysis concerning the camera field of view as variable.
| Field of View | Estimate | Standard Error | z Value | Pr (>|z|) |
|---|
| Intercept | 0.62452 | 0.01597 | 39.113 | <2 × 10⁻¹⁶ |
| 45° | 0.14423 | 0.02423 | 5.952 | 2.64 × 10⁻⁹ |
| 60° | 0.14988 | 0.05595 | 2.679 | 0.00739 |
| 75° | 0.15676 | 0.05351 | 2.930 | 0.00339 |
| 90° | 0.27871 | 0.05830 | 4.781 | 1.75 × 10⁻⁶ |
Table 3.
Logistic regression analysis results of the camera field of view without the orthographic field of view.
Table 3.
Logistic regression analysis results of the camera field of view without the orthographic field of view.
| Field of View | Estimate | Standard Error | z Value | Pr (>|z|) |
|---|
| Intercept | 0.768746 | 0.018226 | 42.179 | <2 × 10⁻¹⁶ |
| 60° | 0.005655 | 0.056640 | 0.100 | 0.9205 |
| 75° | 0.012530 | 0.054223 | 0.231 | 0.8172 |
| 90° | 0.134485 | 0.058957 | 2.281 | 0.0225 |
Table 4.
Logistic regression analysis results of the camera rotation.
Table 4.
Logistic regression analysis results of the camera rotation.
| Camera Rotation | Estimate | Standard Error | z Value | Pr (>|z|) |
|---|
| Intercept | 0.620184 | 0.33839 | 18.327 | <2 × 10⁻¹⁶ |
| −45° | 0.176147 | 0.065570 | 2.686 | 0.00722 |
| −30° | −0.009832 | 0.047978 | −0.205 | 0.83763 |
| 0° | 0.147985 | 0.037690 | 3.926 | 8.62 × 10⁻⁵ |
| 15° | 0.015393 | 0.047061 | 0.327 | 0.74360 |
| 30° | 0.012121 | 0.046995 | 0.258 | 0.79646 |
| 45° | 0.145807 | 0.059162 | 2.465 | 0.01372 |
Table 5.
The results of the logistic regression analysis by investigating the camera rotation groups.
Table 5.
The results of the logistic regression analysis by investigating the camera rotation groups.
| Camera Rotation Groups | Estimate | Standard Error | z Value | Pr (>|z|) |
|---|
| Intercept | 0.62498 | 0.01664 | 37.57 | <2 × 10⁻¹⁶ |
| IMP_R | 0.14503 | 0.02248 | 6.45 | 1.12 × 10⁻¹⁰ |
Table 6.
Logistic regression analysis results of the contrast ratio.
Table 6.
Logistic regression analysis results of the contrast ratio.
| Contrast Ratio | Estimate | Standard Error | z Value | Pr (>|z|) |
|---|
| Intercept | 0.77059 | 0.01801 | 42.779 | <2 × 10⁻¹⁶ |
| 3:1 | −0.05359 | 0.04876 | −1.099 | 0.2717 |
| 7:1 | −0.11437 | 0.02493 | −4.588 | 4.47 × 10⁻⁶ |
| 14:1 | −0.12867 | 0.04912 | −2.620 | 0.0088 |
| 21:1 | −0.09264 | 0.04554 | −2.034 | 0.0419 |
Table 7.
Logistic regression analysis results of the contrast ratio groups.
Table 7.
Logistic regression analysis results of the contrast ratio groups.
| Contrast Ratio Groups | Estimate | Standard Error | z Value | Pr (>|z|) |
|---|
| Intercept | 0.65750 | 0.01504 | 43.712 | <2 × 10⁻¹⁶ |
| IMP_C | 0.10584 | 0.02250 | 4.703 | 2.56 × 10⁻⁶ |
Table 8.
Results of the logistic regression analysis of the shadows.
Table 8.
Results of the logistic regression analysis of the shadows.
| Shadows | Estimate | Standard Error | z Value | Pr (>|z|) |
|---|
| Intercept | 0.69046 | 0.01612 | 42.830 | <2 × 10⁻¹⁶ |
| Turned on | 0.02864 | 0.02239 | 1.271 | 0.204 |
Table 9.
Logistic regression results of the device used.
Table 9.
Logistic regression results of the device used.
| Device Used | Estimate | Standard Error | z Value | Pr (>|z|) |
|---|
| Intercept | 0.69002 | 0.01249 | 55.231 | <2 × 10⁻¹⁶ |
| Gear VR | 0.07595 | 0.02805 | 2.708 | 0.00677 |
Table 10.
Logistic regression analysis results by pairing the camera type and rotation.
Table 10.
Logistic regression analysis results by pairing the camera type and rotation.
| Camera Type and Rotation | Estimate | Standard Error | z Value | Pr (>|z|) |
|---|
| Intercept | 0.52784 | 0.02309 | 22.864 | <2 × 10⁻¹⁶ |
| Orthographic, INC_R | 0.18323 | 0.03199 | 5.728 | 1.02 × 10⁻⁸ |
| Perspective, NO_R | 0.19943 | 0.03334 | 5.982 | 2.21 × 10⁻⁹ |
| Perspective, INC_R | 0.29271 | 0.03102 | 9.437 | <2 × 10⁻¹⁶ |
Table 11.
Logistic regression results concerning the variables camera type and rotation by allowing interactions.
Table 11.
Logistic regression results concerning the variables camera type and rotation by allowing interactions.
| Camera Type and Rotation | Estimate | Standard Error | z Value | Pr (>|z|) |
|---|
| Intercept | 0.52784 | 0.02309 | 22.864 | <2 × 10⁻¹⁶ |
| Perspective | 0.19943 | 0.03334 | 5.982 | 2.21 × 10⁻⁹ |
| INC_R | 0.18323 | 0.03199 | 5.728 | 1.02 × 10⁻⁸ |
| Perspective and INC_R | −0.08995 | 0.04507 | −1.996 | 0.0459 |
Table 12.
Comparison of variables camera type and rotation by ANOVA.
Table 12.
Comparison of variables camera type and rotation by ANOVA.
| Resid. | Df Resid. | Dev | Df | Deviance | Pr (>Chi) |
|---|
| 1 | 2706 | 10,070 | - | - | - |
| 2 | 2705 | 10,066 | 1 | 3.9852 | 0.0459 |
Table 13.
Logistic regression analysis results of the effects by pairing the camera type and contrast ratio.
Table 13.
Logistic regression analysis results of the effects by pairing the camera type and contrast ratio.
| Camera Type and Contrast Ratio | Estimate | Standard Error | z Value | Pr (>|z|) |
|---|
| Intercept | 0.53467 | 0.02150 | 24.873 | <2 × 10⁻¹⁶ |
| Orthographic, INC_C | 0.19765 | 0.03215 | 6.148 | 7.85 × 10⁻¹⁰ |
| Perspective, NO_C | 0.23707 | 0.03014 | 7.867 | 3.64 × 10⁻¹⁵ |
| Perspective, INC_C | 0.25819 | 0.03181 | 8.117 | 4.80 × 10⁻¹⁶ |
Table 14.
Logistic regression analysis results of the additive model using the variables camera type and contrast ratio, allowing interaction.
Table 14.
Logistic regression analysis results of the additive model using the variables camera type and contrast ratio, allowing interaction.
| Camera Type and Contrast Ratio | Estimate | Standard Error | z Value | Pr (>|z|) |
|---|
| Intercept | 0.53467 | 0.02150 | 24.873 | <2 × 10⁻¹⁶ |
| Perspective | 0.23707 | 0.03014 | 7.867 | 3.64 × 10⁻¹⁵ |
| INC_C | 0.19765 | 0.03215 | 6.148 | 7.85 × 10⁻¹⁰ |
| Perspective and INC_C | −0.17653 | 0.04505 | −3.919 | 8.91 × 10⁻⁵ |
Table 15.
Comparison of the variables camera type and contrast ratio by ANOVA.
Table 15.
Comparison of the variables camera type and contrast ratio by ANOVA.
| Resid. | Df Resid. | Dev | Df | Deviance | Pr (>Chi) |
|---|
| 1 | 2706 | 10,085 | - | - | - |
| 2 | 2705 | 10,069 | 1 | 15.358 | 8.895 × 10⁻⁵ |
Table 16.
Logistic regression results analysis by pairing the camera type and the device used.
Table 16.
Logistic regression results analysis by pairing the camera type and the device used.
| Camera Type and Device used | Estimate | Standard Error | z Value | Pr (>|z|) |
|---|
| Intercept | 0.61105 | 0.01752 | 34.870 | <2 × 10⁻¹⁶ |
| Orthographic, Gear VR | 0.07859 | 0.04255 | 1.847 | 0.0647 |
| Perspective, desktop display | 0.15872 | 0.02501 | 6.347 | 2.20 × 10⁻¹⁰ |
| Perspective, Gear VR | 0.20891 | 0.03735 | 5.593 | 2.23 × 10⁻⁸ |
Table 17.
Logistic regression analysis results of the additive model of camera type and device used, allowing interactions.
Table 17.
Logistic regression analysis results of the additive model of camera type and device used, allowing interactions.
| Camera Type and Device Used | Estimate | Standard Error | z Value | Pr (>|z|) |
|---|
| Intercept | 0.61105 | 0.01752 | 34.870 | <2 × 10⁻¹⁶ |
| Perspective | 0.15872 | 0.02501 | 6.347 | 2.2 × 10⁻¹⁰ |
| Gear VR | 0.07859 | 0.04255 | 1.847 | 0.0647 |
| Perspective and Gear VR | −0.02841 | 0.05672 | −0.501 | 0.6164 |
Table 18.
Comparison of the variables camera type and device used by ANOVA.
Table 18.
Comparison of the variables camera type and device used by ANOVA.
| Resid. | Df Resid. | Dev | Df | Deviance | Pr (>Chi) |
|---|
| 1 | 2706 | 10,103 | - | - | - |
| 2 | 2705 | 10,102 | 1 | 0.25097 | 0.6164 |
Table 19.
Logistic regression analysis results concerning the camera rotation and contrast ratio.
Table 19.
Logistic regression analysis results concerning the camera rotation and contrast ratio.
| Camera Rotation and Contrast Ratio | Estimate | Standard Error | z Value | Pr (>|z|) |
|---|
| Intercept | 0.60941 | 0.01821 | 33.469 | <2 × 10⁻¹⁶ |
| NO_R, INC_C | 0.09323 | 0.04483 | 2.080 | 0.0376 |
| INC_R, NO_C | 0.14922 | 0.03235 | 4.613 | 3.97 × 10⁻⁶ |
| INC_R, INC_C | 0.16594 | 0.02584 | 6.421 | 1.36 × 10⁻¹⁰ |
Table 20.
Logistic regression analysis results of the additive model using the variables camera rotation and contrast ratio, allowing interactions.
Table 20.
Logistic regression analysis results of the additive model using the variables camera rotation and contrast ratio, allowing interactions.
| Camera Rotation and Contrast Ratio | Estimate | Standard Error | z Value | Pr (>|z|) |
|---|
| Intercept | 0.60941 | 0.01821 | 33.469 | <2 × 10⁻¹⁶ |
| INC_R | 0.14922 | 0.03235 | 4.613 | 3.97 × 10⁻⁶ |
| INC_C | 0.09323 | 0.04483 | 2.080 | 0.0376 |
| INC_R and INC_C | −0.07651 | 0.05533 | −1.383 | 0.1667 |
Table 21.
Comparison of the variables camera rotation and contrast ratio by ANOVA.
Table 21.
Comparison of the variables camera rotation and contrast ratio by ANOVA.
| Resid. | Df Resid. | Dev | Df | Deviance | Pr (>Chi) |
|---|
| 1 | 2706 | 10,112 | - | - | - |
| 2 | 2705 | 10,111 | 1 | 1.9179 | 0.1661 |
Table 22.
Logistic regression analysis results, investigating the pair of camera rotation and the device used.
Table 22.
Logistic regression analysis results, investigating the pair of camera rotation and the device used.
| Camera Rotation and Device Used | Estimate | Standard Error | z Value | Pr (>|z|) |
|---|
| Intercept | 0.63039 | 0.01778 | 35.465 | <2 × 10⁻¹⁶ |
| NO_R, Gear VR | −0.04388 | 0.05049 | −0.869 | 0.385 |
| INC_R, Desktop display | 0.11682 | 0.02500 | 4.673 | 2.97 × 10⁻⁶ |
| INC_R, Gear VR | 0.20364 | 0.03461 | 5.883 | 4.02 × 10⁻⁹ |
Table 23.
Logistic regression analysis results of the interactions between camera rotation and the device used.
Table 23.
Logistic regression analysis results of the interactions between camera rotation and the device used.
| Camera Rotation and Device Used | Estimate | Standard Error | z Value | Pr (>|z|) |
|---|
| Intercept | 0.63039 | 0.01778 | 35.465 | <2 × 10⁻¹⁶ |
| INC_R | 0.11682 | 0.02500 | 4.673 | 2.97 × 10⁻⁶ |
| Gear VR | −0.04388 | 0.05049 | −0.869 | 0.3847 |
| INC_R and Gear VR | 0.13070 | 0.06115 | 2.137 | 0.0326 |
Table 24.
Comparison of the variables camera rotation and device used by ANOVA.
Table 24.
Comparison of the variables camera rotation and device used by ANOVA.
| Resid. | Df Resid. | Dev | Df | Deviance | Pr (>Chi) |
|---|
| 1 | 2706 | 10,113 | - | - | - |
| 2 | 2705 | 10,108 | 1 | 4.5511 | 0.0329 |
Table 25.
Logistic regression analysis results of the additive model with variable contrast ratio and device used, allowing interaction.
Table 25.
Logistic regression analysis results of the additive model with variable contrast ratio and device used, allowing interaction.
| Contrast Ratio and Device Used | Estimate | Standard Error | z Value | Pr (>|z|) |
|---|
| Intercept | 0.65115 | 0.01679 | 38.786 | <2 × 10⁻¹⁶ |
| NO_C, Gear VR | 0.03204 | 0.03780 | 0.848 | 0.396699 |
| INC_C, Desktop display | 0.08647 | 0.02514 | 3.440 | 0.000583 |
| INC_C, Gear VR | 0.21296 | 0.04108 | 5.184 | 2.18 × 10⁻⁷ |
Table 26.
Logistic regression analysis results of the additive model with variables contrast ratio and device used allowing interactions.
Table 26.
Logistic regression analysis results of the additive model with variables contrast ratio and device used allowing interactions.
| Contrast Ratio and Device Used | Estimate | Standard Error | z Value | Pr (>|z|) |
|---|
| Intercept | 0.65115 | 0.01679 | 38.786 | <2 × 10⁻¹⁶ |
| INC_C | 0.08647 | 0.02514 | 3.440 | 0.000583 |
| Gear VR | 0.03204 | 0.03780 | 0.848 | 0.396699 |
| INC_C and Gear VR | 0.09445 | 0.05644 | 1.674 | 0.094199 |
Table 27.
Comparison of the variables contrast ratio and device used by ANOVA.
Table 27.
Comparison of the variables contrast ratio and device used by ANOVA.
| Resid. | Df Resid. | Dev | Df | Deviance | Pr (>Chi) |
|---|
| 1 | 2706 | 10,128 | - | - | - |
| 2 | 2705 | 10,125 | 1 | 2.804 | 0.09403 |
Table 28.
Logistic regression analysis results investigating the effects of the camera type, rotation, and contrast ratio.
Table 28.
Logistic regression analysis results investigating the effects of the camera type, rotation, and contrast ratio.
| Camera Type, Rotation and Contrast Ratio | Estimate | Standard Error | z Value | Pr (>|z|) |
|---|
| Intercept | 0.51019 | 0.02512 | 20.309 | <2 × 10⁻¹⁶ |
| Orthographic, NO_R, INC_C | 0.11228 | 0.06379 | 1.760 | 0.0784 |
| Orthographic, INC_R, NO_C | 0.09065 | 0.04857 | 1.866 | 0.0620 |
| Orthographic, INC_R, INC_C | 0.24358 | 0.03629 | 6.712 | 1.92 × 10⁻¹¹ |
| Perspective, NO_R, NO_C | 0.20626 | 0.03651 | 5.649 | 1.61 × 10⁻⁸ |
| Perspective, NO_R, INC_C | 0.26714 | 0.06260 | 4.268 | 1.98 × 10⁻⁵ |
| Perspective, INC_R, NO_C | 0.35544 | 0.04310 | 8.246 | <2 × 10⁻¹⁶ |
| Perspective, INC_R, INC_C | 0.28576 | 0.03593 | 7.952 | 1.83 × 10⁻¹⁵ |
Table 29.
Comparison of model II and III by ANOVA.
Table 29.
Comparison of model II and III by ANOVA.
| Resid. | Df Resid. | Dev | Df | Deviance | Pr (>Chi) |
|---|
| 1 | 2703 | 10,053 | - | - | - |
| 2 | 2701 | 10,050 | 2 | 3.1703 | 0.2049 |
Table 30.
Logistic regression analysis results of the additive model using variables camera type, rotation and the contrast ratio and allowing interactions of two variables.
Table 30.
Logistic regression analysis results of the additive model using variables camera type, rotation and the contrast ratio and allowing interactions of two variables.
| Camera Type, Rotation and Contrast Ratio | Estimate | Standard Error | z Value | Pr (>|z|) |
|---|
| Intercept | 0.5062478 | 0.0238618 | 21.216 | <2 × 10⁻¹⁶ |
| Perspective | 0.2259740 | 0.0344853 | 6.553 | 5.65 × 10⁻¹¹ |
| INC_R | 0.1054279 | 0.0388003 | 2.717 | 0.006584 |
| INC_C | 0.1378076 | 0.0389859 | 3.535 | 0.000408 |
| Perspective and INC_R | 0.0006636 | 0.0528045 | 0.013 | 0.989973 |
| Perspective and INC_C | −0.1653400 | 0.0528044 | −3.131 | 0.001741 |
Table 31.
Logistic regression analysis results investigating the variables camera type, rotation and device used.
Table 31.
Logistic regression analysis results investigating the variables camera type, rotation and device used.
| Camera Type, Rotation and Device Used | Estimate | Standard Error | z Value | Pr (>|z|) |
|---|
| Intercept | 0.53653 | 0.02449 | 21.907 | <2 × 10⁻¹⁶ |
| Orthographic, NO_R, Gear VR | −0.07870 | 0.07340 | −1.072 | 0.2836 |
| Orthographic INC_R, desktop display | 0.15114 | 0.03508 | 4.308 | 1.65 × 10⁻⁵ |
| Orthographic, INC_R, Gear VR | 0.25496 | 0.05299 | 4.811 | 1.50 × 10⁻⁶ |
| Perspective, NO_R, desktop display | 0.19570 | 0.03564 | 5.490 | 4.01 × 10⁻⁸ |
| Perspective, NO_R, Gear VR | 0.15942 | 0.06935 | 2.299 | 0.0215 |
| Perspective, INC_R, desktop display | 0.26674 | 0.03473 | 7.680 | 1.59 × 10⁻¹⁴ |
| Perspective, INC_R, Gear VR | 0.32541 | 0.04549 | 7.154 | 8.44 × 10⁻¹³ |
Table 32.
Logistic regression analysis results with the variables camera type, rotation, and device used, allowing interactions of pairs.
Table 32.
Logistic regression analysis results with the variables camera type, rotation, and device used, allowing interactions of pairs.
| Camera Type, Rotation and Device Used | Estimate | Standard Error | z Value | Pr (>|z|) |
|---|
| Intercept | 0.53406 | 0.02376 | 22.479 | <2 × 10⁻¹⁶ |
| Perspective | 0.20095 | 0.03337 | 6.022 | 1.72 × 10⁻⁹ |
| INC_R | 0.15942 | 0.03339 | 4.774 | 1.80 × 10⁻⁶ |
| Gear VR | −0.05639 | 0.05059 | −1.115 | 0.2649 |
| Perspective and INC_R | −0.09672 | 0.04515 | −2.142 | 0.0322 |
| Perspective and Gear VR | 0.13418 | 0.06130 | 2.189 | 0.0286 |
Table 33.
Logistic regression analysis results of the effects of the camera type, contrast ratio, and device used.
Table 33.
Logistic regression analysis results of the effects of the camera type, contrast ratio, and device used.
| Camera Type, Contrast Ratio and Device Used | Estimate | Standard Error | z Value | Pr (>|z|) |
|---|
| Intercept | 0.53024 | 0.02342 | 22.644 | <2 × 10⁻¹⁶ |
| Orthographic, NO_C, Gear VR | 0.02804 | 0.03534 | 0.475 | 0.635 |
| Orthographic, INC_C, desktop display | 0.18131 | 0.03534 | 5.130 | 2.90 × 10⁻⁷ |
| Orthographic, INC_C, Gear VR | 0.29212 | 0.06042 | 4.835 | 1.33 × 10⁻⁷ |
| Perspective, NO_C, desktop display | 0.24482 | 0.03365 | 7.275 | 3.45 × 10⁻¹³ |
| Perspective, NO_C, Gear VR | 0.23070 | 0.04936 | 4.674 | 2.96 × 10⁻⁶ |
| Perspective, INC_C, desktop display | 0.23317 | 0.03533 | 6.600 | 4.11 × 10⁻¹¹ |
| Perspective, INC_C, Gear VR | 0.36797 | 0.05587 | 6.587 | 4.50 × 10⁻¹¹ |
Table 34.
Logistic regression results of the additive model with the variables camera type, contrast ratio, and the device used, allowing interactions of pairs.
Table 34.
Logistic regression results of the additive model with the variables camera type, contrast ratio, and the device used, allowing interactions of pairs.
| Camera Type, Contrast Ratio and Device Used | Estimate | Standard Error | z Value | Pr (>|z|) |
|---|
| Intercept | 0.52553 | 0.02194 | 23.951 | <2 × 10⁻¹⁶ |
| Perspective | 0.23264 | 0.03021 | 7.700 | 1.36 × 10⁻¹⁴ |
| INC_C | 0.19581 | 0.03216 | 6.088 | 1.14 × 10⁻⁹ |
| Gear VR | 0.05810 | 0.02816 | 2.063 | 0.039088 |
| Perspective and INC_C | −0.17397 | 0.04507 | −3.860 | 0.000113 |
Table 35.
Logistic regression analysis results of effects of the variables camera rotation, contrast ratio, and device used.
Table 35.
Logistic regression analysis results of effects of the variables camera rotation, contrast ratio, and device used.
| Camera Rotation, Contrast Ratio, Device Used | Estimate | Standard Error | z Value | Pr (>|z|) |
|---|
| Intercept | 0.60785 | 0.01946 | 31.238 | <2 × 10⁻¹⁶ |
| NO_R, NO_C, Gear VR | 0.01252 | 0.05517 | 0.227 | 0.82046 |
| NO_R, INC_C, desktop display | 0.13403 | 0.04789 | 2.799 | 0.00513 |
| NO_R, INC_C, Gear VR | −0.20239 | 0.11945 | −1.694 | 0.09020 |
| INC_R, NO_C, desktop display | 0.16645 | 0.03855 | 4.317 | 1.58 × 10⁻⁵ |
| INC_R, NO_C, Gear VR | 0.12203 | 0.04894 | 2.494 | 0.01265 |
| INC_R, INC_C, desktop display | 0.12882 | 0.02841 | 4.534 | 5.78 × 10⁻⁶ |
| INC_R, INC_C, Gear VR | 0.30462 | 0.04418 | 6.895 | 5.37 × 10⁻¹² |
Table 36.
Results of the logistic regression analysis of the model with the variables camera rotation, contrast ratio and the device used, allowing interactions all variables.
Table 36.
Results of the logistic regression analysis of the model with the variables camera rotation, contrast ratio and the device used, allowing interactions all variables.
| Camera Rotation, Contrast Ratio, Device Used | Estimate | Standard Error | z Value | Pr (>|z|) |
|---|
| Intercept | 0.60785 | 0.01946 | 31.238 | <2 × 10⁻¹⁶ |
| INC_R | 0.16645 | 0.03855 | 4.317 | 1.58 × 10⁻⁵ |
| INC_C | 0.13403 | 0.04789 | 2.799 | 0.005131 |
| Gear VR | 0.01252 | 0.05517 | 0.227 | 0.820459 |
| INC_R and Gear VR | −0.05694 | 0.07853 | −0.725 | 0.468439 |
| INC_R and INC_C | −0.17166 | 0.06188 | −2.774 | 0.005539 |
| INC_C and Gear VR | −0.34893 | 0.13729 | −2.542 | 0.011033 |
| INC_R and INC_C and Gear VR | 0.56915 | 0.15483 | 3.676 | 0.000237 |
Table 37.
Logistic regression analysis results investigating the effects of the camera type, rotation, contrast ratio, and device used.
Table 37.
Logistic regression analysis results investigating the effects of the camera type, rotation, contrast ratio, and device used.
| Camera Type, Rotation, Contrast Ratio, Device Used | Estimate | Standard Error | z Value | Pr (>|z|) |
|---|
| Intercept | 0.51385 | 0.02670 | 19.246 | <2 × 10⁻¹⁶ |
| Orthographic, NO_R, NO_C, Gear VR | −0.03202 | 0.07884 | −0.406 | 0.6847 |
| Orthographic, NO_R, INC_C, desktop display | 0.14107 | 0.06717 | 2.100 | 0.0357 |
| Orthographic, NO_R, INC_C, Gear VR | −0.22087 | 0.19458 | −1.135 | 0.2563 |
| Orthographic, INC_R, NO_C, desktop display | 0.07053 | 0.05559 | 1.269 | 0.2045 |
| Orthographic, INC_R, NO_C, Gear VR | 0.13040 | 0.08391 | 1.554 | 0.1202 |
| Orthographic, INC_R, INC_C, desktop display | 0.21036 | 0.03966 | 5.305 | 1.13 × 10⁻⁷ |
| Orthographic, INC_R, INC_C, Gear VR | 0.35379 | 0.06417 | 5.513 | 3.52 × 10⁻⁸ |
| Perspective, NO_R, NO_C, desktop display | 0.19790 | 0.03904 | 5.069 | 4.00 × 10⁻⁷ |
| Perspective, NO_R, NO_C, Gear VR | 0.23262 | 0.07695 | 3.023 | 0.0025 |
| Perspective, NO_R, INC_C, desktop display | 0.31400 | 0.06772 | 4.637 | 3.54 × 10⁻⁶ |
| Perspective, NO_R, INC_C, Gear VR | −0.04214 | 0.15152 | −0.278 | 0.7809 |
| Perspective, INC_R, NO_C, desktop display | 0.41798 | 0.05303 | 7.882 | 3.22 × 10⁻¹⁵ |
| Perspective, INC_R, NO_C, Gear VR | 0.25528 | 0.06062 | 4.211 | 2.54 × 10⁻⁵ |
| Perspective, INC_R, INC_C, desktop display | 0.23513 | 0.03959 | 5.940 | 2.86 × 10⁻⁹ |
| Perspective, INC_R, INC_C, Gear VR | 0.43645 | 0.06032 | 7.236 | 4.62 × 10⁻¹³ |
Table 38.
Logistic regression analysis results of the four variables models allowing interactions.
Table 38.
Logistic regression analysis results of the four variables models allowing interactions.
| Camera Type, Rotation, Contrast Ratio, Device Used | Estimate | Standard Error | z Value | Pr (>|z|) |
|---|
| Intercept | 0.4997428 | 0.0252612 | 19.783 | <2 × 10⁻¹⁶ |
| Perspective | 0.2281487 | 0.0345391 | 6.606 | 3.96 × 10⁻¹¹ |
| INC_R | 0.1501627 | 0.0475111 | 3.161 | 0.001575 |
| INC_C | 0.2106181 | 0.0547860 | 3.844 | 0.000121 |
| Gear VR | 0.0008861 | 0.0552796 | 0.016 | 0.987212 |
| Perspective and INC_R | −0.0028185 | 0.0532272 | −0.053 | 0.957770 |
| Perspective and INC_C | −0.1660764 | 0.0532649 | −3.118 | 0.001821 |
| INC_R and Gear VR | −0.0746026 | 0.0788879 | −0.946 | 0.344313 |
| INC_R and INC_C | −0.1535519 | 0.0619693 | −2.478 | 0.013217 |
| INC_C and Gear VR | −0.3450059 | 0.1374857 | −2.509 | 0.012094 |
| INC_R and INC_C and Gear VR | 0.5920143 | 0.1374857 | 3.821 | 0.000133 |


