Featured Application
Authors are encouraged to provide a concise description of the specific application or a potential application of the work. This section is not mandatory.
Abstract
The present study proposes an economic indicator to support the evaluation of aircraft End of Life (EoL) strategies in view of the increasing demand with regards to aircraft decommissioning. This indicator can be used to evaluate the economic performance and to facilitate the trade-off studies among different strategies. First, Disposal and Recycle (D&R) scenarios related to stakeholders are investigated to identify the core concepts for the economic evaluation. Next, we extracted the aircraft D&R process from various real-life practices. In order to obtain the economic measure for the engineering process, a method of estimating the D&R cost and values are developed by integrating product, process and cost properties. This analysis is demonstrated on an averaged data set and two EoL aircraft cases. In addition, sensitivity analysis is performed to evaluate the impact of the D&R cost, residual value, and salvage value. Results show that the disassembly and dismantling of an aircraft engine possesses relatively more economic gains than that for the aircraft. The main factors influencing the proposed D&R economic indicator are the salvage value and D&R cost for economically efficient D&R cases. In addition, delaying the disposal and recycle process for EoL aircraft can lead to economically unfavorable solutions. The economic indicator combined with the evaluation methods is widely applicable for evaluations of engineering products EoL solutions, and implies a significant contribution of this research to decision making for such complex systems in terms sustainable policy.
1. Introduction
Within the current commercial aviation industry, more than 8500 aircraft have been retired, and it is expected that around 6600 aircraft will reach their End of Life (EoL) in the next decade [1,2]. This has led to the required development of economic efficient aircraft Disposal and Recycle (D&R) strategies. Figure 1 illustrates a disposal and recycle sites for EoL aircraft (a) disassembly and (b) dismantling operations.
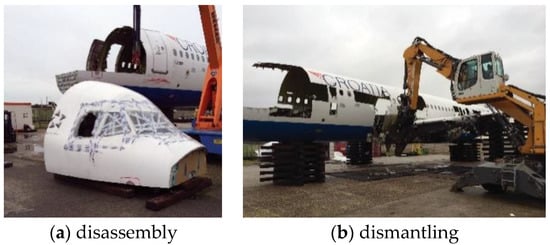
Figure 1.
Aircraft disposal and recycle (picture source: courtesy of Aircraft End-of-Life Solutions (AELS) Company).
Significant savings can be identified by comparing the labor, material, and energy consumption generated from the D&R processes and that for new productions, i.e., where the D&R processes recycle old components and offer recovered materials, while manufacturing processes produce new components and is concerned with virgin materials. It is found that the cost of manufacturing virgin carbon fiber is around 15–30 USD per pound in 2011, while only 8–12 USD per pound is needed via recycling [3]. Recycling aluminum material from scrap can save up to 95% energy, and the D&R process of producing recovered aluminum metal can reduce 39% energy consumption [4]. Airbus’ PAMELA (Process for Advanced Management of End of Life Aircraft) project, in 2005, has demonstrated that around 85% weight recovery can be achieved by recycling an A300 aircraft. Rolls-Royce can recycle as much as 75% aero engine metal by aerospace smelters [5,6]. This is the main reason for the D&R process to remain competitive in the aviation market, and the D&R process is also related to the original design via the material choice and component recyclability and recoverability [7]. The aircraft EoL solution is associated with the aircraft status based on its operating and maintenance condition before parking and storing. The D&R process also involves engineering processes, such as dismantling, sorting, and component management. Based on the aforementioned properties, it clearly indicates a transdisciplinary character [8]. A deep understanding of the aircraft D&R process could improve the product EoL solutions, and at the same time will, in practice, strengthen its life cycle performance. Studies associated with the disassembly sequence and its efficiency have proven to support the product development process [9,10]. However, aircraft economics, company economics, and global economics all often restrict the aircraft EoL solution [7]. Due to the small industry size for the aircraft dismantling and recycling, comparatively little study has been carried out to analyze the D&R process and its economic performance. Along with the growth of the industry, it becomes necessary to perform those analyses quantitatively.
Literature shows that aircraft disposal cost is around 10% of the purchase price or 1% of the total Life Cycle Cost (LCC) [11,12], although those rough estimates could not provide a guideline on determining whether a D&R strategy is economic and efficient. The D&R cost and value analysis for commercial aircraft are potentially an effective means for evaluating this process related fundamentally to sustainability. It is very necessary to provide a standard in order to evaluate the economic performance of an EoL solution; therefore, there is a need for an economic indicator for this purpose. Combining the economic indicator with the environmental and societal measures of the aircraft D&R process would strengthen the process of aircraft sustainability evaluation and improve the aircraft life cycle performance.
This paper is constructed as follows: First, literature is reviewed thoroughly for both macro and micro levels of aircraft disposal and recycle analysis. Based on historical aircraft EoL projects, the D&R scenarios and its process model are constructed. Detailed methodology for cost and value evaluations is developed, followed by the D&R economic indicator, which is the first time a proposal for a standard for economic evaluation of an aircraft EoL solution is addressed. Next, analysis is implemented for an averaged real data set as well as for two aircraft D&R case studies data set, which are then verified and validated by Net Present Value (NPV) estimation and sensitivity analysis. Finally, the paper is concluded by highlighting the main contributions and results of this research.
2. Literature Review of Aircraft Disposal and Recycle Analysis
Recent research on industrial EoL solutions include that regarding rolling stock [13], automobiles [14], ships [15], and aircraft vehicles [8,16,17]. The research focus ranges from the macro perspective of EoL strategies [8] to the micro perspective of the disassembly and dismantling process [18], as well as material management methods, i.e., the material recycling [19,20,21], and component management [17,22]. In addition, the economic and environmental impacts of the D&R process are also studied [4,23,24]. Another stream of research is relevant to aircraft retirement decision-making [25,26,27]. It mainly focuses on the temporal approaches to aircraft decommissioning in order to decide the time at which to retire an aircraft or a fleet with specific strategies. It is noteworthy that the retirement decision is very different from the EoL solution, where the latter considers the time period after the retirement decision has been made. The EoL solution is the focus of the current research and is associated with economic and sustainability of aircraft Life Cycle Analysis (LCA).
Aircraft EoL strategies focus on general policies in terms of the priorities of the preferred approach by stakeholders, e.g., the selection of resale or disassembly for an aircraft, which also considers the logistics and supply chain allocations. The goal is to select a D&R strategy for the optimal product usage with the least cost and highest benefit. The model considers stakeholders’ benefit, the cost benefit trade-offs among different EoL solutions, the reuse/remanufacturing possibility for the aircraft and its components, and the reverse logistics of the product and material retransformation and redistribution. Most research assumes a fixed task sequence of disassembly & dismantling process. Moreover, methods are provided to generate appropriate EoL solutions. The following techniques are often used for strategy selection: alternative strategy modeling [16,28], network flow simulation [29], cost-benefit optimization [15], complex system modeling [28], reverse logistics analysis [17,30], and sustainability considering economic, social, and environmental balances [16,28,31].
The detail-level disassembly & dismantling research looks into the characteristic elements of the process steps, viz., the disassembly method, the process steps sequence, the cost of process handling, and material flows. It aims to achieve an optimal process sequence for least cost and maximum revenue. It can be modeled by mathematical programming, heuristics, and artificial intelligence techniques. Methods, such as fuzzy logic [18], mixed-integer linear programming [28], process planning optimization [32], dynamic programming [33], and simulated annealing [34], are utilized.
Component management refers to the reuse of components for other aircraft or for other purposes. It also involves the extension of the component lifespan as well as the control of spare parts inventory at EoL stage. The objective is to maximize the reusability and/or the values for the EoL aircraft components. For example, Coro et al. [35,36] proposed a method of adapting inspection schedule of aero engine welded structures based on defect propagation analysis, and considered the replacement of the welded components by additive manufacturing spare parts in view of improving component life cycle performance. Hur et al. [22] investigated inventory control for aircraft spare parts based on continuous-time Markov chain model at the aircraft EoL phase. A component-oriented approach within a computer-aided system was implemented to integrate assembly and disassembly properties to support component management during the aircraft disposal process [17].
Research on material recycling investigates possible solutions for separating the various material usage in the product and the reuse of the materials in new products [37,38]. It aims to reduce cost consumption, while considering economic and ecologic impact. It is generally influenced by material properties for material separation and reuse. Similar to research on disassembly & dismantling, it is solved by process modeling techniques [39,40].
Both macro and micro perspectives of the disposal and recycle analysis require trade-offs between cost and economic benefit. Therefore, it is necessary to define an appropriate economic measure for the whole process. However, literature rarely provides detail analysis about economic indicators, if at all, which leads to the main contribution presented in this work.
3. Scenarios and Process Detail
Economic performance of a given EoL solution is tightly associated with the engineering practices and the D&R process executions. In order to extract the cost and value properties, stakeholder relevant scenarios and process details are summarized according to various D&R cases.
3.1. Stakeholder Relevant Scenarios
Many stakeholders are involved in an aircraft D&R process. Among others, the airline and the End of Life Solution (EoLS) company are the two main players. In general, three D&R scenarios can be categorized depending on the stakeholders’ involvement (see Table 1). Basically an airline and an EoLS company could own the aircraft and perform the D&R operations in the three ways presented. By reviewing the cost and value distribution of the three scenarios, we identify that the D&R cost, residual value, and salvage value are key to the economic analysis.

Table 1.
Stakeholders and relevant scenarios.
3.2. Aircraft Disposal and Recycle Process
The D&R process is generalized in Figure 2. It consists of three key elements: the EoL aircraft module (in orange), the D&R process step module (dashed blue frame), and the EoL products module (dashed green frame). The EoL aircraft module refers to the grounded aircraft for which the retirement decision has been made. Within the D&R process step module, the main D&R process steps are illustrated using square blocks. Each process step contains a group of sub-process steps (listed in the bracket within the process square block). The EoL products module indicates the end-products generated from the corresponding process flows. A complete D&R process starts with the EoL aircraft and ends up with the EoL products. The sequence of the process block is indicated by the workflow arrows. The execution of a specific process step is decided at each diamond-shaped decision point. Component management and material management branches can be carried out concurrently for different components or parts of an aircraft. Further process steps are performed sequentially depending on the priority of the various disposal and recycle techniques. The D&R process for a specific project is established based on the status of the aircraft and the customer requirements relating specifically to reuse and recycle [7].
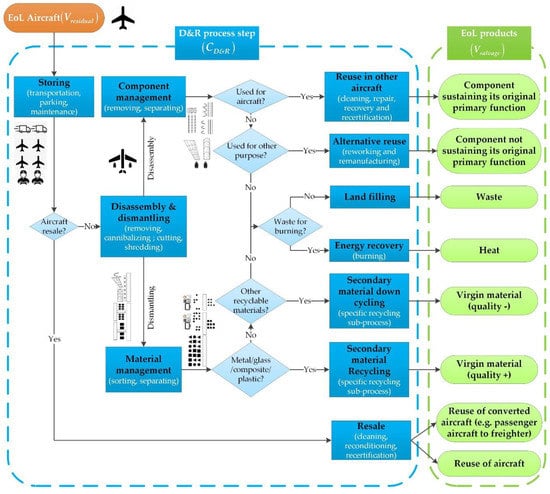
Figure 2.
Aircraft disposal and recycle process model.
The EoL aircraft is firstly stored at dry plain boneyard such as the Southern California Logistics Airport in the United States and the Teruel Airport in Europe, which can facilitate long term parking, maintenance and recycling capabilities with large storage capacity for commercial aircraft. For this step, the aircraft is often transported or parked with or without performing maintenance activities. Whether it is necessary to perform maintenances is mainly decided by the aircraft current condition and its future usage. After deciding not to park the decommissioned aircraft, it can either be cleaned, reconditioned, converted, and recertified for resale and, subsequently, it is reused completely as passenger or freighter aircraft, or cannibalized via a series of process steps, the so-called disassembly & dismantling process.
Disassembly includes components removal and cannibalization for component management, while dismantling refers to material cutting and shredding for further recycling. Several strategies, such as systematic disassembly, shredding, smart shredding, gross cutting, semi-gross cutting, detail cutting, smart disassembly, and disassembly combined with cutting, can be utilized to accomplish the disassembly and dismantling [16]. The systematic disassembly will result in all the components and attachments being separated, removed, and sorted by material compositions. While shredding pertains to cut the aircraft being dissected into small pieces with mixed materials. Various techniques of shredding, such as magnetic, eddy-current, and sink-float separations, are employed depending on different material types [41]. Other strategies are intermediate solutions balancing costs and benefits of the operations.
Component management and material management are performed respectively, and could be conducted concurrently for different parts of an aircraft. In one way, component management removes valuable components, which can then be sold and reused on other aircraft or for alternative reuse. Note that, for a component to be reused on another aircraft of the same model and sustaining of its original function, the component needs to be cleaned, repaired, and recertified to satisfy the regulations of an operational aircraft. If it is reused alternatively without sustaining its original primary function (e.g., for product exhibition), it needs to be reworked and remanufactured. On the other hand, material sorting and separating, referred as material management, are conducted after removing and scrapping hazardous materials. The sorted and separated materials are used for secondary recycling based on material properties and available recycling techniques. The secondary recycling is distinguished from the primary recycling for materials that are scrapped during the aircraft production processes [7]. In general, metal, glass, composite, and plastic materials are separated. Based on their sizes and recycling techniques, different materials are supplied for respective recycling processes. For example, Al metal parts are firstly grouped by aluminum main families (Al 2xxx and 7xxx) with similar sizes. Then, those clean and sorted parts or shredded chips can be melted to be reformed to foundry parts. The composite parts, such as Carbon Fiber Reinforced Plastic (CFRP) material, can be decomposed to extract the pure carbon fibers. Those carbon fibers can then be treated as recovering materials for new components. The components are usually non-structural parts or parts for automotive components or for electronic instruments. Two types of secondary recycling processes are categorized in terms of the quality of the recovered materials. Some are recycled without losing the material quality, while others are recycled due to containing paint/glue or recycled by the immature recycling techniques, which is also denoted as down-cycling.
If the material cannot be recycled but can be burnt as wastes, the incineration process will then convert the burning energy to heat or electricity, so-called energy recovery. In an ecological hierarchy, the last choice would be land filling when the part/component material cannot be reused, recycled, nor used for energy recovery.
Taking a Boeing 737 D&R case as an example, the following process flow can be constructed: The aircraft is purchased and transported to the disposal site; then, the systems, such as air conditioning, auto flight and electrical power systems, are removed, and the engine and landing gear are also removed. Next, some systems and engine parts are repaired, recertified, and reused for the other aircraft; the landing gear is scrapped; the airframe is shredded and the materials are sorted to be further recycled as recovered material. For such a Boeing 747 case, the aircraft is firstly purchased and transported to the disposal site; then, maintenance is carried out to keep its operational condition. It is followed by a freighter conversion to be reused as a cargo aircraft.
Based on the generalized disposal and recycle process, a specific process plan can be generated using various process planning techniques. The planning can be separated in three levels, depending on distinct levels of planning detail: the strategic level of reverse logistics, the tactical level of disassembly sequence planning and scheduling, and the operational level of detailed dismantling scheduling [17]. The strategic level planning utilizes techniques, such as network design and system dynamics [8]. This corresponds to the macro perspective of EoLS, and is sometimes focused by Original Equipment Manufacturers (OEMs) to support the improvement of the product design and manufacturing process. The tactical level and operational level planning adopt approaches, such as those illustrated by the disassembly option diagrams, product-oriented automatic analysis system, selective disassembly, partial disassembly, and artificial intelligence [17], pertaining to the micro perspective of EoLS.
Value and cost flow resides in the whole disposal and recycle process. The corresponding values and costs are indicated in brackets within the ‘EoL aircraft’ block, the ‘process step module’ block, and the ‘EoL products module’ block in Figure 2. The EoL aircraft contains original residual value, and all process steps introduce corresponding D&R cost items. The end products contain the values salvaged from the D&R processes, from which the valorization value is introduced.
4. Cost and Value Evaluation
The D&R costs and values are identified according to the scenarios and process steps, while methods of the cost estimation and value evaluation are developed in the following sections.
4.1. Disposal and Recycle Cost Estimation
The cost estimation herein is based on the integration of the product, D&R process, and cost properties [42]. Complying with customer requirements for the EoL aircraft with considering the component function and materials, the EoL strategy and the detailed D&R process can be planned. The D&R process plan is generated based on the D&R process model and the engineering rules embedded in the model. For example, if it is an engine part to be reused in another aircraft, the engine should go through ‘component management’ and ‘reuse in other aircraft’ steps, which contain detailed sub-steps, including remove, clean, repair, recovery, and recertification. These process steps are set up sequentially to represent the D&R process for this specific case. The total cost is then formulated by summing up the cost items for all process steps (see Equation (1)). The generalized D&R cost function includes the costs of all possible steps following the D&R process model. It includes storing, component management, disassembly & dismantling, material management, reuse in other aircraft, alternative reuse, land filling, energy recovery, secondary material down cycling (for low quality material(lq)), and secondary material recycling (for high quality material(hq)), plus resale. Dependent upon the D&R operational scenarios, either part of or all the process steps are performed. In other words, Equation (1) only includes the cost items incurred within the actual D&R practice. Other cost items of the process steps not incurred are denoted as zero.
Next, each D&R process step cost can be obtained by aggregating the cost elements defined in a Cost Breakdown Structure (CBS). The CBS contains labor, material, and energy consumption incurred during each D&R process step, the facility, tooling & equipment costs used to facilitate the D&R process operations, the miscellaneous costs including the project management, and other overhead costs, as shown in Figure 3 (see Equation (2)). Equivalently, we can first sum up the process step costs for each cost element, then accumulate the cost elements to obtain the total D&R cost. This equivalence between those two aggregations can be expressed as in Equation (3).
where CD&R is the total cost used for the overall D&R process. CD&R,k,j indicates a D&R cost item, k refers to a specific D&R process step (e.g., storing, disassembly & dismantling, etc.), and j refers to a D&R cost element (e.g., labor, material, etc.).
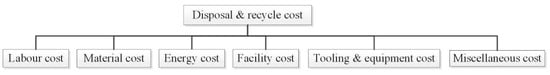
Figure 3.
Disposal and recycle Cost Breakdown Structure (CBS).
In practice, since the labor, material, and energy cost elements are directly associated with the process steps, they are easily extracted during the D&R operation. The other cost elements, such as facility cost, tooling, and equipment cost, are mostly one-time investments, and can either be estimated as a lump sum or be distributed over the D&R process steps to be aggregated later. It is also noteworthy that there are different D&R cost classifications, such as buy-back cost, transportation cost, tip and storage fee, labor cost, equipment investment cost, and recovery cost [43]. However, this kind of classification often confuses the process costs and the pure cost elements. The proposed method of integrating the process steps and the pure cost elements follows a rigorous logic of integration and avoids missing or duplicating cost items for aggregation.
Some analysis has included the aircraft residual value related ownership cost (Cresidual-related), also called investment cost or ownership cost [41]. That refers to the investment for an airline or EoLS company to keep the aircraft, based on its residual value, which adheres to a miscellaneous cost element. There are often two situations when the aircraft is purchased: If the aircraft is always with its first operator and follows a general depreciation schedule, the cost is generated due to aircraft depreciation from the time of purchase till resale or dismantling. It relates to the depreciation cost in the year of disposal and recycle based on the purchase price (book value) at the onset of its operation (Equation (4)). If the aircraft is bought when it is going to be disposed and recycled, then it is often bought with a given residual value. Then, this residual value related ownership cost relates to the depreciation based on the residual value (book value*). Equation (5) shows the approximate residual value related ownership cost, which is a portion of the aircraft residual value multiplied by the number of years required for conducting the D&R process. Empirically, the residual value is around 10% of the aircraft price [44]. The yearly investment cost is approximately 5% of the aircraft residual value [41]. In summary, the residual value related ownership cost actually refers to the cost discounted based on the purchase price or the residual value from the time when the aircraft is bought until the time when the corresponding disposal and recycle process step is finished.
where Cdepreciation is the depreciation cost, Vresidual is the residual value, PAC is the aircraft price, equals to the airline acquisition cost Cacquisition, FY is the current year, FY0 is the initial year; thus, FY − FY0 is the depreciation period when conducting the evaluation, and ndepreciation depicts the total depreciation period, which is larger than FY − FY0. The superscript * indicates that the parameter corresponds to the current elapsed time of the D&R process.
4.2. Salvage, Valorization, and Residual Value Evaluation
The aircraft value involved in the D&R process generally relates to the residual, salvage, and valorization values, which will influence the disposal and recycle strategies. They are irrelevant to the stakeholders, while tightly linked to the specific D&R processes, and to the end reusable or recycled product.
Aircraft residual value is the aircraft value after a certain period of depreciation. It is determined by the airline based on its depreciation strategy and the duration of depreciation [45]. The residual value at the year for disposal and recycle can be calculated by Equation (6). If the (FY − FY0) is just the total depreciation period ndepreciation, then we will have Vresidual = 0. Residual value can also be estimated via purchase price, as in Equation (7).
where I is the inflation rate, and rresidual is residual rate. According to Equations (6) and (7), we can derive the expression of rresidual with Equation (8).
The salvage value (Vsalvage) is the estimated aircraft (or component) value after the D&R process. It is extracted from the reused and recycled or resold aircraft or components and materials. It is considered to be the value of the aircraft or aircraft component, including the valorization according to the D&R process. Similar terms, such as the part harvested value or the component market value, are also utilized in previous studies [2,41]. According to the present value theory, the present value (PV) is the discounted future value (FV) by a given rate of return (r) in a period (n), as shown in Equation (9). In the context of aircraft disposal and recycle process, the salvage value corresponds to the future value of the aircraft after the D&R process, while the residual value is just the present value of the aircraft in the current condition before the D&R process. Based on the relationship between FV and PV, the link between salvage value and residual value can be formulated as in Equation (10). Therefore, once the rate of return is given, the salvage value can be obtained through Equation (11). Depending on the actual D&R process step, detailed salvage value may contain the following value items: the value of the components for reuse and alternative reuse, the value of energy recovery, the value of recycling the high and low quality material, and the value of the other resale parts or the value of the aircraft resale (see Equation (12) and Figure 2). The salvage value for land filling is deemed as zero.
where rD&R is the rate of return for the D&R process, which is the interest the D&R process might earn, nD&R is the period of disposal and recycle process, and it is equivalent to the duration of the D&R process. The subscripts in Equation (12) correlate to the aforementioned process steps. Note that, in the current research presented, the salvage cost concept, which is the cost spent to salvage an aircraft and aggregation of the process step cost specifically for product salvage (e.g., reuse, material recycle, etc.), is different and not interchangeable with the salvage value.
Valorization value (Vvalorization) is the product value added after the aircraft disposal and recycle process. It is not straightforward to identify the valorization through each D&R process step. If the salvage value and the residual value are known, then the valorization value can be obtained through Equation (13).
5. Aircraft Disposal and Recycle Economic Indicator
5.1. Definition of Disposal and Recycle Economic Indicator ID&R
For aircraft that are no longer in service, the airline will consider the trade-off between direct resale and disassemble & dismantle (scenarios I, II, and III). At the same time, the EoLS Company will decide whether it will conduct the aircraft disposal and recycle processes (scenarios II and III). In order to provide a measure for the economic performance of the D&R process, a general economic indicator (ID&R) is proposed (see Equation (14)). We consider the ratio between the values valorized versus the cost spent through the D&R process as ID&R. It is assumed that the decommissioned aircraft with/without D&R process remains positive in value, i.e., the salvage value and residual value are positive. Once the aircraft is parked, it incurs a D&R cost; therefore, the D&R cost is also assumed to be positive. Note that all values and costs should be evaluated from the same fiscal year (FY).
When ID&R > 1, we have Vsalvage − Vresidual > CD&R, i.e., Valorization > CD&R. The salvage value is therefore larger than the residual value, i.e., the valorization value is larger than the D&R cost. It indicates that the value valorized via the D&R process is able to cover the cost incurred. Therefore, the corresponding D&R solution should be selected, and the larger the positive ID&R, the better the solution is.
Other situations all lead to unfavorable solutions: Where if ID&R < 0, the salvage value is smaller than the residual value, and the D&R process would introduce a negative effect. When ID&R = 0, salvage value equals the residual value, and the D&R process introduces zero effect. When 0 < ID&R < 1, the salvage value is larger than the residual value, which means that the valorization value is less than the D&R cost, where, the anticipated valorization recovers part of the aircraft residual value. Hence, the process cannot fully harvest the residual value of the aircraft. When ID&R = 1, the salvage value is larger than the residual value, and the valorization value is equal to the D&R cost, where the D&R solution is at the critical point.
5.2. Definition of Disposal and Recycle NPV (ID&R_NPV)
It is known that NPV is the aggregation of the yearly differences between the present value of cash inflow and present value of cash outflow over a period of time, as seen in Equation (15). A positive NPV indicates that the project earnings generated in present money exceeds the costs spent, also in present money. Therefore, an investment with a positive NPV will be profitable, and an investment with a negative NPV will result in a net loss. In the domain of aircraft disposal and recycle, the valorization value is comparable with the cash inflow, while the disposal and recycle cost is the cash outflow. The disposal and recycle NPV ID&R_NPV is then formulated as shown in Equation (16).
where CI is the cash inflow, and CO is the cash outflow, i represents the discount rate, t is the specific year of the project counted from the time of start, and nD&R is the current year of conducting the D&R process. Assuming that the valorization profile is equally distributed over the duration of the disposal and recycle project, then and are averaged values for each year. Therefore, we obtain the simplified Equation (17) with a discount multiplier D (Equation (18)):
When ID&R_NPV > 0, a positive aggregation of the differences between the present valorization value and the present D&R cost is obtained. The value valorized is able to cover the cost spent for D&R process within a certain period, which indicates that the D&R process introduces a positive effect, and that the D&R solution should be chosen. In general, the larger the ID&R, the better the solution. Alternatively, when ID&R_NPV < 0, the D&R process makes a net loss. When ID&R_NPV = 0, the D&R process does not introduce any effect.
6. Analysis and Result Discussion
In order to verify and validate the proposed economic indicator, costs and values are extracted and evaluated from both an averaged data set (see Section 6.1) and two aircraft EoL cases (see Section 6.2). In the current market (circa 2019), there is not a standard format for cost and value data collection. Therefore, the reference data sets are reorganized and standardized to match with the cost and value classification and integration proposed in Section 4. Both the D&R economic indicator ID&R and the NPV measure ID&R_NPV are calculated. The former provides the economic analysis for general and case-specific EoL performance in civil aviation, while the latter is mainly used to verify and validate the analysis and the corresponding results.
Furthermore, the general sensitivity analysis [46] is implemented to evaluate the sensitivity for various base conditions, shown as general sensitivity tornado diagrams. For n model inputs x = [x1, x2, …, xn] ⊆ χ in , and a model output y = g(x) ⊆ y in . The general sensitivity measure of xi with a positive model input change Δxi+, i.e., xi + Δxi+ = xi+, is then represented by the following three indicators (Equations (19)–(24)):
Individual effect:
Total effect:
Interaction effect:
where,
where x0 refers to the model variables for the base case, (xi + Δxi+, ) is the data point in χ with positive input change for the ith variable only, ϕi+ is the individual effect for the model input xi, and represents the first order finite change sensitivity index of the general sensitivity measures, ϕi,j+ is the interaction effect of simultaneous variation of two model inputs xi and xj, ϕi,j,k+ is the interaction effect of varying three model inputs, xi, xj, and xk, at the same time, ϕiT+ refers to the total effect (including the individual and interaction effect) related to the model input xi, and represents the total finite change index, ϕiI+ is obtained by excluding the individual effect from the total effect relative to the model input xi, and represents the interaction effect. In summary, the general sensitivity measure can be represented by a generalized tornado diagram with ϕi+, ϕiT+ and ϕiI+ indices. Accordingly, the general sensitivity measure of xi with a negative model input change Δxi− is then represented by ϕi−, ϕiT−, ϕiI− indices.
6.1. Averaged Data Set and Economic Indicators
In this section, the analysis is conducted based on the data collected from three aircraft categories of responses from survey investigation [2]. The costs and values relate to 2014 USD.
6.1.1. Economic Indicator Evaluation
The average costs of dismantling an aircraft or engine and the salvage values of their harvested parts classified by aircraft categories can be seen from Table 2 and Table 3 [2]. The aircraft average residual value is assumed to be 10% of the aircraft average price, which is approximated based on aircraft market price for aircraft manufacturers [47,48], see Table 4 and Table 5. The D&R economic indicator and NPV measure can then be obtained (Table 6 and Table 7). Note that the term ‘aircraft’ shown in these tables refers to the airframe and systems without engines, the ‘aircraft (total)’ is aircraft with engine parts, and ‘engine’ refers to 1 engine component.
Table 2.
Average dismantling cost of an aircraft/engine (2014 USD) [2].
Table 3.
Average salvage value of parts from an aircraft/engine (2014 USD) [2].
Table 4.
Average aircraft price (2014 USD) (data resource for aircraft price.
Table 5.
Average residual value (2 engines for narrow body and regional jet, 4 engines for wide body) (rresidual = 10%) (2014 USD).
Table 6.
Average values of the disposal and recycle economic indicator ().
Table 7.
Disposal and recycle NPV based on average aircraft value () (nD&R = 3, i = 8%) (2014 USD).
For aircraft disposal and recycle, the D&R economic indicator (ID&R) are all below 1, an unfavorable feature from the economic perspective. ID&R of the regional jet case is shown to be the highest value close to 1, while those of the narrow body and wide body aircraft are far from economically efficient (Table 6). This is because a regional jet often has a relatively low purchase cost relative to general supply chain economics [49] but has a high salvage value. It should be noted that, when there is a small difference between the salvage value and residual value (e.g., regional jet), it is easy to turn the situation from beneficial to economically inefficient, and vice versa. Therefore, those situations should be carefully treated during practical disposal and recycle executions. For an engine dismantling process, the D&R activities for the aforementioned three aircraft categories are all profitable. This can be explained by the large salvage values of all recovered engines. The narrow body engine achieves the highest D&R economic indicator, and it is followed by regional jet engine, and then by wide body aircraft engine. The D&R NPV shows a similar tendency (Table 7). By comparing the engine and the aircraft of all categories, the ID&R and NPV of the engine is generally higher than the so-called critical point, which indicates that the engine D&R process may achieve larger valorization value and obtain higher salvage value relatively than those of the aircraft D&R process under the 2014 reference year of D&R techniques and the market.
6.1.2. Sensitivity Analysis for Averaged Data Set
General sensitivity measures are calculated for the averaged data set. The impact of the model inputs on the economic indicator is obtained. Those model inputs are tightly related to their respective cost drivers. This also motivates further inspections of their interactions [50]. Tornado diagrams for the D&R economic indicators ID&R and the NPV measure ID&R_NPV are generated by applying ±Δxi for the model inputs, viz., residual value, D&R cost, and salvage value. Three ranges of Δxi = 0.1xi, 0.5xi, and 0.99xi are applied. We mainly focus on the sensitivities of the economically efficient D&R cases. Therefore, the general tornado diagram for an engine for narrow body aircraft is exemplified in Figure 4.
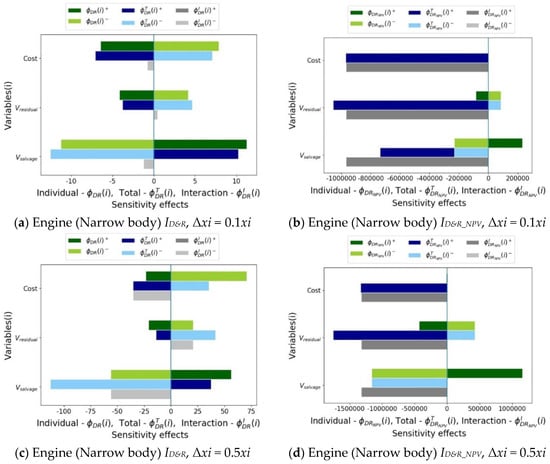
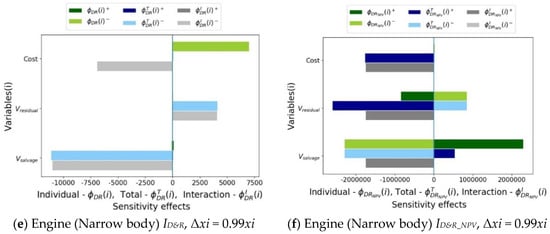
Figure 4.
General sensitivity diagram–Engine (Narrow body).
According to the general sensitivity analysis for ID&R (Figure 4a,c,e) ϕD&R(i)+ and ϕD&R(i)−, the individual effect of the salvage value is shown to be the most sensitive for Δxi = 0.1xi+, Δxi = 0.5xi+, and Δxi = 0.99xi+ (relating to positive input changes). The second influential factor is the D&R cost in all three Δxi+ cases. The increase of the D&R cost and residual value introduces negative effects, while the increase of the salvage value introduces a positive impact on the change of ID&R (all Δxi+ cases). Considering the negative input changes Δxi−, the individual effect of salvage value is the most sensitive when Δxi = 0.1xi−, while the D&R cost is the most sensitive model input when Δxi = 0.5xi− and Δxi = 0.99xi−. The second influential factor is the D&R cost when Δxi = 0.1xi−, and it is the salvage value when Δxi = 0.5xi− and Δxi = 0.99xi−. The decrease of the D&R cost and residual value introduces positive effects on ID&R, while the decrease of the salvage value has a negative effect on ID&R for all Δxi− cases. From the perspective of ID&R_NPV (Figure 4b,d,f) and , the individual effect of the salvage value is consistently the most sensitive factor in all Δxi+ cases. The second-most influential factor is the residual value (all Δxi+ cases). The increase of the D&R cost and residual value introduces negative changes of ID&R_NPV, while the increase of the salvage value has a positive impact on ID&R_NPV (all Δxi+ cases). With the negative input changes Δxi−, the individual sensitivity shows a symmetrical performance: The salvage value is the most sensitive (all Δxi− cases), while the residual value is the second influential factor (all Δxi− cases). The decrease of the D&R cost and residual value introduces positive effects on ID&R_NPV, while the decrease of the salvage value has a negative effect on ID&R_NPV for all Δxi− cases. We can see that the individual sensitivities of the D&R cost and residual value are different for ID&R and ID&R_NPV. This difference is caused by the mathematical formulation of those two indices: ID&R places the disposal and recycle cost in the denominator position, while the D&R cost is a subtraction item in ID&R_NPV. When Δxi = 0.99xi−, the D&R cost is close to zero, which significantly increases the ID&R and illustrates a very sensitive feature.
Considering the total sensitivity for ID&R, i.e., and in Figure 4a,c,e, the salvage value is the most sensitive, and the second sensitive factor is the D&R cost (Δxi = 0.1xi+, Δxi = 0.5xi+), while D&R cost is the most sensitive and salvage value the second-most sensitive when Δxi = 0.99xi+. Increasing the D&R cost and residual value will result in negative impacts, while increasing salvage value introduces a positive effect (all Δxi+ cases). With negative model input changes, the salvage value is the most sensitive (all Δxi+ cases), the second-most sensitive factor is the D&R cost when Δxi = 0.1xi−, and the residual value when Δxi = 0.5xi- and Δxi = 0.99xi−. Decreasing D&R cost and residual value introduces positive impacts, while decreasing salvage value introduces a negative effect (all Δxi− cases). According to Figure 4b,d,f) and , the most sensitive factor for ID&R_NPV is the residual value in terms of the total sensitivity, and the D&R cost is shown as the second-most influential factor (all Δxi+ cases). Increasing the D&R cost, residual value, and salvage value all introduce negative influences on the change of ID&R_NPV when Δxi = 0.1xi+ and Δxi = 0.5xi+. However, increasing the D&R cost and residual value have negative impacts, and increasing the salvage value has a positive impact when Δxi = 0.99xi+. The negative model input change for ID&R_NPV shows that the salvage value is the most sensitive, while the residual value is the second-most sensitive parameter (all Δxi− cases). Decreasing the D&R cost and residual value produces positive impacts, while reducing the salvage value introduces a negative effect (all Δxi− cases).
In view of the interaction sensitivity for ID&R (Figure 4a,c,e) and , the most sensitive model input is the salvage value, and the D&R cost is the second-most influential parameter (all Δxi+ cases). Increasing the D&R cost and salvage value introduces negative impacts (all Δxi+ cases), while increasing the residual value introduces positive influences on input interaction induced output change. In terms of negative input changes, the interaction sensitivity of salvage value is the most sensitive, while the D&R cost is next (all Δxi− cases). Reducing the D&R cost and salvage value has negative influences, while decreasing the residual value induces a positive interaction change on ID&R (all Δxi− cases). However, it is noteworthy that the interaction sensitivity is negligible for all positive input changes when compared with their counterpart of negative changes for ID&R. From Figure 4a,c,e) and , the interaction sensitivity of the residual value, salvage value, and D&R cost for ID&R_NPV illustrate equal interaction sensitivities for all Δxi− cases. The increase of the three model inputs has a negative influence on ID&R_NPV. By decreasing the input changes, the sensitivity of the three parameters also maintains the same value when xi = 0.1xi− and Δxi = 0.5xi−, and very close values when Δxi = 0.99xi−. It is also noted that the interaction sensitivity is negligible for all negative input changes when compared with their counterpart regarding positive changes for ID&R_NPV.
6.2. Boeing 737-300 and 747-400 Data Set and Economic Indicators
In more detail, the D&R economic indicator and NPV measure are evaluated by referencing the estimated D&R costs and values for a 737-300 case and a B747-400 case. The cost data are resourced from the research conducted by van Heerden in 2005 [41] (see Table 8). The 737-300 was manufactured in 1986 with CFM56 engines, and the B747 in 1989 with CF6 engines [41]. Four D&R cases were considered: (1) disassembly & dismantling (same year of retirement, parking 1 year for D&R operation), (2) disassembly & dismantling (same age at 20 years old), (3) resale (same year of retirement, parking 1 year for D&R operation), and (4) resale (same age at 20 years old). The first case refers to a disassembly & dismantling process immediately after the aircraft reached the end of its life cycle; the second is to disassemble and dismantle the aircraft until it is 20 years old, the third case is to resell the aircraft after parking the retired aircraft for one year, while the last refers to resale of the retired aircraft until it is 20 years old. The time of the 737-300 retirement is just at the time when the aircraft is at an age of 20. Therefore, for 737-300 study case, the first and second cases are equivalent, while the third and fourth cases are the same. The costs in Euro (€) are all converted to USD ($) via the euro-dollar conversion rate in the fiscal year 2005, i.e., €1 = $1.18.
Table 8.
Disposal and recycle costs for 737-300 and 747-400 disposal and recycle cases (2005 USD).
6.2.1. Economic Indicator Evaluation
The cost estimations for respective EoL cases are illustrated in Table 8, Table 9 and Table 10. It is noted that the cost and value are aggregated following the methodology proposed in Section 4. Minor adaptations on specific cost and value items are applied based on actual data availability. For example, the investment cost is the aforementioned residual value related ownership cost.
Table 9.
Disposal and recycle costs for 747-400 resale till age 20 (2005 USD).
Table 10.
Disposal and recycle costs for 747-400 disassembly and dismantling till age 20 (2005 USD).
A European airline bought the 737 for €23million ($27 million), and the 747 for €11.3 million ($133 million) [41]. If we set the residual value as 10% of the aircraft price, the residual values for 737-300 and 747-400 are shown in Table 11. The residual value is assumed to be the same for the disassembly & dismantling and the resale options. The salvage values of disassembly & dismantling is the aggregation of the total market value of the dismantled components and materials, which are $3.2 million and 13.2 million for 737-300 and 747-400, respectively. The engine components for 737-300 and 747-400 are estimated to be $0.1 million and $0.2 million, and this should be included in the salvage value. The salvage value of the resale option is assumed to be the current market value of an aircraft when parked one year of valorization, and it is estimated at $1.7 million and $17.1 million for 737-300 and 747-400 [41], as shown in Table 11.
Table 11.
Residual and salvage values for 737-300 and 747-400 cases (2005 USD).
Based on the method elaborated in Section 5, the economic indicator for the aforementioned D&R cases can be calculated (see Table 12). It can be seen that the disassembly & dismantling of Boeing 737-300 (ID&R = 8.4 > 1) would fully recover the aircraft residual value with extra benefit, and the Boeing 747-400 would only make a profit from the resale (parking 1 year) solution (ID&R = 3.8 > 1). By conducting D&R processes when both aircraft are at the same age, it can be seen that the result for the B737-300 remains unchanged, while neither disassembly & dismantling nor resale is economically efficient for the 747-400 aircraft. This is mainly due to the large expense of 3 years parking forthe 747-400 before resale or disassembly & dismantling. Therefore, for an aircraft reaching its EoL, it is better to conduct D&R process sooner. In addition, it is obviously seen that, the older the aircraft, the lower the chance to achieve economic efficiency. Based on ID&R measurement, decisions on resale or disassembly & dismantling can be easily made through the comparisons.
Table 12.
Disposal and recycle economic indicator for 737-300 and 747-400 cases.
For verification and validation, by assuming the discount rate i = 8%, the duration of the D&R case nD&R = 3, and the in and out cash flow as evenly distributed over the D&R case duration, the D&R NPV is evaluated and listed in Table 13. Comparing the D&R NPV measure with the economic indicator, shows a consistent result.
Table 13.
Disposal and recycle NPV for 737-300 and 747-400 cases (nD&R = 3, I = 8%) (2005 USD).
6.2.2. Sensitivity Analysis for Cases 737-300 and 747-400 Data Set
Similarly, in order to identify the impact of the model inputs, general sensitivity measures are obtained by applying Δxi = 0.1xi, 0.5xi, and 0.99xi for the driving parameters for economically efficient cases. Sensitivity diagrams for the 737-300 disassembly & dismantling case and the 747-400 resale case are illustrated in Figure 5 and Figure 6. The sensitivity values and their ranges vary based on specific cases since the general sensitivity is still a local sensitivity measure. The magnitude indicates the numeric scale of the sensitivity under specific circumstances of each study case. For different cases, it is not of interest to compare the absolute values among them but, more importantly, to verify the similar trend and the magnitude range of sensitivities. By comparing Figure 4, Figure 5 and Figure 6, the sensitivity representations of 737-300 and 747-400 economic indicators and the NPV measures are seen to be consistent, which shows a coherent sensitivity performance for economically efficient cases
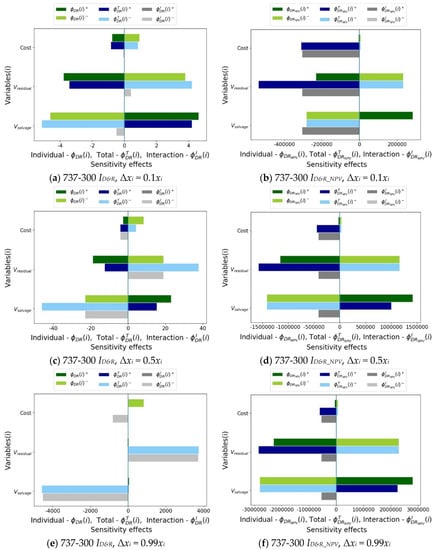
Figure 5.
Sensitivity tornado diagram (737-300 disassembly and dismantling).
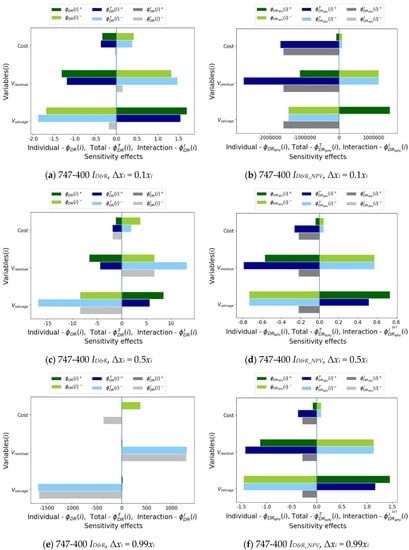
Figure 6.
Sensitivity tornado diagram (747-400 resale).
7. Conclusions
The present study proposed an economic indicator for the D&R process to measure the overall performance of the D&R solution, providing a new way of LCA that evaluates aircraft life cycle performance. In order to assess the economic performance in engineering D&R operation, a value and cost estimation method, by means of integrating the product, process, and cost properties, is developed. The product properties are connected with their cost and value via each process step. The analysis can greatly improve the EoL strategy and process development by providing economic estimates for relevant stakeholders. By involving the properties of aircraft configuration, its materials and components composition, and the operation and maintenance condition, we can derive the D&R process cost and value evaluation and the EoL solution. A general approach of developing an aircraft EoL solution is illustrated and can be summarized as follows: (1) Select the stakeholder and evaluate relevant scenarios; (2) map the process network to the detailed D&R process with specific steps for aircraft and its components; (3) evaluate value and cost of possible EoL strategies; (4) decide the most economically efficient strategy; and (5) build the final EoL solution with the detailed process steps. The proposed indicator is used within the aforementioned 5 steps to evaluate the economic performance and to facilitate the trade-off studies among different strategies. The formulation of the economic indicator combined with the evaluation methods indicates a wider applicability for evaluations of engineering products EoL solutions, which implies a significant contribution of this research.
Analysis has been conducted on an averaged data set and data collected from Boeing 737-300 and 747-400 aircraft EoL cases. It is found that the disassembly & dismantling of an engine possesses relatively more economic gains than that of an aircraft. An aircraft is better disposed and recycled when it just reaches the time point disposal, while parking with maintenance is cost-consuming. In general, a higher salvage value and lower D&R cost will have better economic performance. The effectiveness of the proposed economic indicator is verified and validated by the NPV measure. This indicator can further support the EoL strategy development, such as the disassembly & dismantling decision or the resale decision, at the early phase of an aircraft EoL. Besides, the sensitivity of each model input is analyzed in detail. The individual, total, and interaction sensitivities are obtained by varying the model inputs within a certain range for both ID&R and ID&R_NPV. The sensitivity is tightly related to the mathematical construction of the evaluation model. Salvage value and D&R cost possess great influence on the D&R economic indicator, while in most cases, salvage value and residual value have major impacts on the D&R NPV.
Since not all cost elements are included in this analysis, this might have reduced the impact of the D&R cost on the D&R economic indicator. It is, therefore, recommended to use cost parameters for each process step, so that the cost drivers can be identified that support the development of the exact relationships between the parameters and the corresponding cost elements. Moreover, it is necessary to extract a better evaluation for product salvage values by relevant stakeholders to achieve a more accurate analysis. Nonetheless, the economic indicator does not nullify the decision. For example, the environmental impact and innovative energy conversion [51,52] have not been involved in the decision-making process. By combining the D&R economic indicator with evaluations concerning its environmental and societal impact, the D&R process can be further assessed and improved regarding the sustainability of an aircraft life cycle. If a potential disposal and recycle approach can lead to a sustainable solution, all sustainability metrics should be considered, while using the economic indicator as a warranty check. Last but not least, since the proposed economic indicator involves data from the initial purchase of aircraft, the depreciation during the aircraft operation, and the values and costs of the EoL solutions, it is rather complex to acquire accurate and latest economic data. Therefore, it is of great interest to continue the analysis for more recent data and to strengthen the validation of results, and furthermore to identify global economic influences on aircraft disposal and recycle.
Author Contributions
Conceptualization, X.Z. and R.C.; Formal analysis, X.Z.; Investigation, X.Z.; Methodology, X.Z.; Supervision, W.J.C.V. and R.C.; Validation, X.Z., W.J.C.V. and R.C.; Writing–original draft, X.Z.; Writing–review & editing, X.Z., W.J.C.V. and R.C. All authors have read and agreed to the published version of the manuscript.
Funding
This research was funded by National Natural Science Foundation of China (NSFC), grant number 51805440, and the Fundamental Research Funds for the Central Universities, grant number G2018KY0301.
Conflicts of Interest
The authors declare no conflict of interest.
References
- Forsberg, D. Aircraft Retirement and Storage Trends—Economic Life Analysis Reprised and Expanded; Technical Report; Avolon: Dublin, Ireland, 2015. [Google Scholar]
- Team SAI Consulting. State of the Aircraft Dismantling & Recycling Business in partnership with Aircraft Fleet Recycling Association (AFRA); Technical Report; TeamSAI Consulting betterinsight™: Atlanta, GA, USA, 2014. [Google Scholar]
- George, P.E.; Carberry, W.L.; Connor, M.; Allen, B. Recycled carbon fiber performance in epoxy and polycarbonate matrices. In Proceedings of the Composites Innovation Conference, Barcelona, Spain, 4–5 October 2007. [Google Scholar]
- Asmatulu, E.; Overcash, M.; Twomey, J. Recycling of Aircraft: State of the art in 2011. J. Ind. Eng. 2013, 2013, 108–116. [Google Scholar] [CrossRef]
- Airbus, S.A.S. Process for Advanced Management of End-of-Life of Aircraft (PAMELA); Airbus Academy: Champniers, France, 2008. [Google Scholar]
- Watson, M. End of Aircraft Life Initiatives, SBAC Aviation and Environment Briefing Papers; Technical Report; KPMG, Australia, Society of British Aerospace Companies (SBAC): Weinberg, Germany, 2009. [Google Scholar]
- Van Heerden, D.J.; Curran, R. Value execution from end-of-life aircraft. In Encyclopedia of Aerospace Engineering; Blocldey, R., Shyy, W., Eds.; John Wiley & Sons, Ltd.: Hoboken, NJ, USA, 2010; pp. 3715–3726. [Google Scholar]
- Keivanpour, S.; Ait-kadi, D.; Mascle, C. Toward a strategic approach to End-of-Life aircraft recycling projects—A research agenda in transdisciplinary context. J. Manag. Sustain. 2013, 3, 76–94. [Google Scholar] [CrossRef]
- Johansson, J. Product innovation for sustainability: On product properties for efficient disassembly. Int. J. Sustain. Eng. 2008, 1, 32–41. [Google Scholar] [CrossRef]
- Germani, M.; Mandolini, M.; Marconi, M.; Rossi, M. An approach to analytically evaluate the product disassemblability during the design process. Procedia CIRP 2014, 21, 336–341. [Google Scholar] [CrossRef][Green Version]
- Roskam, J. Airplane Design; Roskam Aviation and Engineering Corporation: Ottawa, ON, Canada, 1985. [Google Scholar]
- Raymer, D.P. Aircraft Design: A Conceptual Approach; American Institute of Aeronautics and Astronautics, Inc.: Reston, VA, USA, 2018. [Google Scholar]
- Kaewunruen, S.; Rungskunroch, P.; De’Von, J. A through-life evaluation of end-of-life rolling stocks considering asset recycling, energy recovering, and financial benefit. J. Clean. Prod. 2019, 212, 1008–1024. [Google Scholar] [CrossRef]
- Ahmed, S.; Ahmed, S.; Shumon, M.R.H.; Falatoonitoosi, E.; Quader, M.A. A comparative decision-making model for sustainable end-of-life vehicle management alternative selection using AHP and extent analysis method on fuzzy AHP. Int. J. Sustain. Dev. World Ecol. 2015, 23, 83–97. [Google Scholar] [CrossRef]
- Choi, J.K.; Kelley, D.; Murphy, S.; Thangamani, D. Economic and environmental perspectives of end-of-life ship management. Resour. Conserv. Recycl. 2016, 107, 82–91. [Google Scholar] [CrossRef]
- Sabaghi, M.; Cai, Y.; Mascle, C.; Baptiste, P. Sustainability assessment of dismantling strategies for end-of-life aircraft recycling. Resour. Conserv. Recycl. 2015, 102, 163–169. [Google Scholar] [CrossRef]
- Mascle, C.; Baptiste, P.; Sainte Beuve, D.; Camelot, A. Process for Advanced Management and Technologies of Aircraft EOL. Procedia CIRP 2015, 26, 299–304. [Google Scholar] [CrossRef]
- Bouzarour-Amokrane, Y.; Tchangani, A. Decision evaluation process in end-of-life systems management. J. Manuf. Syst. 2015, 37, 715–728. [Google Scholar] [CrossRef]
- McConnell, V.P. Launching the carbon fibre recycling industry. Reinf. Plast. 2010, 54, 33–37. [Google Scholar] [CrossRef]
- Yang, Y.; Boom, R.; Irion, B.; van Heerden, D.J.; Kuiper, P.; de Wit, H. Recycling of composite materials. Chem. Eng. Process. Process Intensif. 2012, 51, 53–68. [Google Scholar] [CrossRef]
- Ribeiro, J.S.; de Oliveira Gomes, J. Proposed framework for end-of-life aircraft recycling. Procedia CIRP 2015, 26, 311–316. [Google Scholar] [CrossRef]
- Hur, M.; Keskin, B.B.; Schmidt, C.P. End-of-life inventory control of aircraft spare parts under performance based logistics. Int. J. Prod. Econ. 2018, 204, 186–203. [Google Scholar] [CrossRef]
- Willems, B.; Dewulf, W.; Duflou, J.R. Can large-scale disassembly be profitable? A linear programming approach to quantifying the turning point to make disassembly economically viable. Int. J. Prod. Res. 2006, 44, 1125–1146. [Google Scholar] [CrossRef]
- Delogu, M.; Zanchi, L.; Maltese, S.; Bonoli, A.; Pierini, M. Environmental and economic life cycle assessment of a lightweight solution for an automotive component: A comparison between talc-filled and hollow glass microspheres-reinforced polymer composites. J. Clean. Prod. 2016, 139, 548–560. [Google Scholar] [CrossRef]
- Newcamp, J.; Verhagen, W.J.C.; Santos, B.F.; Curran, R. Retirement optimization through aircraft transfers and employment. J. Air Transp. Manag. 2019, 79, 1–8. [Google Scholar] [CrossRef]
- Enos, J.R.; Farr, J.V.; Nilchiani, R. A tale of two aircraft: How non-functional attributes impact a system’s lifecycle. In Proceedings of the International Annual Conference of the American Society for Engineering Management, Huntsville, AL, USA, 18–21 October 2017; pp. 1–10. [Google Scholar]
- Ogunsina, K.; Chao, H.; Kolencherry, N.; Moolchandani, K.; Crossley, W.A.; De Laurentis, D.A. A model of aircraft retirement and acquisition decision based on net present value calculations. In Proceedings of the 17th AIAA Aviation Technology, Integration, and Operations Conference, Denver, CO, USA, 5–9 June 2017; pp. 1–9. [Google Scholar]
- Keivanpour, S.; Ait-Kadi, D.; Mascle, C. End of life aircraft treatment in the context of sustainable development, lean management, and global business. Int. J. Sustain. Transp. 2017, 11, 357–380. [Google Scholar] [CrossRef]
- Matthieu, G.; François, P.; Tchangani, A. Optimising end-of-life system dismantling strategy. Int. J. Prod. Res. 2012, 50, 3738–3754. [Google Scholar] [CrossRef]
- Abdessalem, M.; Hadj-Alouane, A.B.; Riopel, D. Decision modelling of reverse logistics systems: Selection of recovery operations for end-of-life products. Int. J. Logist. Syst. Manag. 2012, 13, 139–161. [Google Scholar] [CrossRef]
- Keivanpour, S.; Ait-Kadi, D.; Mascle, C. End of life aircrafts recovery and green supply chain (a conceptual framework for addressing opportunities and challenges). Manag. Res. Rev. 2015, 38, 1098–1124. [Google Scholar] [CrossRef]
- Mascle, C.; Cai, Y.; Camelot, A. Information technology for processing and treating aircraft end of life. Appl. Mech. Mater. 2014, 686, 153–159. [Google Scholar] [CrossRef]
- Chung, W.H.; Kremer, G.E.O.; Wysk, R.A. A dynamic programming method for product upgrade planning incorporating technology development and end-of-life decisions. J. Ind. Prod. Eng. 2017, 34, 30–41. [Google Scholar] [CrossRef]
- Hao, W.; Hongfu, Z. Using genetic annealing simulated annealing algorithm to solve disassembly sequence planning. J. Syst. Eng. Electron. 2009, 20, 906–912. [Google Scholar]
- Coro, A.; Abasolo, M.; Aguirrebeitia, J.; Lopez de Lacalle, L.N. Inspection scheduling based on reliability updating of gas turbine welded structures. Adv. Mech. Eng. 2019, 11. [Google Scholar] [CrossRef]
- Coro, A.; Macareno, L.M.; Aguirrebeitia, J.; López de Lacalle, L.N. A methodology to evaluate the reliability impact of the replacement of welded components by additive manufacturing spare parts. Metals 2019, 9, 932. [Google Scholar] [CrossRef]
- Vieira, D.R.; Vieira, R.K.; Chain, M.C. Strategy and management for the recycling of carbon fiber-reinforced polymers (CFRPs) in the aircraft industry: A critical review. Int. J. Sustain. Dev. World Ecol. 2017, 24, 214–223. [Google Scholar] [CrossRef]
- Rahim, S.N.A.; Lajis, M.A.; Ariffin, S. A review on recycling aluminum chips by hot extrusion process. Procedia CIRP 2015, 26, 761–766. [Google Scholar] [CrossRef]
- Naqvi, S.R.; Prabhakara, H.M.; Bramer, E.A.; Dierkes, W.; Akkerman, R.; Brem, G. A critical review on recycling of end-of-life carbon fibre/glass fibre reinforced composites waste using pyrolysis towards a circular economy. Resour. Conserv. Recycl. 2018, 136, 118–129. [Google Scholar] [CrossRef]
- Eckelman, M.J.; Ciacci, L.; Kavlak, G.; Nuss, P.; Reck, B.K.; Graedel, T.E. Life cycle carbon benefits of aerospace alloy recycling. J. Clean. Prod. 2014, 80, 38–45. [Google Scholar] [CrossRef]
- Van Heerden, D.J. End-of-Life Aircraft: How to Deal with Old Aircraft Withdrawn from Service. Master’s Thesis, Delft University of Technology, Delft, The Netherlands, 2005. [Google Scholar]
- Zhao, X.; Verhagen, W.J.C.; Curran, R. Aircraft disposal and recycle cost estimation. In Proceedings of the 23rd International Conference on Transdisciplinary Engineering, Curitiba, Brazil, 3–7 October 2016; pp. 685–694. [Google Scholar]
- Bellmann, K.; Khare, A. Economic issues in recycling end-of-life vehicles. Technovation 2000, 20, 677–690. [Google Scholar] [CrossRef]
- KPMG. Components of Aircraft Acquisition Cost, Associated Depreciation and Impairment Testing in the Global Airline Industry; Technical Report; KPMG nternational Cooperative: Australia, 2007. [Google Scholar]
- Doganis, R. Flying Off Course: The Economics of International Airlines; Taylor & Francis Group: Abingdon, UK, 2010. [Google Scholar]
- Borgonovo, E.; Plischke, E. Sensitivity analysis: A review of recent advances. Eur. J. Oper. Res. 2016, 248, 869–887. [Google Scholar] [CrossRef]
- Airbus Aircraft List Prices. Available online: https://www.airbus.com/newsroom/press-releases/en/2015/01/new-airbus-aircraft-list-prices-for-2015.html (accessed on 10 March 2016).
- Boeing Commercial Aircraft List Price. Available online: http://www.boeing.com/company/about-bca/ (accessed on 10 March 2016).
- Watson, P.; Curran, R.; Murphy, A.; Cowan, S. Cost estimation of machined parts within an aerospace supply chain. Concurr. Eng. Res. Appl. 2006, 14, 17–26. [Google Scholar] [CrossRef]
- Curran, R.; Kundu, A.; Raghunathan, S.; McFadden, R. Impact of aerodynamic surface tolerance on aircraft cost driver. Proc. Inst. Mech. Eng. Part G J. Aerosp. Eng. 2002, 216, 29–39. [Google Scholar] [CrossRef]
- Curran, R.; Whittaker, T.J.T.; Stewart, T.P. Aerodynamic conversion of ocean power from wave to wire. Energy Convers. Manag. 1998, 39, 1919–1929. [Google Scholar] [CrossRef]
- Curran, R.; Denniss, T.; Boake, C. Multidisciplinary design for performance: Ocean wave energy conversion. In Proceedings of the International Offshore and Polar Engineering Conference, Seattle, WA, USA, 28 May–2 June 2000; pp. 434–441. [Google Scholar]


© 2020 by the authors. Licensee MDPI, Basel, Switzerland. This article is an open access article distributed under the terms and conditions of the Creative Commons Attribution (CC BY) license (http://creativecommons.org/licenses/by/4.0/).