Article

Horizontal Loading Performance of Offshore Wind Turbine Pile Foundation Based on DPP-BOTDA

1
Key Lab of Structures Dynamic Behavior and Control of the Ministry of Education, Harbin Institute of Technology, Harbin 150090, China
2
Key Lab of Smart Prevention and Mitigation of Civil Engineering Disasters of the Ministry of Industry and Information Technology, Harbin Institute of Technology, Harbin 150090, China
3
RealPhotonics Co., Ltd., Anshan 114000, China
4
National Key Laboratory of Science and Technology on Tunable Laser, Harbin Institute of Technology, Harbin 150001, China
*
Author to whom correspondence should be addressed.
Appl. Sci. 2020, 10(2), 492; https://doi.org/10.3390/app10020492
Submission received: 3 December 2019 / Revised: 6 January 2020 / Accepted: 7 January 2020 / Published: 9 January 2020
(This article belongs to the Section Energy Science and Technology)

Abstract

:
Offshore wind power is becoming attractive in the wind-power field. With the rapid development of wind-power technology, high-power wind turbines have been implemented in practice. However, the increase in the length of the wind turbine blade causes the pile foundation to withstand a prone overturning moment. For overcoming the problems of traditional sensing technology and meeting the monitoring requirements of pile foundations, a 20 cm spatial resolution differential pulse pair Brillouin optical time-domain analysis (DPP-BOTDA) technique is used to measure a 69 m long offshore wind turbine pile under horizontal loading. From the distributed strain data collected in the test, the maximum stress location of the long pile under the horizontal load can be obtained. By analyzing the load and maximum strain (F-εmax) curve, the horizontal bearing capacity of the pile foundation can exceed 900 kN, which is the maximum horizontal load of the design. The distributed displacement calculation method based on distributed strain data is proposed, according to the force characteristics of steel pipe piles. By comparing the calculated displacement data with the measured data by the dial indicators, the mean absolute percentage error (MAPE) value is only 0.03548. Results show that the 20 cm spatial resolution DPP-BOTDA technology is very suitable for the bearing capacity test of offshore wind turbine steel pipe pile foundations.

1. Introduction

Offshore wind power, with the advantages of high wind speed, low wind edge cutting, low turbulence, and high output, has gradually become a new field of wind power development. However, the foundation of offshore wind turbines has a special engineering attribute. It is located in the marine environment and subjected to the repeated impact of seawater. Also, it bears a huge overturning moment and is affected by the natural vibration load of wind turbines. In addition, the equipment of a wind turbine has higher requirements for bearing capacity and deformation of foundation. Therefore, it is necessary to evaluate the bearing capacity of the foundation. At present, pile foundations are widely used in offshore wind turbine foundations, and piles are large in diameter, deep in soil, and high in bearing capacity. In order to obtain the actual bearing capacity of the pile foundation, the widely used method is to carry out the horizontal bearing capacity test in the engineering sea area. The pile test can determine not only the bearing capacity of the whole pile but also the friction of the soil and evaluate the settlement characteristics of the pile foundation [1].
In the pile test, traditional instrumentation includes vibrating wire strain gauges (VWSGs), resistance strain gauges, axial load cells, and extensometers. However, the arrangement of sensors is limited by the number of test points, connecting lines, acquisition instruments, and costs. Also, the quality of the sensor installation cannot be guaranteed [2]. In this way, the result is a limited number of sensors on tens-of-meters-long piles. This situation will lead to test results only being able to reflect the local deformation characteristics of the pile. Moreover, the effective bearing capacity of the pile cannot be determined. In recent years, distributed optical fiber sensing technology has developed rapidly. It has been well applied in the civil engineering field, such as tunnels [3,4], bridges [5,6], railways [7], and foundations [8]. Compared with traditional electrical sensors, the distributed optical fiber sensors (DOFS) have unique advantages such as distributed measurement, chemical resistance, electromagnetic interference, and easy installation. Based on the above advantages, DOFS are very suitable for the marine environment. At present, in the field of pile foundation inspection, the application of DOFS mainly includes Brillouin optical time-domain reflectometry (BOTDR) [9,10,11,12,13], Brillouin optical time-domain analysis (BOTDA) [14,15], and optical frequency domain reflectometry (OFDR) [16,17]. The first two categories are Brillouin-based sensors, whereas the last one is Rayleigh-based sensors.
Until now, much attention has been paid to improving the spatial resolution of Brillouin-based DOFS. The spatial resolution is determined by the pulse width in the BOTDA system. However, the short pulse will broaden the Brillouin spectrum and then reduce the fitting accuracy, when it is shorter than the phonon lifetime (~10 ns) [18]. Several impressive techniques have been proposed to realize sub-metric spatial resolution, such as the pulse pre-pump method [19], dark-pulse scheme [20], Brillouin echoes [21], and differential pulse pair (DPP) technique [22]. The first two methods pre-excite the acoustic field and then utilize an ultra-short pulse or dark pulse to develop a high spatial resolution BOTDA system. However, the sensing range is limited to several kilometers due to pump depletion. The last two techniques are implemented with two long different pulses (phase or width) and the differential signal is obtained via the subtraction between two Brillouin signals. Both techniques have shown the capabilities of high spatial resolution and long-range sensing.
In this paper, differential pulse pair Brillouin optical time-domain analysis (DPP-BOTDA) technique is used in the horizontal-loading performance test of wind turbine pile foundations for the first time, to the best of our knowledge. The spatial resolution of DPP-BOTDA is 20 cm and the sampling rate of data points is 5 cm. Distributed optical fiber sensors are arranged at an angle of 90° along the perimeter of the pile. Firstly, the strain values of the pile under different loading conditions are obtained. Comparing the relationship between the load and the maximum strain value, the horizontal bearing capacity of the pile can reach 900 kN, which satisfies the standard of the horizontal-load capacity of offshore wind turbines. Secondly, the calculation method of distributed displacement of steel pipe piles based on distributed strain data is analyzed. According to this method, the distribution displacement data are obtained. The displacement data are compared with the measured data using the dial indicators, and the mean absolute percentage error (MAPE) value is only 0.03548. Finally, the practicality of the high spatial resolution DPP-BOTDA technology in the field of offshore pile foundation is verified.

2. Field Experiment

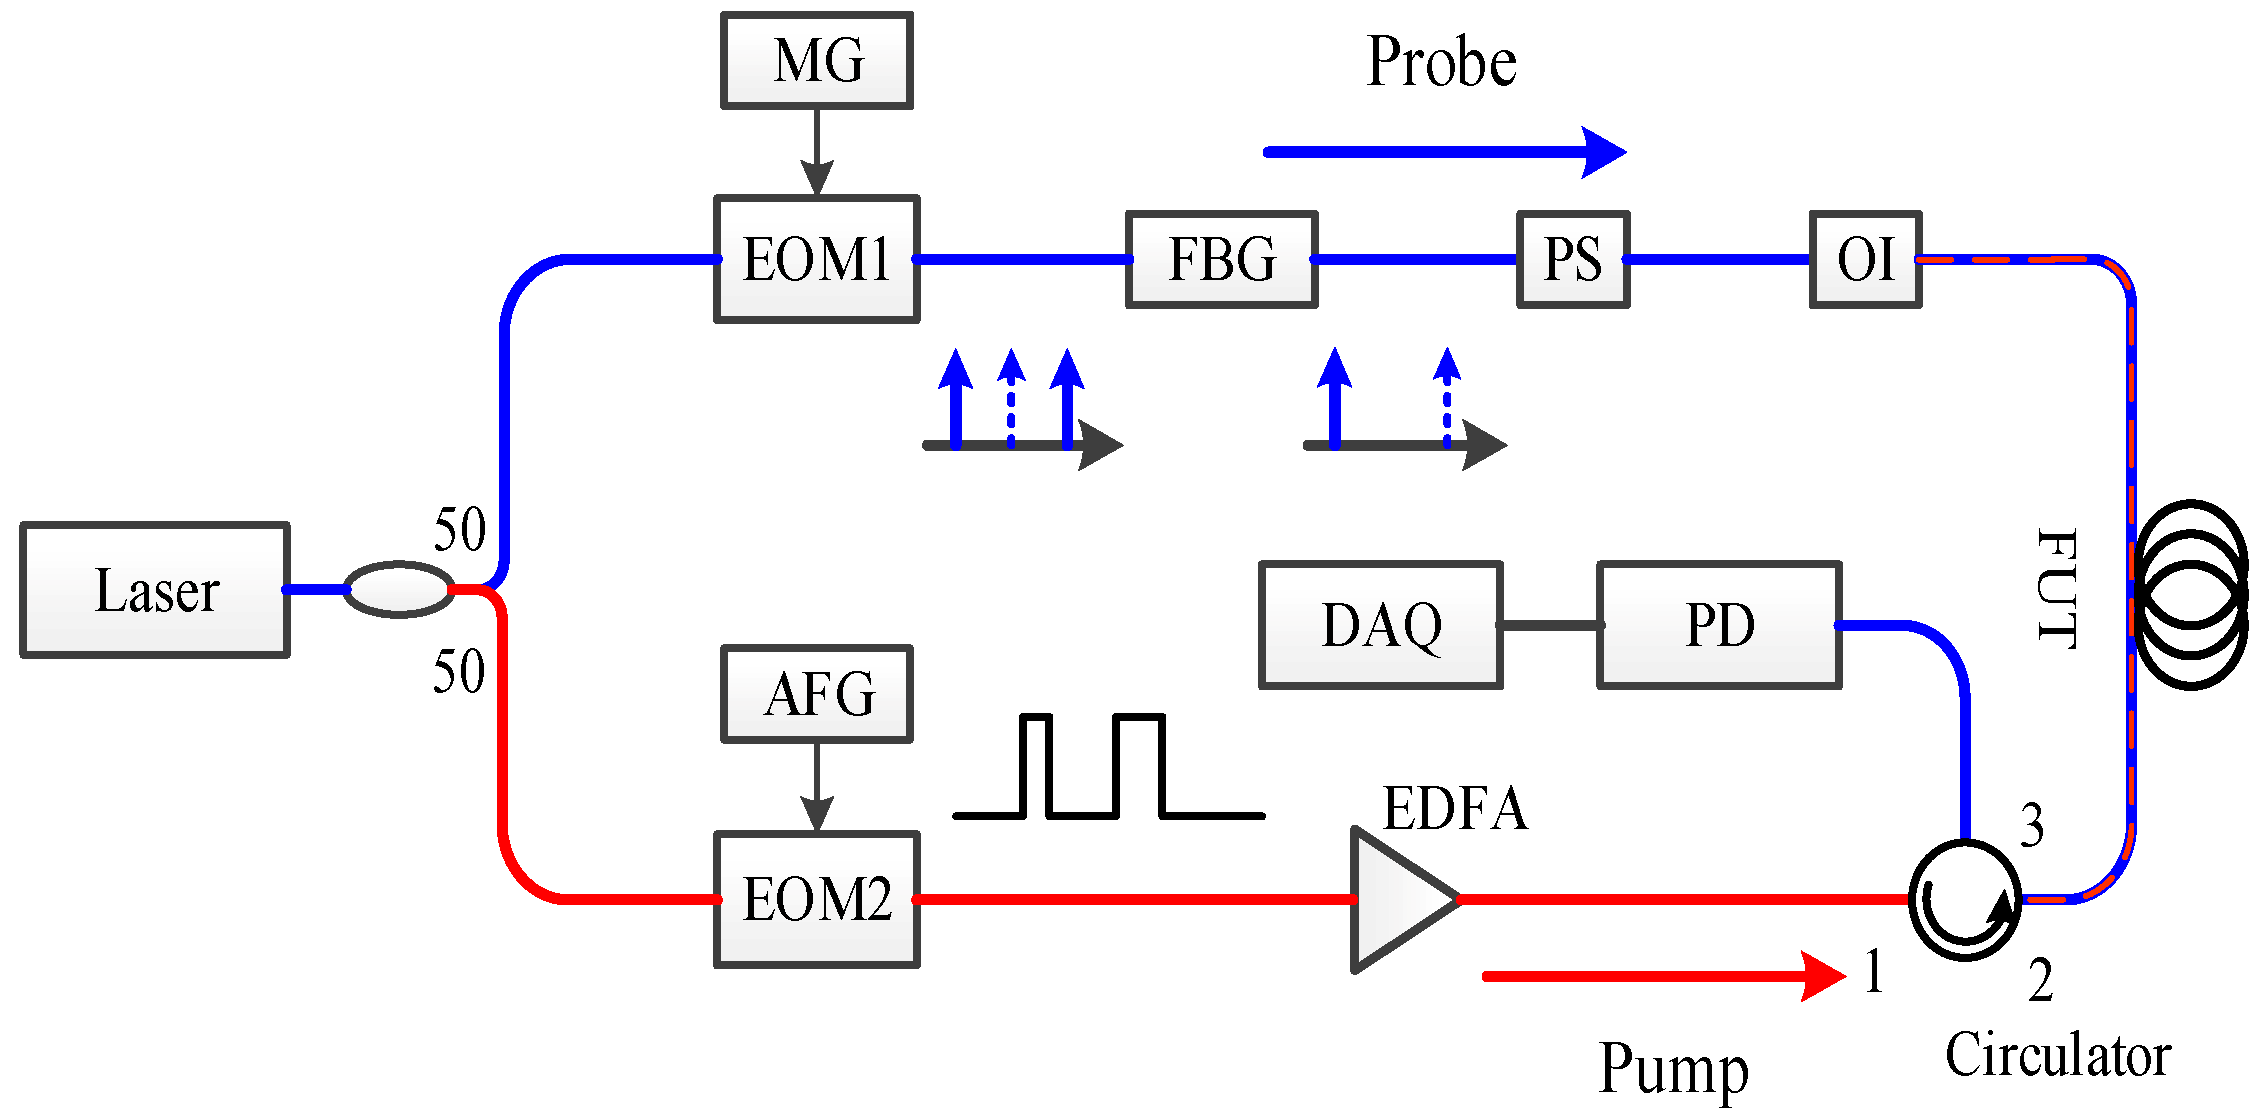
2.1. DPP Measurement System

A typical DPP-BOTDA scheme was implemented to realize high spatial resolution offshore wind turbine pile monitoring, as shown in Figure 1. A narrow-linewidth (40 kHz) optical fiber laser was used as the light source, which operates at a wavelength of 1550 nm and outputs a power of 80 mW. Then, a 3 dB coupler was used to split the output beam into two arms. In the upper arm, the laser beam was double-sideband modulated by means of an intensity electro-optic modulator (EOM1), which was driven by the microwave generator (MG). Then, the lower sideband was selected by a fiber Bragg grating (FBG), working as the probe wave. An orthogonal polarization scrambler (PS) was used to reduce polarization fading. Right before being launched into the fiber under test (FUT), the probe wave went through an optical isolator (OI), which was used to prevent the high-power pump pulse.
In the lower arm, the laser with a 50% power component was firstly modulated into an optical pulse pair (38 ns and 40 ns) by the second electric-optic modulator (EOM2), which was driven by the arbitrary function generator (AFG). Then, an erbium-doped fiber amplifier (EDFA) was utilized to amplify the optical pulse pair, providing a 500 mW peak power. The pump pulse pair was obtained and injected into the FUT from the other end through an optical circulator. The frequency difference between the pump and probe waves was scanned from 10.6 GHz to 11 GHz, covering the sensing fiber Brillouin frequency shift (BFS), with a frequency step of 4 MHz. As a result, the pump and probe waves interacted in the FUT via stimulated Brillouin scattering, and then the amplified probe wave was detected by a 350 MHz bandwidth photodetector (PD). Finally, the detected signal was collected by the data acquisition (DAQ) card with a sample rate of 2 GHz.
The DPP technique is a good candidate for overcoming the limited metric spatial resolution, limited by a non-instantaneous (10 ns) response time of the acoustic wave generation. The sub-meter spatial resolution offered by the DPP scheme is achieved based on the subtraction of two temporal traces using long pump pulse widths with slightly different durations. Here, 20 cm spatial resolution is obtained by 2 ns difference between the pump widths, and a high-frequency fitting accuracy is maintained due to a narrow spectrum with long pump pulses. Besides, the DPP scheme is simple and reliable, which is suitable for the field experiment in an extreme environment, especially marine.

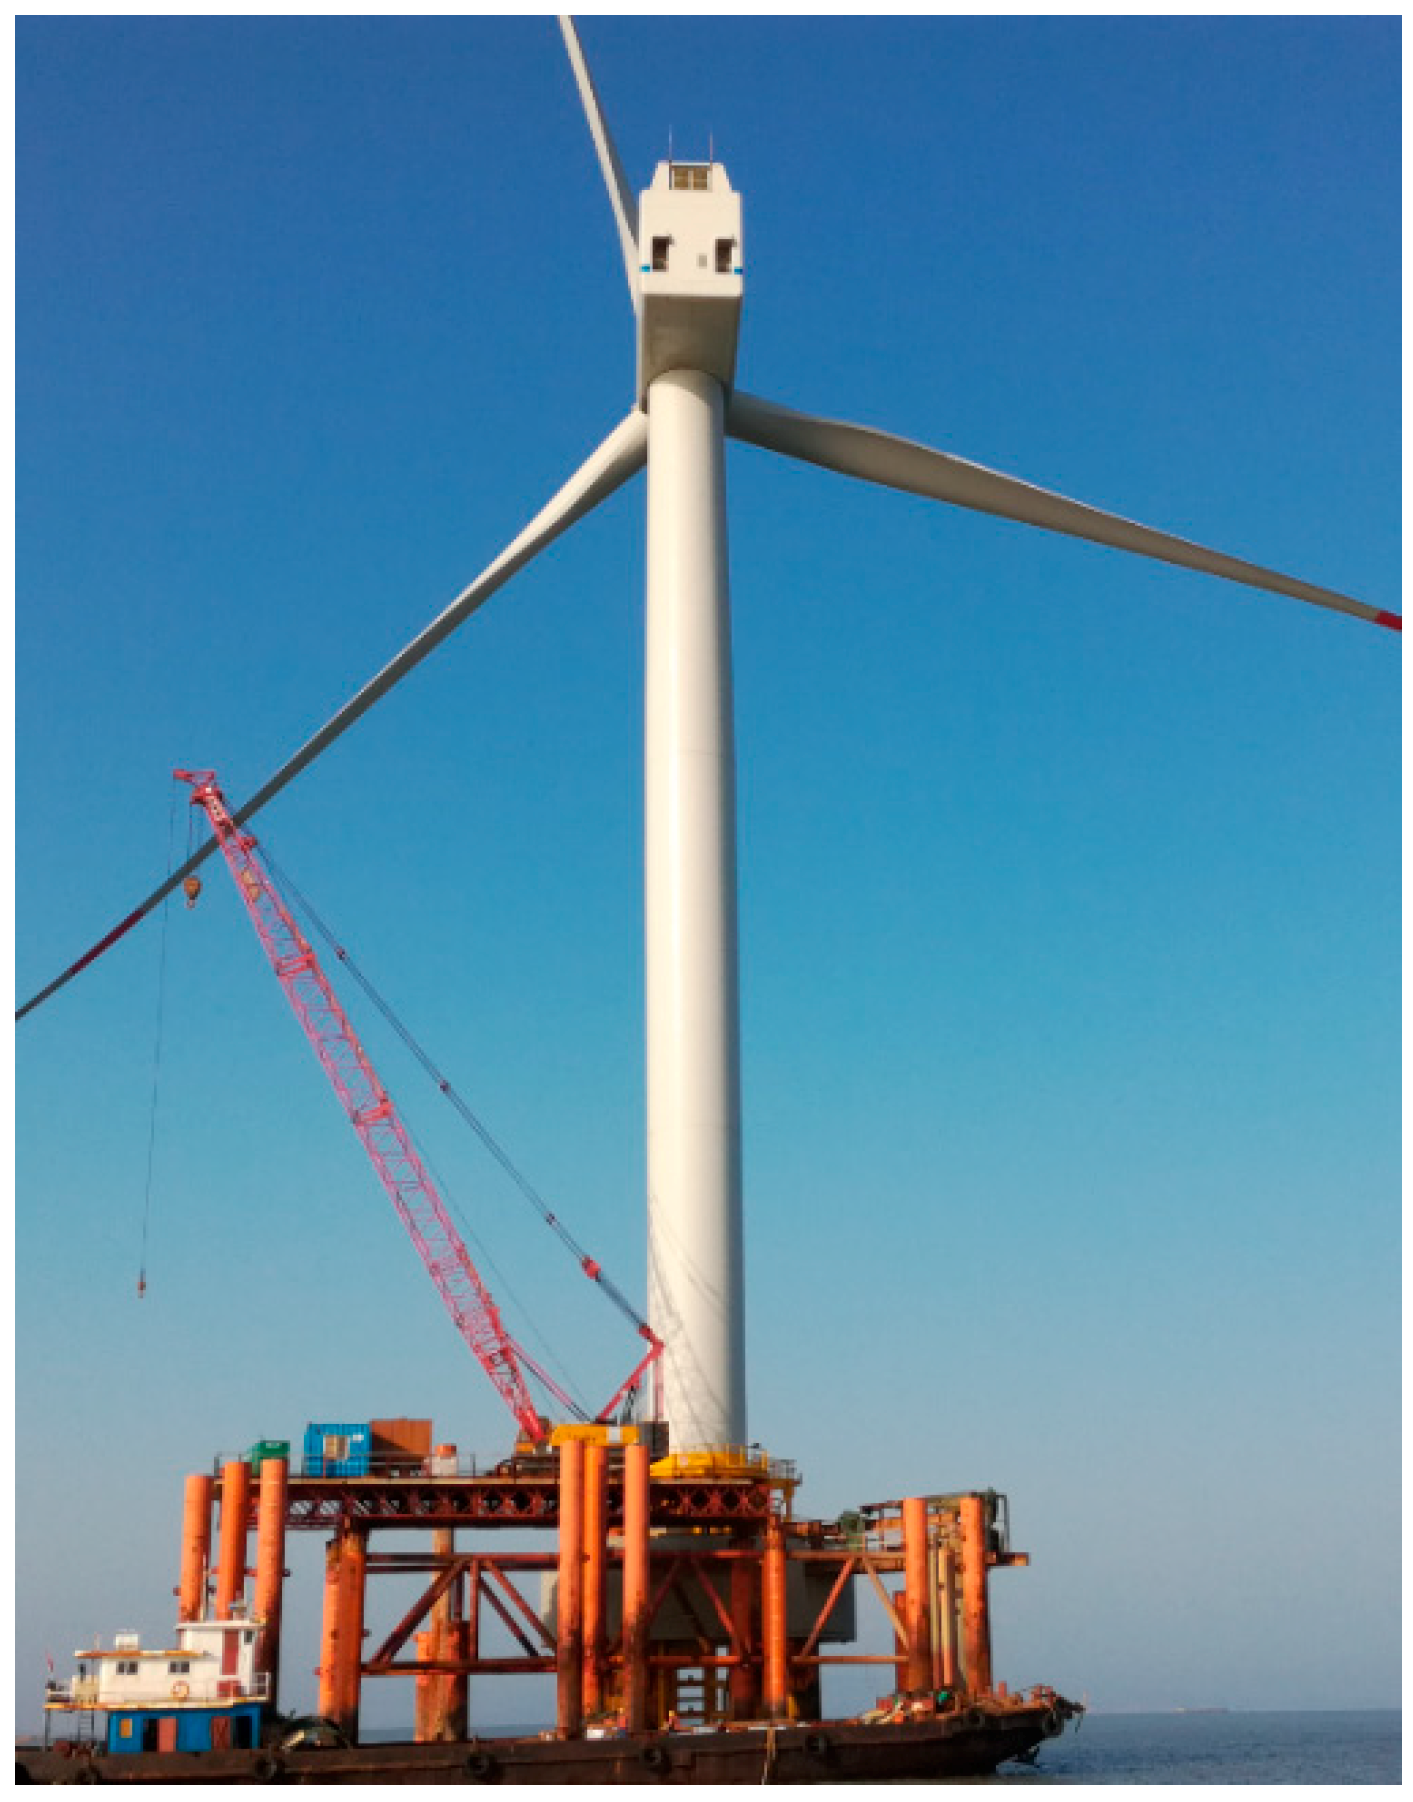
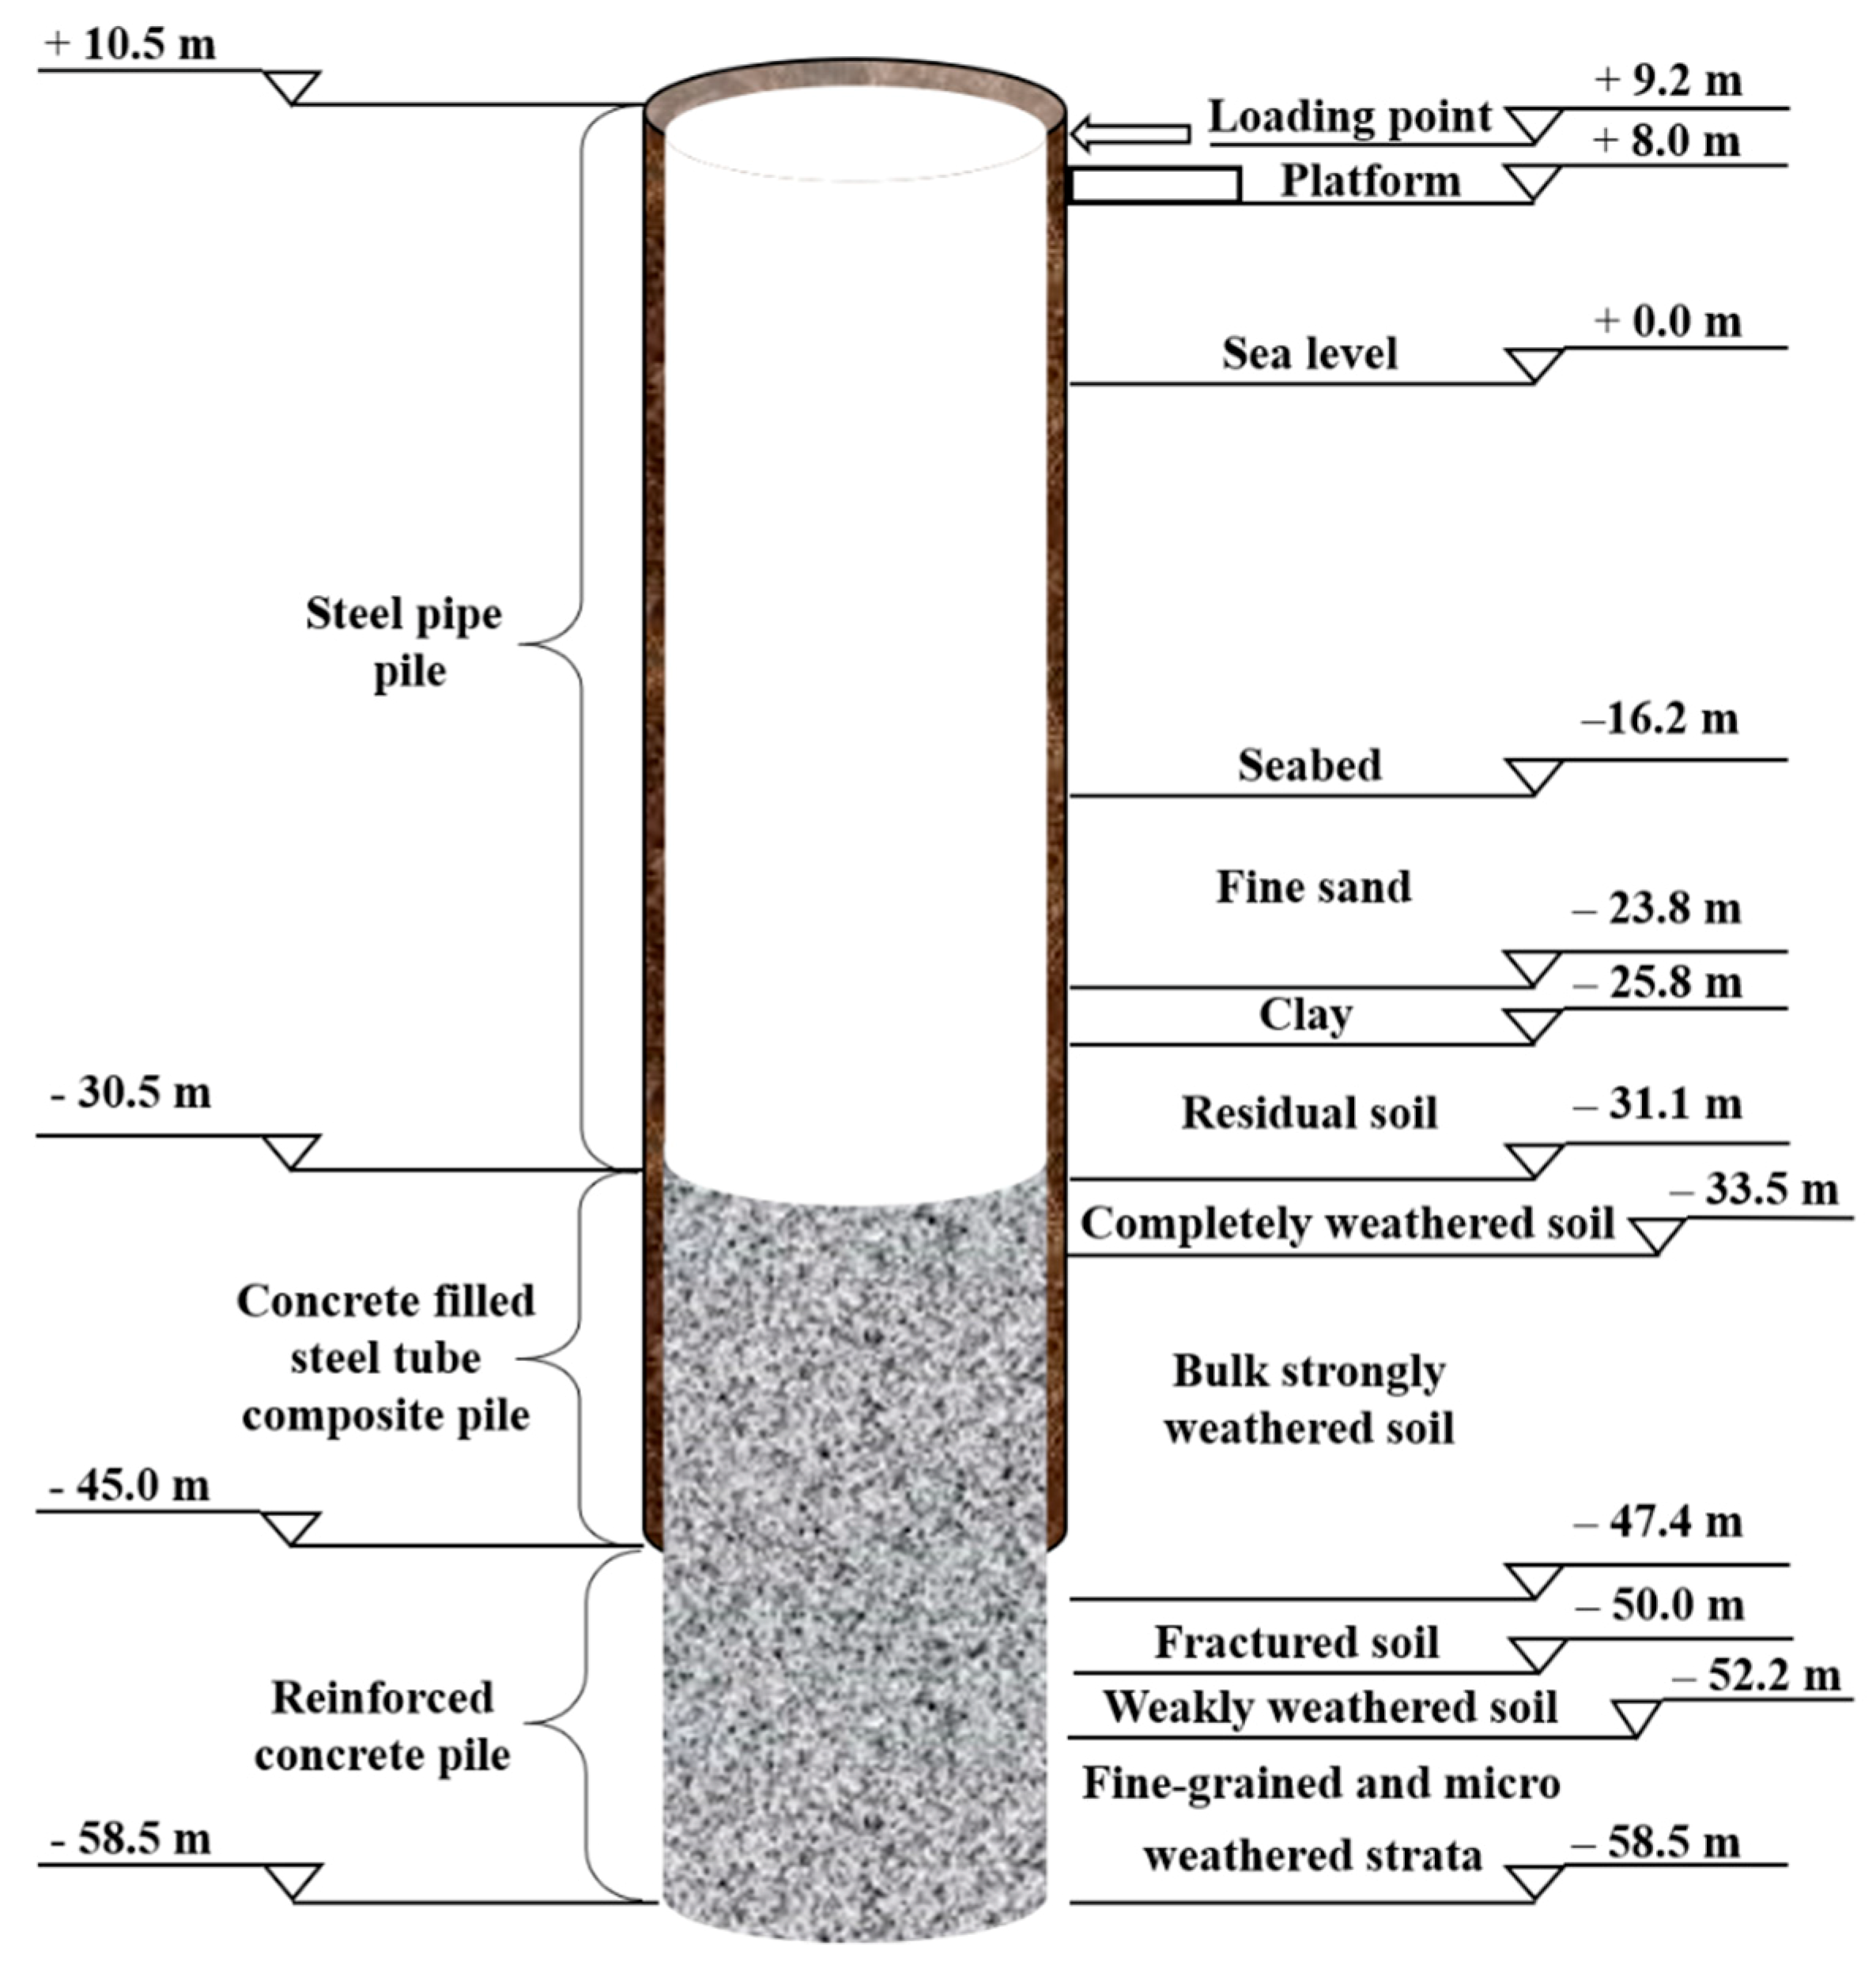
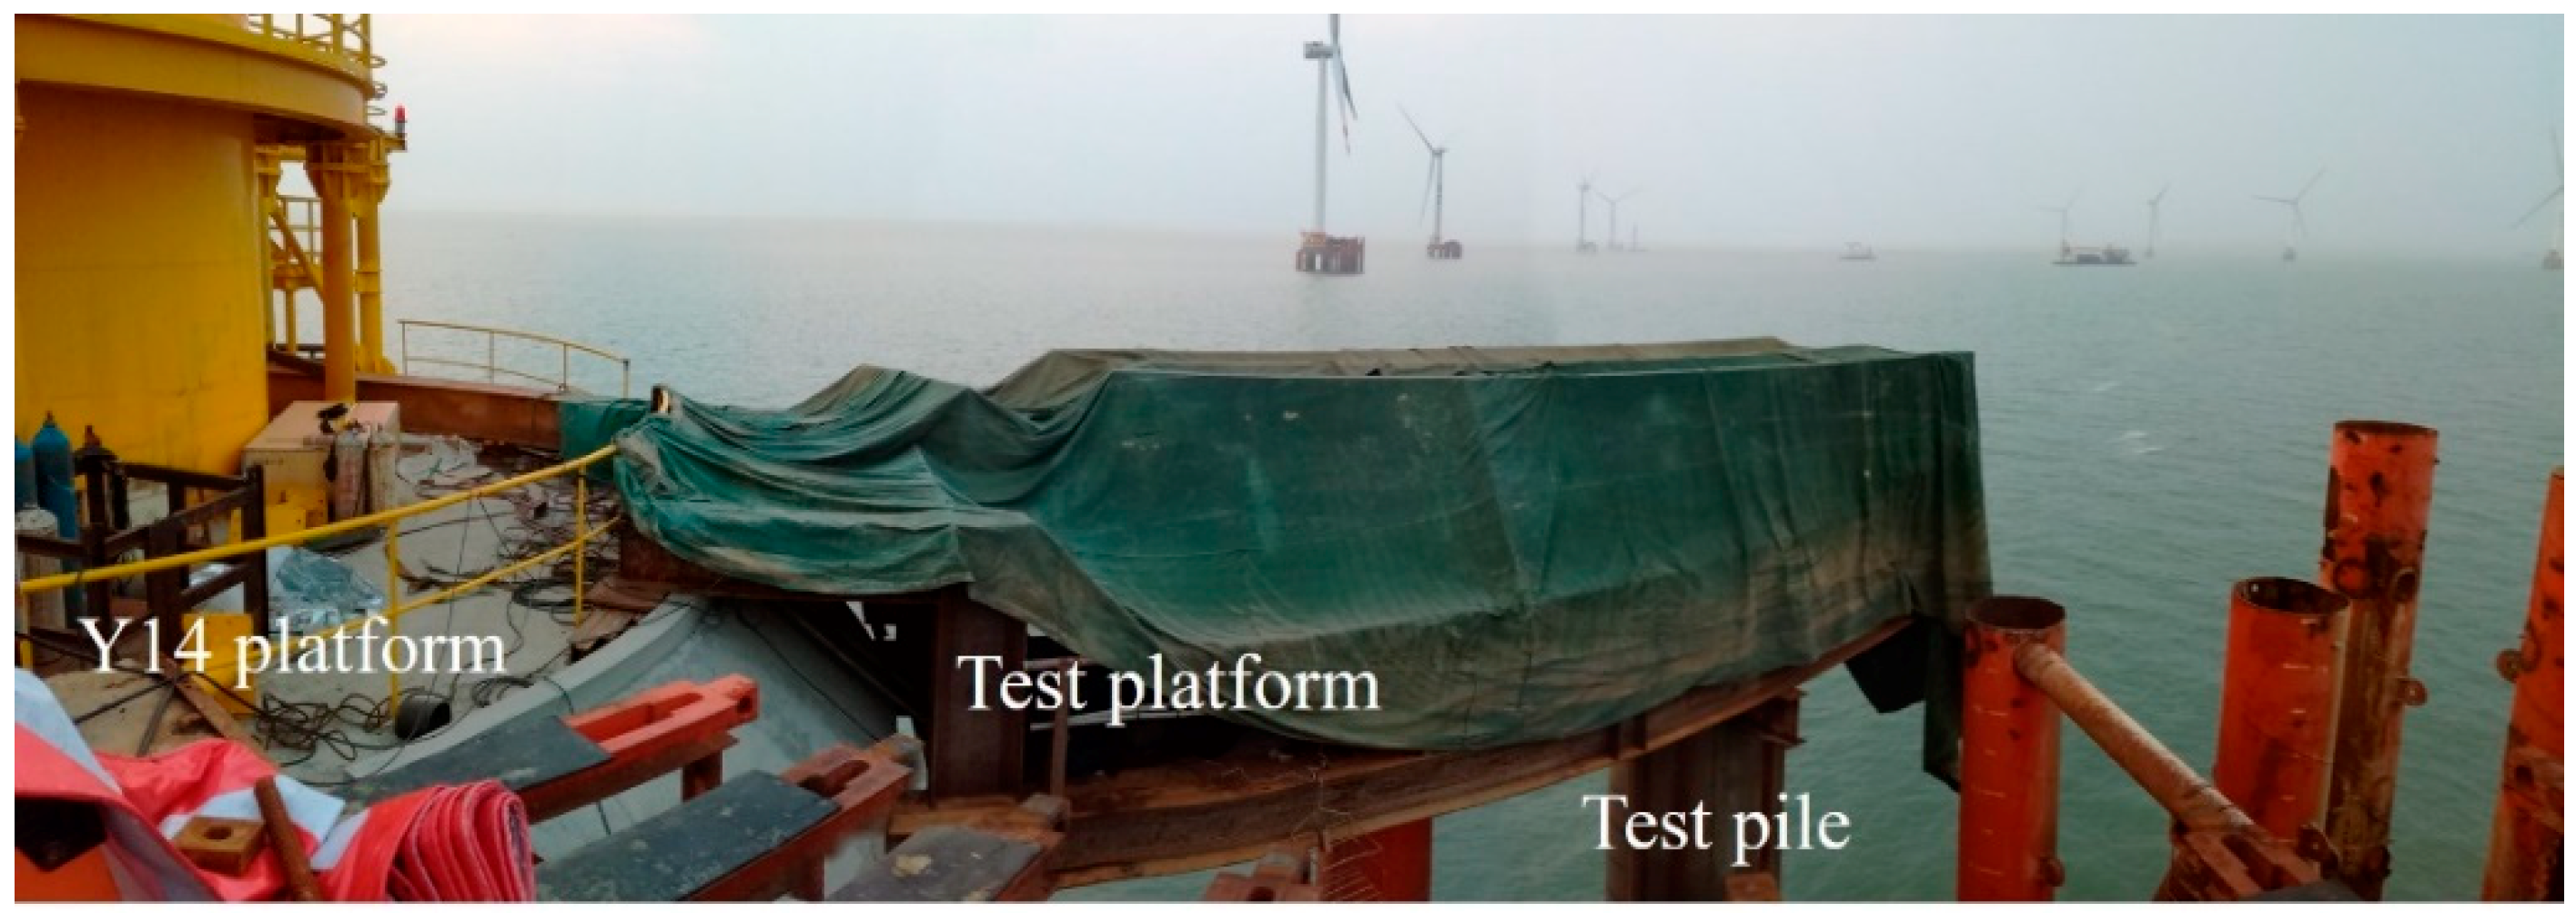
2.2. Engineering Profile

The test platform is located on the Y14 wind turbine which belongs to the Xinghua Bay Wind Farm in Fujian, China. As shown in Figure 2, the Y14 wind turbine is a DEW-G5000 produced by Dongfang Electric Corporation, China. This wind turbine has a rated power of 5000 kW, a hub height of 90 m, a rotor diameter of 140 m, and a total weight of 733.5 tons. The foundation of a Y14 wind turbine is composed of four pile foundations. In order to obtain the bearing capacity of the pile foundation, a test pile was made next to the Y14 platform, and the design and construction process is the same as the Y14 platform pile.
The test platform is located on the Y14 wind turbine. The entire pile is a concrete-filled steel pipe composite pile. Above the elevation of −30.5 m, the test pile is a steel pipe. At the elevation of −30.5 m, the test pile is filled with reinforced concrete. The length of the concrete-filled steel tube section is 14.5 m. At the elevation below −45 m, the pile is only reinforced concrete. The material of this steel pipe is Q345, and the dimensions are: length 55.5 m, diameter 2.0 m, and wall thickness 27.0 mm. The geological survey data are shown in Figure 3. The test platform is located at the elevation +8.0 m, and the horizontal loading point is located at the elevation +9.2 m.

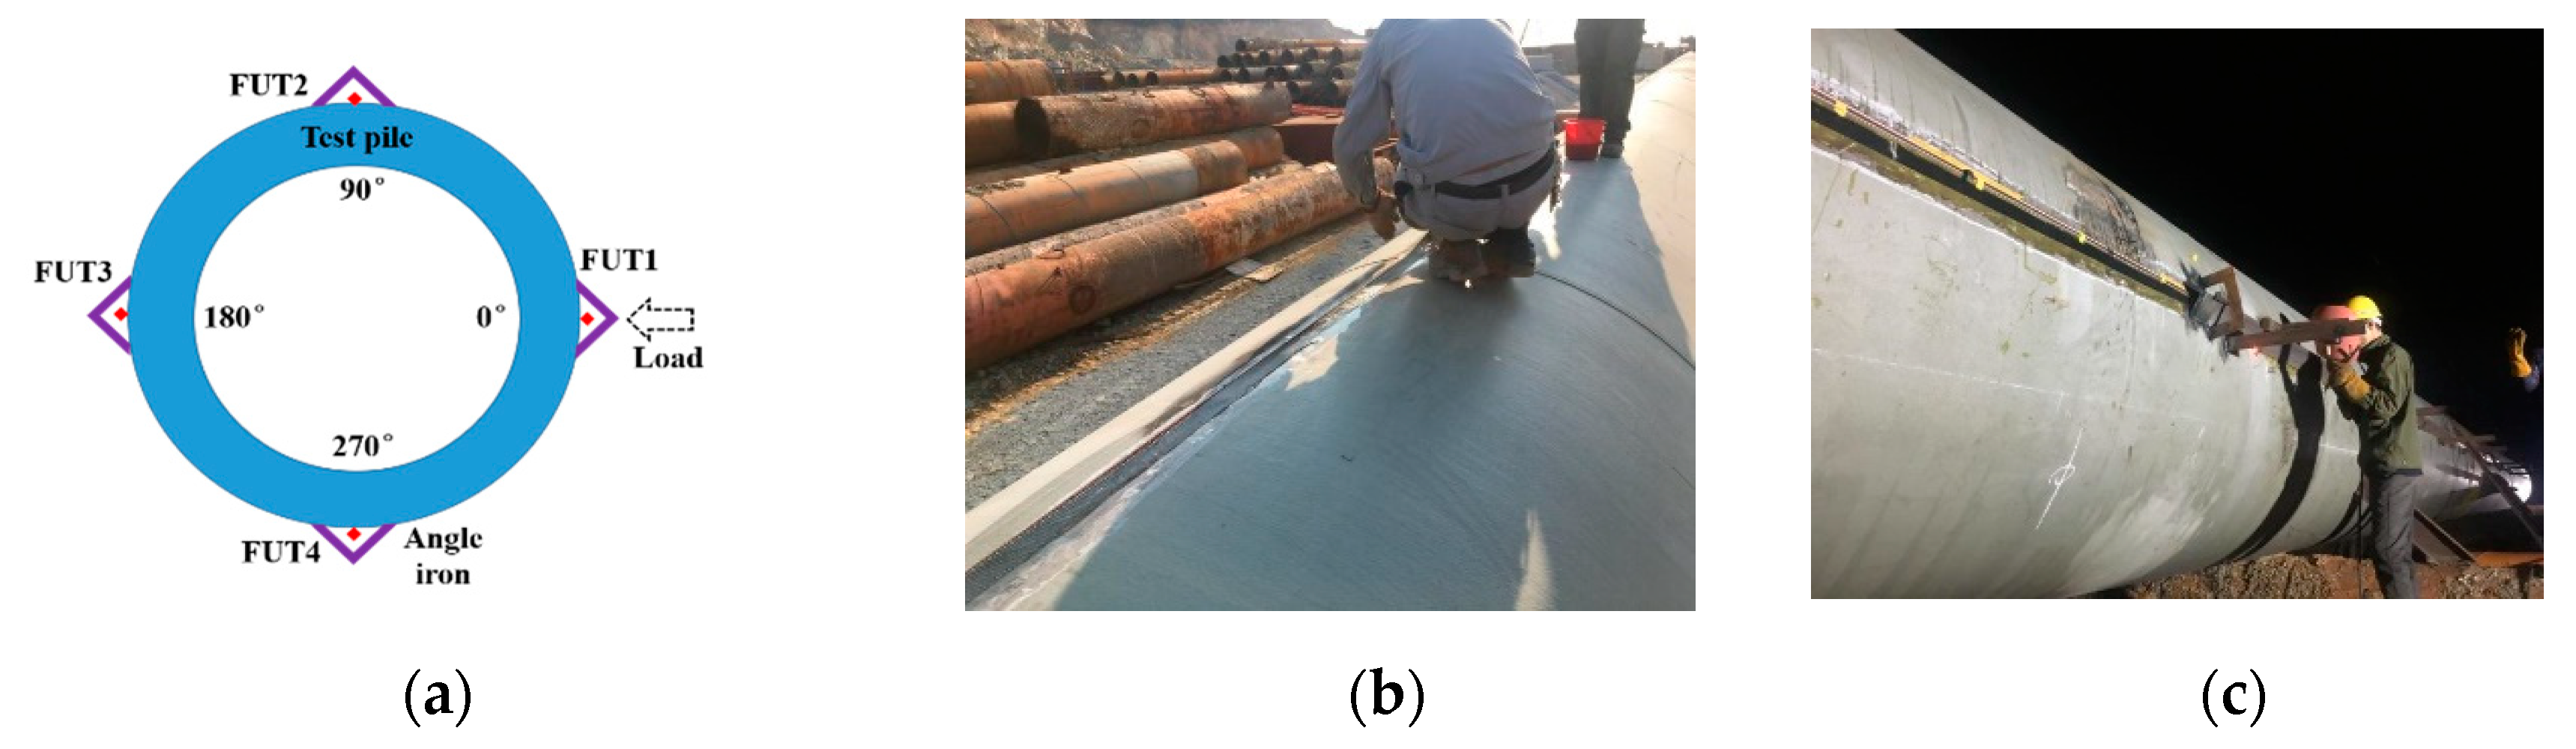
2.3. Fiber-Optic Installation

In the test, the single-mode strain sensing fiber with a diameter of 0.6 mm was used, and four fibers were arranged at an angle of 90° along the perimeter of the steel pile. The location of the DOFS are shown in Figure 4a and the DOFS are named FUT1, FUT2, FUT3, and FUT4. Due to the harsh environment in which the pile was located, only FUT1 and FUT3 survived in the final test. Epoxy rubber and carbon fiber cloth were adhered to the DOFS as shown in Figure 4b, and the angle iron was welded to the outer wall of the test pile in order to protect the DOFS, as shown in Figure 4c. The initial point elevation of the fiber strain measurement was +10.0 m, and the end point elevation was −43.3 m. Finally, the length of the measuring fiber was 53.3 m.

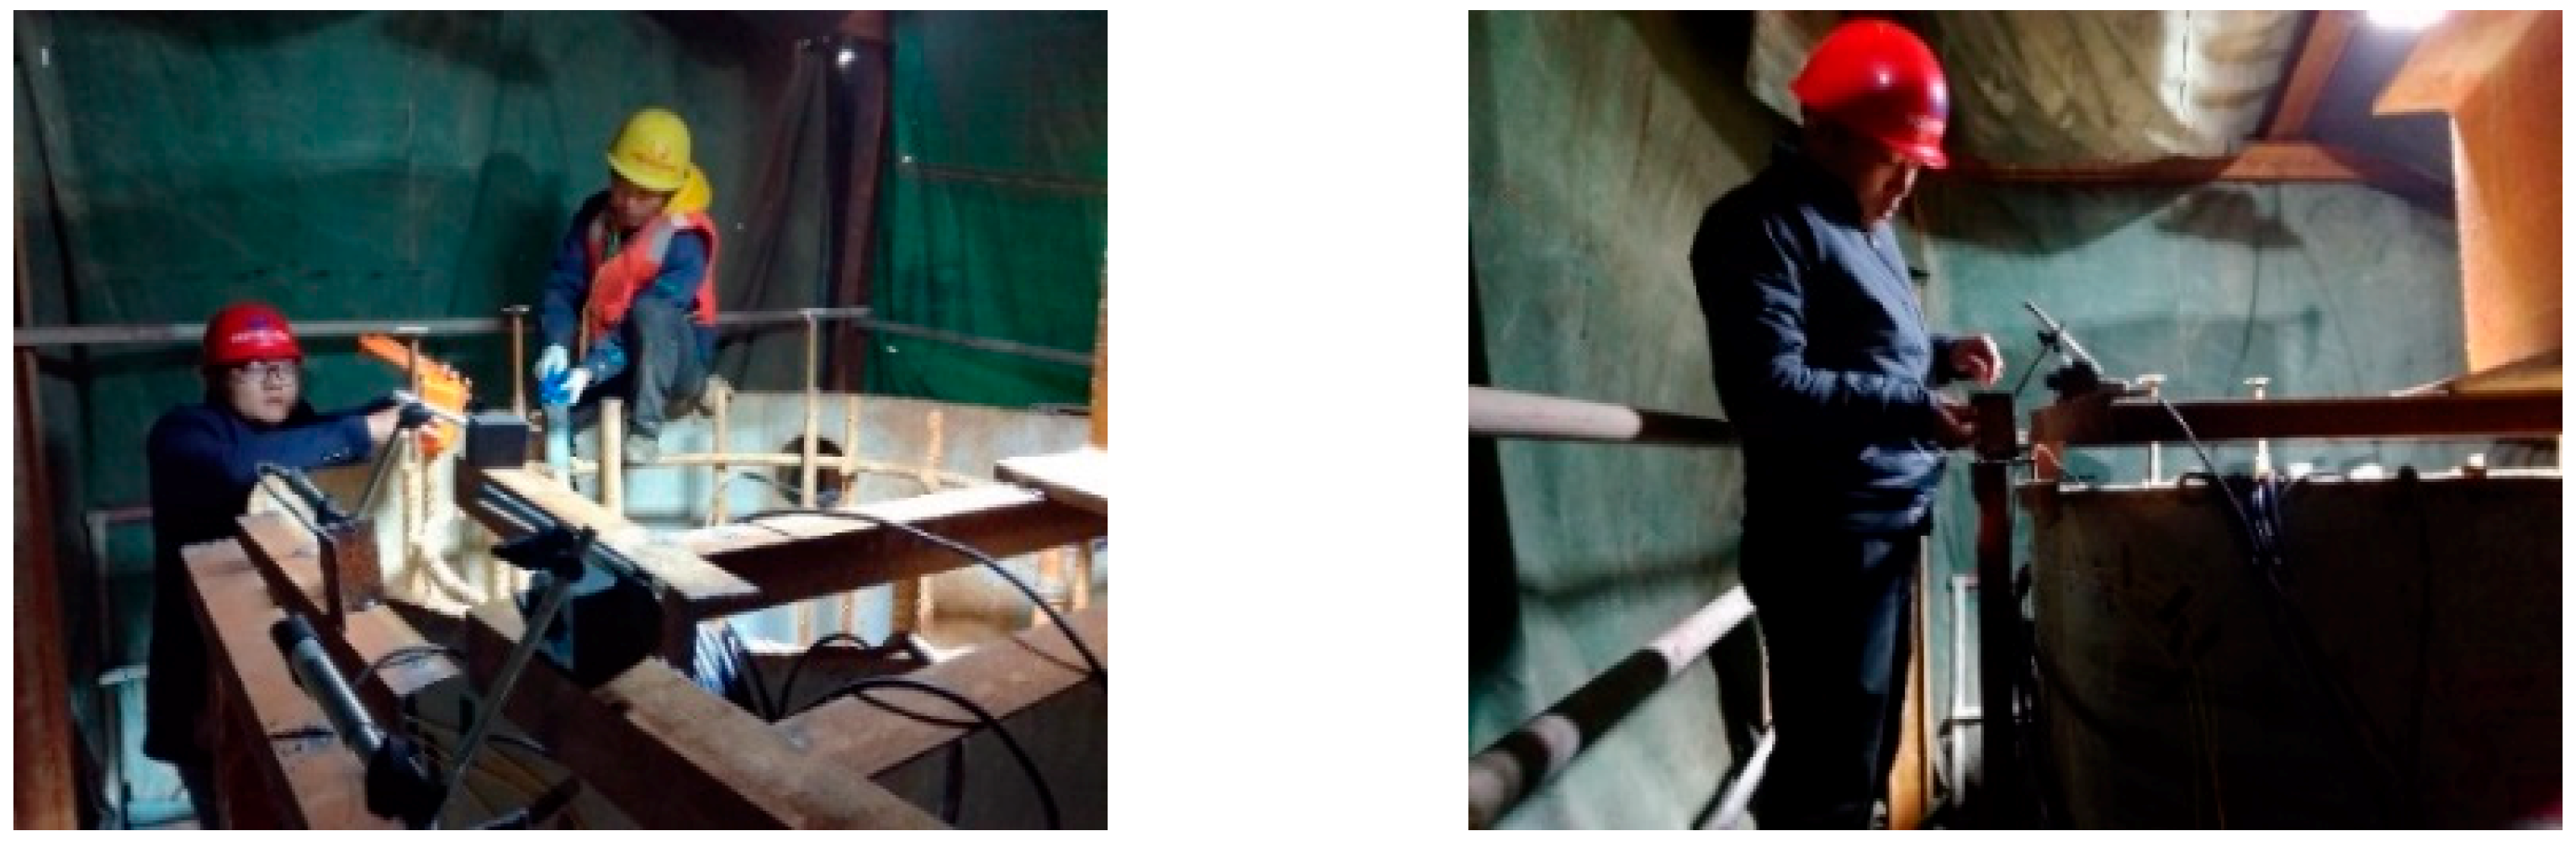
2.4. Experimental System

As shown in Figure 5, the entire experimental device was divided into three sections: test pile, horizontal load test reaction frames, and Y14 platform. The test pile had been driven into the soil according to the standard construction process. The Y14 platform was a well-built wind turbine platform. The experimental platform was fixed on the Y14 platform to ensure safety during the test.
On the test platform, there was a power supply, a loading device, and the DPP-BOTDA test system. The loading device was mainly one 100 t jack and a movable loading beam. Behind the jack, there was a fixed beam to provide counterforce support. The loading principle was that the jack directly applied the force to the movable loading beam, and the beam transmitted the force to the test pile. The direction of force was the connection direction of FUT1 and FUT3. The force point was located on the FUT1 side and the elevation was +9.2 m. The pulses used in the DPP-BOTDA test system were 40 ns and 38 ns, resulting in a 20 cm spatial resolution. The sampling rate of data points was 5 cm. During the experiment, the load was divided into 15 stages and the load increment was 60 kN, as shown in Table 1. For each load, the load stability time was 30 min to achieve complete stability. At each loading, the data were repeatedly collected three times, and the average value was taken as the data value of the current load.

3. Results and Discussion

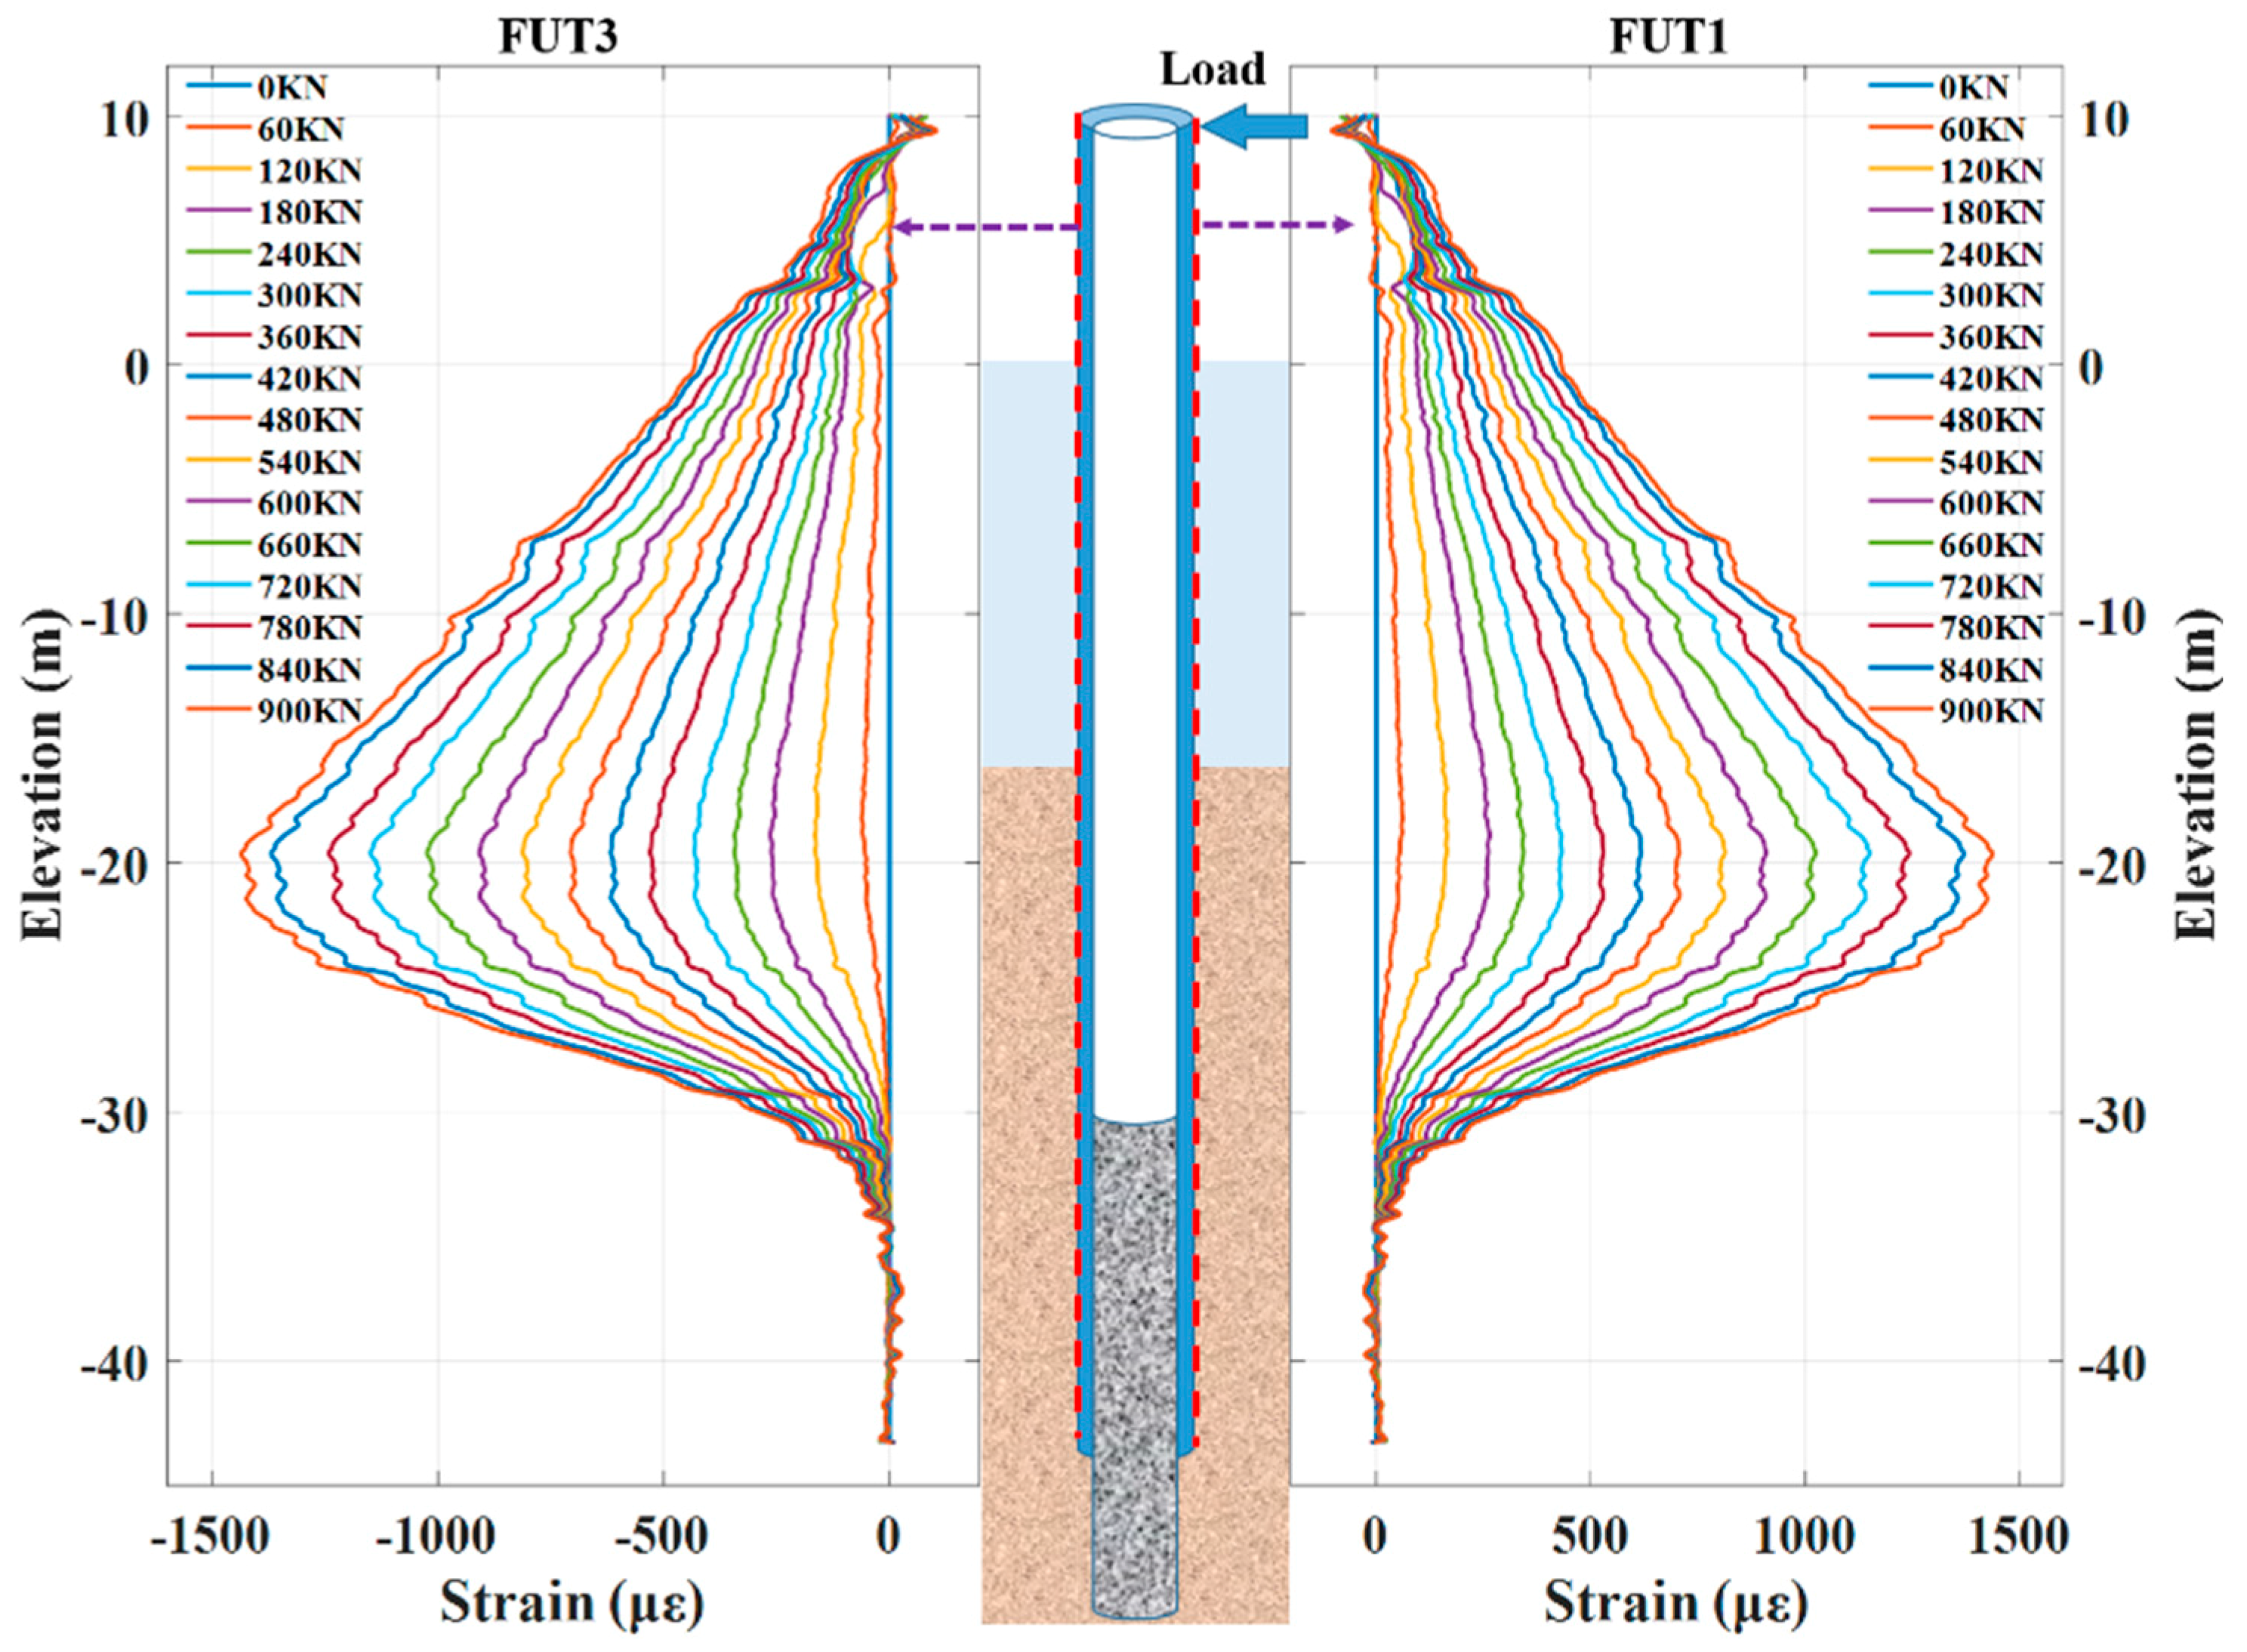
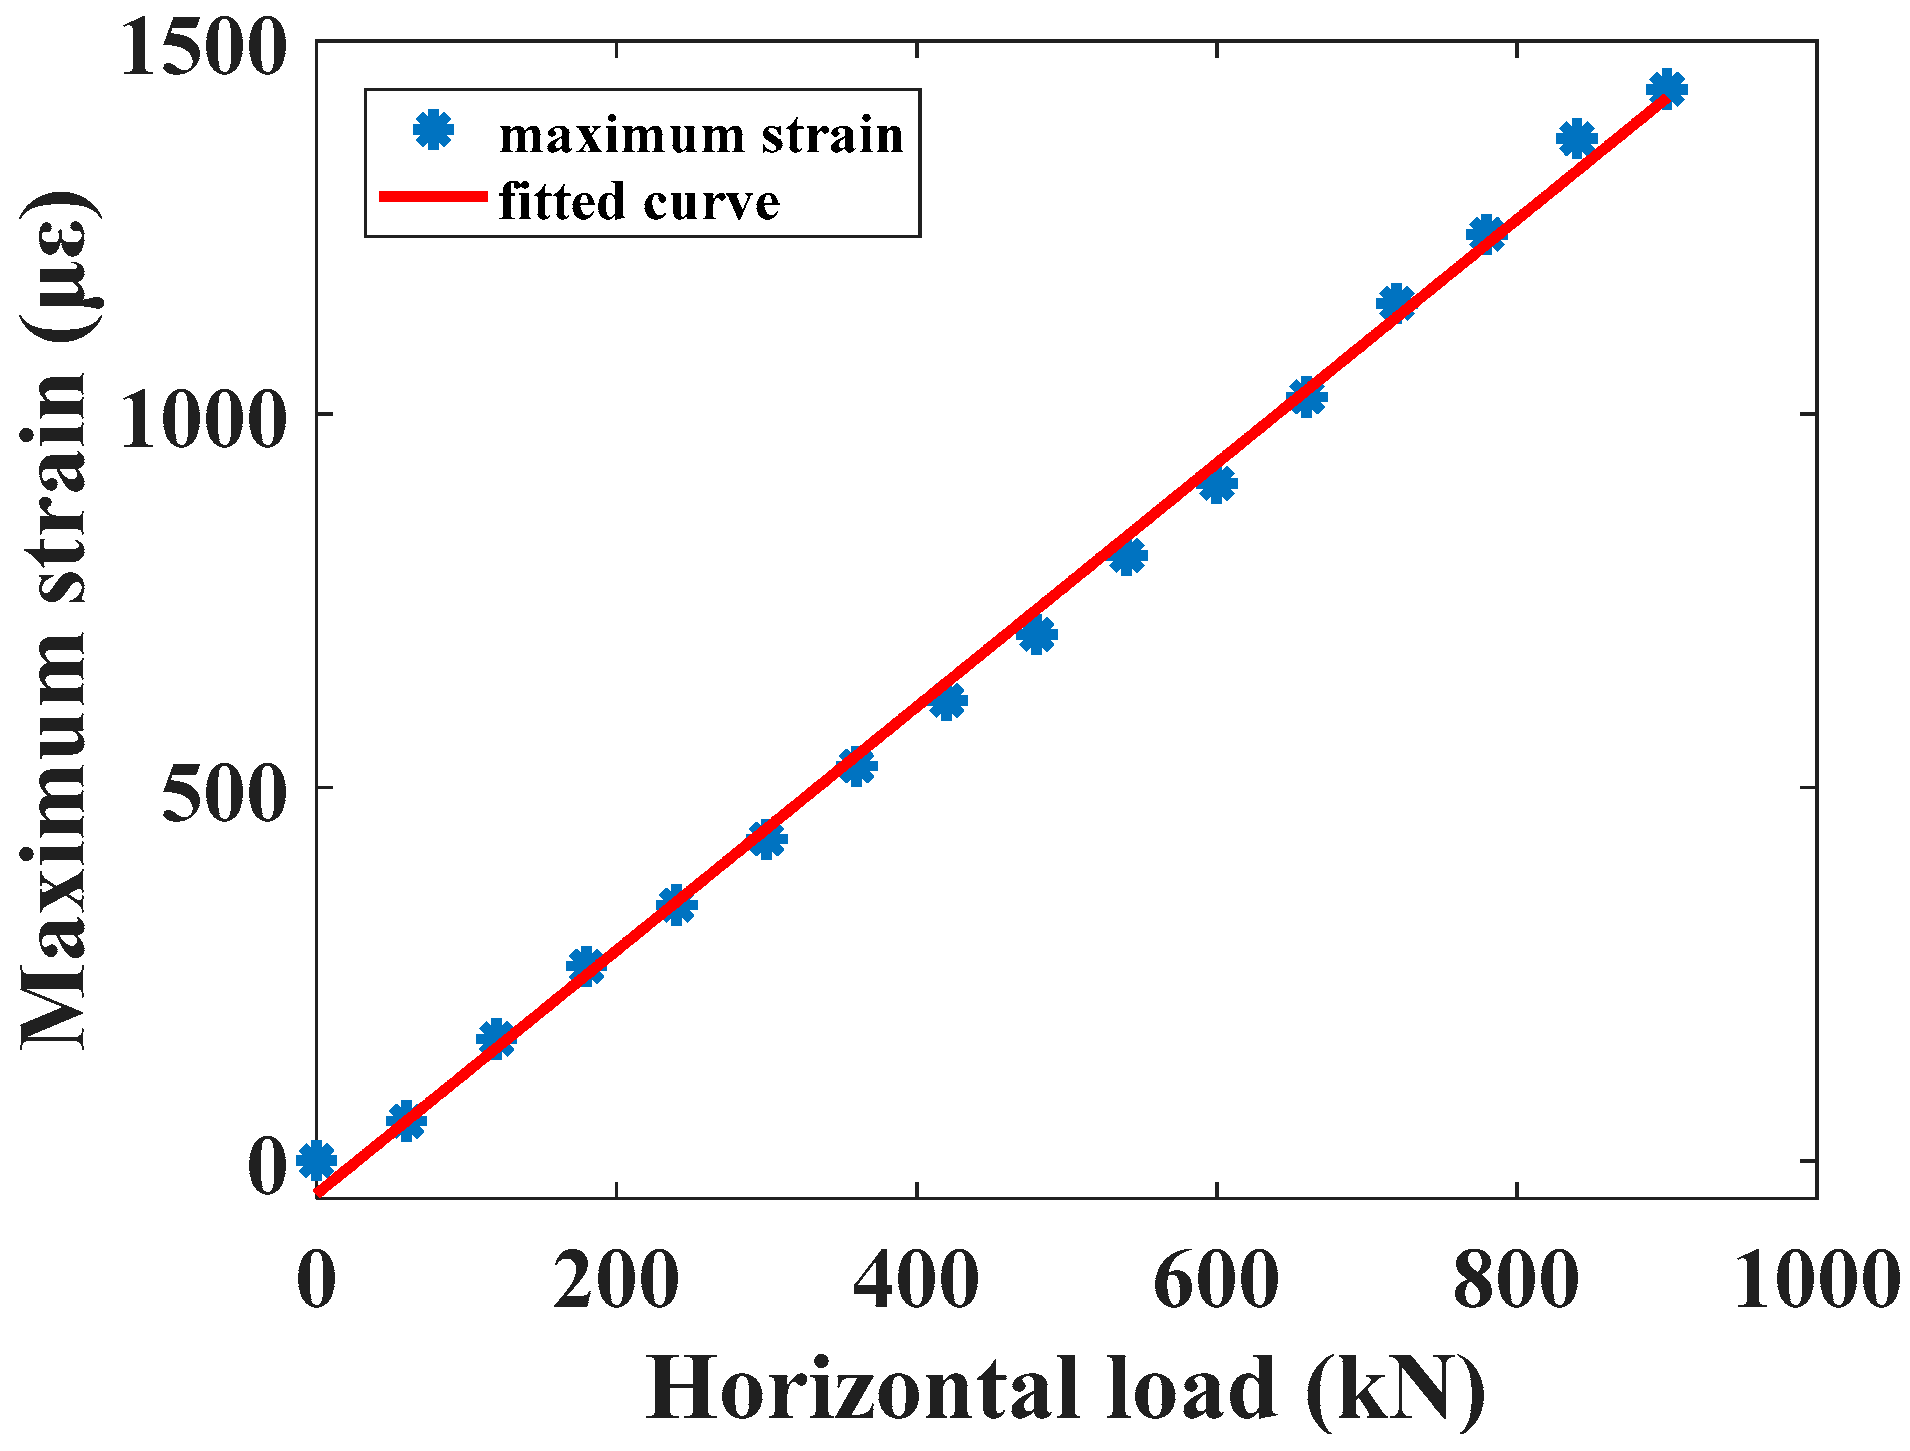
3.1. Distributed Strain Data

In this experiment, the load direction is the connection direction of FUT1 and FUT3, and the action point is located on the FUT1 side. The test pile is simplified to a fixed cantilever beam structure. So, the strain values of FUT1 and FUT3 are antisymmetric according to the force state of the pile. Based on this property, the BFS values caused by temperature can be calculated. The calculation equation is as follows:
Δ ( B F S T ) = 1 2 [ Δ ( B F S F U T 1 ) + Δ ( B F S F U T 2 ) ] ,
ε F U T 1 = [ Δ ( B F S F U T 1 ) Δ ( B F S T ) ] × 1000 / C s ,
ε F U T 3 = [ Δ ( B F S F U T 3 ) Δ ( B F S T ) ] × 1000 / C s ,
where Δ(BFST) is the BFS change value induced by temperature; Δ(BFSFUT1) and Δ(BFSFUT3) are the actual measured BFS change values of FUT1 and FUT3, respectively; εFUT1 and εFUT3 are the FUT1 and FUT3 strain values after removing temperature, respectively; and Cs is the strain coefficient—here, Cs is 0.0482 MHz/με.
The temperature-compensated strain values can be calculated by Equations (1)–(3). At the corresponding elevation, the strain values of FUT1 and FUT3 are shown in Figure 6. The FUT1 side is subjected to tensile stress and the FUT3 side is subjected to compressive stress. Above sea level, as the load increases, the strain values on both sides of FUT1 and FUT3 show large errors. The reason is that the received light is different on both sides during the test (12:50 p.m.–07:00 a.m.), which in turn affects the temperature and ultimately causes the different changes in the Brillouin frequency shift. However, this error does not affect the determination of the bearing capacity of the pile. The maximum strain value at the load of 900 kN was 1436 με, and the position was at −19.63 m. This position is in the fine sand layer. At the elevation of −35.0 m to −43.3 m, the strain values hardly changed with the load and were near 0 με. The reason is that, at the elevation of −30.5 m, the test pile was the tube filled with reinforced concrete. Then, the bending stiffness was dramatically enhanced, so the strain values were always small with the load increasing.
From the distributed strain values of the pile, the load and maximum strain (F-εmax) curve could be obtained, as shown in Figure 7. A linear fit was performed on the data in the figure, and the fitted results are shown in the solid red line. The R-square is 0.9986. The fitted results show that the maximum strain value of the pile was linearly related to the load, and the strain coefficient under load was 1.631 με/kN. The maximum stress was 295.8 MPa, which does not exceed the yield stress of Q345 steel. The stress ratio of 0.86 indicates that the pile was still in the elastic stage. Therefore, it can be concluded that the horizontal bearing capacity of this pile exceeds 900 kN, which satisfies the standard of horizontal load capacity of offshore wind turbines.

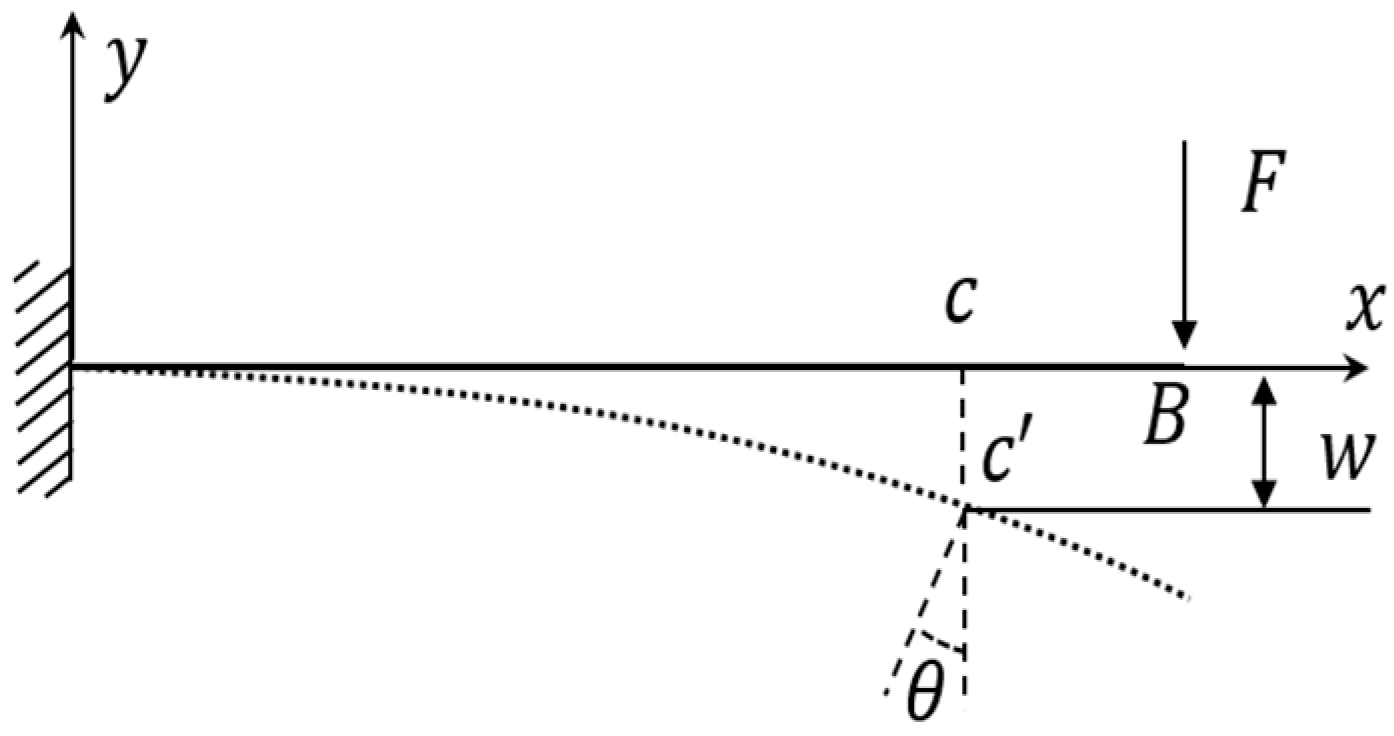
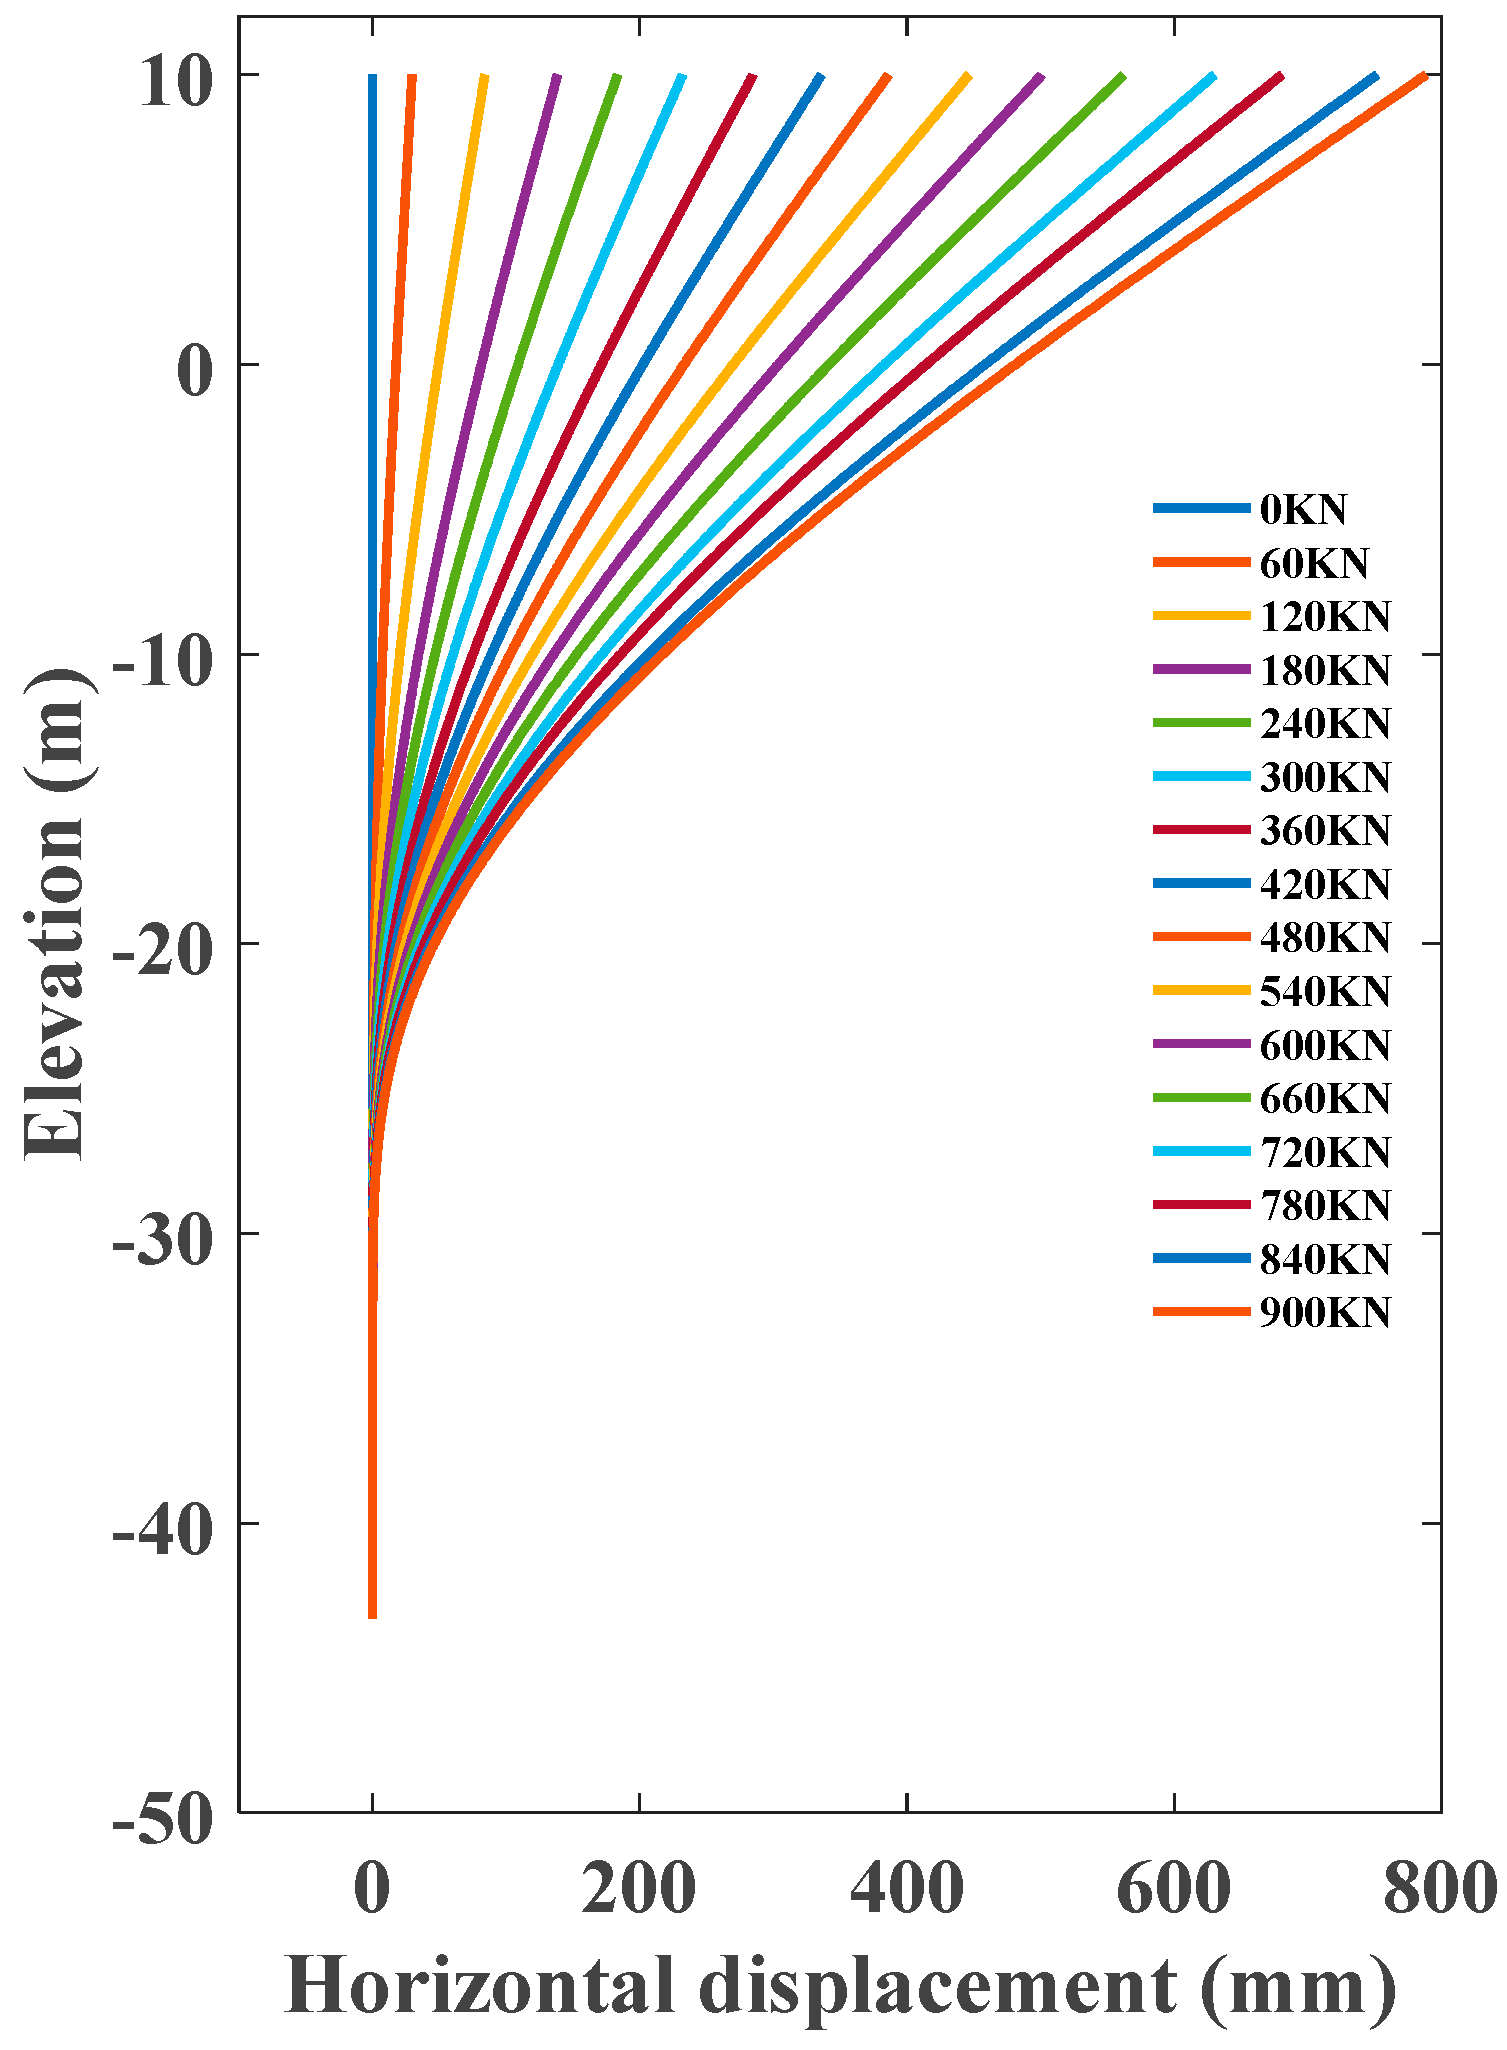
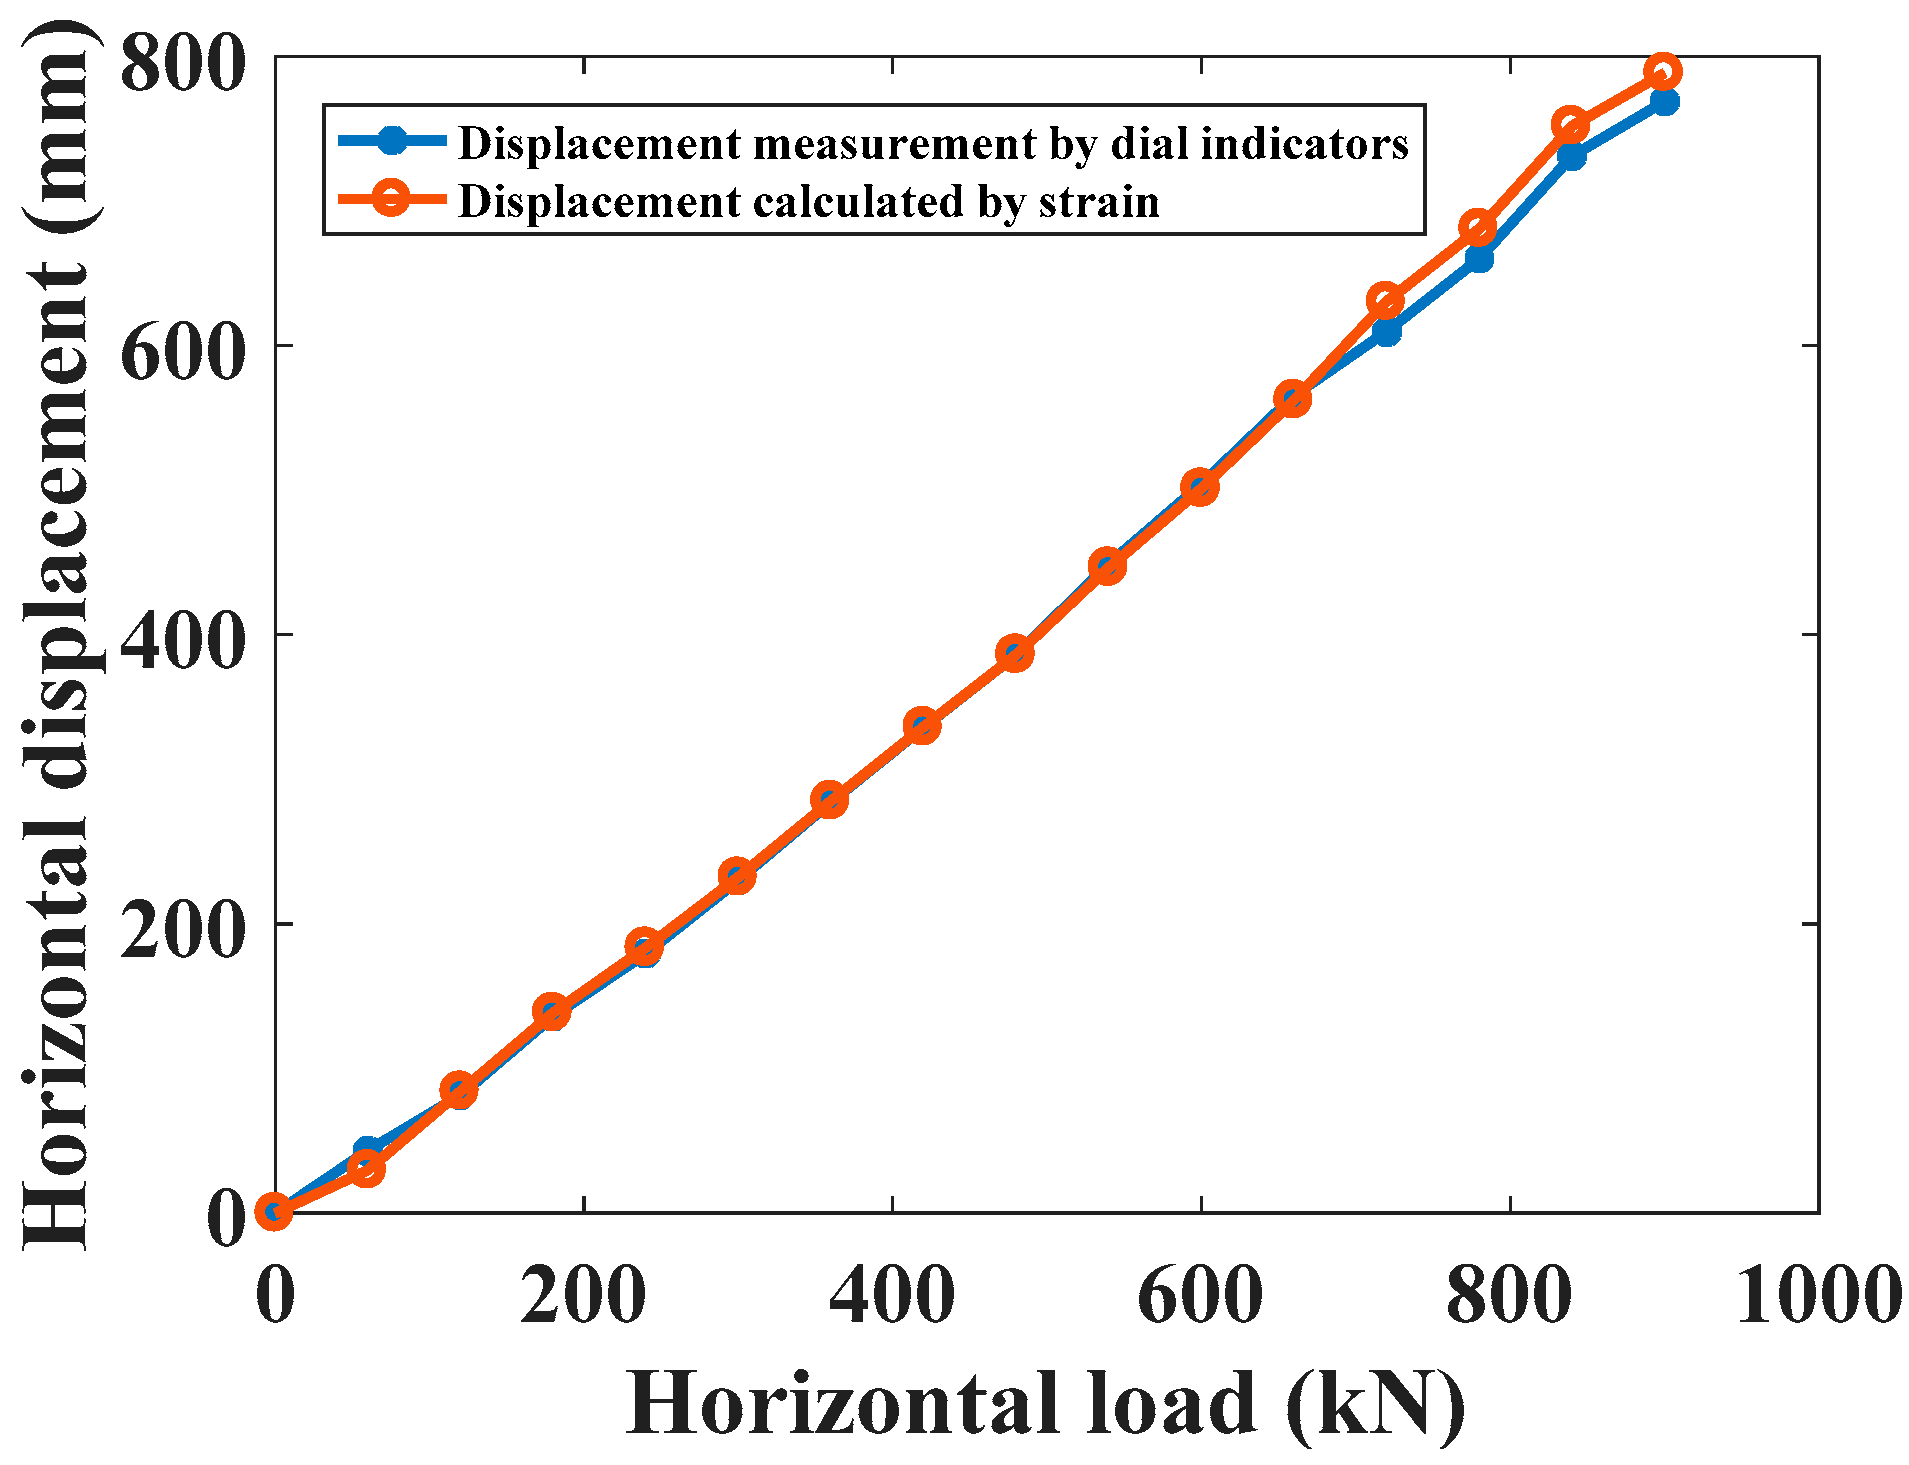
3.2. Distributed Displacement Data

The steel pipe pile can be simplified as a cantilever beam structure. According to the flat section assumption, after the microsegment beam is deformed, the left (m–m’) and right (n–n’) cross-sections in Figure 8 remain flat, but are rotated by an angle. The longitudinal strain at each point is equal where the neutral layer O1O2 is y, and the calculation equation of the strain can be obtained as in the Equation (4),
ε ( y 0 , x 0 ) = a b a b ¯ a b ¯ = ( ρ + y 0 ) d θ ρ d θ ρ d θ = y 0 ρ ,
where ε is the axial strain, ρ is the radius of curvature, is the central angle formed by the micro-section bending, x0 is the distance from the neutral axis to the starting point, and y0 is the distance from the neutral axis along the radius of curvature.
The equation for calculating the curvature is:
κ = | d α d l | = | d α / d x d l / d x | = | y 1 + ( y x ) 2 1 + ( y x ) 2 | = y x ( 1 + ( y x ) 2 ) 3 / 2 ,
where K is the curvature; x, y are the abscissa and ordinate of the point on the neutral axis in the Cartesian coordinate system, respectively; α is the angle between the tangent of the (x, y) point and the axis of abscissa; l is the arc length from the starting point to the (x, y) point along the neutral axis.
The relationship between curvature and radius is
κ = 1 ρ .
From Equations (4)–(6),
ε ( y 0 , x 0 ) y 0 = y x ( 1 + ( y x ) 2 ) 3 / 2 .
In the actual project, ( y x ) 2 can be ignored, then the relationship between displacement and strain is
y x = ε ( y 0 , x 0 ) y 0 .
As shown in Figure 9, the deflection of the pile is obtained by the second integral:
w = [ ε ( y 0 , x 0 ) d d x ] d x + C 1 x + C 2 ,
where w is the deflection and d is the radius of the steel pipe pile—here, d equals 1 m.
The boundary conditions of steel pipe piles are: x = 0, w = 0; x = 0, w’ = θ = 0. Then, the calculated C1 = 0, C2 = 0. Finally, the deflection equation of the steel pipe pile is:
w = [ ε ( y 0 , x 0 ) d d x ] d x
The strain data collected by the distributed optical fiber sensor are dense and continuous, and the distributed displacement curve of the pile was obtained by the second integral of the corresponding curve. The calculated displacement is shown in Figure 10. As the load increased, the absolute value of the displacement measured by the fiber increased. The force on the fiber at FUT1 was the tensile, and the displacement value was positive. The force on the fiber at FUT3 was the pressure, and the displacement value was negative. The maximum displacement occurred at the uppermost end of the fiber, the elevation was +10.0 m, and the maximum displacement generated under the 900 kN load was 0.79 m.
During the test, the horizontal displacement of the pile was measured at the elevation of +10.5 m by the dial indicators, as shown in Figure 11. The dial indicators base was fixed to the reference beam, and its direction parallel to horizontal load direction. The horizontal displacement data collected at different load levels is shown in Figure 12. In the figure, the blue curve is the data collected by the dial indicators, and the red curve is the displacement data calculated by the distributed strain. It can be seen from the figure that the horizontal displacement obtained by the two methods was very close. The ratio coefficient between the displacement of the pile top and load was 0.9136 mm/kN.
To further verify the accuracy of distributed displacement calculated by the DPP-BOTDA, the error value was analyzed by the MAPE method. The calculation equation for MAPE is:
M A P E = 1 n t = 1 n | y t y ^ t | y t ,
where yt is the true value as comparison, y ^ t is the value to be compared, and n is the sample capacity.
Finally, the calculated MAPE value was 0.03548. The result shows that the full-scale distributed displacement data of the steel pipe pile calculated by distributed strain data were accurate and credible.

4. Conclusions

In this paper, the distribution strain values along the length of the pile under each load were obtained. These distributed strain values can intuitively reflect the overall deformation of the test pile. According to the F-εmax curve, the horizontal bearing capacity of the pile foundation can be judged. In this test, the maximum strain at the load of 900 kN was 1436 με, and the position was at −19.63 m. Through the linear relationship between the load and the maximum strain, we can get a strain coefficient under a load of 1.631 με/kN. The maximum stress was 295.8 MPa, which did not exceed the yield stress of Q345 steel. The stress ratio of 0.86 indicates that the pile was still in the elastic stage, and this pile-bearing capacity can reach 900 kN, which satisfies the standard of horizontal load capacity of offshore wind turbines. Secondly, the distributed displacement values of the test pile are calculated by the strain values. The maximum displacement generated under the 900 kN load was 0.79 m. Finally, in order to verify the true reliability, the calculated displacement data were compared with the measured displacement data by dial indicators. The MAPE value was only 0.03548.
Compared with traditional electrical strain sensing systems, the transmission signal of distributed optical fiber sensing technology is a light wavelength signal, which is resistant to corrosion and lightning and subsequently is not subject to meteorological conditions or geographical locations. For the similar wind turbines and different types of piles, such as steel pipe piles, reinforced concrete piles, and steel-concrete piles, due to the similar force characteristics in the soil, this method is also applicable to the test of their bearing capacity. However, the DPP-BOTDA technology needs an optical circuit, and the optical fiber may be damaged during the piling process. So, the protection and survival rate of optical fiber deserves attention. We believe that the proposed DPP-BOTDA can provide accurate distributed measurements for many offshore wind turbine pile foundations.

Author Contributions

Z.Z. (Data curation, Investigation, Writing—original draft preparation); P.G. (Data curation, Investigation); J.X. (Validation, Formal analysis); B.W. (Formal analysis); H.L. (Supervision, Writing—Review, Editing, and Validation); Y.D. (Supervision, Funding acquisition, Writing—Review, Editing, and Validation). All authors have read and agreed to the published version of the manuscript.

Funding

This work was funded by the National Key Scientific Instrument and Equipment Development Project of China 2017YFF0108700; National Natural Science Foundation of China 61575052. Photographs in this paper were taken by authors.

Conflicts of Interest

The authors declare no conflict of interest.

References

  1. Aziz, H.; Hanifah, K.; Kai, L. Innovation in instrumented test piles in Malaysia: Application of global strain extensometer (GloStrExt) method for bored piles in Malaysia. Bull. Inst. Eng. Malays. 2005, 11, 10–19. [Google Scholar]
  2. Battista, N.; Kechavarzi, C.; Seo, H.; Soga, H.; Pennington, S. Distributed fibre optic sensors for measuring strain and temperature of cast-in-situ concrete test piles. In Proceedings of the International Conference on Smart Infrastructure and Construction (ICSIC), Cambridge, UK, 27–29 June 2016. [Google Scholar]
  3. Mohamad, H.; Bennett, P.J.; Soga, K.; Mair, R.J.; Bowers, K. Behaviour of an old masonry tunnel due to tunnelling-induced ground settlement. Geotechnique 2010, 60, 927–938. [Google Scholar] [CrossRef]
  4. Horvat, M.; Jambrosic, K.; Domitrovic, H. Monitoring Twin Tunnel Interaction Using Distributed Optical Fiber Strain Measurements. J. Geotech. Geoenviron. Eng. 2012, 138, 957–967. [Google Scholar]
  5. Xu, J.; Dong, Y.; Zhang, Z.; Li, S.; He, S.; Li, H. Full scale strain monitoring of a suspension bridge using high performance distributed fiber optic sensors. Meas. Sci. Technol. 2016, 27, 124017. [Google Scholar] [CrossRef]
  6. Minardo, A.; Bernini, R.; Amato, L.; Zeni, L. Bridge monitoring using Brillouin fiber-optic sensors. IEEE Sens. J. 2011, 12, 145–150. [Google Scholar] [CrossRef]
  7. Yoon, H.J.; Song, K.Y.; Choi, C.; Na, H.S.; Kim, J.S. Real-Time Distributed Strain Monitoring of a Railway Bridge during Train Passage by Using a Distributed Optical Fiber Sensor Based on Brillouin Optical Correlation Domain Analysis. J. Sens. 2016, 2016, 9137531. [Google Scholar] [CrossRef] [Green Version]
  8. Liu, J.; Wang, Y.; Lu, Y.; Wei, J.; Kanungo, D.P. Application of Distributed Optical Fiber Sensing Technique in Monitoring the Ground Deformation. J. Sens. 2017, 2017, 6310197. [Google Scholar] [CrossRef]
  9. Pelecanos, L.; Soga, K.; Elshafie, M.; Battista, N.; Kechavarzi, C.; Gue, C.; Ouyang, Y.; Seo, H. Distributed Fibre Optic Sensing of Axially Loaded Bored Piles. J. Geotech. Geoenviron. Eng. 2018, 144, 04017122. [Google Scholar] [CrossRef] [Green Version]
  10. Pelecanos, L.; Soga, K.; Chunge, M.; Ouyang, Y.; Kwan, V.; Kechavarzi, C.; Nicholson, D. Distributed fibre-optic monitoring of an Osterberg-cell pile test in London. Geotech. Lett. 2017, 7, 152–160. [Google Scholar] [CrossRef] [Green Version]
  11. Lu, Y.; Shi, B.; Wei, G.; Chen, S.; Zhang, D. Application of a distributed optical fiber sensing technique in monitoring the stress of precast piles. Smart Mater. Struct. 2012, 21, 115011. [Google Scholar] [CrossRef]
  12. Acikgoz, S.; Pelecanos, L.; Giardina, G.; Aitken, J.; Soga, K. Distributed sensing of masonry vault during nearby piling. Struct. Control Health Monit. 2016, 24, e1872. [Google Scholar] [CrossRef] [Green Version]
  13. Mizuno, Y.; Hayashi, N.; Fukuda, H.; Song, K.Y.; Nakamura, K. Ultrahigh-speed distributed Brillouin reflectometry. Light Sci. Appl. 2016, 5, 16184. [Google Scholar] [CrossRef] [Green Version]
  14. Hong, C.; Zhang, Y.; Liu, L. Application of distributed optical fiber sensor for monitoring the mechanical performance of a driven pile. Measurement 2016, 88, 186–193. [Google Scholar] [CrossRef]
  15. Zhou, D.; Dong, Y.; Wang, B.; Pang, C.; Ba, D.; Zhang, H.; Lu, Z.; Li, H.; Bao, X. Single-shot BOTDA based on an optical chirp chain probe wave for distributed ultrafast measurement. Light Sci. Appl. 2018, 7, 32. [Google Scholar] [CrossRef]
  16. Bersan, S.; Bergamo, O.; Palmieri, L.; Schenato, L.; Simonini, P. Distributed strain measurements in a CFA pile using high spatial resolution fibre optic sensors. Eng. Struct. 2018, 160, 554–565. [Google Scholar] [CrossRef]
  17. Monsberger, C.; Woschitz, H.; Hayden, M. Deformation measurement of a driven pile using distributed fibre-optic sensing. J. Appl. Geod. 2016, 10, 61–69. [Google Scholar] [CrossRef]
  18. Dong, Y.; Zhang, H.; Chen, L.; Bao, X. 2 cm spatial-resolution and 2 km range Brillouin optical fiber sensor using a transient differential pulse pair. Appl. Opt. 2012, 51, 1229–1235. [Google Scholar] [CrossRef]
  19. Kishida, K.; Li, C.H. Pulse pre-pump-BOTDA technology for new generation of distributed strain measuring system. Struct. Health Monit. Intell. Infrastruct. 2005, 1, 471–477. [Google Scholar]
  20. Brown, A.W.; Colpitts, B.G.; Brown, K. Dark-pulse Brillouin optical time-domain sensor with 20-mm spatial resolution. J. Lightwave Technol. 2007, 25, 381–386. [Google Scholar] [CrossRef]
  21. Foaleng, S.M.; Tur, M.; Beugnot, J.C.; Thévenaz, L. High spatial and spectral resolution long-range sensing using Brillouin echoes. J. Lightwave Technol. 2011, 28, 2993–3003. [Google Scholar] [CrossRef]
  22. Li, W.; Bao, X.; Li, Y.; Chen, L. Differential pulse-width pair BOTDA for high spatial resolution sensing. Opt. Express. 2008, 16, 21616–21625. [Google Scholar] [CrossRef]
Figure 1. Experiment setup of the differential pulse pair Brillouin optical time-domain analysis (DPP-BOTDA). EOM, electro-optic modulator; MG, microwave generator; FBG, fiber Bragg grating; PS, polarization scrambler; OI, optical isolator; AFG, arbitrary function generator; EDFA, erbium-doped fiber amplifier; PD, photodetector; DAQ, data acquisition.
Applsci 10 00492 g001
Figure 2. DEW-G5000 wind turbine in position Y14.
Applsci 10 00492 g002
Figure 3. Test pile and geological survey data at different elevations.
Applsci 10 00492 g003
Figure 4. The detailed arrangement of optical fiber. (a) Arrangement and naming of distributed optical fiber sensors (DOFS) in the test pile; (b) adhering the DOFS with epoxy resin; (c) installation of angle steel for protective fiber.
Applsci 10 00492 g004
Figure 5. Entire experimental device.
Applsci 10 00492 g005
Figure 6. Strain values of the corresponding elevation from 0 kN to 900 kN.
Applsci 10 00492 g006
Figure 7. Load and maximum strain (F-εmax) curve at −19.63 m.
Applsci 10 00492 g007
Figure 8. Pure curved structure deformation.
Applsci 10 00492 g008
Figure 9. The simplified model of the steel pipe pile.
Applsci 10 00492 g009
Figure 10. Distributed displacement values at FUT1 direction.
Applsci 10 00492 g010
Figure 11. Displacement data at +10.5 m elevation collected by the dial indicators during the test.
Applsci 10 00492 g011
Figure 12. Displacement data at +10 m elevation collected by the dial indicators compared with displacement data obtained by the distributed strain calculation under horizontal loads.
Applsci 10 00492 g012
Table 1. Information of horizontal loading.
Class of LoadingLoad (kN)Data Acquisition Time
0012:50
load16013:30
load212014:20
load318015:10
load424016:10
load530018:10
load636019:10
load742020:10
load848020:50
load954023:20
load1060000:30 + 1 d
load1166002:30
load1272003:30
load1378004:30
load1484006:00
load1590007:00

