Review

Lung Ultrasound Imaging, a Technical Review

1
Department of Information Engineering and Computer Science, University of Trento, 38123 Trento, Italy
2
Division of Cardiothoracic Surgery, Department of Surgery, University of North Carolina at Chapel Hill, Chapel Hill, NC 3290, USA
3
Department of Mechanical and Aerospace Engineering, North Carolina State University, Raleigh, NC 3290, USA
*
Author to whom correspondence should be addressed.
Appl. Sci. 2020, 10(2), 462; https://doi.org/10.3390/app10020462
Submission received: 30 November 2019 / Revised: 31 December 2019 / Accepted: 2 January 2020 / Published: 8 January 2020

Abstract

:
Lung ultrasound (LUS) is a growing and fascinating field of application for ultrasound imaging. Despite the difficulties in imaging an organ largely filled with air, the potential benefits originating from an effective ultrasound method focusing on monitoring and diagnosing lung diseases represent a tremendous stimulus for research in this direction. This paper presents a technical review where, after a brief historical overview, the current limitations of LUS imaging are discussed together with a description of the physical phenomena at stake. Next, the paper focuses on the latest technical developments of LUS.

1. Introduction

Lung diseases are among the most common pathological conditions worldwide. As an example, interstitial lung diseases (ILDs) group over 200 diseases including pneumonia, tuberculosis, and pulmonary fibrosis. Pneumonia alone is the first cause of death in children under five years of age worldwide, with 808,694 deaths in 2017 (15% of all deaths of children under five) [1]. Chronic obstructive pulmonary disease (COPD), classified by WHO as an under-diagnosed life-threatening lung disease, and lower respiratory infections are the third and fourth leading causes of death, respectively, and are together responsible for six million deaths each year [2]. Idiopathic pulmonary fibrosis (IPF) is a major public health problem, with 50,000 new cases diagnosed each year [3]. Although it is not a lung pathology per se, because it often originates from congestive heart failure, pulmonary edema is also a major health issue, affecting over six million in the U.S. [4], resulting in affected lung compliance and dyspnea. Accurate diagnosis and monitoring of lung diseases are concerns of global scale. For some pathologies, the standard imaging techniques used to diagnose and monitor lung pathologies are chest x-ray and computed tomography (CT). Unfortunately, these modalities are based on ionizing radiation, representing a hazard to patient’s health in case of high dose or frequent exposure, especially in the context of frequent monitoring [5,6,7,8,9]. Amongst the risks, the United States Food and Drug Administration reports an increase in the possibility to develop cancer later in life. This represents a serious concern for children and adolescents, who are significantly more sensitive to radiation exposure than adults [10]. Moreover, CT is expensive, often inaccessible, and bedside-unavailable. Some of the diseases, such as pulmonary edema can’t even be monitored using CT and are currently monitored by invasive intracardiac hemodynamics and devices, biomarker measurements or chest X-Rays [11].
Ultrasound technologies can potentially overcome the limitations of current monitoring techniques offering a safer, portable, and cost-effective alternative. Firstly, being a radiation-free modality, ultrasound is a diagnostic option especially relevant to children, pregnant women and patients subjected to repeated investigations. Secondly, ultrasound devices are easily transportable to patient’s site, including in remote and rural areas, and developing countries. Thirdly, devices and examinations are significantly cheaper as compared to CT or MRI, making ultrasound techniques accessible to a much broader range of facilities, thus reaching more patients. This makes ultrasound especially relevant for sustainable healthcare issues related to aging-society and increased chronic diseases.
The capability of ultrasound imaging to provide access to relevant diagnostic information on pulmonary-tissue has been suggested since the 1990s [12,13,14,15]. For example, sonographic interstitial syndrome is a recognizable pattern observable from lung ultrasound-investigation and characterized by the appearance of several acoustic artifacts known as “comet-tails” or “B-lines” [14,15,16,17]. A correlation exists between these artifacts and the increase in extravascular lung water [17], ILDs [18,19,20], cardiogenic and non-cardiogenic lung edema [21], interstitial pneumonia [22,23], and lung contusion [24].
Moreover, a clearly detectable difference exists between the aforementioned artifacts and the artefactual pattern generally observable with ultrasound imaging when inspecting a healthy lung. Figure 1 shows an example of lung ultrasound images with B-lines (vertical artifacts), as obtained with a linear and a convex probe. An example of A-line artifact (horizontal artifacts) is also shown. B-lines are clinically defined as hyper-echoic vertical artifacts that originate from a point along the pleura-line and lie perpendicular to the latter, and are thought to originate from a reduction of the lung volume originally occupied by air in favor of liquid or tissue. This reduction locally diminishes the acoustic impedance mismatch between the intercostal tissues and the lung. Resulting open channels accessible to ultrasound waves ultimately generate these patterns. Differently, A-lines are visualized in those conditions where the lung surface behaves essentially as a perfect reflector to ultrasound, impeding propagation beyond the pleura line. A-lines are due to the multiple-reflections of ultrasound waves that occur between the probe and the lung surface and can be described as multiple equidistant hyper-echoic horizontal lines which are generally visualized across the entire image and that are parallel to the pleura line. The pleural-line (indicated by arrows in Figure 1) can be defined as the line that separates the intercostal tissue and the lung in the image.
The possibility to discriminate between a diseased and a healthy lung boosted the clinical interest in lung ultrasonography (LUS) [13,14,15,16,17,18,19,20,21,22,23,24,25,26,27,28,29,30,31,32,33]. However, these diagnoses are based on imaging-artifacts, rely on the qualitative and subjective interpretation by the clinicians [34,35,36,37], and are performed using equipment and modalities inadequate to investigate the lung [36,37].
Indeed, standard ultrasound imaging is designed assuming a high-similarity between the acoustic properties (e.g., speed of sound) of soft-tissues, which is primarily due to their high water content [38]. This allows sufficient contrast for imaging and at the same time does not impede transmission through the different tissues, and hence propagation up to the required depths. Moreover, thanks to moderate variations in speed of sound throughout soft-tissues [39,40], the position and shape of different objects in the field-of-view can be estimated with sufficient accuracy.
The aforementioned conditions are definitely not applicable to the lungs, which are air-filled organs, and being air, a medium presenting significant differences in acoustic properties compared to liquids and soft-tissues [38,41]. This implies that the straightforward application of standard ultrasound imaging to the inspection of the lung will obviously result in images that do not represent the actual anatomic structure but can only spot deviations from a healthy condition by displaying artifacts such as the aforementioned B-lines. The genesis of B-lines and their relationship with the alterations of the lung still remain an open question.
In addition to medical/clinical-studies, several technical-studies have been performed since the 60′s attempting lung characterization (on restricted frequency ranges) based on standard soft-tissue acoustic properties, i.e., speed of sound and attenuation [38,39,40,41,42,43]. This type of characterization is however insufficient, and certainly not specific, for the accurate diagnosis of lung diseases. Once again, treating the lung as a conventional soft tissue does not provide optimal results. Instead, dedicated transmission schemes and signal processing algorithms should be designed and implemented in order to take into account the specific properties of the lung. In the next two sections, two approaches attempting to go exactly in this direction are presented and discussed.

2. Ultrasound Spectroscopy

The main hypothesis behind the genesis of B-lines, is that they represent how ultrasound scanners visualize the signals originating from the multiple reflections experienced by ultrasound waves when trapped within channels that can form between the lung air spaces in the presence of a pathological condition [31,36]. In fact, in presence of many alterations of the lung structure, such as edema, fibrosis, contusions, the volume originally occupied by air can be replaced by fluids, blood or tissue. These alterations locally reduce the mismatch in acoustical properties with respect to the intercostal-tissue, and open channels for ultrasound to propagate. Most importantly, the dimensions and shapes of these channels regulate the spatial distribution and dimensions of the remaining air-spaces and vary depending on the severity and type of disease. In this context, the periodicity of the reflections, and hence the frequency content associated to the B-lines, could thus be explored as a way to quantitatively characterize the channels. This characterization can then be utilized to indirectly assess and grade the condition of the lung.
Preliminary results obtained on lung mimicking phantoms already proved the possibility to characterize bubbly structures by analyzing the B-line “native-frequency” [44]. In this study, different lung-phantoms designed to mimic different pathological conditions where scanned using standard ultrasound imaging and a dedicated multi-frequency imaging scheme. In particular, two types of phantoms where fabricated using two distinct mono-disperse microbubble populations. The first phantom type was made with microbubbles with a diameter equal to 170 µm, the second with microbubbles with a diameter equal to 80 µm. This allowed for the analysis of B-lines in a controlled environment where the alveolar size reduction, which is typical of various lung pathologies, was mimicked. In fact, the typical alveolar diameter in a healthy lung is around 280 µm [45]. In total, ten phantoms were fabricated, five for each type. These phantoms were scanned using the ULA-Op research platform in combination with a LA332 (ESAOTE, Flore, Italy) Linear Array probe. Two different imaging modalities have been tested. First, standard ultrasound imaging at 4.5 MHz. Second, a multi-frequency imaging method was implemented and tested. In this case, images were sequentially generated using orthogonal sub-bands centered at different center frequencies, i.e., at 3, 4, 5, and 6 MHz. The driving signals were designed such that frequency-orthogonality, at −10 dB, was guaranteed. At the same time the same bandwidth excited by the 4.5 MHz pulse was (globally) covered. The analysis of these data revealed that B-lines were only visible on phantom-type 2 (smaller bubbles) when standard ultrasound imaging was used. This suggests a relation between bubble size (the air-space size) reduction and increased artifact formation. This observation is in line with the correlation between B-lines and a pathological condition of the lung. Moreover, this result also indicates that, with standard ultrasound imaging, B-lines may be visualized only at an advanced stage of the pathology, since phantom-type 2 was made with microbubbles with a dimeter much smaller than the typical diameters observed in a healthy lung. On the contrary, when the multi-frequency imaging method was used, more B-lines were visible (15 vs. 7). In particular, B-lines were also visible for phantom-type 2. Additionally, the multi-frequency imaging method allowed to observe that the B-lines obtained from phantom-type 2 were generated at higher frequencies (4 to 6 MHz) as compared to those emerging from phantom-type 1 (3 to 5 MHz). This implies that the native frequency of the B-lines may be used to quantitatively evaluate the state of the lung surface. Figure 2 shows microscope images of the generated microbubbles used to fabricate the phantoms, together with a schema and a picture of a lung phantom. Ultrasound images generated with standard ultrasound imaging, as obtained with phantom type 1 and 2, are also shown together with the results of the frequency analysis of B-lines as obtained with the multi-frequency imaging method. This graph indicates the frequency for which the maximum of the received power spectrum was found, while spanning the frequency range from 3 to 6 MHz. As it can be observed, this parameter allowed to distinguish between these two phantom types. This was the first study demonstrating how the native frequency of B-lines could be applied to characterize bubbly structures. In principle, this concept could be clinically applied to quantitatively evaluate the state of the lung surface, and indirectly grade the lung condition. Interestingly, other recent studies already proved that B-lines visualization depends (also on clinical data) on the transmitted ultrasound frequencies and introduced some basic models that can be applied to better understand the formation of these artifacts [46].
As an example, Figure 3 shows ultrasound images as obtained with a clinical scanner. During the investigation, the imaging frequency was varied from 3 MHz to 6 MHz. As it can be seen, B-lines were visualized only at 6 MHz.
These results show that, with the currently available hardware, a frequency characterization of these vertical artifacts is possible. The question is, what can this characterization provide us with, in terms of the capability to grade and distinguish between lung pathologies?
Another important aspect concerns the possibility to implement, in real-time, a system able to detect and localize these artifacts. This could aid the clinician in the visualization of B-lines, and most importantly, would be extremely helpful in order to limit the computational load needed for the additional signal processing operations required for the characterization of the B-lines. Recent work has shown how a simple convolution neural network can be trained for this purpose [47]. In this work, B-line detection and localization was performed in a weakly-supervised fashion through class activation mapping. The method was applied both on phantom and patient data. Moreover, images acquired with both research ultrasound platforms and standard clinical ultrasound scanners have been used. An accuracy, sensitivity, specificity, negative and positive predictive value equal to 0.917, 0.915, 0.918, 0.950, and 0.864 were achieved in-vitro, respectively. In-vivo, these statistics were 0.892, 0.871, 0.930, 0.798, and 0.958, respectively. Most importantly the proposed method allowed B-line detection in real-time, reaching an inference rate of 276 frames/second when exploiting GPU acceleration (Titan Xp, NVIDIA). Figure 4 shows, as an example, two ultrasound images obtained during patient examinations, together with the results obtained with the method described above. The heat map overlaid to the ultrasound image indicated the estimated location of the B-line artifact. Results are shown from the data generated with an open research platform, as well as from a clinical ultrasound scanner.

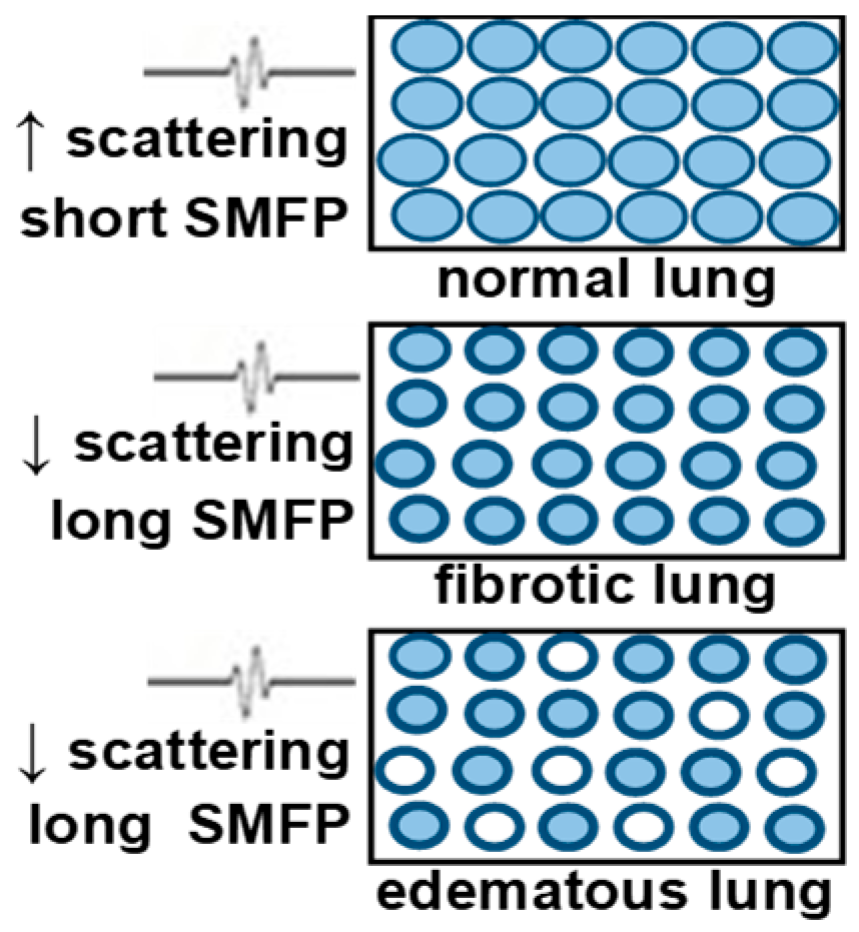
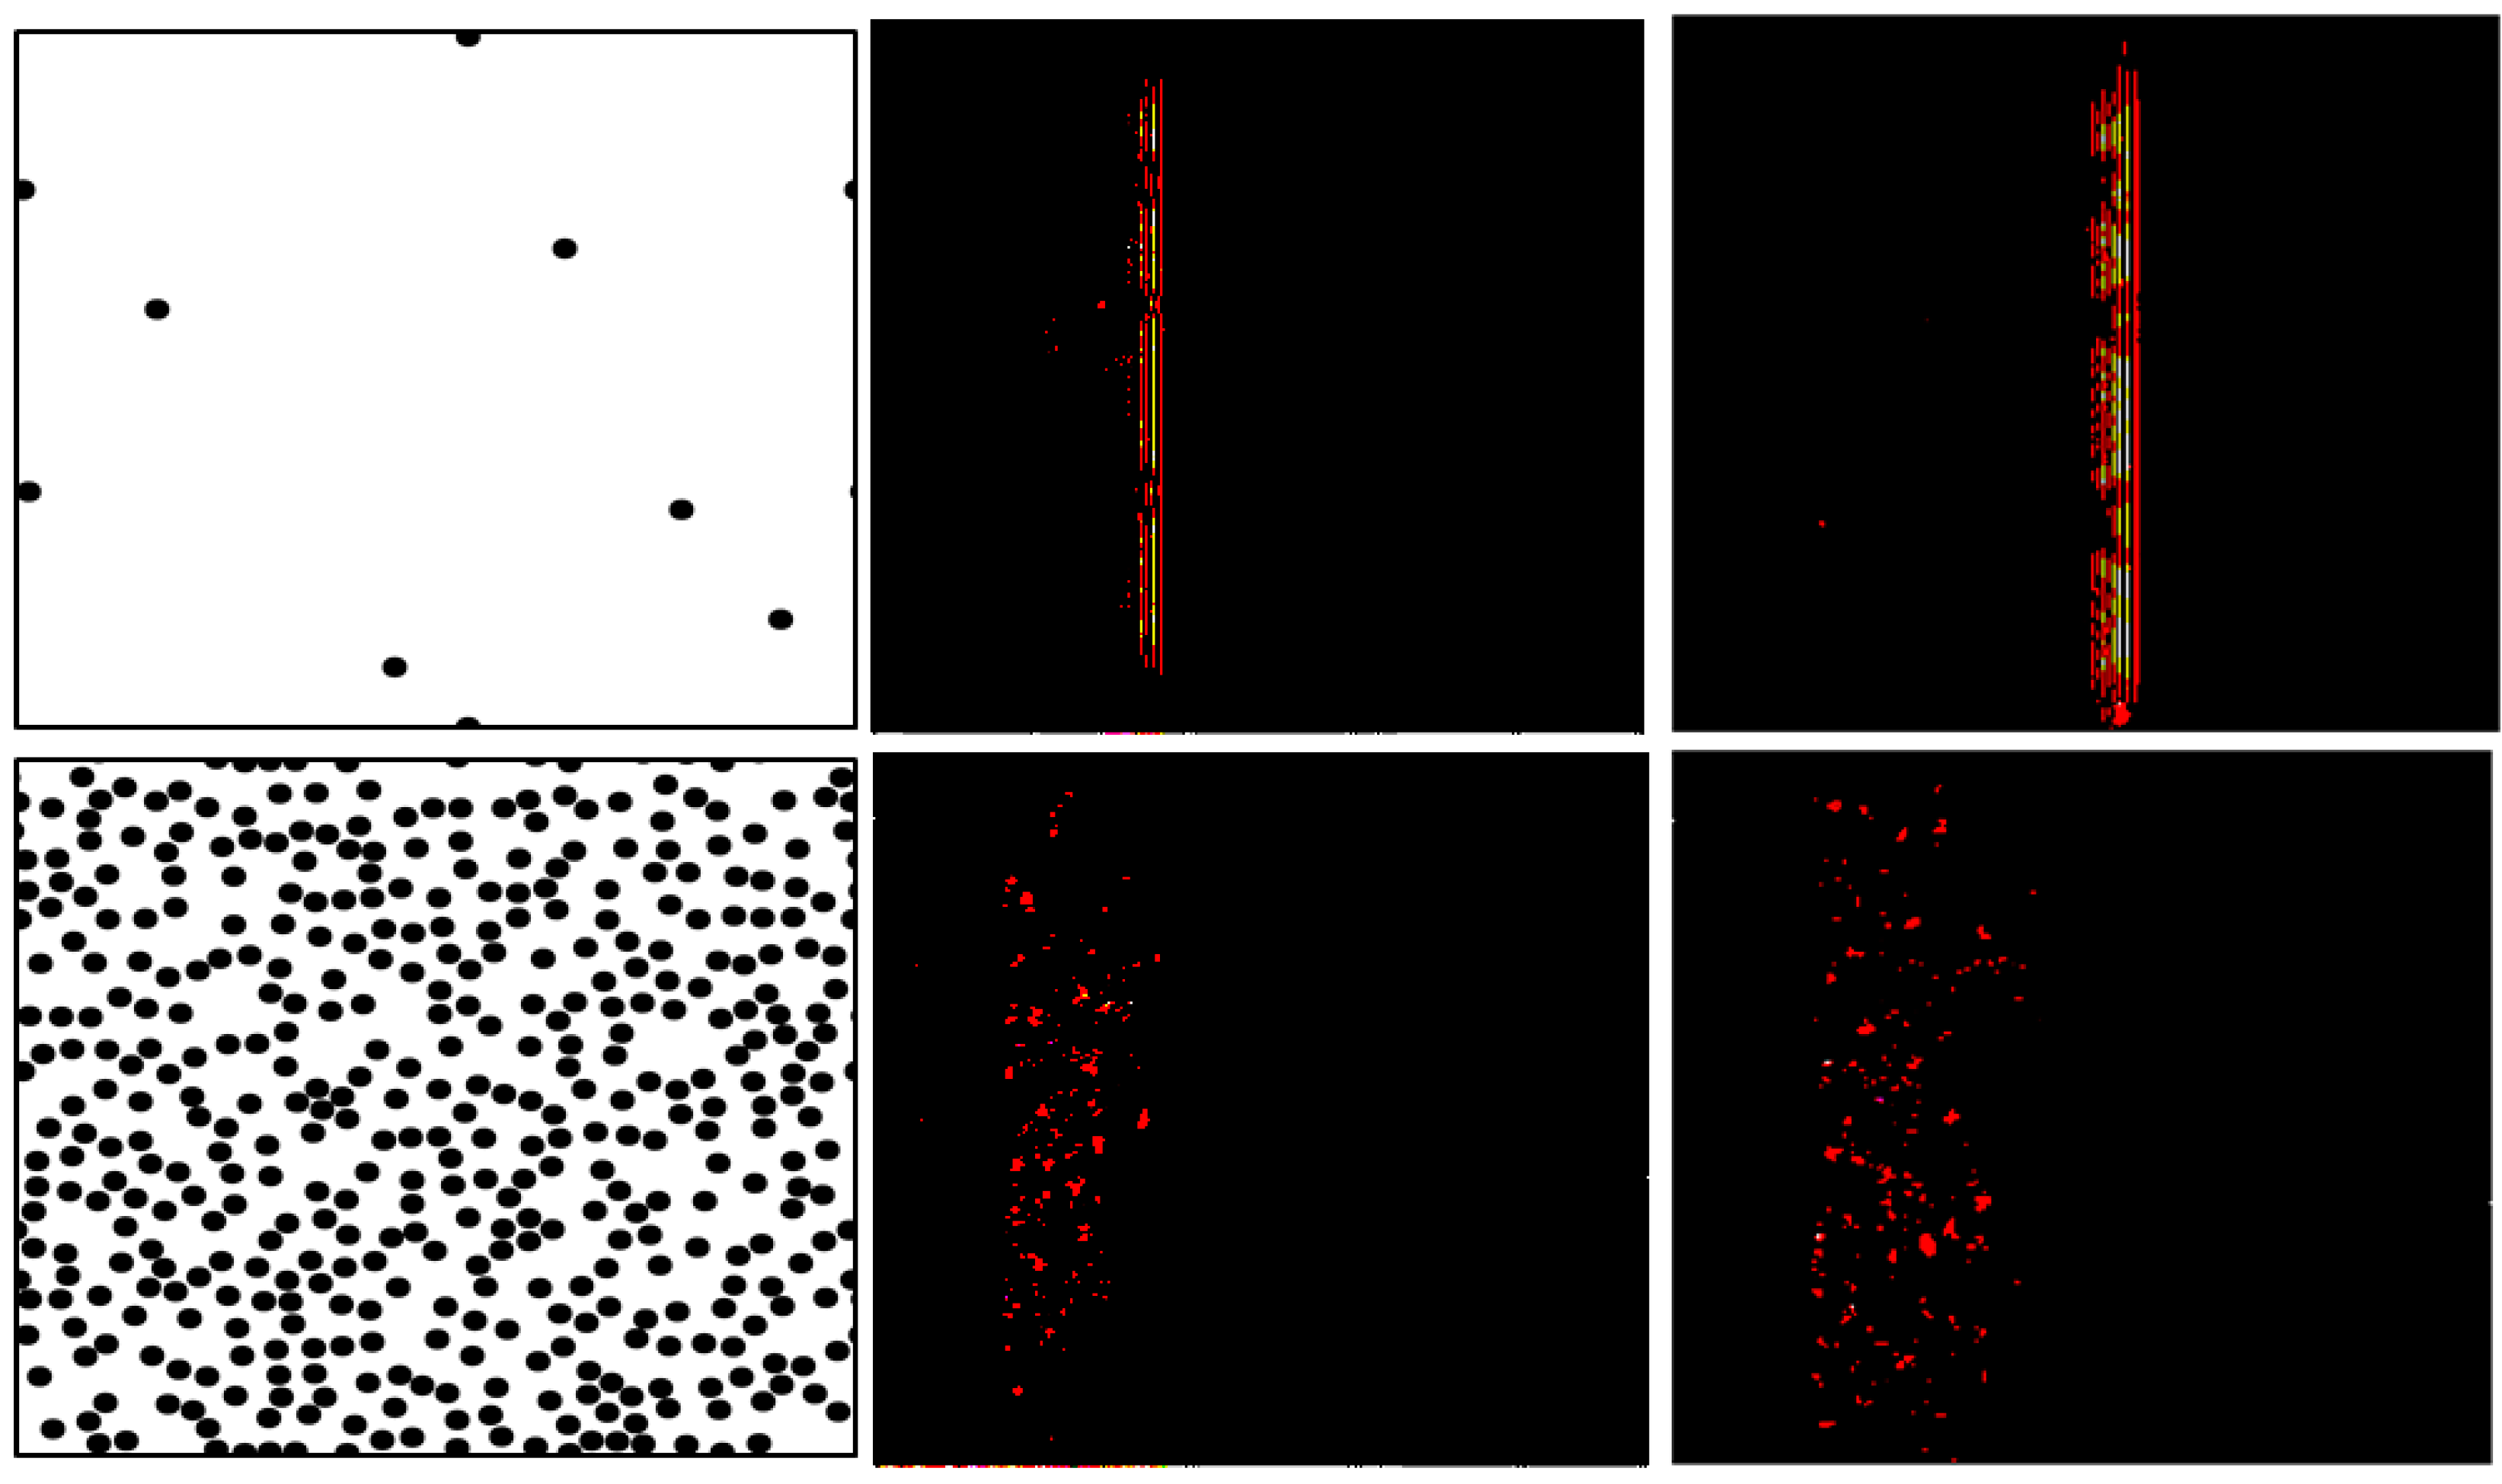
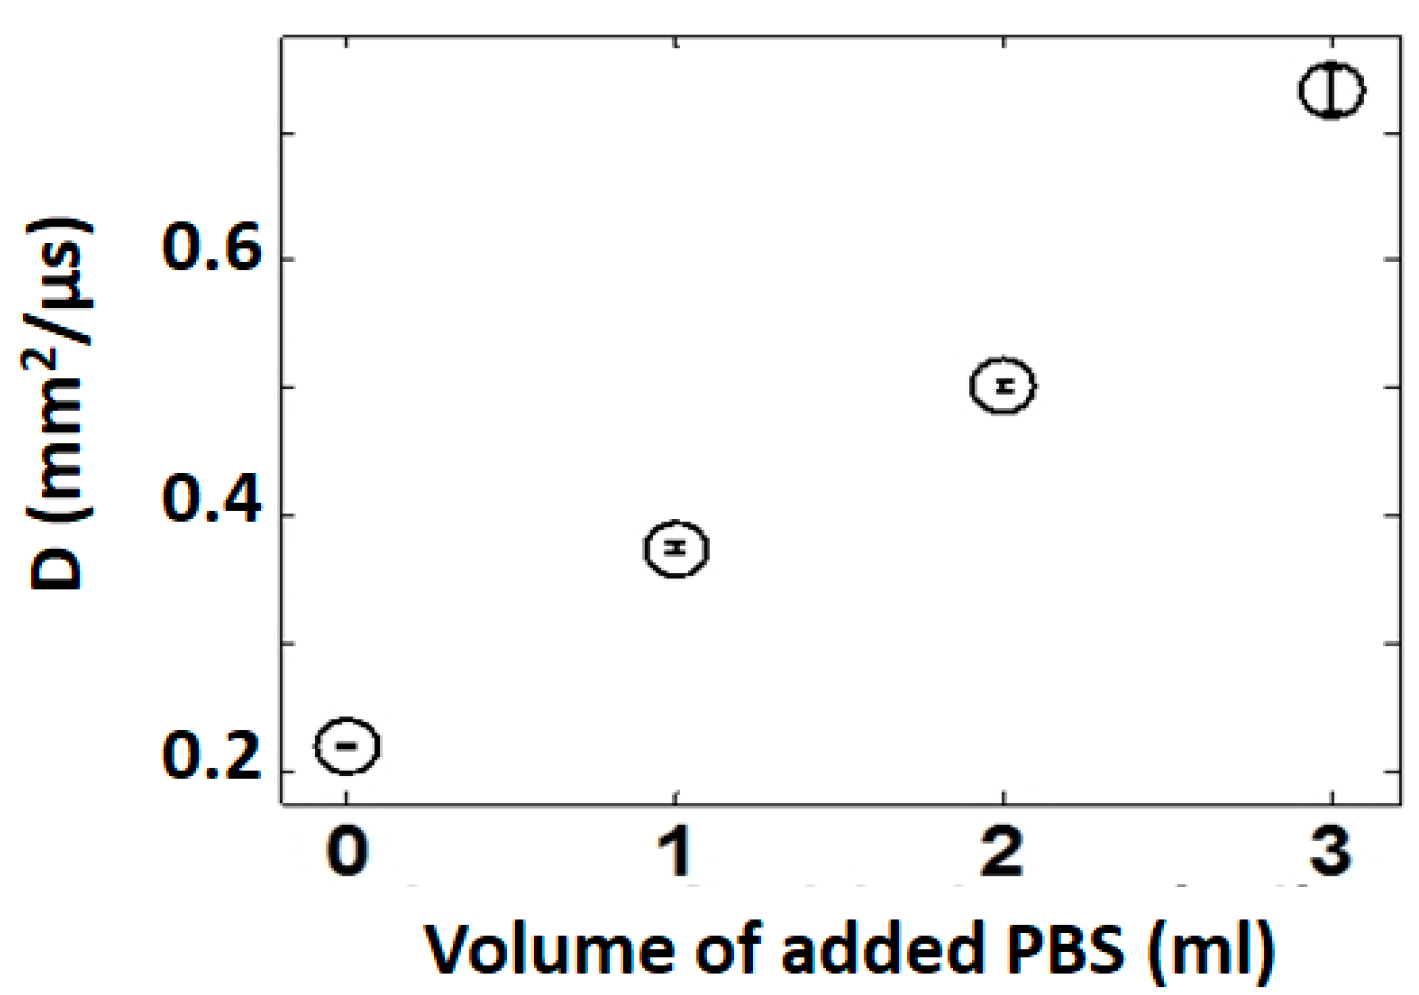
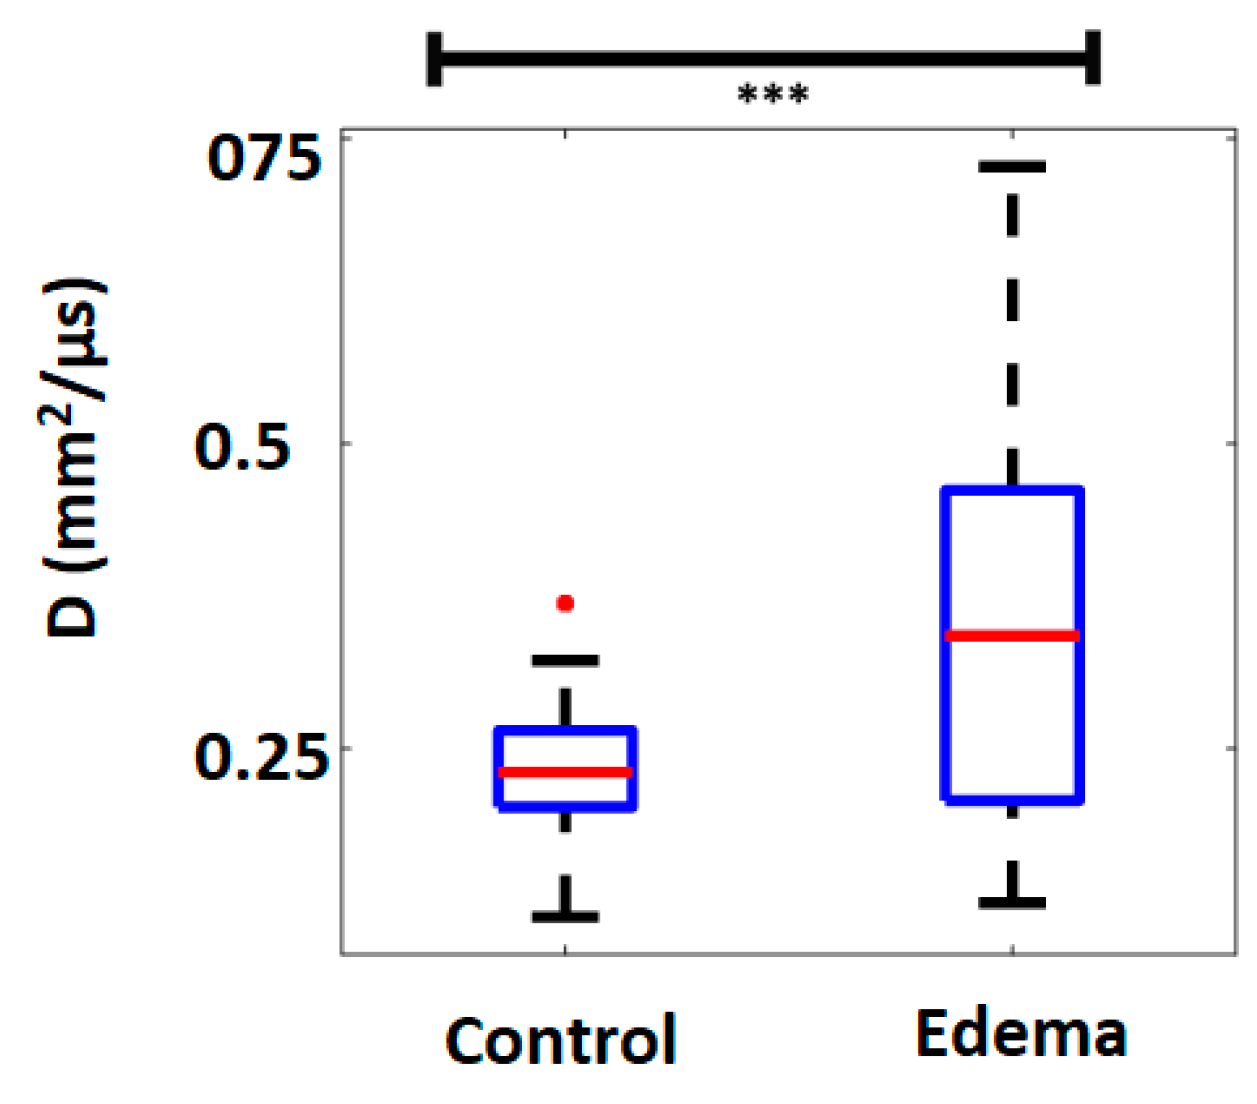
3. Ultrasound Multiple-Scattering Characterization

As discussed in the introduction, one of the main obstacles to conventional B-mode lung imaging is the multiple scattering of ultrasound waves by the millions of air-filled alveoli in the parenchyma. This leads to more complex propagation paths and impairs the linear relationship between propagation time and propagation distance, which is the basis of conventional ultrasound imaging. However, when an ultrasound wave propagates in a complex medium such as the lung parenchyma, each scattering event is also the opportunity for the wave to accumulate quantitative information on the microstructure of the medium. In a highly scattering medium such as the parenchyma, ultrasound waves diffuse rather than propagate. It is possible to take advantage of this. In fact, by quantitatively characterizing the properties of the diffusive phenomenon, it is possible to extract properties of the scatterers (the air-filled alveoli) and their spatial distribution, which can be diagnostically relevant. As an example, diseases such as pulmonary edema and pulmonary fibrosis will increase the distance between healthy air-filled alveoli on average, by increasing the volume of fluid buildup or fibrotic tissue. In pulmonary edema, the increase in interstitial fluid leads to an increase in the size of interstitial spaces. In pulmonary fibrosis, the interstitium will contain increased amounts of collagen and inflammatory cells. If air-filled alveoli are scatterers to the ultrasound wave, both diseases will effectively increase the mean distance between scatterers, thereby affecting the diffusion of the wave in the parenchyma (Figure 5).
In a diffusive medium, the diffusion constant (D) measures the rate of growth of the diffusive halo. If the scatterer encounters are rare (diseased lung, low density of healthy air-filled alveoli), the wave will diffuse rapidly in the parenchyma, propagating straight in between the rare scattering events, leading to large values of D. In a healthy parenchyma on the contrary, scattering events will occur more often. The rate at which the wave will make progress will be lower, leading to lower values of D, by definition of the diffusion constant (Figure 6).
This new paradigm can be exploited for the quantitative characterization of the lung parenchyma. To do so, D can be estimated using a conventional ultrasound probe, as follows.

3.1. Measurement of the Diffusion Constant Using a Conventional Ultrasound Probe

The diffusion constant can be measured using a conventional ultrasound probe connected to a multiple channel ultrasound scanner, in an unconventional way. As an example, in a recent study, a open research platform, i.e., Verasonics Vantage 128 (Verasonics, Kirkland, WA, USA), was used to test these concepts [48]. No beamforming was performed. Instead, the 128 elements were used one by one to transmit 2 cycle Gaussian pulses (centered at 5 MHz or at 7.8 MHz). For each transmit, the signals backscattered from the lung parenchyma were collected on the whole array. With 128 elements on the array, this led to the acquisition of a 128X128XN inter-element response matrix (IRM), N being the number of time points. The IRM matrix is symmetric due to reciprocity. The antisymmetric of the IRM was calculated and both the IRM and the anti-symmetric IRM were split into overlapping time windows. This allowed to extract only the incoherent part of the backscattered intensity. Details of the method are described in [48]. In a diffusive medium, the spatial spread of the incoherent intensity grows over time, and this rate of growth is determined by the diffusion constant D according to the following equation:
I i n c o h e r e n t ( r , T ) = I ( T ) × e x p ( r 2 4 D T ) ,
r, being the emitter-receiver distance and T the time window. To calculate D, the incoherent intensity for each time window was fitted with a Gaussian curve. The width (variance) of this Gaussian, when plotted against time, gives a linear trend, whose slope is equal to 2D.

3.2. Model of Pulmonary Edema Ex Vivo

An ex-vivo study was then performed in lungs from an anesthetized Sprague-Dawley rat. After tracheotomy and heparinization, lungs were flushed with cold Perfadex™ and stored cold overnight. A stopcock was attached to the tracheotomy tube and connected to a 5 mL syringe, to allow control over the air volume fraction. Lungs were fully inflated. D evaluation was performed as described above, with coupling gel directly onto the lung surface. After removing 1 mL of air, PBS was injected into the airway in 1 mL increments. For each PBS volume fraction, D was calculated (Figure 7). This was the first demonstration that ultrasound could quantify changes in lung water [48].

3.3. Model of Pulmonary Edema In-Vivo

A preliminary in-vivo study was performed in a rodent model of pulmonary edema. After sedation a tracheotomy was performed on 6 rats ventilated with a Harvard rodent ventilator. Anesthesia was maintained with titrated isoflurane. A left thoracotomy was performed in the fourth interspace. Heparin was administered intravenously to prevent clotting during ischemia. An aneurysm clip was applied across the left lung hilum to render the left lung ischemic for one hour to create ischemia. The clip was then removed to allow reperfusion of the ischemic lung; this ischemia-reperfusion injury causes pulmonary edema [49,50]. The right lung was used as a control. A sternotomy was performed, and the sternal edges were spread maximally to expose both lungs. Ultrasound coupling gel was applied directly onto each lung and the diffusion constant was evaluated. The results are shown on Figure 8 Significant differences were observed between the control and edematous rat lungs. As expected, the D values proved to be higher in the edematous lung, likely because of the longer propagation paths in the fluid filled lung. These results suggest that the diffusion constant could be used for detecting pulmonary edema and demonstrate the proof of concept for using ultrasound multiple scattering to detect pulmonary edema in the lung [48].

4. Discussion

It appears clearly that the future of lung ultrasound lies in the development of robust and quantitative techniques specifically developed for lung tissue. This is what directed the recent research effort of the growing lung ultrasound research community. Lung ultrasound has remained limited to the critically ill and to emergency care. This is a missed opportunity that could be seized if more reliable, reproducible, and quantitative techniques were developed. We see multiple advantages to developing quantitative techniques. First, the potential availability of an absolute measure would enable standardized ultrasound lung evaluation across centers, potentially with thresholds that could be used to guide and inform treatment. Second, it would then be possible to follow the progress of a disease or to monitor the response to a treatment over time, for a given patient longitudinally. This would be of considerable help for the monitoring of pulmonary edema, which could be an indirect marker of cardiac health in the case of cardiogenic edema. It could also be an extraordinary tool for the evaluation of the efficacy of novel treatments for pulmonary fibrosis [51,52]. It should be noted that significant and promising research efforts are also being made in the area of surface wave elastography and its applications to the lung. However, they are out of the scope of the present contribution, which focuses on the application of longitudinal waves in the parenchyma [53].
Although much progress has been made in the recent years in the quantitative ultrasonic evaluation of the lung, potential bioeffects have not been fully investigated yet. Research efforts need to be conducted in order to ensure a fully responsible use of ultrasound for these new applications. Adverse effects of ultrasound in the lung are different than in other organs due to the presence of air. Cavitation effects leading to hemorrhage have been demonstrated in rodent lungs, but no such effects have been observed in the human lung [54,55,56]. On the contrary, lung ultrasound has been performed extensively in the clinic without any obvious adverse effect. However, Frizell et al. have demonstrated that the cavitation thresholds are much lower in the lung than in other organs [55]. Absorption by the air in alveoli may lead to thermal effects. The cavitation effects are more likely to occur at low frequencies while the thermal effects are more likely to occur at higher frequencies. Church et al. have established a new formulation of the mechanical index (MI) specific to the lung, which accounts for the frequency, the pulse repetition frequency, as well as the pulse duration. According to the literature, this index will enable us to predict risk. The MI, thermal index, and the modified MI defined by [56] should be fully investigated, although knowing the exact local pressure in the lung will not be trivial. Generally speaking, the relatively shallow depths to be investigated (the pleura lays approximately at a depth of 2 cm) allows for the use of a low MI without compromising the capability to gather information by ultrasound.

Author Contributions

Conceptualization, L.D. and M.M.; introduction, L.D. and M.M.; ultrasound spectroscopy L.D.; ultrasound multiple-scattering characterization M.M. and T.E.; discussion L.D. and M.M.; writing—original draft preparation, L.D. and M.M.; review and editing, L.D., M.M. and T.E.; All authors have read and agreed to the published version of the manuscript.

Funding

This research received no external funding.

Acknowledgments

The authors want to acknowledge M.D. Gino Soldati for providing the clinical ultrasound images presented in this paper.

Conflicts of Interest

The authors declare no conflict of interest.

References

  1. World Health Organization (WHO). Pneumonia, Key Facts. Available online: https://www.who.int/news-room/fact-sheets/detail/pneumonia (accessed on 4 January 2020).
  2. World Health Organization (WHO). World Health Statistics 2016. Available online: https://www.who.int/en/news-room/fact-sheets/detail/the-top-10-causes-of-death (accessed on 4 January 2020).
  3. American Thoracic Society: Pulmonary Fibrosis 2019. Available online: https://www.thoracic.org/patients/lung-disease-week/2015/pulmonary-fibrosis-week/general-info.php (accessed on 4 January 2020).
  4. Benjamin, E.J.; Muntner, P.; Alonso, A.; Bittencourt, M.S.; Callaway, C.W.; Carson, A.P.; Chamberlain, A.M.; Chang, A.R.; Cheng, S.; Das, S.R.; et al. Heart Disease and Stroke Statistics-2019 Update: A Report From the American Heart Association. Circulation 2019, 139, e56–e528. [Google Scholar] [CrossRef]
  5. Miglioretti, D.L.; Smith-Bindman, R. Overuse of Computed Tomography and Associated Risks. Am. Fam. Physician 2011, 83, 1252–1254. [Google Scholar]
  6. Smith-Bindman, R. Is it Computed Tomography Safe? N. Engl. J. Med. 2010, 363, 1–4. [Google Scholar] [CrossRef]
  7. Davies, H.E.; Wathen, C.G.; Gleeson, F.V. Risks of exposure to radiological imaging and how to minimize them. Br. Med. J. 2011, 342, d947. [Google Scholar] [CrossRef]
  8. Brenner, D.J.; Hall, E.J. Computed Tomography—An Increasing Source of Radiation Exposure. N. Engl. J. Med. 2007, 29, 2277–2284. [Google Scholar] [CrossRef] [Green Version]
  9. Fayngersh, V.; Passero, M. Estimating Radiation Risk from Computed Tomography Scanning. Lung 2009, 187, 143–148. [Google Scholar] [CrossRef]
  10. World Health Organization (WHO). Ionizing Radiation, Health Effects and Protective Measures, Fact Sheet N°371. Available online: http://www.who.int/mediacentre/factsheets/fs371/en/ (accessed on 4 January 2020).
  11. Abraham, W.T.; Adamson, P.B.; Bourge, R.C.; Aaron, M.F.; Costanzo, M.R.; Stevenson, L.W.; Strickland, W.; Neelagaru, S.; Raval, N.; Krueger, S.; et al. Wireless pulmonary artery haemodynamic monitoring in chronic heart failure: A randomised controlled trial. Lancet 2011, 377, 658–666. [Google Scholar] [CrossRef]
  12. Avruch, L.; Cooperberg, P.L. The Ring-Down Artifact. J. Ultrasound Med. 1985, 4, 21–28. [Google Scholar] [CrossRef] [PubMed]
  13. Lichtenstein, D.A.; Menu, Y. A bedside ultrasound sign ruling out pneumothorax in the critically III: Lung sliding. Chest 1995, 108, 1345–1348. [Google Scholar] [CrossRef] [PubMed] [Green Version]
  14. Lichtenstein, D.A.; Mézière, G.; Biderman, P.; Gepner, A.; Barré, O. The Comet-tail Artifact: An Ultrasound Sign of Alveolar-Interstitial Syndrome. Am. J. Respir. Crit. Care Med. 1997, 156, 1640–1646. [Google Scholar] [CrossRef] [PubMed]
  15. Lichtenstein, D.A.; Mézière, G. A lung ultrasound sign allowing bedside distinction between pulmonary edema and COPD: The comet-tail artifact. Intensive Care Med. 1998, 24, 1331–1334. [Google Scholar] [CrossRef] [PubMed]
  16. Soldati, G.; Giunta, V.; SHER, S.; Melosi, F.; Dini, C. Synthetic Comets: A new Look at Lung Sonography. Ultrasound Med. Biol. 2011, 37, 1762–1770. [Google Scholar] [CrossRef] [PubMed]
  17. Jambrik, Z.; Monti, S.; Coppola, V.; Agricola, E.; Mottola, G.; Miniati, M.; Picano, E. Usefulness of ultrasound lung comets as non-radiologic sign of extravascular lung water. Am. J. Cardiol. 2004, 93, 1265–1270. [Google Scholar] [CrossRef] [PubMed]
  18. Gargani, L.; Frassi, F.; Soldati, G.; Tesorio, P.; Gheorghiade, M.; Picano, E. Ultrasound lung comets for differential diagnosis of acute cardiogenic dyspnea: A comparison with natriuretic peptides. Eur. J. Heart Fail. 2008, 10, 70–77. [Google Scholar] [CrossRef]
  19. Reißig, A.; Kroegel, C. Transthoracic sonography of diffuse parenchymal lung disease. J. Ultrasound Med. 2003, 22, 173–180. [Google Scholar] [CrossRef]
  20. Volpicelli, G.; Mussa, A.; Garofalo, G.; Cardinale, L.; Casoli, G.; Perotto, F.; Fava, C.; Frascisco, M. Bedside lung ultrasound in the assessment of alveolar interstitial syndrome. Am. J. Emerg. Med. 2006, 24, 689–696. [Google Scholar] [CrossRef]
  21. Copetti, R.; Soldati, G.; Copetti, P. Chest sonography: A useful tool to differentiate acute cardiogenic pulmonary edema from acute respiratory distress syndrome. Cardiovasc. Ultrasound 2008, 6, 16. [Google Scholar] [CrossRef] [Green Version]
  22. Volpicelli, G.; Frascisco, M.F. Sonographic detection of radio-occult interstitial lung involvement in measles pneumonitis. Am. J. Emerg. Med. 2009, 27, 128.e1–128.e3. [Google Scholar] [CrossRef]
  23. Soldati, G.; Copetti, R.; Sher, S. Sonographic interstitial syndrome: The sound of lung water. J. Ultrasound Med. 2009, 28, 163–174. [Google Scholar] [CrossRef]
  24. Bouhemad, B.; Zhang, M.; Lu, Q.; Rouby, J.J. Clinical review: Bedside lung ultrasound in critical care practice. Crit. Care 2007, 11, 205. [Google Scholar] [CrossRef]
  25. Sartori, S.; Tombesi, P. Emerging roles for transthoracic ultrasonography in pleuropulmonary pathology. World J. Radiol. 2010, 2, 83–90. [Google Scholar] [CrossRef] [PubMed]
  26. Feller-Kopman, D. Ultrasound-guided thoracentesis. Chest 2006, 129, 1709–1714. [Google Scholar] [CrossRef] [PubMed] [Green Version]
  27. Hyacinthe, A.C.; Broux, C.; Francony, G.; Genty, C.; Bouzat, P.; Jacquot, C.; Albaladejo, P.; Ferretti, G.R.; Bosson, J.L.; Payen, J.F. Diagnostic accuracy of ultrasonography in the acute assessment of common thoracic lesions after trauma. Chest 2012, 141, 1177–1183. [Google Scholar] [CrossRef] [PubMed]
  28. Coley, B.D. Chest sonography in children: Current indications, techniques, and imaging findings. Radiol. Clin. N. Am. 2011, 49, 825–846. [Google Scholar] [CrossRef] [PubMed]
  29. Kreuter, M.; Mathis, G. Emergency Ultrasound of the Chest. Respiration 2014, 87, 89–97. [Google Scholar] [CrossRef] [Green Version]
  30. Lichtenstein, D.A.; Goldstein, I.; Mourgeon, E.; Cluzel, P.; Grenier, P.; Rouby, J.J. Comparative diagnostic performances of auscultation, chest radiography, and lung ultrasonography in acute respiratory distress syndrome. Anesthesiology 2004, 100, 9–15. [Google Scholar] [CrossRef]
  31. Volpicelli, G.; Elbarbary, M.; Blaivas, M.; Lichtenstein, D.A.; Mathis, G.; Kirkpatrick, A.W.; Melniker, L.; Gargani, L.; Noble, V.E.; Via, G.; et al. International Liaison Committee on Lung Ultrasound (ILC-LUS) for the International Consensus Conference on Lung Ultrasound (ICC-LUS). International evidence-based recommendations for point-of-care lung ultrasound. Intensive Care Med. 2012, 38, 577–591. [Google Scholar] [CrossRef] [Green Version]
  32. Lichtenstein, D.A. Lung ultrasound in the critically ill. Ann. Intensive Care 2014, 4, 1. [Google Scholar] [CrossRef] [Green Version]
  33. Anderson, K.; Fields, J.M.; Panebianco, N.; Jeng, K.; Marin, J.; Dean, A.J. Inter-Rater Reliability of Quantifying Pleural B-Lines Using Multiple Counting Methods. J. Ultrasound Med. 2013, 32, 115–120. [Google Scholar] [CrossRef]
  34. Sperandeo, M.; Trovato, G.M.; Catalano, D. Quantifying B-lines on lung sonography: Insufficient evidence as an objective, constructive, and educational tool. J. Ultrasound Med. 2014, 33, 362–365. [Google Scholar] [CrossRef]
  35. Zanforlin, A.; Smargiassi, A.; Inchingolo, R.; Sher, S.; Ramazzina, E.; Corbo, G.M.; Soldati, G. B-Lines: To Count or Not to Count. J. Am. Coll. Cardiol. Cadiovasc. Imaging 2014, 7, 635–636. [Google Scholar] [CrossRef] [PubMed] [Green Version]
  36. Soldati, G.; Demi, M.; Inchingolo, R.; Smargiassi, A.; Demi, L. On the physical basis of pulmonary sonographic interstitial syndrome. J. Ultrasound Med. 2016, 35, 2075–2086. [Google Scholar] [CrossRef] [PubMed]
  37. Soldati, G.; Demi, M.; Smargiassi, A.; Inchingolo, R.; Demi, L. The role of ultrasound lung artefacts in thediagnosis of respiratory diseases. Expert Rev. Respir. Med. 2019, 13, 162–172. [Google Scholar] [CrossRef] [PubMed]
  38. Dunn, F.; Fry, W.J. Ultrasonic absorption and reflection by lung tissue. Phys. Med. Biol. 1961, 5, 401–410. [Google Scholar] [CrossRef] [PubMed]
  39. Bauld, T.J.; Schwan, H.P. Attenuation and reflection of ultrasound in canine lung tissue. J. Acoust. Soc. Am. 1974, 56, 1630–1637. [Google Scholar] [CrossRef] [PubMed]
  40. Pedersen, P.C.; Ozcan, H.S. Ultrasound properties of lung tissue and their Measurements. Ultrasound Med. Biol. 1986, 12, 483–499. [Google Scholar] [CrossRef]
  41. Dunn, F. Attenuation and speed of ultrasound in lung: Dependence upon frequency and inflation. J. Acoust. Soc. Am. 1986, 80, 1248–1250. [Google Scholar] [CrossRef]
  42. Dunn, F. Attenuation and speed of ultrasound in lung. J. Acoust. Soc. Am. 1974, 56, 1638–1639. [Google Scholar] [CrossRef]
  43. Mikhak, Z.; Pedersen, P.C. Acoustic attenuation properties of the lung: An open question. Ultrasound Med. Biol. 2002, 28, 1209–1216. [Google Scholar] [CrossRef]
  44. Demi, L.; van Hoeve, W.; van Sloun, R.J.G.; Soldati, G.; Demi, M. Determination of a potential quantitative measure of the state of the lung using lung ultrasound spectroscopy. Nat. Sci. Rep. 2017, 7, 12746. [Google Scholar] [CrossRef]
  45. Sagm, K.B.; Rhyne, T.L.; Myers, G.S.; Lees, R.S. Characterization of Normal and Abnormal Pulmonary Surface by Reflected Ultrasound. Chest 1978, 74, 29–33. [Google Scholar]
  46. Demi, M.; Prediletto, R.; Soldati, G.; Demi, L. Physical mechanisms providing clinical information from ultrasound lung images: Hypotheses and early confirmations. IEEE Trans. Ultrason. Ferroelectr. Freq. Control 2019. [Google Scholar] [CrossRef] [PubMed]
  47. van Sloun, R.J.G.; Demi, L. Localizing B-lines in Lung Ultrasonography by Weakly-Supervised Deep Learning, in-vivo results. IEEE J. Biomed. Health Inform. 2019. [Google Scholar] [CrossRef] [PubMed]
  48. Mohanty, K.; Blackwell, J.; Egan, T.; Muller, M. Characterization of the Lung Parenchyma Using Ultrasound Multiple Scattering. Ultrasound Med. Biol. 2017, 43, 993–1003. [Google Scholar] [CrossRef] [PubMed]
  49. Doanes, M.; Yuan, Y.; Jin, J.; Egan, T. Gene expression analysis of rat lung ischemia-reperfusion injury (Abstract). Am. J. Resp. Crit. Care Med. 2004, 169, A72. [Google Scholar]
  50. Zanotti, G.; Casiraghi, M.; Abano, J.B.; Tatreau, J.R.; Sevala, M.; Berlin, H.; Smyth, S.; Funkhouser, W.K.; Burridge, K.; Randell, S.H.; et al. Novel critical role of toll-like receptor 4 in lung ischemia-reperfusion injury and edema. Am. J. Physiol. Lung Cell. Mol. Physiol. 2009, 297, L52–L63. [Google Scholar] [CrossRef] [Green Version]
  51. King, T.E., Jr.; Bradford, W.Z.; Castro-Bernardini, S.; Fagan, E.A.; Glaspole, I.; Glassberg, M.K.; Lederer, D.J.; Gorina, E.; Hopkins, P.M.; Kardatzke, D.; et al. A phase 3 trial of pirfenidone in patients with idiopathic pulmonary fibrosis. N. Engl. J. Med. 2014, 370, 2083–2092. [Google Scholar] [CrossRef] [Green Version]
  52. Noble, P.W.; Albera, C.; Bradford, W.Z.; Costabel, U.; Glassberg, M.K.; Kardatzke, D.; Lancaster, L.; Sahn, S.A.; Szwarcberg, J.; Valeyre, D.; et al. Pirfenidone in patients with idiopathic pulmonary fibrosis (CAPACITY): Two randomised trials. Lancet 2011, 377, 1760–1769. [Google Scholar] [CrossRef]
  53. Zhang, X.; Osborn, T.; Zhou, B.; Meixner, D.; Kinnick, R.R.; Bartholmai, B.; Greenleaf, J.F.; Kalra, S. Lung Ultrasound Surface Wave Elastography: A Pilot Clinical Study. IEEE Trans. Ultrason. Ferroelectr. Freq. Control 2017, 64, 1298–1304. [Google Scholar] [CrossRef]
  54. Child, S.Z.; Hartman, C.L.; Schery, L.A.; Carstensen, E.L. Lung damage from exposure to pulsed ultrasound. Ultrasound Med. Biol. 1990, 16, 817–825. [Google Scholar] [CrossRef]
  55. Frizzell, L.A.; Chen, E.; Lee, C. Effects of pulsed ultrasound on the mouse neonate: Hind limb paralysis and lung hemorrhage. Ultrasound Med. Biol. 1994, 20, 53–63. [Google Scholar] [CrossRef]
  56. Church, C.C.; O’Brien, W.D., Jr. Evaluation of the threshold for lung hemorrhage by diagnostic ultrasound and a proposed new safety index. Ultrasound Med. Biol. 2007, 33, 810–818. [Google Scholar] [CrossRef] [PubMed] [Green Version]
Figure 1. B-line artifacts as observable with a linear (left) and convex (center) probe and A-line artifact as observable with a linear probe (right). The pleura line is also indicated for the three images.
Applsci 10 00462 g001
Figure 2. Microscope images of the generated microbubbles, together with a phantom schema and a picture of a lung mimicking phantom (on the left). Ultrasound images generated with standard ultrasound imaging, as obtained with phantom type 1 and 2, together with the results of the frequency analysis of B-lines as obtained with the multi-frequency imaging method.
Applsci 10 00462 g002
Figure 3. Ultrasound images obtained during patients investigation using a clinical scanner. The imaging frequency was varied from 3 MHz (left) to 6 MHz (right).
Applsci 10 00462 g003
Figure 4. Ultrasound images obtained during patients investigation using an open research platform (on the left) and clinical scanner (on the right). The result in terms of detection and localization as obtained by the computer aided system in also shown.
Applsci 10 00462 g004
Figure 5. Blue = air-filled alveoli. (Top): ultrasound wave into normal lung experiences multiple scatters. Diffusion will be slow (Middle): Fibrotic lungs have smaller alveoli, thicker alveolar walls, and more tissue between alveoli, so diffusion will be faster. (Bottom): Edematous lung. Some alveoli may be fluid filled (white) which will further increase the distance between scatterers.
Applsci 10 00462 g005
Figure 6. (Left): Two heterogeneous media with different scattering properties (top: weakly scattering medium, bottom: highly scattering medium). (Center) and (right): propagation of a plane in these two media at two different times. In the medium with a lower scatterer density, the wave makes rapid progress (top). In the medium with a dense scatterer distribution (bottom), the wave makes slower progress.
Applsci 10 00462 g006
Figure 7. D increases when PBS is instilled into the lung, simulating edema ex-vivo. Three readings were taken for each measurement. The variability is demonstrated by the error bars. mean D ± SEM.
Applsci 10 00462 g007
Figure 8. The D values are significantly higher in the edematous lung than in the control lung. ***: p < 0.005.
Applsci 10 00462 g008

