Article

An Experimental Investigation on the Influence of Port Injection at Valve on Combustion and Emission Characteristics of B5/Biogas RCCI Engine

by
Ibrahim B. Dalha
1,2,*,
Mior A. Said
1,*,
Zainal A. Abdul Karim
1 and
Salah E. Mohammed
1,3
1
Centre for Automotive Research and Electric Mobility (CAREM), Universiti Teknologi PETRONAS, Bandar Seri Iskandar 32610, Perak, Malaysia
2
Faculty of Engineering, Ahmadu Bello University, Samaru 1045, Zaria, Nigeria
3
College of Engineering and Architecture, University of Bahri, Khartoum 1660, Sudan
*
Authors to whom correspondence should be addressed.
Appl. Sci. 2020, 10(2), 452; https://doi.org/10.3390/app10020452
Submission received: 14 November 2019 / Revised: 10 December 2019 / Accepted: 17 December 2019 / Published: 8 January 2020

Abstract

:

Featured Application

The work is applicable in renewable energy and automotive engineering, specifically for fuel utilization in compression ignition engine to further advance the RCCI mode for reduced emissions.

Abstract

High unburned hydrocarbon (UHC) and carbon monoxide (CO) emissions, on account of the premixed air-fuel mixture entering the crevices and pre-mature combustion, are setbacks to reactivity-controlled compression ignition (RCCI) combustion at a low load. The influence of direct-injected B5 and port injection of biogas at the intake valve was, experimentally, examined in the RCCI mode. The port injection at the valve was to elevate the temperature at low load and eliminate premixing for reduced pre-mature combustion and fuel entering the crevices. An advanced injection timing of 21° crank angle before top dead centre and fraction of 50% each of the fuels, were maintained at speeds of 1600, 1800 and 2000 rpm and varied the load from 4.5 to 6.5 bar indicated mean effective pressure (IMEP). The result shows slow combustion as the load increases with the highest indicated thermal efficiency of 36.33% at 5.5 bar IMEP. The carbon dioxide and nitrogen oxides emissions increased, but UHC emission decreased, significantly, as the load increases. However, CO emission rose from 4.5 to 5.5 bar IMEP, then reduced as the load increases. The use of these fuels and biogas injection at the valve were capable of averagely reducing the persistent challenge of the CO and UHC emissions, by 20.33% and 10% respectively, compared to the conventional premixed mode.

1. Introduction

Reactivity controlled compression ignition (RCCI) is a dual fuel low-temperature combustion (LTC) mode that adapts an in-cylinder mixing of at least two fuels of different reactivity to manipulate and improve the combustion phase by stratification [1,2,3,4]. The auto-ignition of the high reactivity fuel (HRF) initiates the combustion while a rise in the temperature and pressure facilitates the burning of the low reactivity fuel (LRF) [5]. The RCCI combustion concept has turned out to be a promising model for the upcoming progeny of internal combustion engines, but is still subject to an in-depth study for its perfection [2,6]. According to Firmansyah et al. [7] the measures taken to address the nitrogen oxides (NOx) and soot emissions in RCCI resulted in an unacceptable rise in carbon monoxide (CO) and unburned hydrocarbon (UHC) emissions; hence dual direct injection (DDI) was developed to improve the local reactivity index and reduces the amount of fuel entering the crevices as a source of these emissions. According to Lim and Reitz [8], use of DDI along with the exhaust gas recirculation (EGR) could extend the RCCI load to a 21 bar indicated mean effective pressure (IMEP), as a consequence of utilizing the piston geometry and important regions by the two injectors. Achieved also was high thermal efficiency of 48.7% with a very low NOx and soot emissions. Utilizing a considerable quantity of the fuel during the first injection timing enables effective control of the combustion by maximizing evaporative cooling in the squish region as similarly reported in [9]. Despite the achievement of the DDI technique, an unacceptable rise in the CO and UHC emission still manifested at low load [10]. Evidences in literature show that, over a decade few researchers such as; Lim and Reitz [11], Lim and Reitz [8], Wissink and Reitz [12], Kavuri et al. [10], Mikulski and Bekdemir [13], and recently Firmansyah et al. [7] considered the use of dual direct injectors to inject both low and high reactivity fuels directly into the cylinder with the view to reducing the amount of premixed air-fuel mixture in the crevice region using gasoline-diesel and natural gas (NG)-diesel in RCCI combustion. The reduced attractiveness of the DDI technique may attribute to the complexity in the cylinder head modification posing technical challenges to achieving its maximal utilization and practical examination. However, Agarwal et al. [14] in their review suggested that more of the techniques on the reduction of UHC and CO emissions should be on studies. Likewise, Li et al. [4] suggested investigations on the various injection approaches for more control in RCCI combustion. Therefore, the quest for further reduction of UHC and CO emission through a simple to achieve, easy to implement and cost-effective modified port injection approach motivated the research on gaseous LRF injection at the valve, which aimed at eliminating air-fuel mixing before entering the cylinder, raising the in-cylinder temperature at low load and reducing the amount of fuel mixture entering the crevices. Comparatively, Figure 1 shows the various LRF delivery methods; conventional premixed port injection [15,16,17], dual direct injection [8,10,12,13], and the proposed port injection at the valve for this research. To the best of the authors’ knowledge, this article is the first to report this approach.
Besides, the benefits of using biodiesel as HRF, in place of conventional diesel in RCCI combustion, are of utmost importance. Biodiesel offers certain advantages to improve fuel stratification, control combustion phase, and extend the load in the RCCI engine. According to Gashaw et al. [18] direct use of biodiesel, produced from vegetable oils, might result in some technical faults. However, the use of biodiesel blends made ways and has been recording successes since the early 80s [19]; thus, biodiesel gets mixed with the fossil diesel, to form a mixture, in a given proportion and served as HRF [19]. A blend of biodiesel at 20% and below by volume, has less detrimental effects on the diesel engine and can be used with no or minor modifications [20]. As observed from the literature, minimal effort was devoted to exploring the benefits of biodiesel blends in RCCI, as; Benajes et al. [21] studied experimentally, the workability of B7 along with different low reactivity fuels, Isik and Hüseyin [22] studied the effects of B10, B20, and B50 in reactivity with the ethanol as LRF while Kalsi and Subramanian [23] investigated numerically, the performance of B60 and B80 in responsiveness with hydrogen blended compressed natural gas; thus, the performance of B5, diesel with the 5% biodiesel as also readily available in Malaysia, is not yet examined in the RCCI mode. However, Li et al. [4] suggested the use of oxygenated fuel to improved combustion and increased efficiency in RCCI, hence, the motivation to consider strategies like the use of oxygenated HRF and advanced injection timing, that enhances the in-cylinder mixing and fuel combustion at light engine load [10,24], for better performance.
Nevertheless, numerous researches were conducted under RCCI combustion using none gaseous biofuel and natural gas. Many studies have also underseen the workability of biogas in the compression ignition engine, under various multi-fuel combustion techniques, with a minimal reference to RCCI [25,26,27,28,29]. Hence, the motivation to adopt diesel engine with the RCCI combustion mode for an efficient and hitch-free operation using biogas [30]. The use of biogas, as a fuel, would reduce the buoyancy of fossil energy and deter its environmental impacts [31]. The production of biogas is through anaerobic digestion of natural compounds like food waste, animal waste, and cellulosic biomass [25,27,32]. It is used for cooking, electricity generation, and as a fuel for vehicles, which constitutes mainly; methane (CH4), carbon dioxide (CO2), and a small percentage of nitrogen, though there is a considerable amount of objectionable impurities such as hydrogen sulfide, ammonia, and silicon oxides. These depend upon the biogas sources and could be detrimental to any thermal conversion device [31,33,34,35,36,37,38]. Some studies were conducted in RCCI using biogas of various compositions without taking into consideration the actual form of biomass-based biogas. Wang et al. [17] investigated the possibility of clean utilization of low-grade biogas having a fraction of 5% H2, 40% CO, 5% CH4, and 50% N2. A similar fraction has been reported in another study by Qian et al. [16]. Kakaee et al. [39] also studied the influence of gaseous fuel composition, 78.2% CH4, 2.31% C2H6, 0.25% C3H8, 18.89% N2, and 0.28% CO2, on the combustion and emissions of the RCCI engine. The various composition studied in RCCI also motivated the authors to investigate the workability of biogas having a high CO2 fraction; 75% CH4 and 25% CO2 by mole. Therefore, this paper investigated the characteristics of an oxygenated diesel (B5) along with the biogas injected at the valve to enable further reduction of the UHC and CO emissions in the RCCI mode.

2. Materials and Methods

2.1. Experimental Set-Up and Measurement

The research was carried out at the Center for Automotive Research and Electric Mobility, Universiti Teknologi PETRONAS. A single-cylinder, four-stroke, Yanmar diesel engine was modified to achieve the biogas delivery at the valve for in-cylinder mixing of the fuels. The technical information on the test equipment is presented in Table 1, while Figure 2 depicted the layout of the engine test rig. However, this research investigated the effects of direct-injected B5 and port-injected biogas delivered at the valve on the combustion, performance, and emission parameters. The concept aimed at eliminating air-fuel mixing before entering the cylinder, though delivered through the air intake manifold, thereby reducing the amount of mixture entering the crevices. To raise the in-cylinder temperature, thus reducing the pre-mature combustion at low load (4–7 bar IMEP). An injector holder and a delivery hose were developed and coupled to the air intake manifold to enable achievement of the gaseous fuel delivery at the valve for the in-situ mixing of the biogas and B5 in the cylinder. The delivery hose is a metallic tube of 4 mm inner diameter, connected at the end of the injector with the aid of the injector holder, through which the biogas was injected and delivered very close to the air inlet valve attaining nearly zero mixing rate and eliminated or minimizing the air-fuel mixing before entering the cylinder; hence, directly offered to the combustion chamber. The delivery hose was equipped with a gasket at its tip to minimize vibration, avoid direct metallic contact due to valve movement and enable biogas fuel flow control using intake valve closure. It was assumed that; the air and biogas maintained a forward flow direction, hence no gaseous fuel backflow to get mixed with the air before delivery into the cylinder otherwise, the quantity of biogas fuel that might backflow and gets mixed with the air, was assumed negligible.
The eddy current dynamometer (DW10, 10 kw, 50 Nm, 13,000 rpm) was used for the measurement of engine load and speed while a rotary type encoder (E50S8-360-3-T-24) was utilized for the crank angle measurement. The engine used a pressure transducer to detect the pressure inside the cylinder. A hot-wire airflow meter was used to measure the airflow rate, range: 0–30 m/s, and a pressure sensor, range: −1 to 1 bar, was also used for the air pressure measurement. A K–type thermocouple, 0 to 1100 °C range, was employed to measure the air temperature. The information on the diesel mass flow rate and volume were obtained from the data acquisition system through a weighing scale attached to the engine control unit. However, a Linde HiQ pressure regulator was incorporated to decompress the biogas pressure to 2 bar, and its mass flow rate was measured using IGO8 R3 Concoa gas flow meter. An SPTC AutoChek gas analyzer (M-GS-V1.5 E IC) was also used to measure the NOx, UHC, CO, and CO2 emissions with an accuracy of 1 ppm, 1 ppm 0.01%, and 0.01% respectively.

2.2. Experimental Procedure

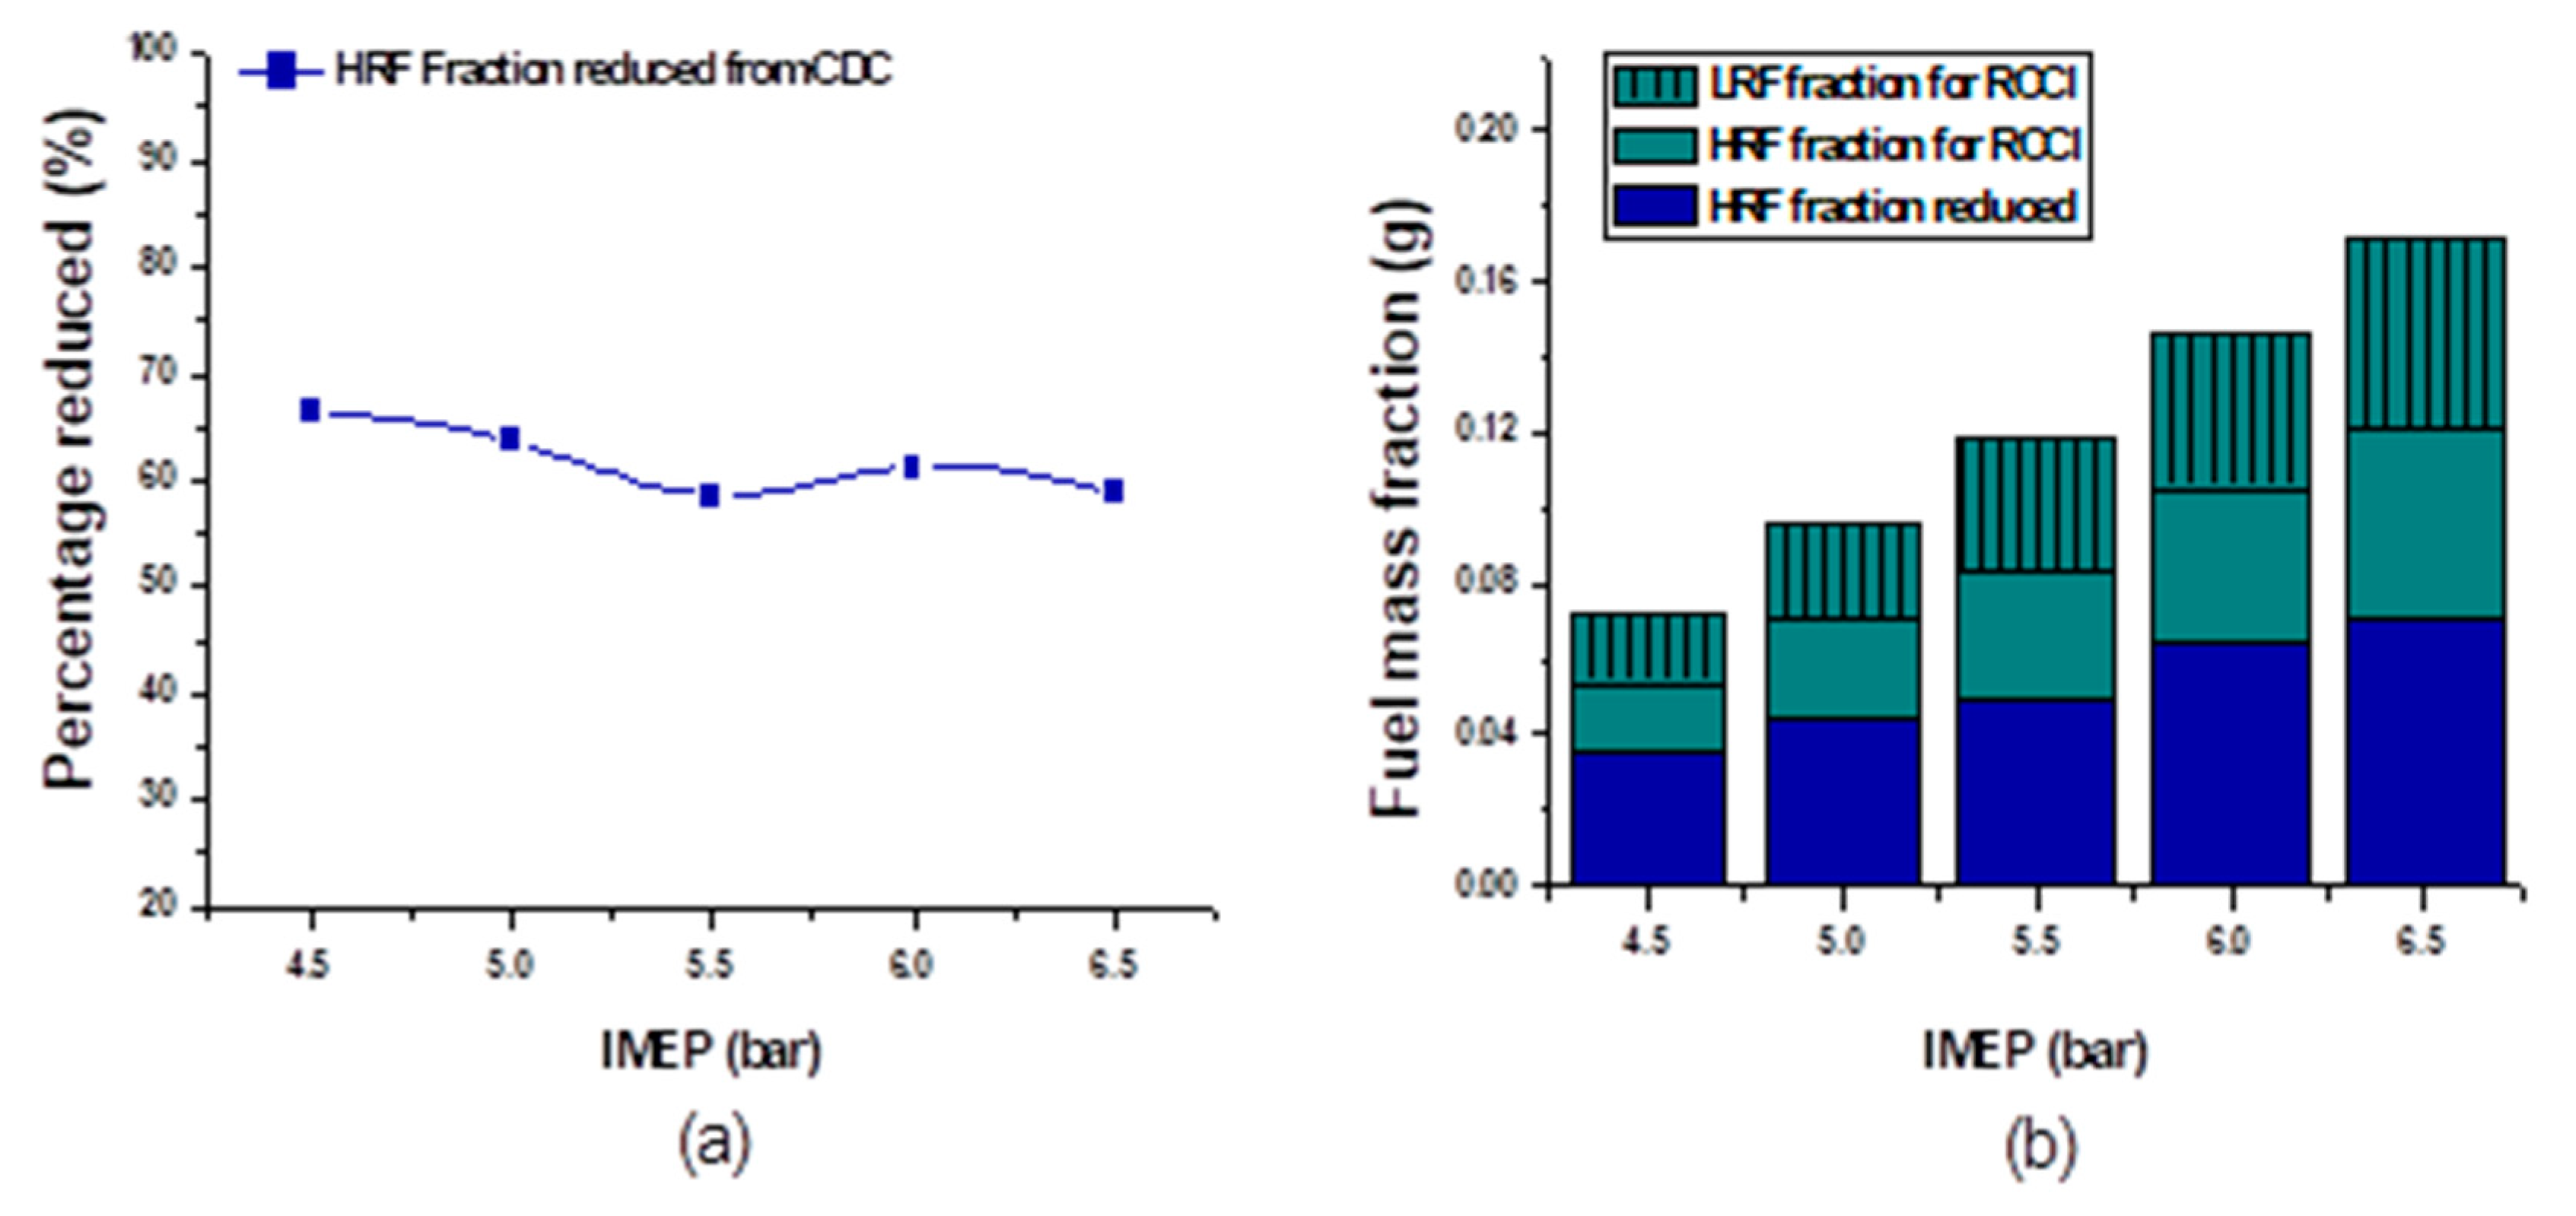
The test was conducted to investigate the engine characteristics at high speed and low load (4–7 bar IMEP) conditions in a modified approach of port injection at the valve. The manufacturer recommended operation of the engine at a speed of 2000 rpm and above. A consistent engine speed of 2000 rpm was initially considered based on the manufacturer’s recommendation and varied the load from the no-load indicated mean effective pressure (4.5 bar IMEP) to maximum capacity (6.5 bar IMEP) at an interval of 0.5 bar IMEP, which correspond to an increase by 25% engine load. Subsequently, 1600 rpm, 1800 rpm, and 2000 rpm were further investigated in a premixed port injection approach to ascertain the contribution of the high speed selected in elevating some of the emissions. The research reported the engine capacity based on the actual indicated mean effective pressures (IMEP) to reflect the low load range, unlike the usual load percentages. A test was carried out to determine the appropriate proportions of the dynamometer brake applied and throttle position to achieve the average IMEP corresponding to the percentage increase in the load for each of the HRFs and speeds selected. Table 2 shows the detailed engine loading with the corresponding percentages of the dynamometer brake applied and throttle position for the regular diesel and B5 fuels at a speed of 2000 rpm. A B5 diesel was injected directly as test fuel while the regular diesel was considered a reference. The amount of direct-injected fuel for the conventional diesel combustion was reduced in such a way that the remaining amount would serve as a source of ignition and provide some heat to enable an explosion of the port injected biogas during RCCI combustion. The percentage reduced at each load capacity is offered in Figure 3a, while Figure 3b shows the analysis of the fuel quantities used for the RCCI combustion compared to the fractions reduced. The amount of fuel directly injected at every load level was preliminarily estimated, by running the engine five times under each of the conditions shown in Table 2 after which the average was taken and considered a direct-injected quantity. This quantity was maintained as a fraction of 50% for each of the directly injected fuel used, as presented in Table 2. Initially, the engine has an injection timing of 13° CA BTDC, then a shim of 0.8 mm was removed, which advanced the injection timing by 8 degrees, as each of the 0.1 mm advanced the injection timing by 1 deg. Therefore, an advanced injection timing of 21° CA BTDC was considered because early direct injection timing improves the in-cylinder mixing and fuel combustion at low load [10,24]. The biogas was premixed port-injected at a full mixing distance of 110 mm from the injector to the air intake valve position, as premixed distance. A nearly zero mixing distance from the valve position was considered for the approach of injection at the valve. The biogas fuel was delivered at a constant pressure of 2 bar while its flow rate was varied with the engine load to ensure a 50% biogas energy fraction for both fully premixed and port injection at the valve approaches.

2.3. Test Fuels

This research investigated the performance of an oxygenated diesel, which is Euro 2M diesel containing 5% biodiesel, available in Malaysia, as direct-injected test fuel in the RCCI mode. The Euro 2M diesel, used as a reference, was obtained from the Petronas Research Center. The research uses low-quality gaseous fuel, as premixed and port-injected LRF, which composed of 75% CH4 and 25% CO2 by mole, to simulate biomass-based biogas fuel. The biogas fuel was obtained from a gas company, Linde Malaysia. Table 3 presented some properties of the direct-injected fuels, and simulated biogas used. To the best of the authors’ knowledge, this article is first to report the effects of these fuels’ reactivity in RCCI mode.

3. Results

The results of the combustion, performance, and emission mannerism of the engine for B5 as direct-injected test fuel and diesel as reference fuel along with the biogas as port-injected fuel, are discussed in this section.

3.1. Effects of Injection at the Valve and Reactivity Fuels on the Combustion Attributes

To examine the combustion attributes of the engine many parameters were studied as discussed below.

3.1.1. Analysis of The In-Cylinder Pressure Traces

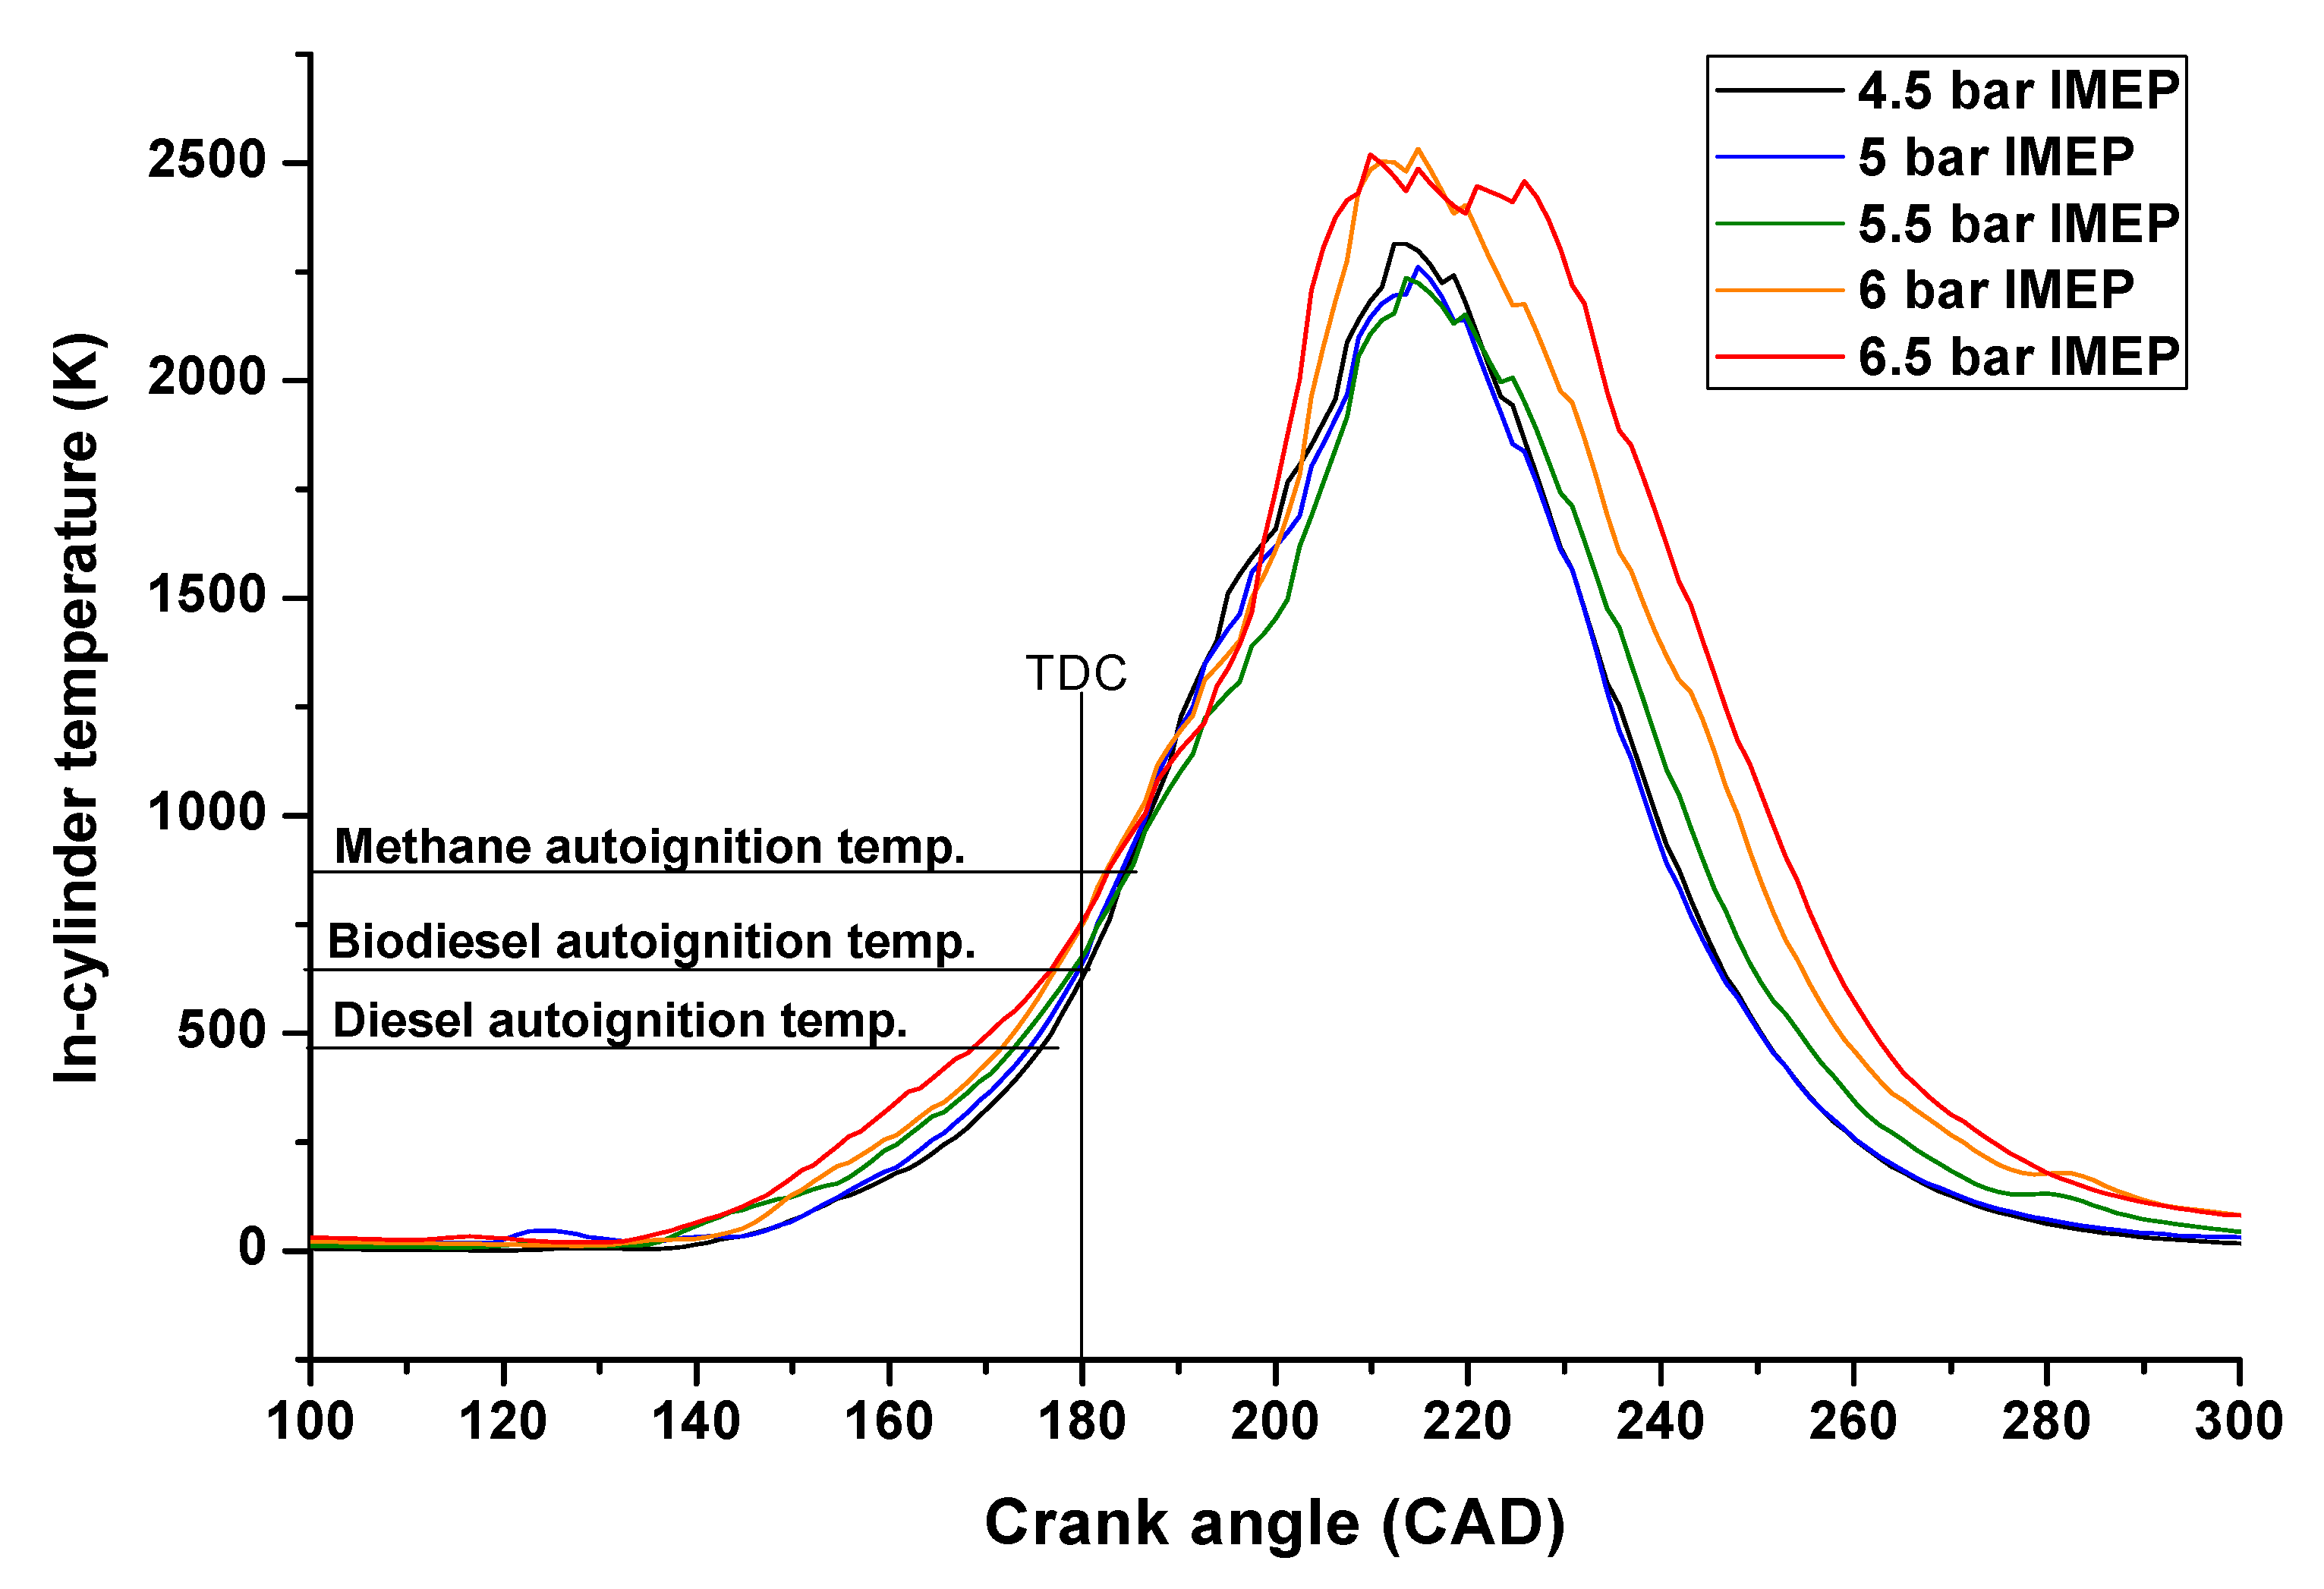
The B5 fraction was maintained at 50% for the various load conditions, to study its effect as an oxygenated fuel on the RCCI engine using simulated biogas as LRF. According to Figure 4a, the pattern of the pressure traces, for B5 and port-injected biogas at the valve, varies as the engine load increases with the maximum pressure developed at the first peak for all the loads except 6.5 bar IMEP, which manifested at the second peak. As observed in Figure 4a, the broadness of the pressure curves increased as the load increased. The increase in the area under the pressure curve signified more work done during the combustion at higher IMEP. The work output increased by 1.79% as the load increased to 5 bar IMEP while an extension to 5.5, 6, and 6.5 bar IMEP, relative to no-load condition, increased the work done by 9.15%, 15.40%, and 26.56% respectively. The more work could attribute to the increase in the concentration of the methane, which was more combustible in the biogas, as the load increased. Although there might be an insignificant rapid explosion, the trend in Figure 4a indicated no rise in the pressure due to an explosion at the early stage of the combustion. This phenomenon could be due to the reduced amount of B5-diesel injected, for which the ignition could be initiated in some reactivity pockets causing a delay in the explosion due to its burning. Subsequently, the explosion of the small amount of B5 might not be significant to cause a sudden rise in the in-cylinder pressure and cause an explosion of the biogas for the primary combustion without delay. Another reason could be an insufficient temperature at the early stage of the combustion to cause the rapid explosion as shown in Figure 5 below. In addition to the delayed eruption of the biogas, the amount of low quality of the biogas injected also affected the sudden rise in the cylinder pressure developed, especially at lower engine loads. Figure 4a also portrays that the rise in the second peak increase with the increase in the engine load as a consequence of more heat generated due to the burning effect of the biogas injected at the valve. A relatively insignificant rise in the peak manifested at 4.5 and 5 bar IMEP capacity. This characteristic signifies that the quantity injected at 4.5 and 5 bar IMEP capacity might relatively be insufficient to cause a significant rise in the second peak of the cylinder pressure. However, extending the load further resulted in more substantial growth in the second peak due to increased quantity of biogas burned, though maintained relatively the same fraction. Figure 4a also showed that the second peak development occurred during expansion as the period in which most of the heat generated could be due to the burning of LRF in the RCCI combustion. The trends of the pressure development signify that the combustion of the B5 and biogas injected at the valve was affected by the poor quality of the biogas used. However, the in-cylinder mixing of the biogas, as a consequence of injection at the valve, has an insignificant effect on the variation of the pressure traces at 6.5 bar IMEP, as indicated in Figure 4b. Similar trends of the pressure traces were, also, observed at other load capacities. As seen in Figure 4b, the biogas injection at the valve resulted in higher in-cylinder pressure at the first peak compared to premixed mode. It is because the heterogeneity of the charge mixture facilitates more stratification of the methane compound causing early burning of the biogas. However, the combustion of B5 and biogas injected at the valve produces more negative temperature coefficient, which affects the progression of the pressure development before attaining peak stage contrary to that of the premixed port-injected biogas. Retarded combustion phase could be another factor that affects the cylinder pressure development [40]. Figure 4b further shows that both B5 and traditional diesel fuels indicated similar patterns of the in-cylinder pressure developed, though there were slight differences at various crank angle positions, under 6.5 bar IMEP. However, the figure depicted that use of B5 along with the premixed port-injected biogas, in reactivity, co-assisted in reducing the negative temperature coefficient causing smoother pressure development contrary to the outcome of the traditional diesel.
To elaborate on the port injection at the valve, as a modified LRF delivery approach. Figure 4c depicted that, the combustion of the regular diesel and biogas, in a formally premixed RCCI mode, generates more in-cylinder pressure during compression, unlike the approach of port injection at the valve. The higher in-cylinder pressure could be due to the magnitude of the air-fuel mixing causing partial oxidation of the biogas during low-temperature heat release, in addition to the usual oxidation of the diesel. Besides, Figure 4c reaffirmed the benefit of premixing, though insignificant, in reducing the effect of negative temperature coefficient, which affects the progression of the pressure development before attaining peak stage.
• Maximum in-cylinder pressure and temperature:
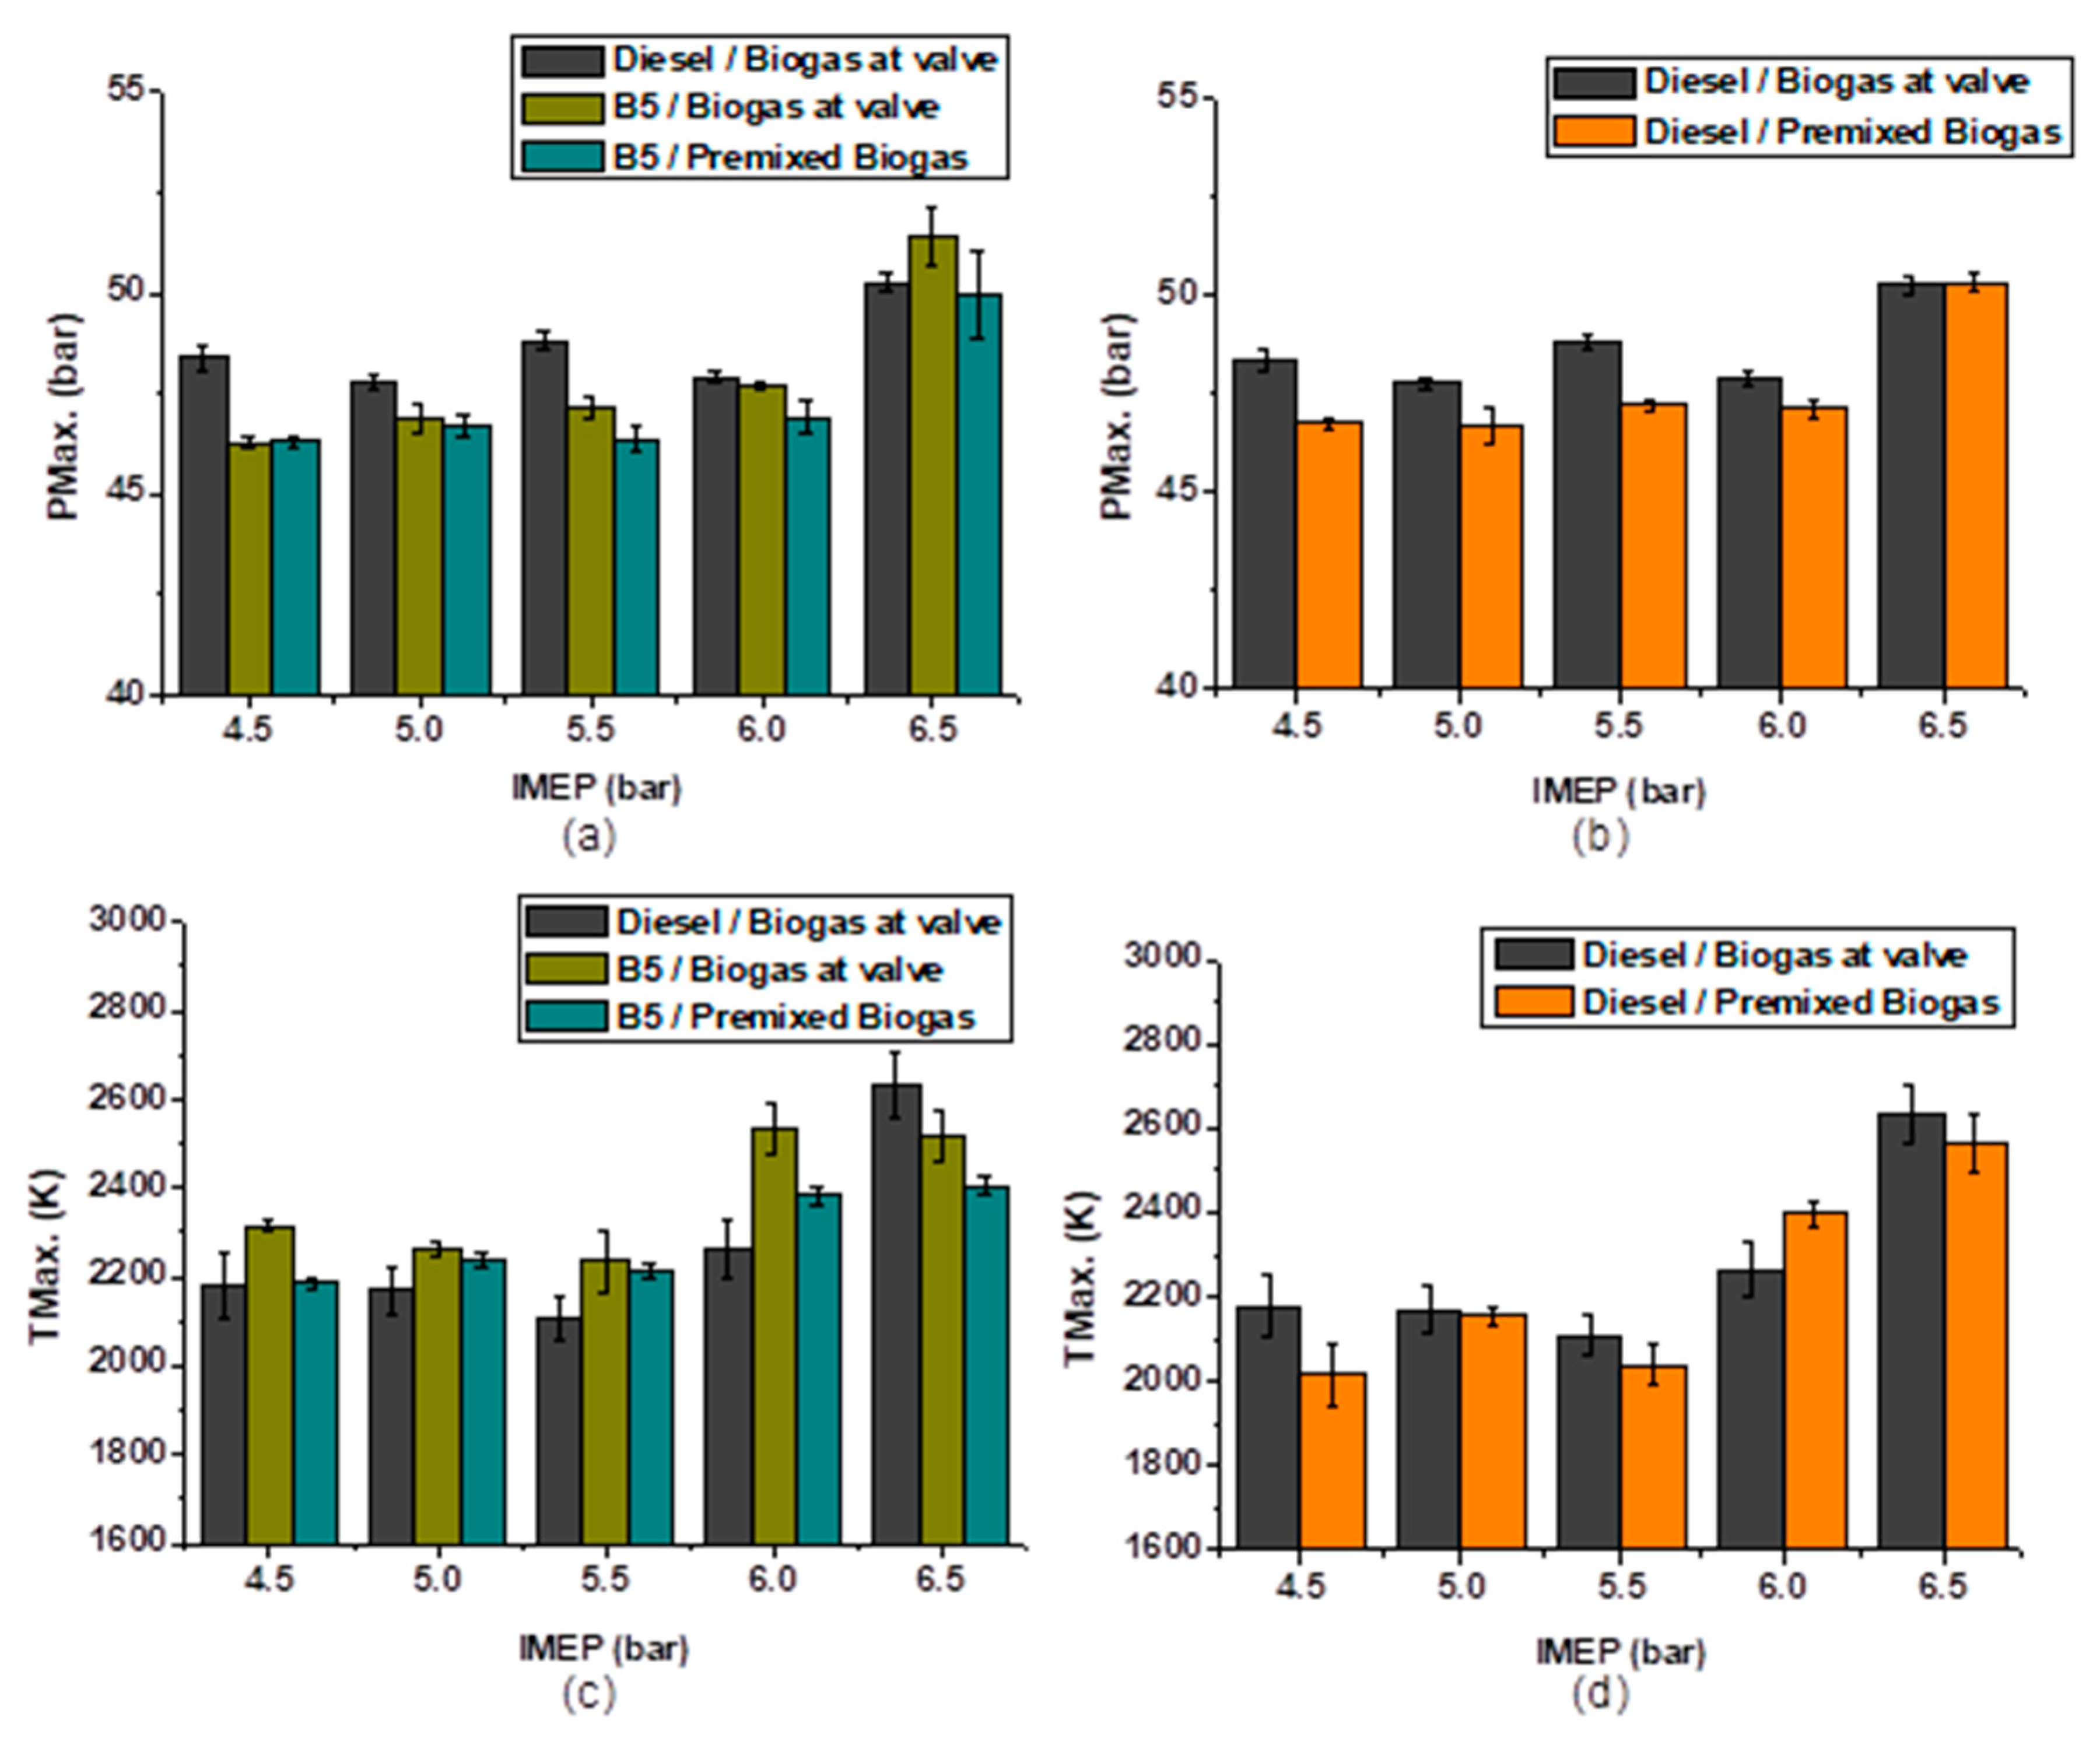
Figure 6a shows that the peak in-cylinder pressure falls with the use of B5 and biogas injected at the valve, at all the load levels compared to that of the regular diesel except the full capacity. At 6.5 bar IMEP, the combustion of B5 and biogas injected at the valve demonstrated the highest maximum in-cylinder pressure. The rise in the maximum pressure at 6.5 bar IMEP could be due to the combined effects of the injected quantity of B5 and fuels reactivity. The use of these fuels indicated a steady increase in the maximum in-cylinder pressure as engine load increased. The differences in the maximum pressure, for the regular diesel and biogas injected at the valve, were more significant at no-load to mid-load and decreased as the engine load approached 6.5 bar IMEP. As observed from Figure 6a, the maximum in-cylinder pressure, for the burning of B5 and premixed biogas, insignificantly increased as the engine load increases; thus, 5 bar IMEP indicated higher maximum in-cylinder pressure compared to mid 5.5 bar IMEP. Reaching balance in the energy provided by the reactivity fuels at a load of 5.5 bar IMEP resulting in various abnormalities might be the reason for the little rise in the pressure at this particular load. The combustion of B5 along with both premixed and biogas injected at the valve showed the same maximum strength developed at no-load condition, but injection at the valve comparatively developed higher maximum pressure as the engine load increased from 5 to 6.5 bar IMEP. The balance in the strength at no-load condition could be due to the effect of injection method on the maximum pressure was relatively independent of the engine load, hence could virtually rise or fall at any load setting. Besides, the margin in the maximum pressures also increased as the engine load increased. Above discussions showed that the rise in the engine load or reduced air to fuel mixing before entering the cylinder might be the cause for rising the cylinder pressure, as also evidenced in Figure 6b. Compared to the usual premixed approach, Figure 6b illustrates that the peak pressure developed was higher with the use of diesel and biogas in a premixed than port-injection at the valve for all the load conditions except 6.5 bar IMEP, which indicated relatively the same pressure. This pattern at 6.5 bar IMEP revealed that injection at the valve did not influence the attainment of the maximum pressure, as also shown in 4c above. It further implies that the variability of the maximum pressure could be dependent on the reactivity of the fuel at this particular load capacity. The figure also revealed that the variation in the maximum in-cylinder pressure was insignificantly influenced by the increase in the engine load though escalated at a maximum of 6.5 bar IMEP.
According to Figure 5 above, the in-cylinder temperature traces for the combustion of B5 and biogas injected at the valve varies with the engine loads. The figure shows an increase in temperature with the increase in the engine capacity at certain stages of the combustion more, especially during expansion. As the injection of the B5 begins around 156–160° CA BTDC in the presence of biogas, the temperature builds up was steadily shown up to about 4 CA BTDC. At this stage, an apparent increase in the temperature as a consequence of the rise in the engine capacity can be seen mainly due to compression, B5 impingement and likely some ignited pockets. The temperature in the cylinder does not reach an autoignition temperature of the HRF until the piston gets very closed to the TDC. This phenomenon implies that an explosion does not occur until 4–5 CA BTDC. Subsequently, an abrupt rise in the temperature was shown due to the explosion of the B5 at some concentrated areas in the cylinder, though not sufficient enough to erupt the whole mixture and cause a quick rise in the pressure. Presence of the low-quality biogas injected from the beginning of the intake stroke was another factor that suppressed the significant impact of the initial explosion. The explosive characteristics manifested up to around 195° CA irrespective of the load capacity. From 195° onward the autoignition temperature of methane was reached leading to more burning of the biogas and subsequently exploded. Poor quality of the biogas still affected the quick explosion of the whole mixture until it reached around 195–200° CA. This phenomenon significantly affected the rate of pressure development, as shown in Figure 4a above. Figure 5 indicated that the maximum in-cylinder temperature correlates with the pattern in Figure 6c, as discussed below. Amidst the power stroke, the cylinder temperature increased with the increase in the engine load because the combustion at the stage was mainly due to the burning of the biogas, which varied with the engine load. According to Figure 6c, the reactivity of B5 and biogas injected at the valve generated high maximum in-cylinder temperature, at all the load conditions except 6.5 bar IMEP. The high in-cylinder temperature could relate to the oxygenated nature of biodiesel content in the blend and reduced port mixing, which enabled more burning of the B5 at the early stages of the combustion, unlike the low-quality biogas that might affect the temperature development. However, the maximum in-cylinder temperature decreased as the engine load increased from no-load to mid-load and rose to the maximum at 6 bar IMEP; hence, the least maximum temperature manifested at mid-load. The decrease in the cylinder temperature from no-load to mid-load could be due to the ratio of the low-quality biogas, because of the high CO2 concentration, that affects the rate of the heat released to contribute in raising the cylinder temperature. At the mid 5.5 bar IMEP, the energy supplied by the reactivity fuels reached equilibrium position, hence generating least heat and developed a least maximum in-cylinder temperature. As the engine load rose to a higher capacity, the heat generated due to the burning of B5 outweighed that of the biogas, causing a rise in the maximum in-cylinder temperature. The pattern of the heat release rate shown in Figure 7a could be a justification to the said argument. Besides, the fall in the maximum temperature at 6.5 bar IMEP for the burning B5 relative to diesel combustion could also relate to the less heat generated due to some heat losses subjecting the engine to be less efficient with the use of B5 (see Figure 8a and Section 3.2). Figure 6c further explained that the burning of B5 along with the biogas in a premixed mode lowers the maximum in-cylinder temperature, at all the load capacities, compared to the biogas injection at the valve. Although the trend of the maximum in-cylinder temperature generated looked closely similar to that of the biogas injected at the valve, the margin of the temperature difference was more pronounced at the higher loads. The rise in the in-cylinder temperature reaffirmed the benefits of biogas injection at the valve, which may help reduce the CO and UHC emissions at a light engine load. However, the use of B5 as an oxygenated HRF and biogas injection at the valve served more significant advantage over the regular diesel and biogas in the same mode for the light engine load operation, as evidenced in Figure 6c. The benefit of biogas injection at the valve is further shown in Figure 6d though 6 bar IMEP indicated otherwise likely because other factors such as longer ignition delay might have affected the maximum cylinder pressure developed.

3.1.2. Rate of the Combustion Heat Release

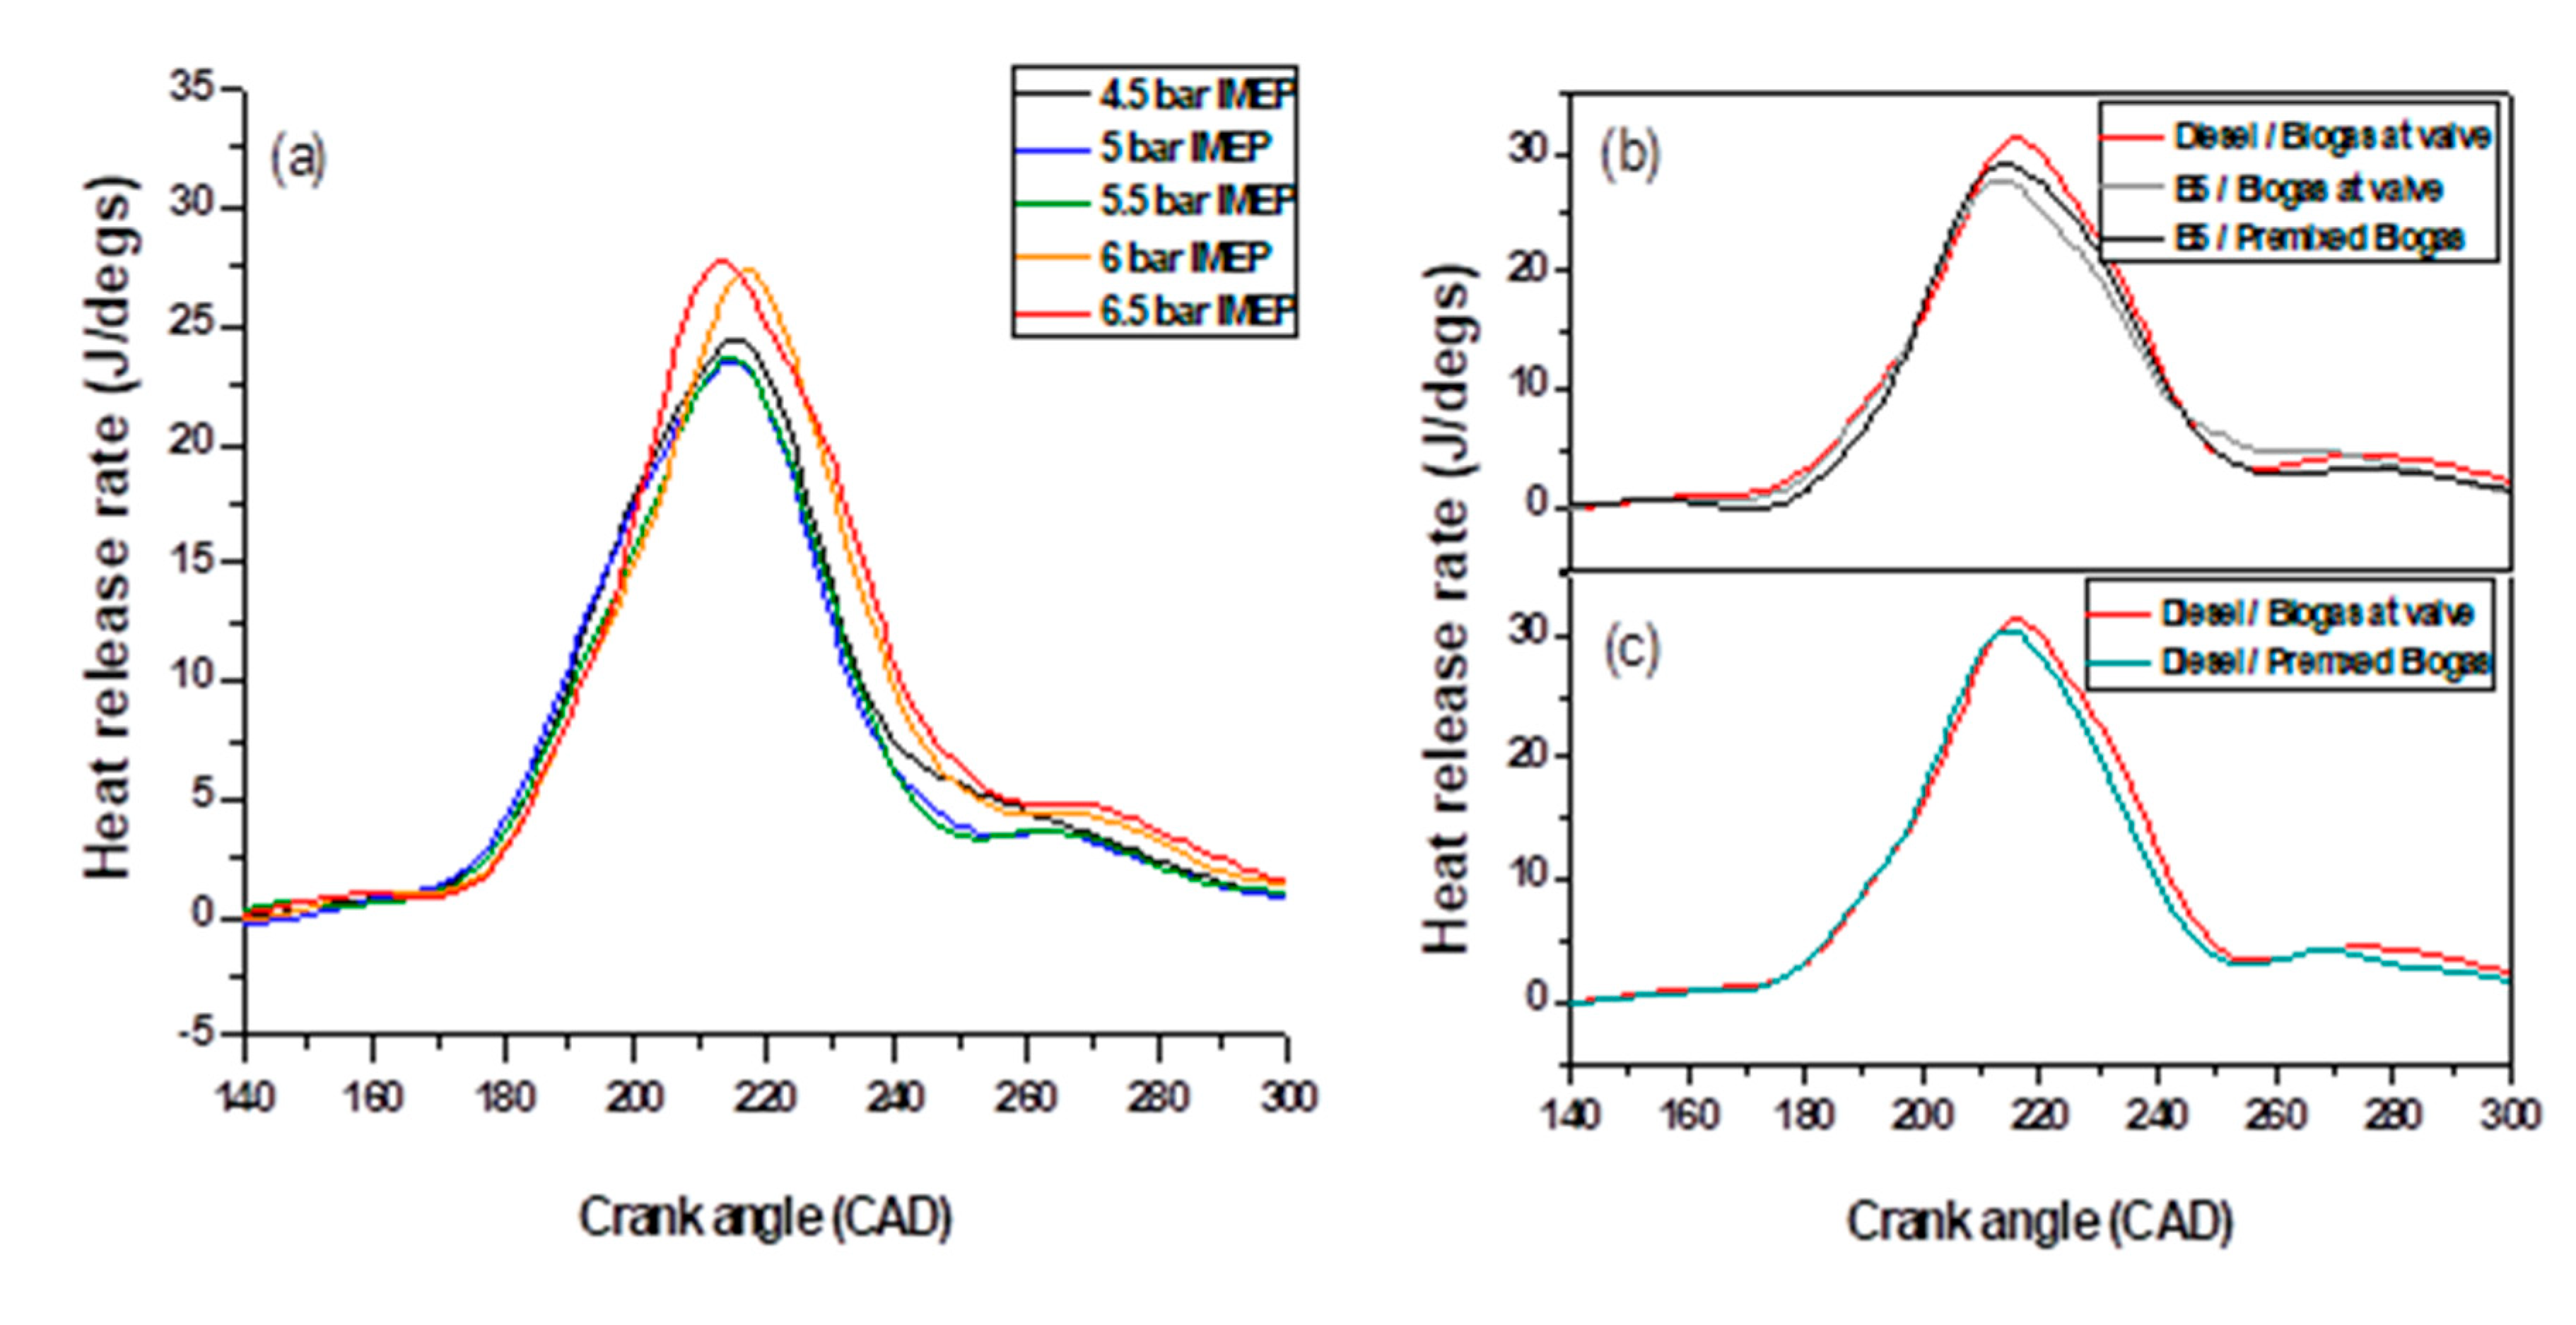
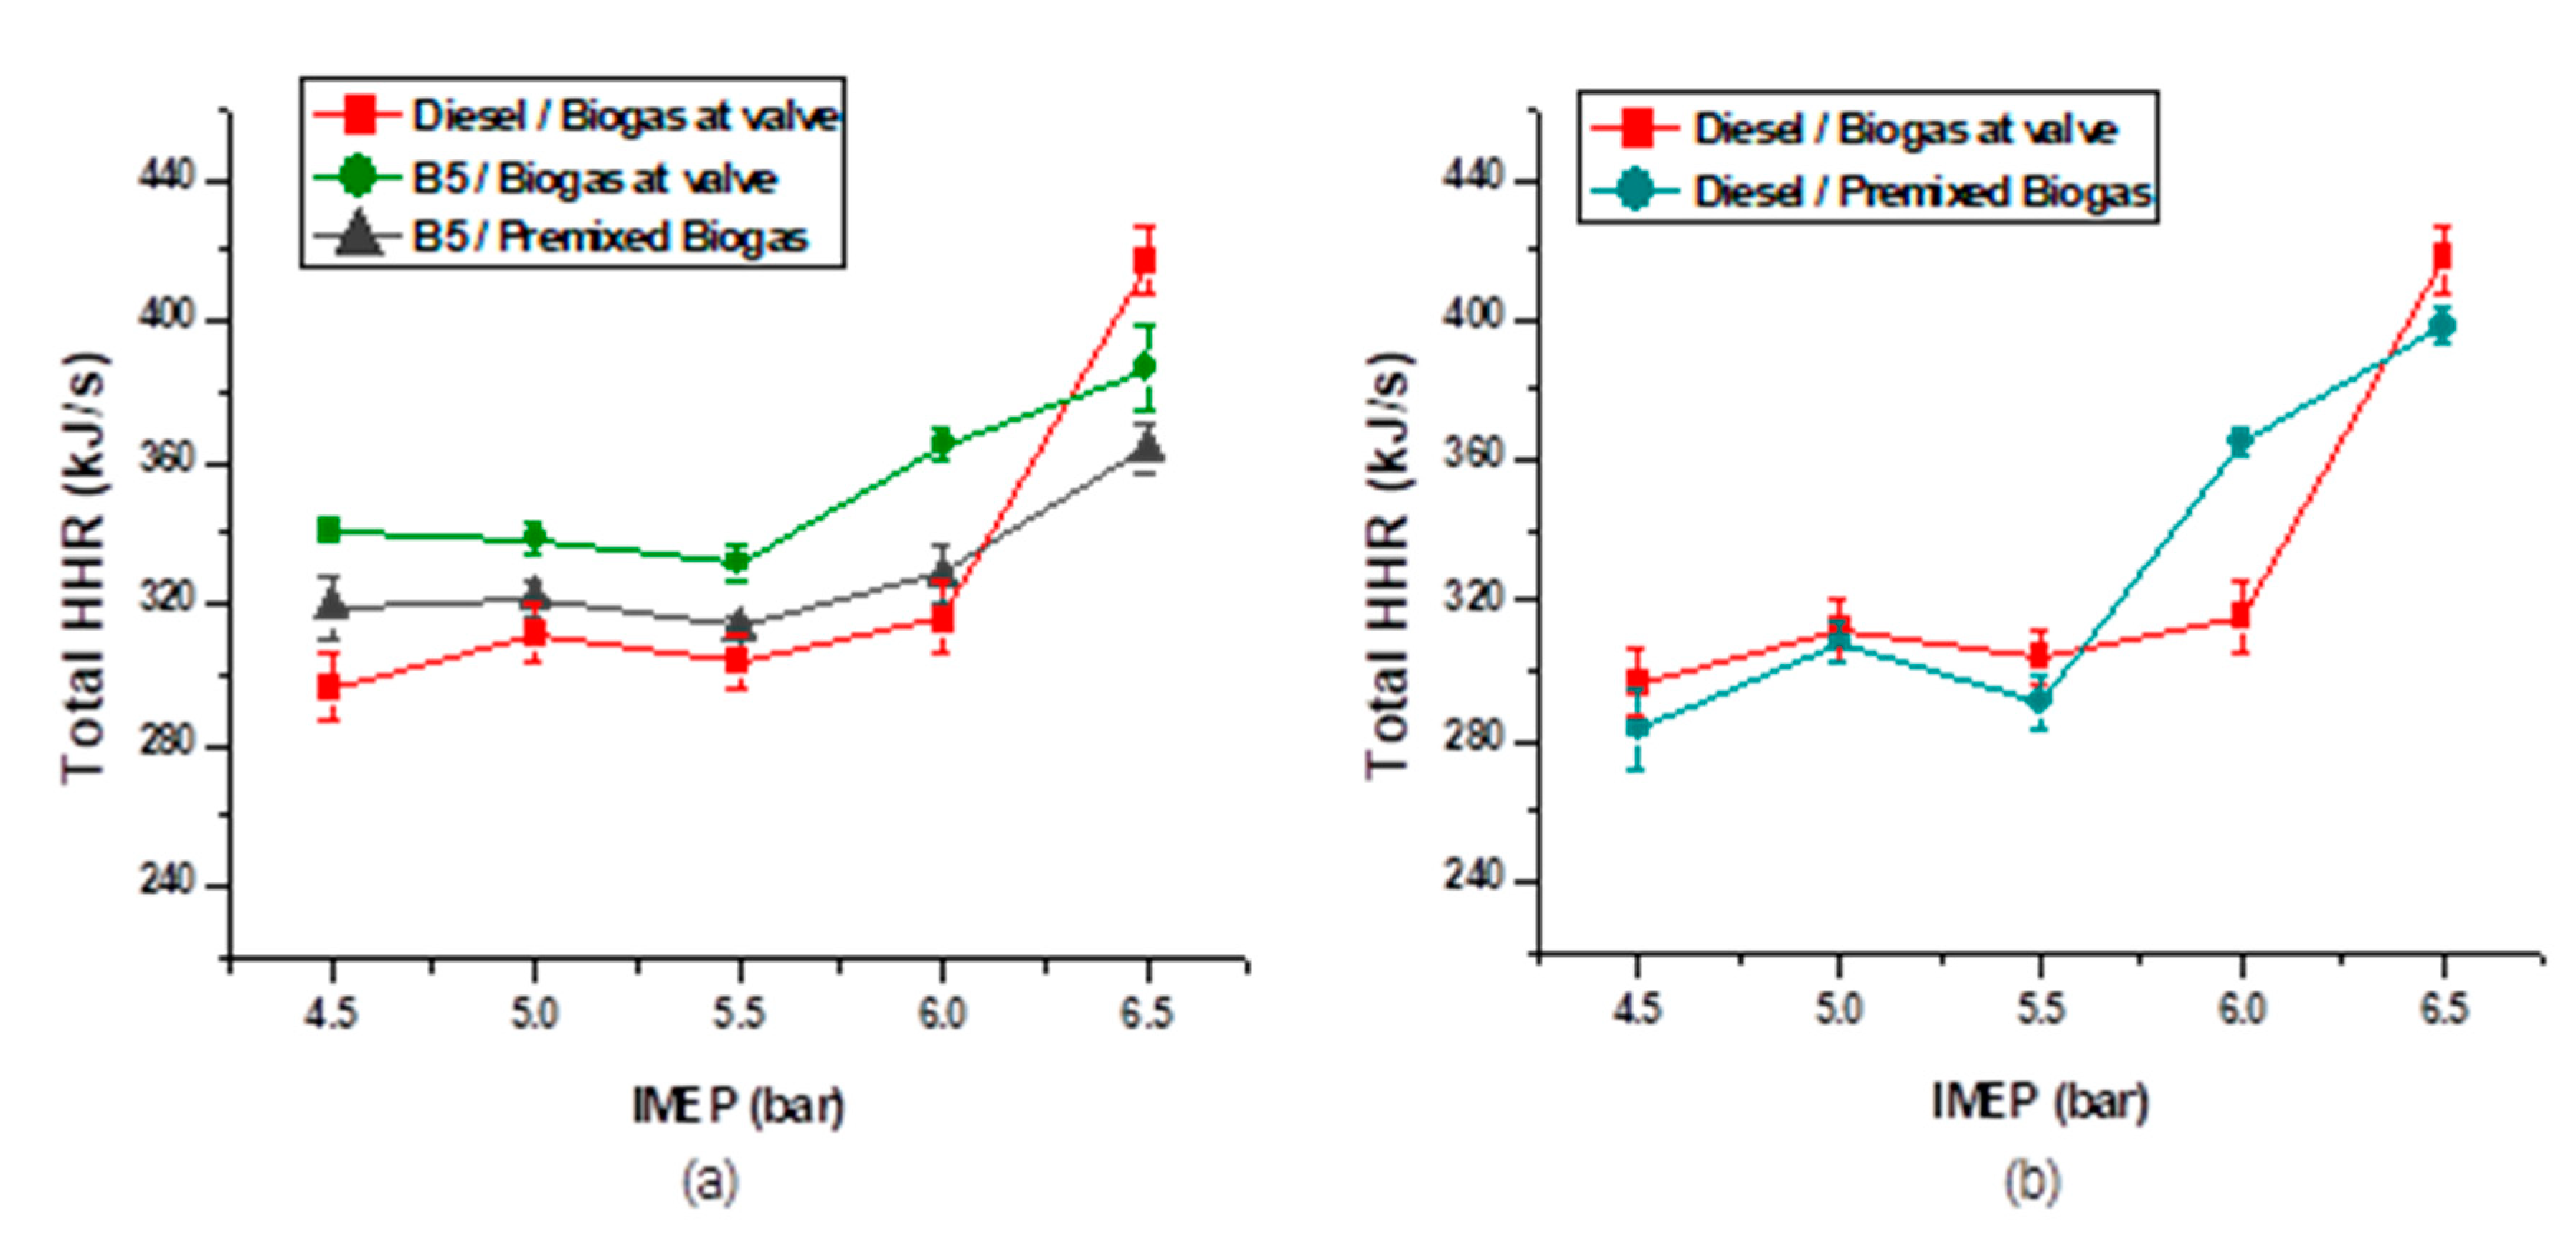
Figure 7a above presented the heat generated when burning B5 along with the biogas injected at the valve. As observed from Figure 7a, the significant rise in the temperature began during expansion, as the period of which a considerable amount of the mixture gets burned. The rate of the heat development at various crank angles decreased as the engine load increased to mid-load, then rose as the load approached a maximum of 6.5 bar IMEP. This trend might be an attribute of short ignition delay exhibited at a load of 4.5 bar IMEP (refer to Section 3.1.4 for more explanation). The short ignition delay might increase the rate of burning of the mixture resulting in higher peak heat released though developed lower pressure at the second peak, as depicted in Figure 4a. According to Figure 7b, use of B5 and biogas in a conventional premixed mode resulted in higher maximum heat, at some crank angle position (210–240 CAD) during expansion, compared to that of the injection at the valve. The heat released pattern behaved otherwise at crank angles before and after such a range. The trend might be due to factors other than injection approach or in-cylinder temperature because Figure 6c and Figure 8a, respectively, indicated that biogas injection at the valve yielded higher maximum in-cylinder temperature and total heat released at full load of 6.5 bar IMEP. Besides, Figure 7c justified that biogas injection at the valve contributed to raising the heat in the cylinder as a consequence of the higher temperature developed. Figure 8a presented some details on the total rate of heat generated for the combustion of these fuels at various load capacities. As observed from Figure 8a, the burning of B5 and biogas injected at the valve indicated a higher total rate of heat generated, compared to the conventional premixed approach, at all the load capacities, which could be a consequence of higher temperature generated as shown in Figure 6c under Section 3.1.1. Using diesel as test fuel along with the biogas injection at the valve indicated an escalated total heat at a load of 6.5 bar IMEP, which could be due to a higher engine efficiency compared to the use of B5 under both premixed and port injection at the valve. Although, Figure 8a further indicated that the total heat generated at the mid 5.5 bar IMEP was affected by the less in-cylinder temperature developed at this particular load capacity causing lower total heat compared to that of 5 bar IMEP. A balance in energy supplied by the reactivity fuels could be the reason for the lower cylinder temperature at 5.5 bar IMEP. Compared to the use of conventional diesel and biogas injected at the valve, the heat generated using B5 remained higher at all the engine load except full 6.5 bar IMEP. This higher heat generated could be attributed to the oxygenate property of B5 that led to high cylinder temperature. The benefits of the injection at the valve is, also, shown in 8b, though the figure indicated an abnormal behavior at a load of 6 bar IMEP likely because of the longer ignition delay that might affect the rate of the heat and temperature development (Figure 6d).

3.1.3. Rate of the In-Cylinder Peak Pressure Rise

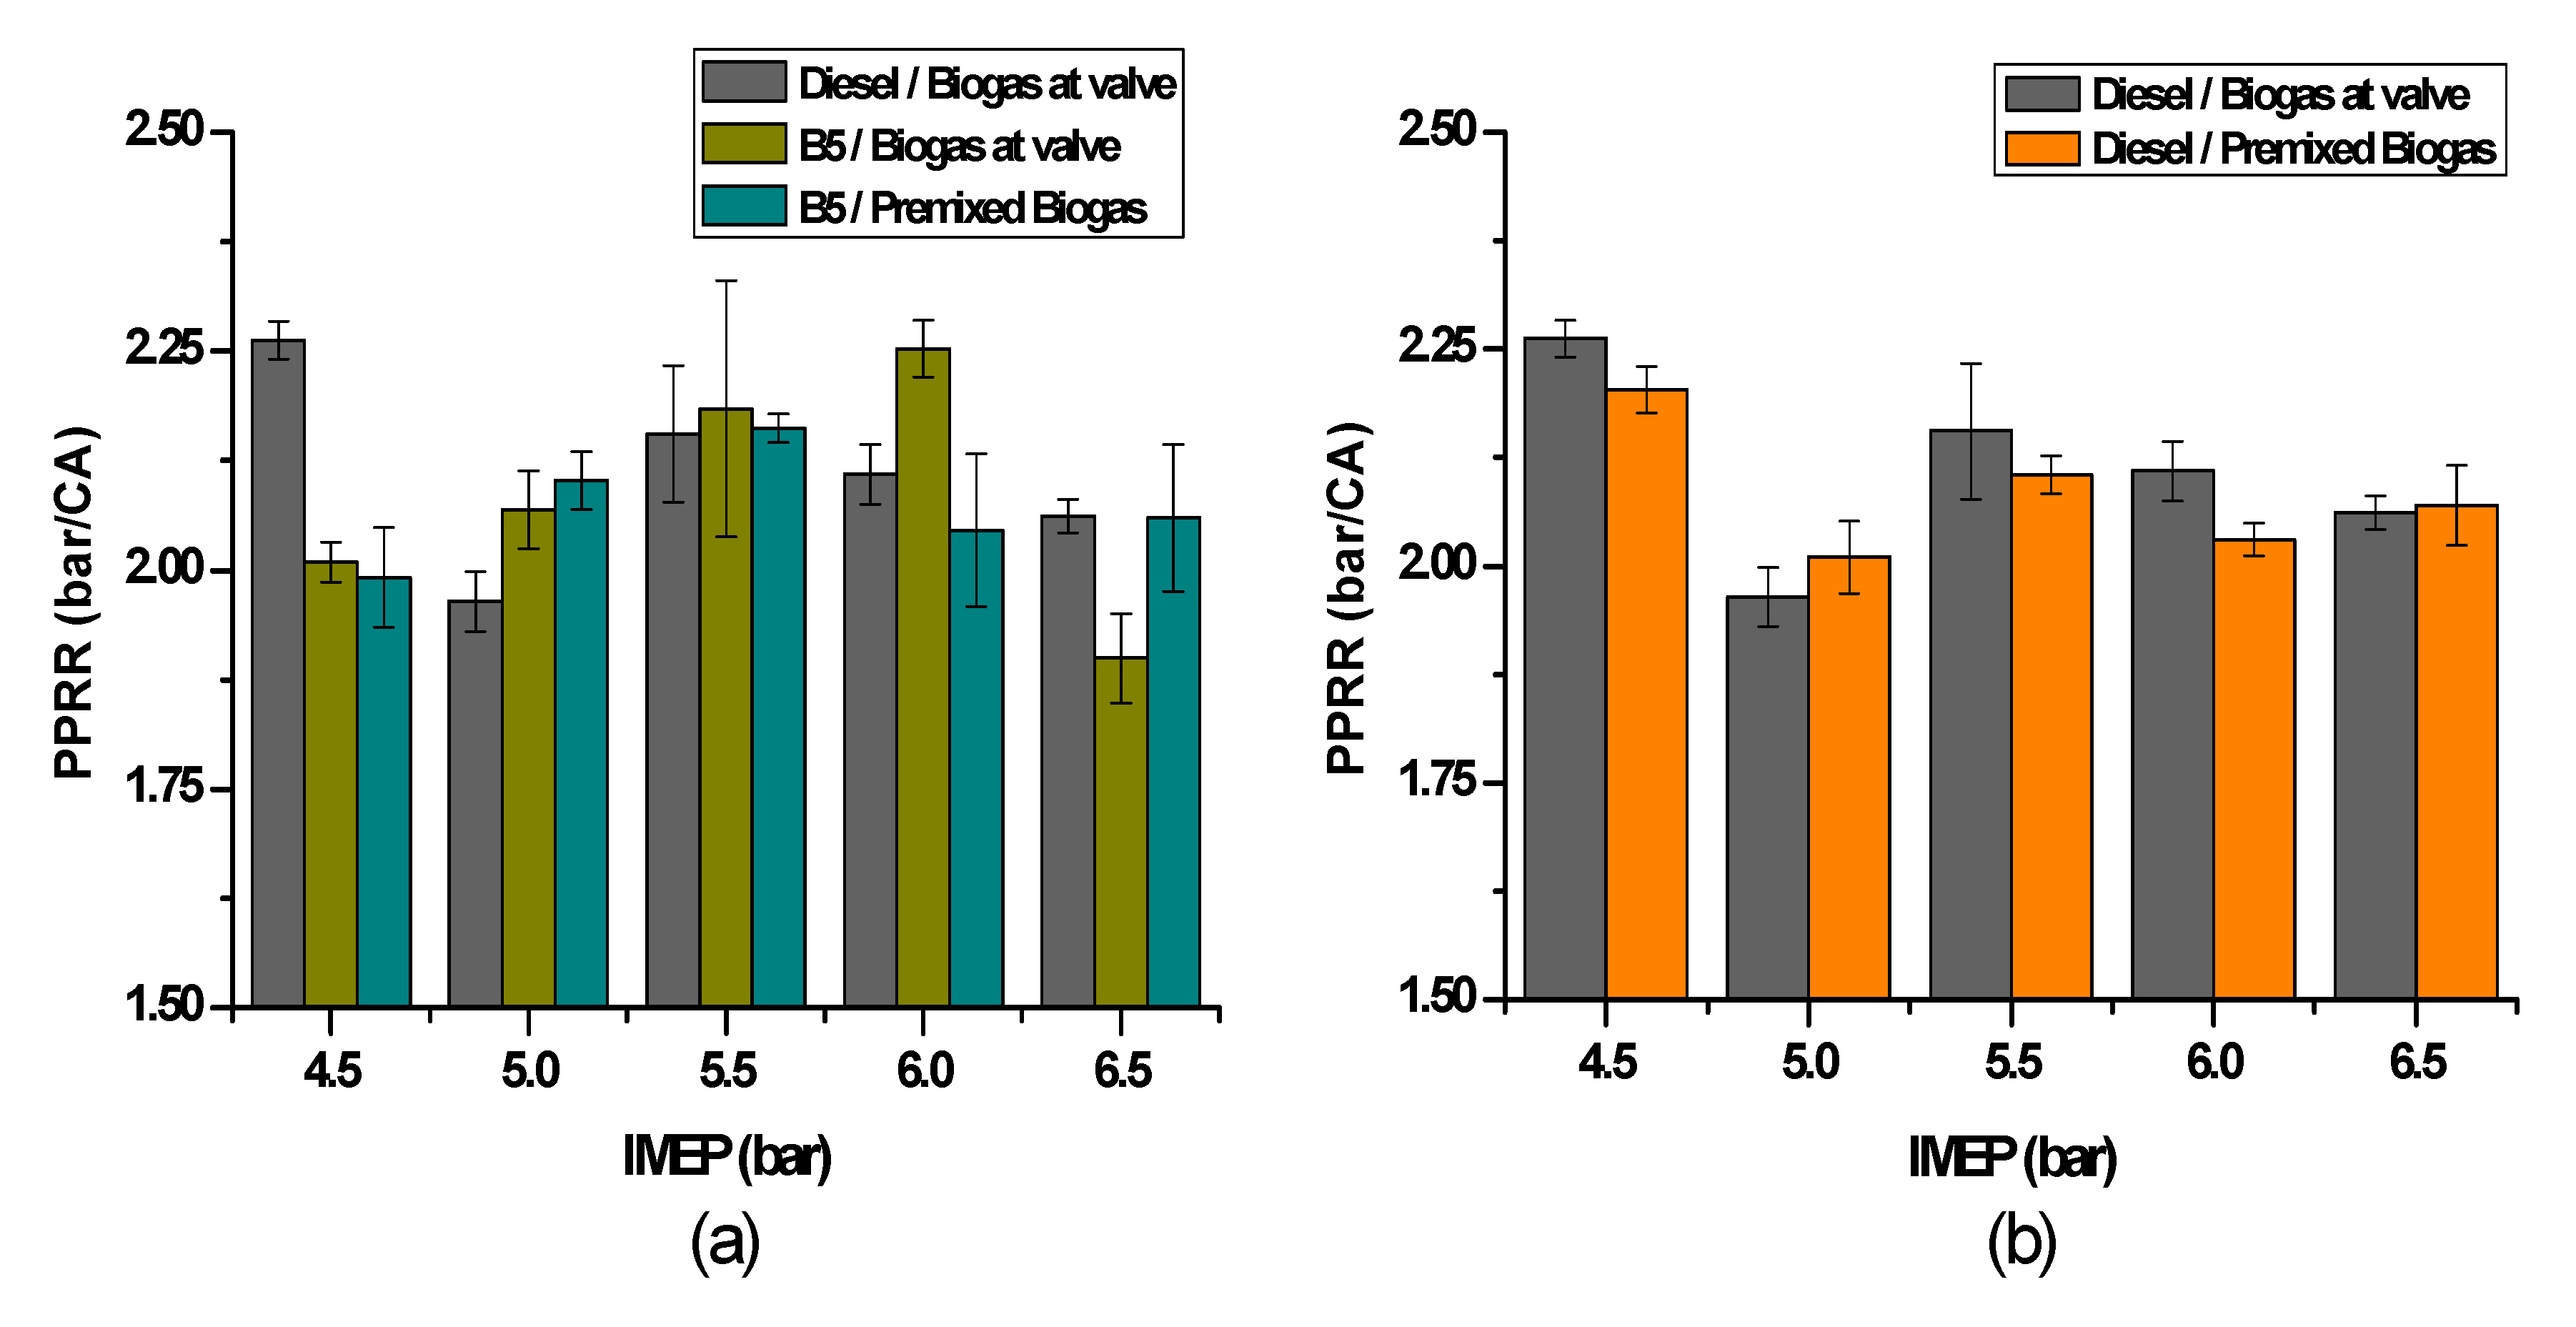
Figure 9a revealed that the peak pressure rises rate (PPRR) increased gradually with the increase in the engine load for the B5 fuel combustion in reactivity with the biogas injected at the valve, though went down drastically at a maximum of 6.5 bar IMEP. A similar pattern manifested with the premixed biogas, especially at no-load to mid-load positions. The PPRR fell as the engine load extended to full 6.5 bar IMEP. To explain this trend, Figure 9b indicated the tendency of having a high PPRR with the conventional diesel at the no-load state and decreased with the increased engine load for both premixed and biogas injected at the valve, though it went much low at a capacity of 5 bar IMEP. Therefore, the reduction in the PPRR could be due to the rise in the proportion of the CO2 gas that did not contribute in heating the cylinder as the load increased, but the heating effect of the biodiesel proportion in the B5 mixture counteracted the impact of the CO2 gas resulting in higher PPRR during B5 combustion. However, the high in-cylinder temperature has been the expected cause of PPRR, hence having high PPRR at a mid 5.5 bar IMEP deviate from the usual trend. Homogeneity of the mixture due to advanced injection timing could be a contributing factor in rising the PPRR [41]. Looking at it from another perspective, the values of the PPRR obtained are generally low, in fact, much lower than the 4 bar/CA as the EURO VI limit for the light-duty diesel engine. This attribute signifies that 5.5 bar IMEP could likely remain an equilibrium state for the change in reactivity status, implying that the energy supplied by the reactivity fuels might be balanced and reduced the impact of the direct-injected fuel, causing a significant rise in the pressure for change in the crank angle. Furthermore, this is indicating that, at a load of 5.5 bar IMEP, the increase in the peak pressure was influenced by the variability in the fuel reactivity. As shown in Figure 9b, the biogas injection at the valve could potentially cut down the PPRR at high load, hence reducing the tendency of having ringing intensity because of the higher quantity of direct-injected fuel [42]. Generally, the engine demonstrated acceptable PPRR for all the high reactivity fuels used, under both premixed and biogas injection at the valve, as depicted in Figure 9a,b. The patter of the PPRR in both Figure 9a,b does not reflect a uniform attribute across the engine capacities for both premixed and port injection at the valve. The figures indicated that biogas injection at the valve showed less PPRR at 5 and 6.5 bar IMEP while the premixed mode superseded at other loads capacities signifying that the PPRR is independent on the combined effects of the loads and injection technique.

3.1.4. The Dynamism of the Combustion Phase

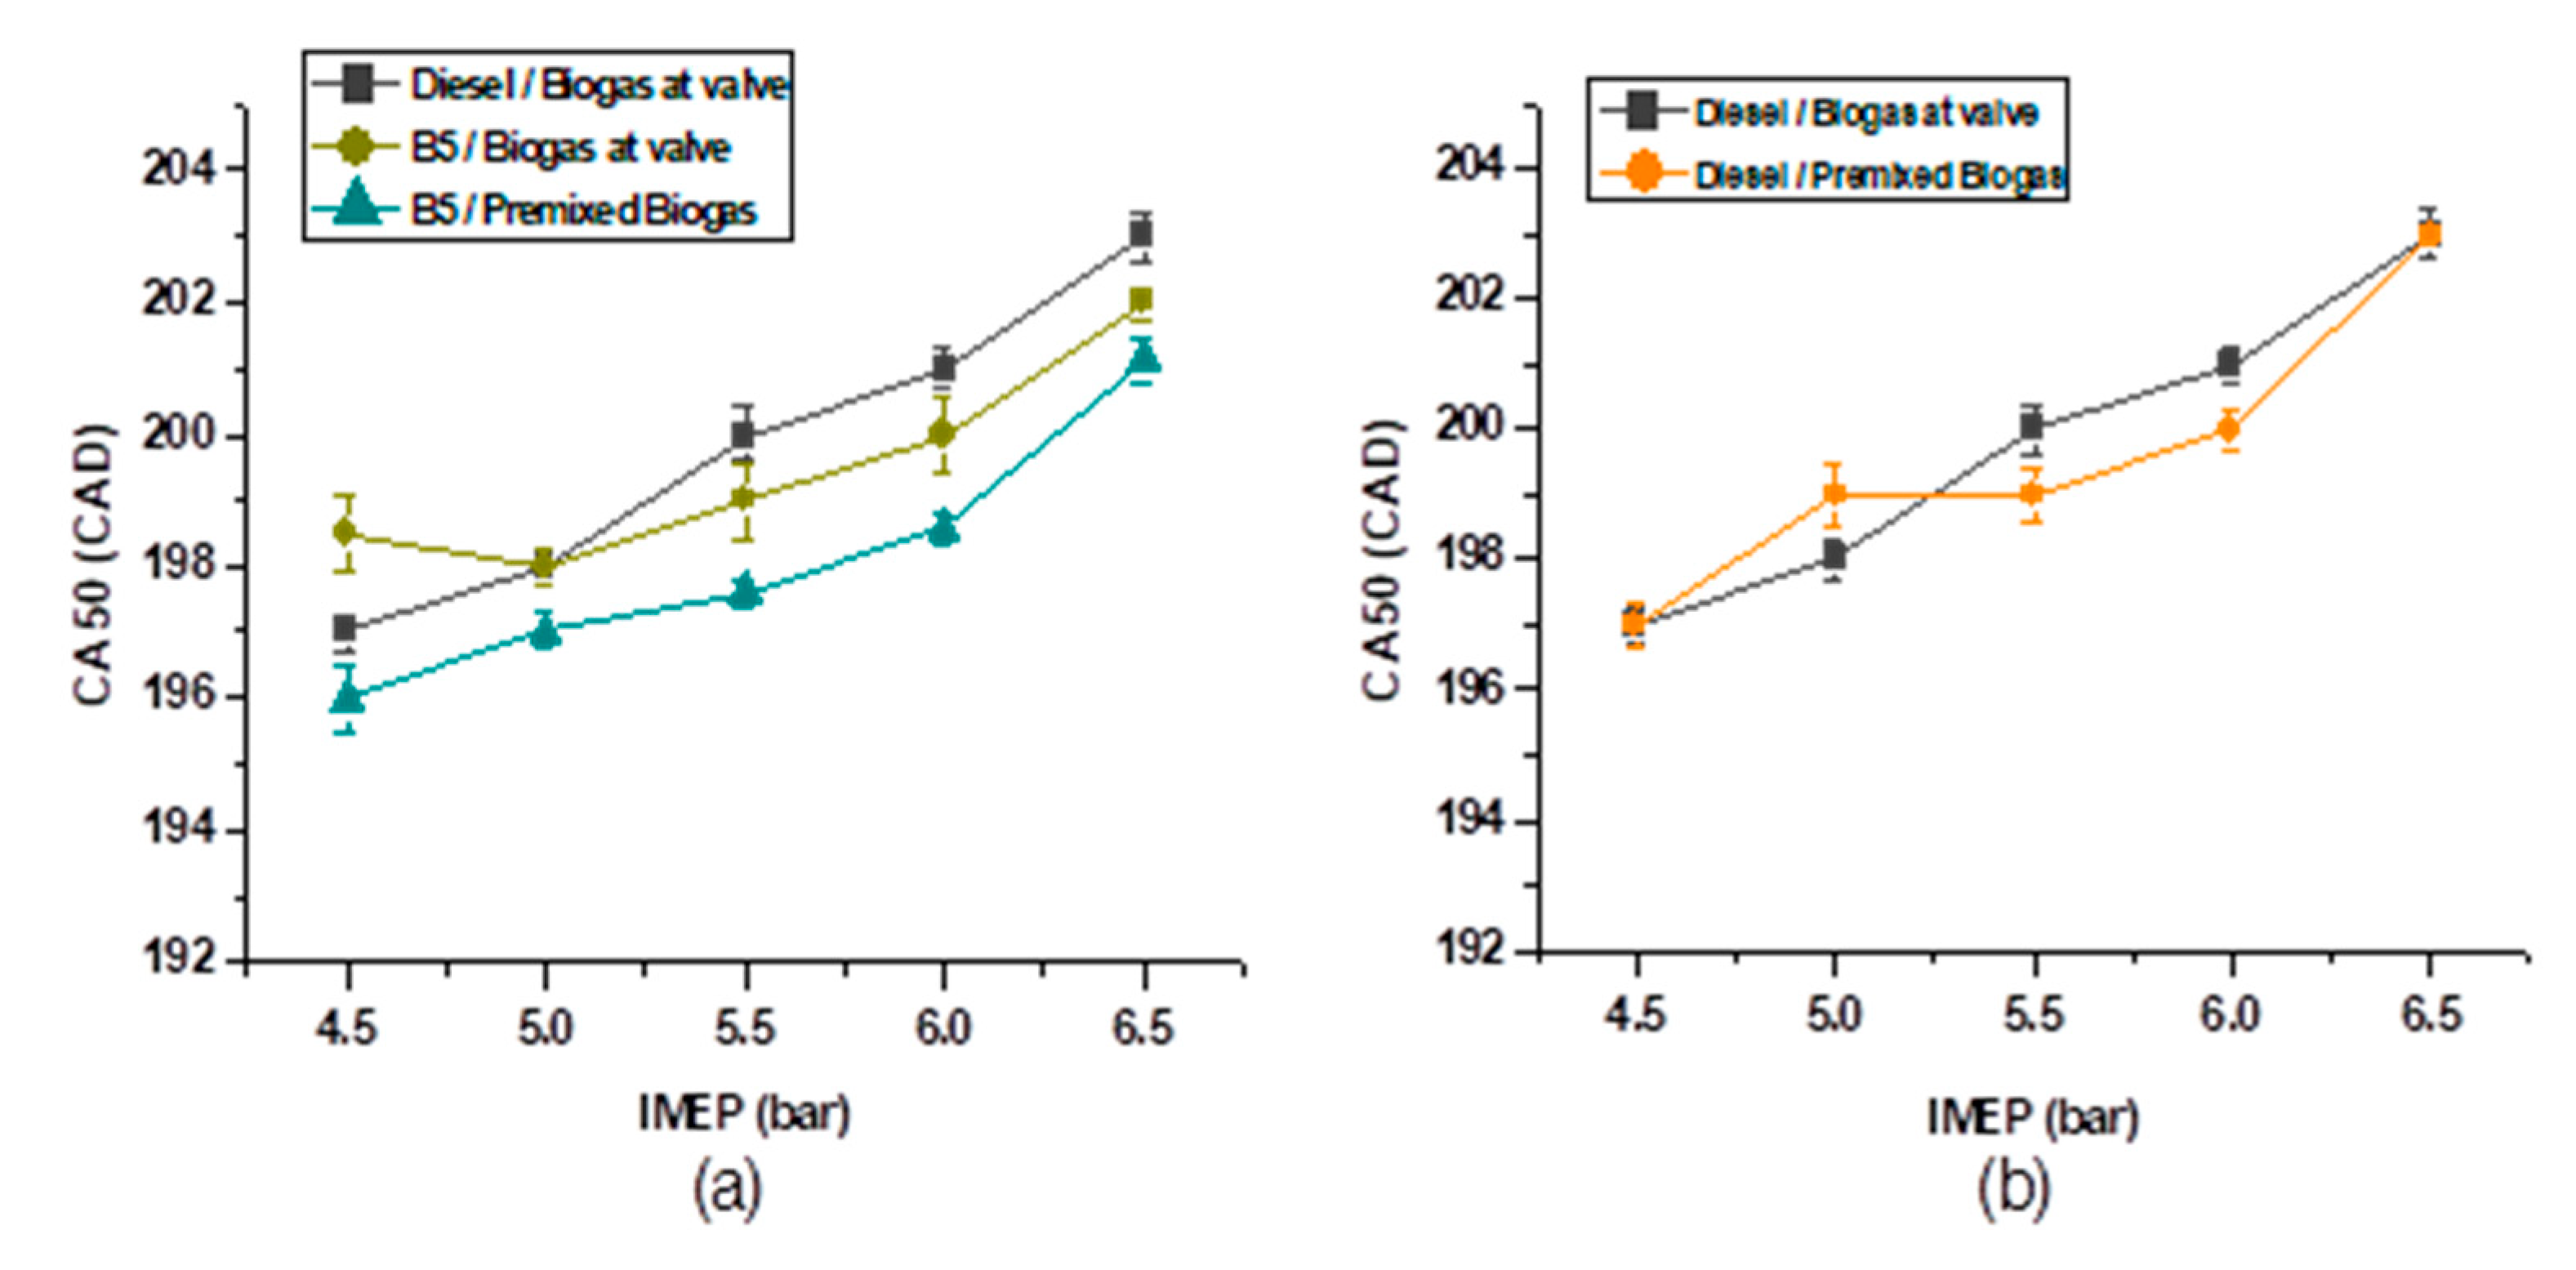
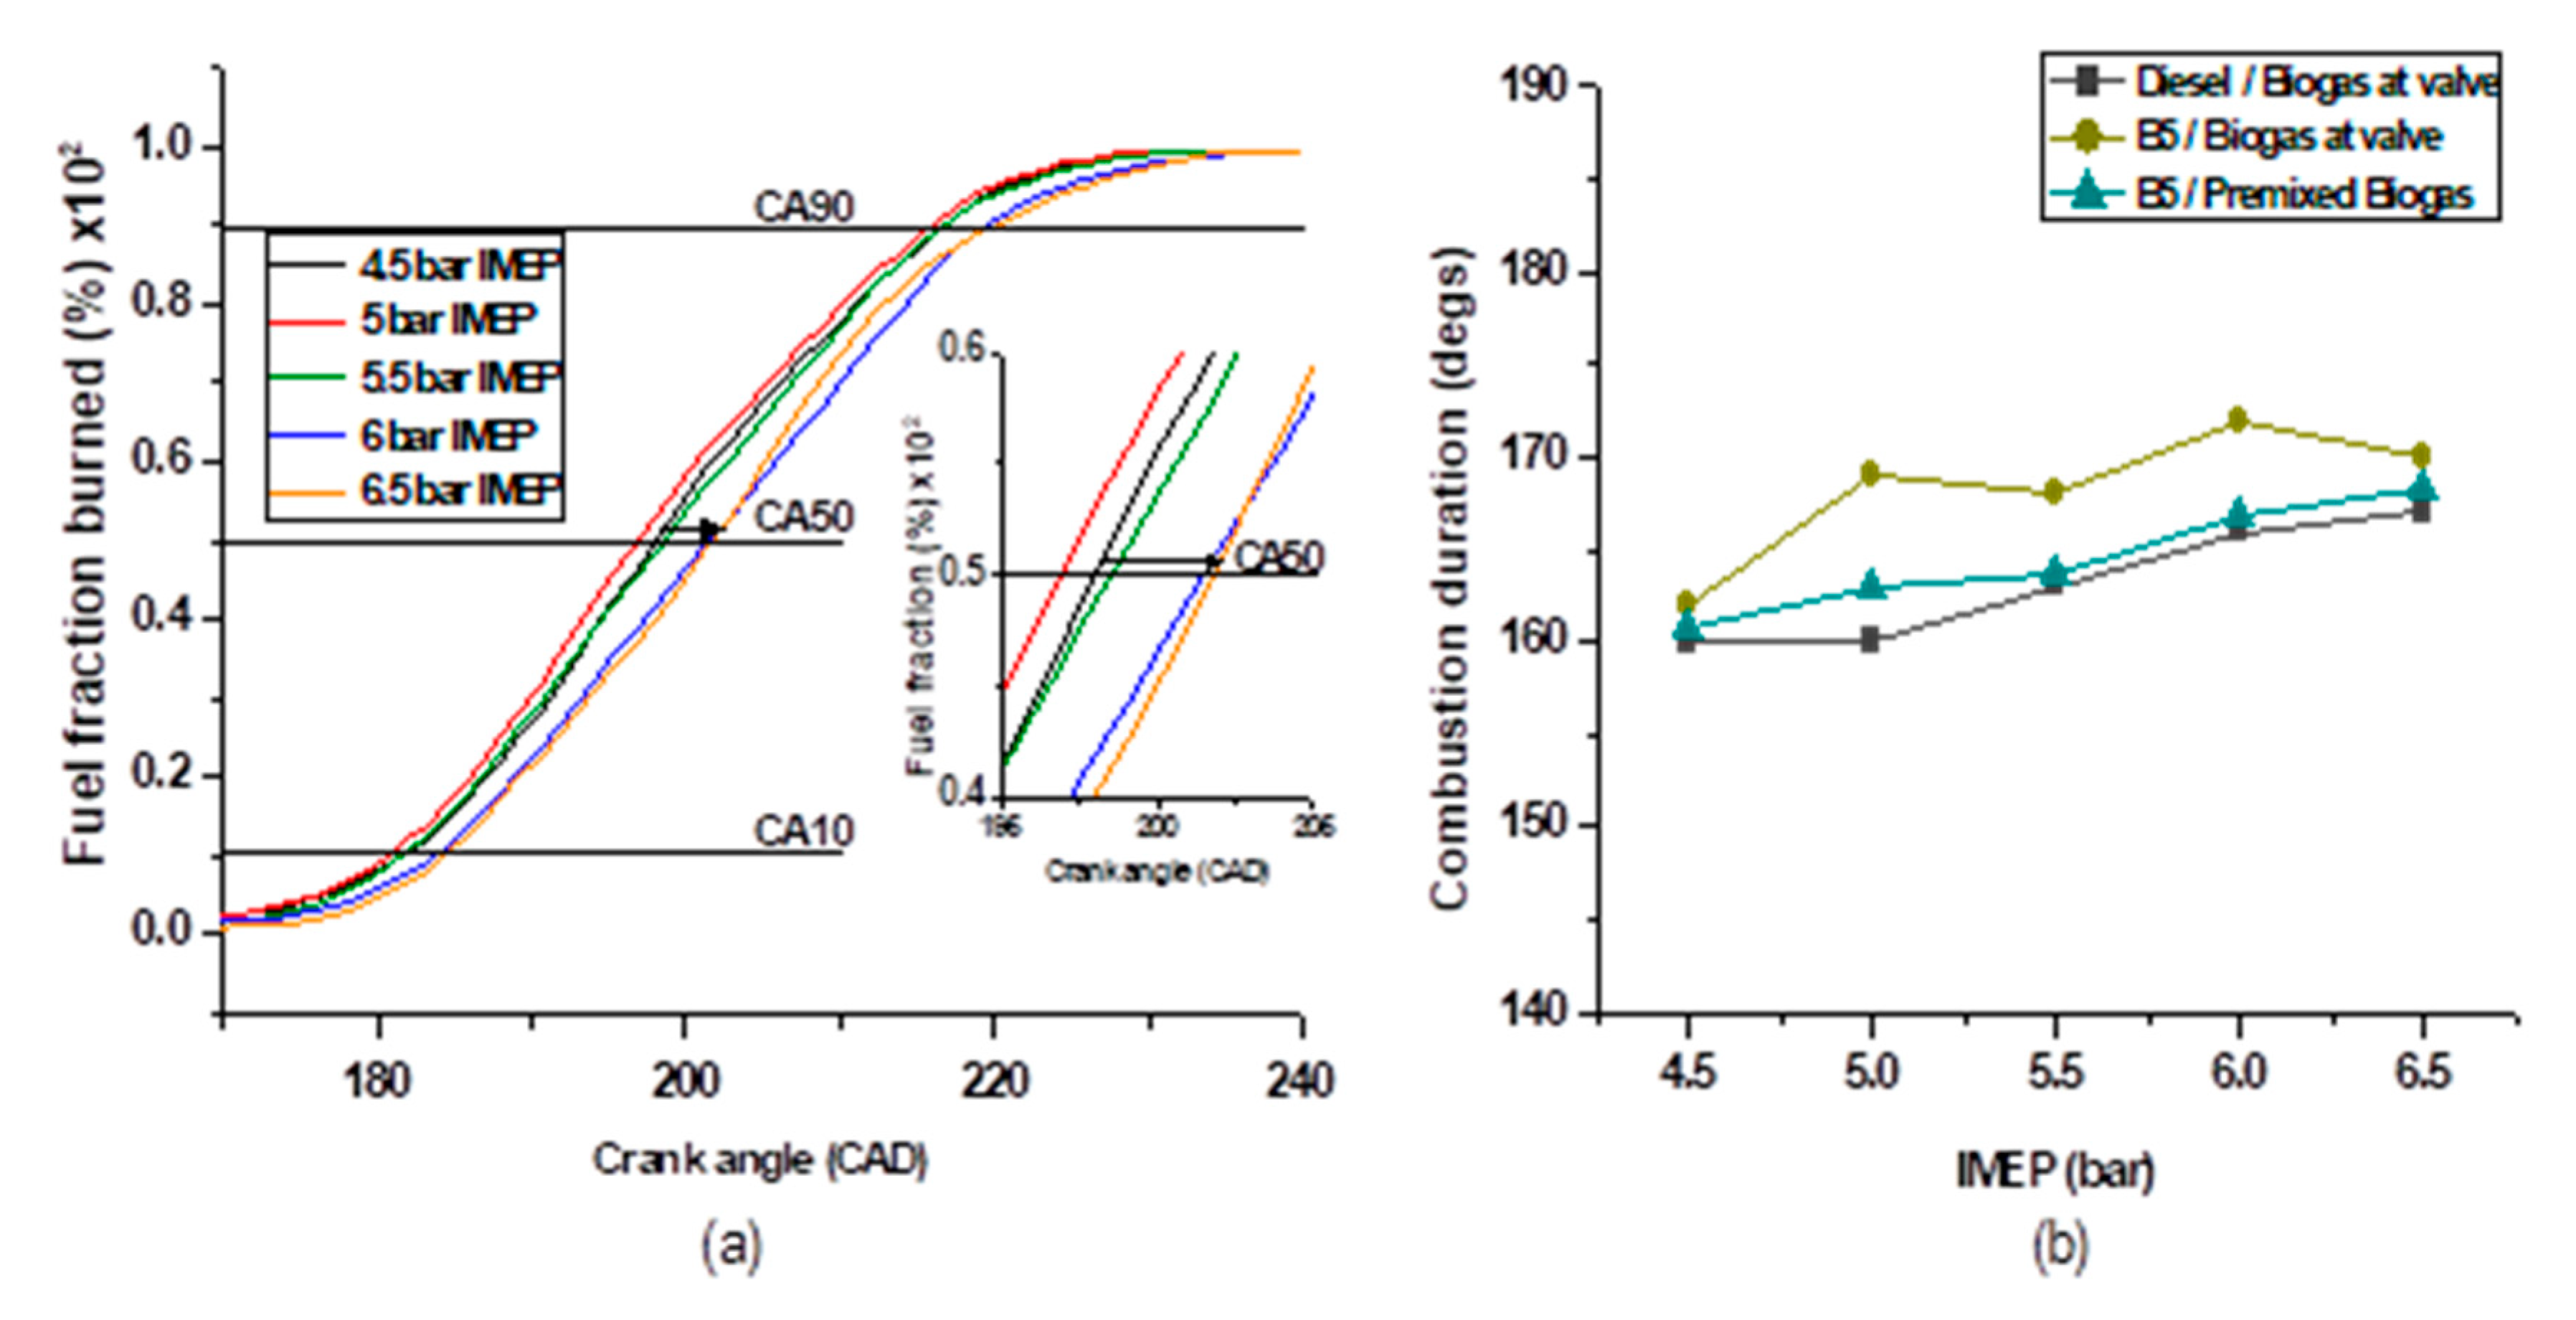
To have more understanding of the effects of these fuels, with the in-cylinder mixing of biogas as a result of injection at the valve, on the magnitude and direction of the combustion; combustion phase (CA50) was examined as the period when 50% of the fuel burned. The use of B5 and biogas injected at the valve demonstrated slow combustion as the engine load increased from 5 to full 6.5 bar IMEP, as shown in Figure 10a. Figure 10a indicated that the combustion was fastest at a charge of 5 bar IMEP, unlike the no-load 4.5 bar IMEP, though both capacities resulted in the same burning period of 34 degrees. It implies that the fastness of the combustion at a load of 5 bar IMEP might be due to the better atomization and mixture reactivity of the direct-injected fuel. The fastness of the burning at a 5 bar IMEP has also manifested in the trend of the fuel burned in Figure 11a, as magnified in the inset graph. Similarly, the use of B5 and biogas in a premixed mode also resulted in slow-burning as the engine capacity increased from no-load to full-load state, but the combustion was found more advanced across the loads compared to the biogas injection at the valve. This trend was found contrary to the outcome of diesel and biogas in a premixed mode, which advanced as the load increased from 5 to 5.5 bar IMEP, as shown in Figure 10b. The trend implies that the combustion of diesel and premixed biogas also retarded as the load increased from 5.5 to 6.5 bar IMEP but found more advanced compared to the result of B5 and biogas injected at the valve. The use of diesel as pilot fuel also displayed the fastness of the combustion at a charge of 5 bar IMEP similar to the attribute of B5 as discussed above. However, the variability of the combustion phase could be due to the variation in the burning period of the reactivity fuels or combustion duration; thus, longer combustion duration slows the combustion center [40]. According to Figure 10b, when the biogas was premixed, the trend of the combustion phase was relatively similar to that of the condition when it was injected at the valve, though tends to be more closely identical to the pattern of B5, which was found less retarded by 1 degree at the full 6.5 bar IMEP. In the reactivity with the conventional diesel fuel, Figure 10b further indicated that biogas injection at the valve was more influential to the retarded combustion phase at various engine loads. Analytically, burning of B5 and biogas injected at the slowed the combustion approximately by 1.4 degrees (0.486 ms) compared to the burning of conventional diesel and biogas in a premixed mode. In contrast, the use of B5 and premixed biogas advanced the combustion by 1.3 degrees (0.451 ms). It indicated that the use of B5 and biogas at the valve retarded the combustion by almost 3 degrees (0.938 ms) compared to premixed mode. The burning of diesel and biogas injected at the valve retarded approximately by 0.4 degrees roughly equivalent to 0.139 ms compared to the premixed way. Wang et al. [17] observed retarded combustion phase with the use of premixed biogas as LRF because of the atomization of the direct-injected fuel and in-cylinder mixture reactivity that delayed the combustion phase.
• Burning and ignition delay periods:
As shown in Figure 12a, the period taken to burn the B5 and biogas injected at the valve was found relatively the same from a load of 4.5–5 bar IMEP, then rose at 5.5 bar IMEP and remained constant up to full 6.5 bar IMEP. The figure shows a drop in burning duration across the engine loads for the combustion of B5 and premixed biogas, which could be an effect of premixing that might cause early burning of some fractions of the biogas. The use of B5 and premixed biogas indicated a rise in the burning period as the load increased to 5 bar IMEP, then gradually decreased. The burning duration was relatively higher during combustion of B5, compared to the conventional diesel, along with the biogas injected at the valve, more especially at the low to medium loads, which could likely be due to a higher flammability limit of the conventional diesel that might result to faster burning of the fuel. Besides, there was a drop in the cylinder temperature at low to medium loads; hence more of the less reactive mixture of B5 and biogas injected at the valve could be trapped and extended the burning duration likewise the combustion period as evident in Figure 11b. As analyzed from Figure 11b, the combustion period for the burning of B5 and biogas injected at the valve was extended approximately by 5 degrees compared to the burning of diesel in the same fueling approach, unlike the use of premixed biogas that extends the period by about 1 degree. Figure 11a shows more detailed dynamism of the burning duration at various loads. Compared to the usual premixed approach, as depicted in Figure 12b, a significant reduction in the burning duration was observed with the injection at the valve. The decrement could be a consequence of the less amount of biogas fuel burned along with the diesel during low-temperature combustion, which likely improves the burning of the diesel under in-cylinder mixing condition. Comparatively, Wang et al. [17] reported lesser burning duration, which could be due to the fuel quality that the biogas used in the said report constitute some combustible and highly flammable compound such as hydrogen gas, which might facilitate more burning. These outcomes imply that in-cylinder mixing, as a consequence of biogas injection at the valve, could be advantageous over the premixed injection method in reducing the burning duration. Analytically, the trends for the 5–6 bar IMEP in Figure 12a,b indicated a reverse rule applied, signifying that the influence of the biogas injection at the valve in reducing the burning duration was compromised in establishing a definite pattern instead the reduction in the burning period might be an influence of other factors such as variability in the amount of direct-injected fuel due to improper control of injection or proper atomization of the B5 occurred when biogas was premixed resulting in faster burning.
As seen in Figure 12c, the ignition delay period was virtually constant with the increase in the engine load, though higher at 5.5–6.5 bar IMEP compared to lower IMEP, during combustion of B5 and biogas injected at the valve. It could be because an advanced injection causes the directly injected fuel to diffuse towards the cylinder wall forming poor reactivity distribution, hence delayed the ignition [17]. Besides, early burning of biogas or more of the biogas in the cylinder might subject the mixture more difficult to combust. Figure 12c further shows that the combustion of B5 and premixed biogas delayed the ignition more significantly compared to the approach of biogas injection at the valve. This attribute signifies the effect of the early burning of the biogas due to premixing that resulted in shorter burning duration. In other words, the early combustion of premixed biogas, which is less reactive, causes more ignition delay. The variation of the ignition delay period was more significant at 5.5–6.5 bar IMEP during combustion of conventional diesel and biogas at the valve. The higher ignition delay indicated that more diffusion of the direct-injected fuel occurred at these loads and the least difference in the ignition delay among the test fuels could be an influence of fuel quality or direct injection pressure [43]. Figure 12d further revealed that the traditional premixed approach demonstrated the highest ignition delay period at all the load condition, though decreased as the load increased.

3.2. Effects of Injection at the Valve and Reactivity Fuels on Performance Attributes

The efficiency of the engine for B5 and biogas injected at the valve, as the reactivity fuels, increases with the increase in the engine load from 4.5 to 5.5 bar IMEP then steadily decreased as the load increase, which is depicted in Figure 12a. According to Figure 13a, the highest indicted thermal efficiency achieved was 36.33% at a mid 5.5 bar IMEP during the combustion of B5 and biogas injected at the valve, as a consequence of fewer heat losses through the cylinder wall at this particular load. This trend also deviates from the expected gradual decrease in the indicated thermal efficiency with the increase in the engine load, showing the highest ability at mid 5.5 bar IMEP. As earlier stated, 5.5 bar IMEP could likely remain an equilibrium capacity for the change in reactivity status that is the energy supplied by the reactivity fuels could be balanced, hence causing some abnormal behaviors. A similar trend manifested for the combustion of B5 and premixed biogas, though more efficient at 4.5 bar IMEP compared to that of B5 and biogas injected at the valve likely due to reduced heat loss under no-load condition. The trends also looked closely similar to that of the conventional diesel at all the load conditions, but the traditional diesel demonstrated a little bit higher efficiency at high IMEP while less at low IMEP in comparison with the B5 and biogas injected at the valve. The indicated efficiency was found higher for all the engine loads compared to that of B5 and premixed biogas combustion. Figure 13b also shows that the burning of the conventional diesel and biogas injected at the valve, demonstrated high indicated thermal efficiency, at all the load conditions though insignificant at certain levels, compared to the usual premixed injection. The difference could be a result of more heat generated and relatively less heat loss through the cylinder wall with the in-cylinder mixing of biogas [44], though contrary to the fact that retarded combustion phase resulted in lower indicated thermal efficiency as reported by Shi et al. [44].
The specific amount of fuel consumed decreased drastically as the engine load increase for all the pilot fuels used, under both premixed and in-cylinder mixed methods, as shown in Figure 14a. As observed from Figure 14a, the burning of B5 and premixed biogas indicated the highest brake specific fuel consumed for all the load capacities compared to the approach of injecting the biogas at the valve. More of the specific fuel consumption could be due to the poor quality of the biogas used and its mixing rate. Considering the economy of the pilot fuels used under port injection at the valve, Figure 14a displayed that B5 and regular diesel competing at various engine capacities. At no-load condition, B5 shows higher brake specific fuel consumed likely due to some power loses leading to more fuel consumed besides Figure 13a shows that the B5 was less efficient at no-load condition, hence could also lead to fuel consumption. As the competition progresses at the various engine capacities, a wide margin was exhibited at 6 bar IMEP showing that regular diesel has high BSFC. As the low-quality biogas get premixed, more of the biogas get trapped in the cylinder due to extended ignition delay. However, Figure 14b shows that the injection of biogas at the valve has little influence on the rise in fuel consumed; hence, the attribute is mostly because of the poor quality of the biogas.

3.3. Effects of Injection at the Valve and Reactivity Fuels on the Emission Attributes

Various emission parameters were investigated at a speed of 2000 rpm along with the different load capacities as discussed in the subsequent sub-sections. As observed, the emissions were relatively high irrespective of the patterns and biogas injection method used, more especially at high IMEP for the CO2 and NOx emissions, medium IMEP for the CO emission, and low IMEP for the UHC emission. These attributes lead to the assertion that the engine speed selected might be an influential factor; thus, various speed levels were also investigated, using B5 and biogas in a premixed injection method, to ascertain its influence as also discussed in the subsequent sub-section.

3.3.1. CO2 Emission

CO2 remained an important emission component in this study because the simulated biogas used composed of 25% CO2 by mole. As shown in Figure 15a, the CO2 emission increased as the engine load increased during combustion of B5 and biogas injected at the valve, because of the rise in the amount of the non-combustible CO2 concentration in the fuel burned at the high IMEP. When the biogas was premixed, the CO2 emission was insignificantly higher from 4.5 to 6 bar IMEP and showed otherwise at 6.5 bar IMEP. Although, the CO2 discharge increased with the increase in the engine load but found less at every load level compared to the outcome of the conventional diesel in reactivity with the premixed biogas. The burning of diesel and premixed biogas resulted in low in-cylinder temperature, which influenced a slow conversion process, hence high CO2 production in a thermochemical process involving gaseous fuel [45]. However, the CO2 emission for the combustion of diesel and biogas injected at the valve remained higher, at all the load conditions, compared to the usual premixed approach as depicted in Figure 15b. This trend signifies that the CO2 emission could be independent of the injection method, somewhat might be influenced by other factors such as high CO oxidation, high biogas quantity injected, and mixing rate, among others.
The effect of the engine speed was examined, for B5 and premixed biogas, to have a better understanding of the causes of some patterns of the CO2 emission. Figure 15c shows the variation of the CO2 radiation in response to the change in the engine speed. The CO2 emission was found less at a rate of 1600 rpm compared to a speed of 1800 rpm for all the load capacities. The difference in the CO2 radiation was more significant at a load of 5.5–6.5 bar IMEP. The difference could be an influence of the noncombustible CO2 concentration, which increased with the increase in the engine load or less in-cylinder temperature at 1600 rpm resulting in a reduced rate of CO oxidation to form more of the CO2 compound. However, the emission of the CO2 at a speed of 1800 rpm was relatively at par with the use of 2000 rpm, though, the emission at 1800 rpm was found to be insignificantly higher for light load condition. The trends signify that the in-cylinder temperature development at light load was strictly similar; thus, generating relatively similar CO2 emission.

3.3.2. CO Emission

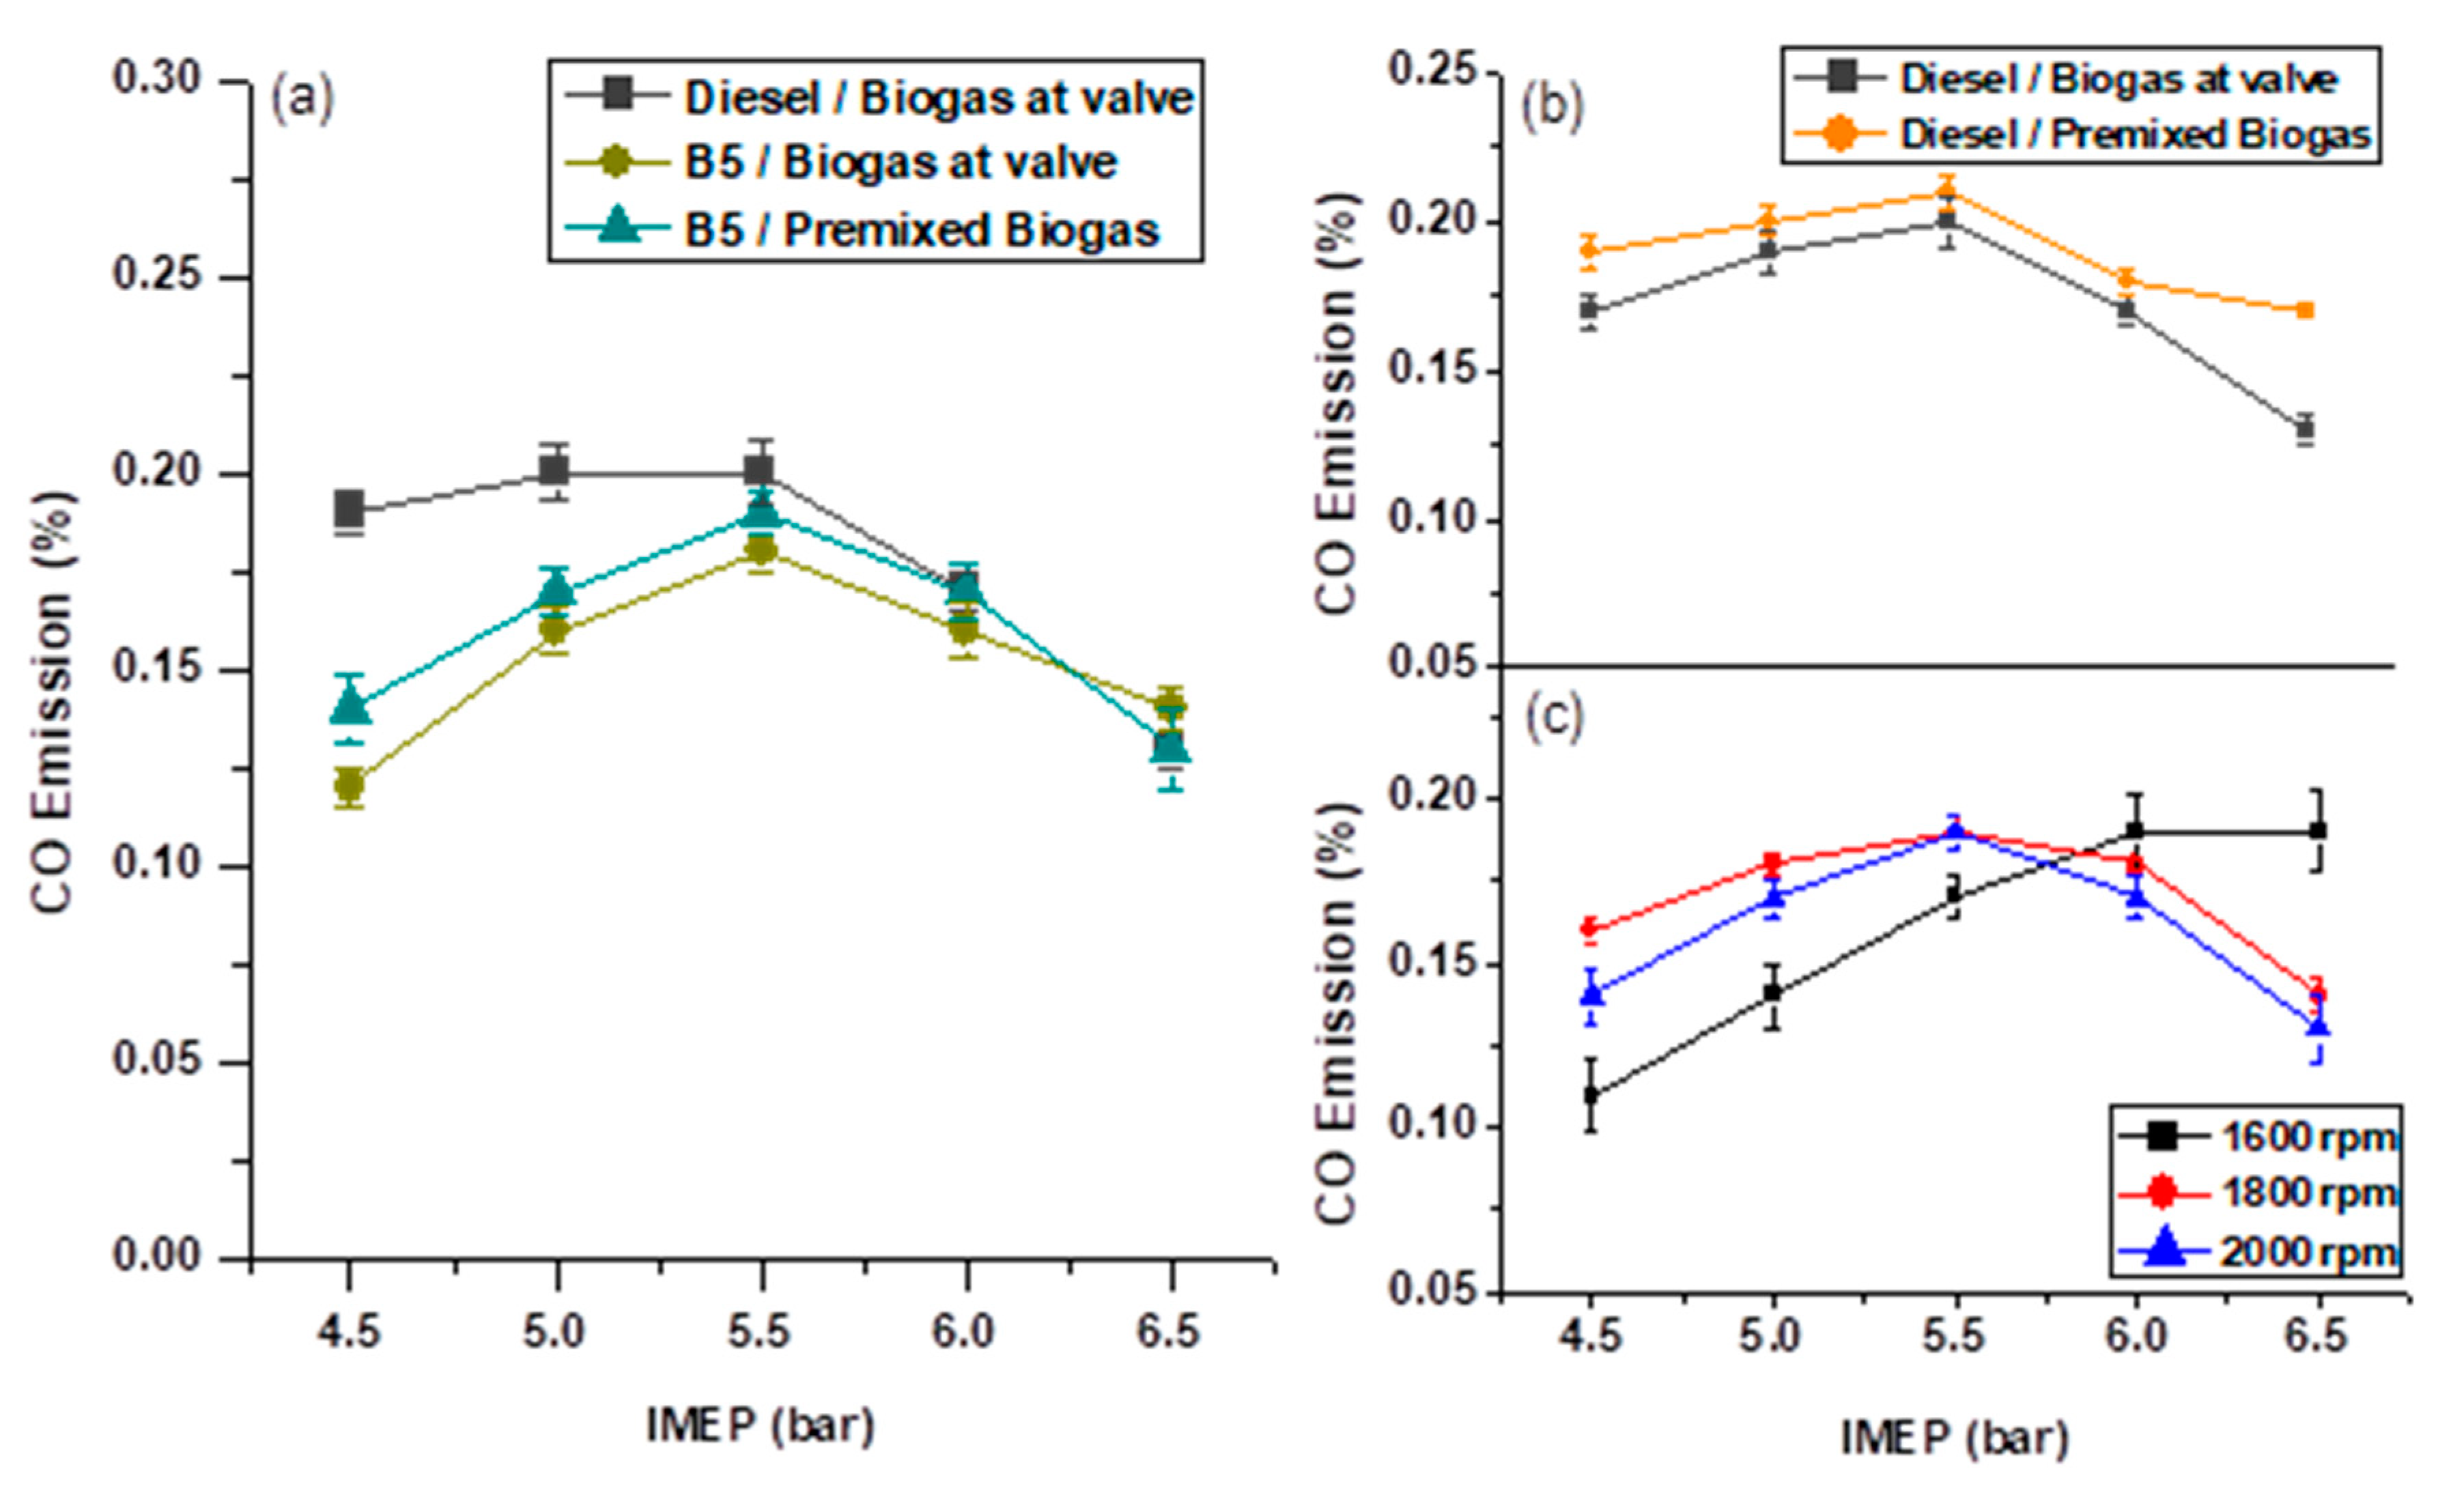
As also observed in Figure 16a, the CO emission increased from 4.5 to 5.5 bar IMEP, then decreased as the load increased during the combustion of the B5 in reactivity with the biogas injected at the valve. The burning of the B5, along with the biogas injected at the valve, demonstrated the highest capability in reducing the CO emission. When the biogas was premixed, the CO emission rises, especially at 4.5–5.5 bar IMEP and shows otherwise at full 6.5 bar IMEP. The reduction in the CO emission manifested more significantly at low to mid charges, compared to the combustion of conventional diesel and premixed biogas. The less CO emission could be due to the higher in-cylinder temperature developed when B5 was used, hence improved the rate of the CO oxidation, as shown in Figure 6c under Section 3.1.1. Generally, Figure 6c indicated the less in-cylinder temperature at a load of 5.5 bar IMEP, which could likely be the reason for a high CO emission with this particular load. The use of B5 and biogas injected at the valve reduced the CO emission averagely by 20.33%, at moderate IMEP, compared to the combustion of conventional diesel and premixed biogas. However, the trend of the CO emission was found comparable to that of the usual diesel RCCI combustion for both premixed and biogas injected at the valve. The in-cylinder mixing of biogas minimized the persistent challenge of CO emission compared to the traditional premixed way, as clearly shown in Figure 16b. The analysis of the reduction, relative to the biogas injection approaches, revealed that injection of the biogas at the valve was able to cut down the CO emission on average by 9.87%.
According to Figure 16c, the CO emission was found less at 1600 rpm and increased as the speed progressed to 1800 rpm then decreased as the engine speed reached 2000 rpm and maintained the pattern at 4.5–5.5 bar IMEP. The difference in the CO emission reduced as the load increased and remained virtually similar at medium load capacity for all the engine speeds. However, the CO emission tended to decrease with the increase in the engine speed from 5.5 to 6.5 bar IMEP. Besides, as observed from Figure 16c, the pattern of the CO emission at an engine speed of 1600 rpm differed from that of other speed levels; thus, generating the highest CO emission at 6–6.5 bar IMEP. More of the production of the CO happened at 6–6.5 bar IMEP because of the increase in the amount of biogas. However, these trends could be because, at this load range, most of the CO generated gets emitted at 1600 rpm while oxidized and gets emitted as CO2 when the engine speed increases to higher levels.

3.3.3. UHC Emission

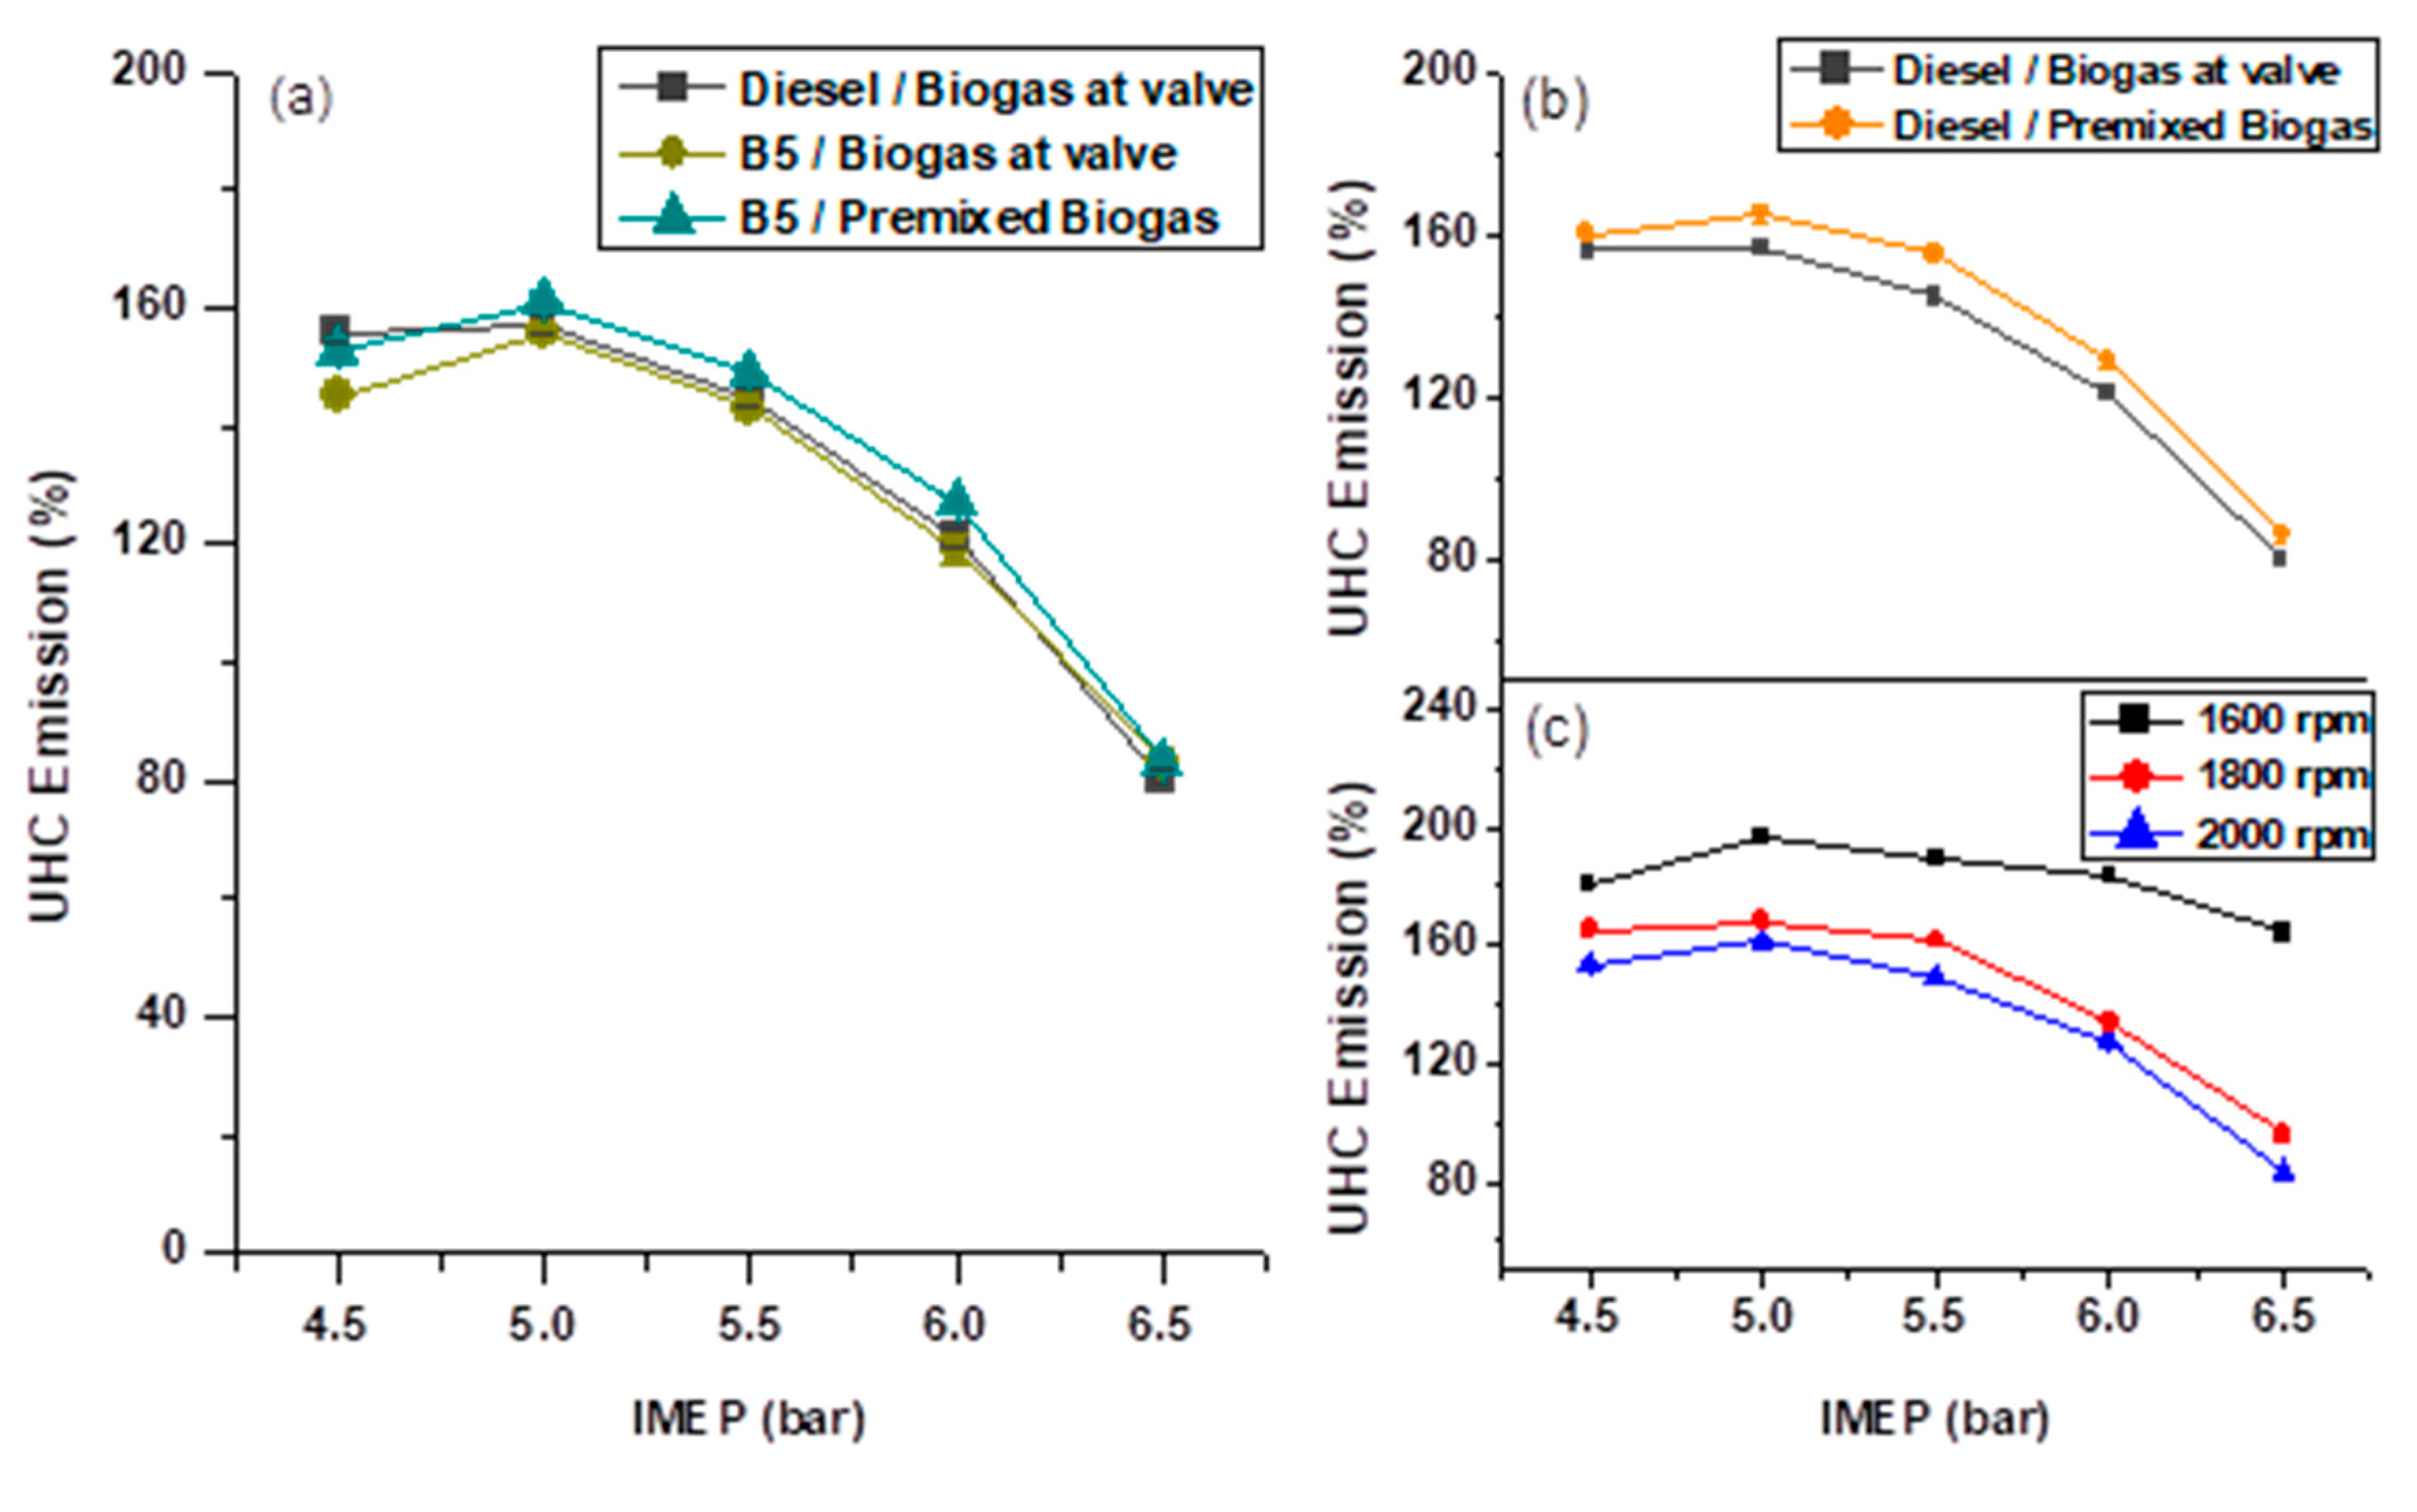
As depicted in Figure 17a, the UHC emission decreased significantly as the engine load increased during the combustion of B5 and biogas injected at the valve. The cause of the decrease in the UHC emission might likely be an influence of either rise in the in-cylinder temperature, which might increase the rate of the fuel burned or fewer amounts of the fuel entering the crevices [8,12,46]. When the biogas was premixed, the combustion emitted higher UHC at all the engine capacities except 4.5 bar IMEP, which could also be an influence of high in-cylinder temperature or the amount of fuel entering the crevices. To explain the cause of the rise in UHC emission under the premixed mode, Figure 6c indicated that the combustion of B5 and premixed biogas generated less in-cylinder temperature, compared to the outcome of the biogas injection at the valve. The attribute of having less in-cylinder temperature accompanied by high UHC emission indicated the effect of the amount of fuel entering the crevices due to air-fuel mixing. Therefore, an estimate of the emission reduction shows that the combustion of B5 and biogas injection at the valve was found more promising in terms of reduced UHC emission, by about 5%, due to a rise in the cylinder temperature while the reduction in the amount of fuel entering the crevices lowered the emission by about 8%. However, the trend of the UHC emission was found identical to that of the conventional diesel RCCI combustion for both premixed and biogas injection at the valve. In contrast, Figure 17b revealed that the use of traditional diesel and biogas injected at the valve superseded in reducing the UHC across the engine loads, unlike the usual premixed RCCI combustion that showed the highest UHC emission at merely all the load conditions. The advantage could be due to the less homogeneity of the mixture in the cylinder, as a consequence of in-cylinder mixing, which enabled the air to occupy the crevice regions, hence resulting in less UHC emission [8].
Figure 17c shows that the UHC emission decreased gradually with the increase in the engine speed for the various engine capacity likely because of the rise in the cylinder temperature resulting in reduced UHC emission as the load increased while given more of the discharge at low engine speed due to more mixture entering the crevices. Figure 17c also indicated that the difference in the UHC emission was more significant as the engine speed increased to 1800 rpm compared to the difference when proceeded to 2000 rpm. This trend could be because the change in the thermodynamic state of the in-cylinder charge tended to decrease as the engine speed increased and would likely remain constant with the further increase in the speed.

3.3.4. NOx Emission

NOx emission was found less at the 4.5–5.5 bar IMEP but increased drastically as the engine load proceeded to 6.5 bar IMEP during the combustion of B5 and biogas injected at the valve, as depicted in Figure 18a. The increase in the NOx emission could be an attribute of the significant rise in the cylinder temperature that reaches the nitrogen-oxygen bond formation temperature and virtually the period of such temperature increase [22]. A similar trend manifested for B5 and biogas in a premixed mode, and the exhibited highest NOx emission was observed at 4.5–5.5 bar IMEP while lowest emission displayed as the load extended to full 6.5 bar IMEP. Besides, the trend of the NOx emission was identical to that of the conventional diesel RCCI combustion for both premixed and biogas injected at the valve, as shown in Figure 18b. The figure further shows that biogas injection at the valve rises the NOx emission at 6–6.5 bar IMEP, which could be an influence of the rise in the cylinder temperature. Figure 18c indicated that the NOx emission increased with the increase in the engine speed at various capacities, as an attribute of the increased cylinder temperature. The NOx emission maintained a closed range at the load of 4.5–5.5 bar IMEP for all the engine speed levels. As shown in Figure 18c, the NOx emission increased with the increase in the engine speed at merely all the load conditions. However, the margin between 1600 rpm and the rest of the speed levels increased with the rise in the engine capacity due to an increase in the cylinder temperature, causing an increased rate of the nitrogen–oxygen bond formation when operated at higher speeds.

4. Discussion

The combustion of B5 and biogas is disadvantageous to the rise in the cylinder pressure due to the poor quality of the biogas used. Besides, the burning of the fuels was found beneficial to the rate of heat released at low to medium engine loads due to higher in-cylinder temperature compared to the use of diesel under injection at the valve approach. The reactivity of the fuel was also found highly beneficial in reducing PPRR. The use of B5 and biogas injected at the valve demonstrated slow combustion as the engine load increased, but the combustion was more advanced with the use of premixed biogas while the trend was found similar to the outcome of diesel and biogas, which was also more beneficial to advanced combustion phase. Besides, the burning of B5 and biogas injected at the valve gave the highest indicated thermal efficiency of 36.33% at a load of 5.5 bar IMEP. In general, the results showed that the in-cylinder mixing, as a consequence of biogas injection at the valve, significantly influenced slow combustion with the rise in the indicated thermal efficiency. The reactivity of B5 and low-quality biogas did not considerably benefit the combustion phase but indicated thermal efficiency. The use of low-quality biogas also significantly affected the in-cylinder pressure development resulting in very poor combustion.
The CO2 emission increased as the engine load increased during combustion of B5 and biogas injected at the valve. However, the burning of these fuels demonstrated the capability in reducing the CO emission, though increased from 4.5 to 5.5 bar IMEP, then decreased as the load increased. The UHC emission also significantly reduced as the load increases while NOx emission was found less at 4.5–5.5 bar IMEP but increased drastically as the engine load proceeds to full 6.5 bar IMEP. The trends of the emissions were found comparable to that of the conventional diesel RCCI combustion for both premixed and biogas injected at the valve. Besides, the patterns of the emissions in response to the change in the engine speed, for B5 and biogas injected at the valve, signify that the high engine speed, 2000 rpm, selected might also contribute to high emissions of both premixed and biogas injection at the valve; thus, demanding for more investigation of the workability of the approach of injection at the valve for low engine speed. Inferentially, the outcome of the emissions revealed that using B5 and biogas with high CO2 concentration, in RCCI mode, was disadvantageous in elevating CO2 emission. The use of B5 and biogas injected at the valve was quite beneficial in rising the in-cylinder temperature and reducing the stream of fuels entering the crevices that aid in cutting down the CO and UHC emissions but rose the NOx emission. The fuel reactivity reduced the CO and UHC emissions, averagely, by 20.33% and 10% respectively.
The approach facilitated a reduction in the persistent challenge of the CO and UHC emissions, compared to the premixed method. However, the research recommended that the fuel delivery hose should be constructed as an integral part of the air intake manifold and its outlet to be part of the valve seat for proper control of the gaseous fuel delivery with the aid of valve closing. The concept should be investigated numerically for better evaluation and understanding.

5. Conclusions

An experimental investigation on the influence of premixed port injection and biogas injection at the intake valve was carried out in RCCI mode. B5 and regular diesel were, directly, injected as test fuels along with the biogas in a premixed and port-injected at the valve, as a modified gaseous fuel delivery approach. The influence of B5 and biogas fuels’ reactivity on the CO and UHC emissions reduction along with an improvement in other essential parameters was investigated. The results showed that the combustion of B5 and biogas injected at the intake valve was disadvantageous to the rise in the cylinder pressure due to the poor quality of the biogas used. The use of low-quality biogas significantly affected the in-cylinder pressure development resulting in very poor combustion. Besides, the burning of the fuels was found beneficial to the rate of heat released at low to medium engine loads due to higher in-cylinder temperature developed. The result also shows retarded the combustion phase as the engine capacity increased with the highest indicated thermal efficiency of 36.33% at a load of 5.5 bar IMEP. The CO2 and NOx emissions increased, but the UHC emission decreased, significantly, as the capacity increased while the CO emission increased at a load of 4.5–5.5 bar IMEP, then reduced as the load increased. The use of these fuels together with the in-cylinder mixing, due to injection at the valve, was capable of averagely reducing the persistent challenge of the CO and UHC emissions, by about 20.33% and 10% respectively, compared to the premixed mode. The trends of the emissions were found comparable to that of the traditional diesel RCCI combustion for both approaches. Furthermore, the patterns of the emissions in response to the change in the engine speed signify that the high engine speed selected might also contribute to high emissions for both premixed and in-cylinder mixing approaches.

Author Contributions

I.B.D.; Conceptualization, methodology, investigation and writing, M.A.S.; Funding acquisition, supervision, review and editing, Z.A.A.K.; Resources, supervision, review and editing, S.E.M.; Project administration and review. All authors have read and agreed to the published version of the manuscript.

Funding

This work was supported by Malaysia’s Petroleum Research Fund (PRF) Grant (Cost Centre: 0153AB-A34).

Acknowledgments

The authors would like to acknowledge the support given by the Universiti Teknologi Petronas (UTP) and Centre for Automotive Research and Electric Mobility (CAREM) in conducting this research.

Conflicts of Interest

The authors declare no conflict of interest. And The funders had no role in the design of the study; in the collection, analyses, or interpretation of data; in the writing of the manuscript, or in the decision to publish the results.

References

  1. Wang, Y.; Zhu, Z.; Yao, M.; Li, T.; Zhang, W.; Zheng, Z. An investigation into the RCCI engine operation under low load and its achievable operational range at different engine speeds. Energy Convers. Manag. 2016, 124, 399–413. [Google Scholar] [CrossRef]
  2. Salahi, M.M.; Esfahanian, V.; Gharehghani, A.; Mirsalim, M. Investigating the reactivity controlled compression ignition (RCCI) combustion strategy in a natural gas/diesel fueled engine with a pre-chamber. Energy Convers. Manag. 2017, 132, 40–53. [Google Scholar] [CrossRef]
  3. Reitz, R.D.; Duraisamy, G. Review of high efficiency and clean reactivity controlled compression ignition (RCCI) combustion in internal combustion engines. Prog. Energy Combust. Sci. 2015, 46, 12–71. [Google Scholar] [CrossRef] [Green Version]
  4. Li, J.; Yang, W.; Zhou, D. Review on the management of RCCI engines. Renew. Sustain. Energy Rev. 2017, 69, 65–79. [Google Scholar] [CrossRef]
  5. Benajes, J.; Molina, S.; García, A.; Belarte, E.; Vanvolsem, M. An investigation on RCCI combustion in a heavy-duty diesel engine using in-cylinder blending of diesel and gasoline fuels. Appl. Therm. Eng. 2014, 63, 66–76. [Google Scholar] [CrossRef]
  6. Dalha, I.B.; Said, M.A.; Karim, Z.A.A.; Firmansyah, F. Strategies and methods of RCCI combustion: A review. AIP Conf. Proc. 2018, 2035, 030006. [Google Scholar] [CrossRef]
  7. Firmansyah, F.; Aziz, A.A.R.; Heikal, M.; Zainal, A.E. Diesel/CNG Mixture Autoignition Control Using Fuel Composition and Injection Gap. Energies 2017, 10, 1639. [Google Scholar] [CrossRef] [Green Version]
  8. Lim, J.H.; Reitz, R.D. High Load (21 Bar IMEP) Dual Fuel RCCI Combustion Using Dual Direct Injection. J. Eng. Gas Turbines Power 2014, 136, 101514. [Google Scholar] [CrossRef]
  9. Luong, M.B.; Sankaran, R.; Yu, G.H.; Chung, S.H.; Yoo, C.S. On the effect of injection timing on the ignition of lean PRF/air/EGR mixtures under direct dual fuel stratification conditions. Combust Flame 2017, 183, 309–321. [Google Scholar] [CrossRef]
  10. Kavuri, C.; Paz, J.; Kokjohn, S.L. A comparison of Reactivity Controlled Compression Ignition (RCCI) and Gasoline Compression Ignition (GCI) strategies at high load, low-speed conditions. Energy Convers. Manag. 2016, 127, 324–341. [Google Scholar] [CrossRef]
  11. Lim, J.H.; Reitz, R. Improving high-efficiency reactivity controlled compression ignition combustion with diesel and gasoline direct injection. Proc. Inst. Mech. Eng. Part. D J. Automob Eng. 2013, 227, 17–30. [Google Scholar] [CrossRef]
  12. Wissink, M.; Reitz, R.D. Direct dual fuel stratification, a path to combine the benefits of RCCI and PPC. SAE Int. J. Engines 2015, 8, 878–889. [Google Scholar] [CrossRef]
  13. Mikulski, M.; Bekdemir, C. Understanding the role of low reactivity fuel stratification in a dual fuel RCCI engine—A simulation study. Appl. Energy 2017, 191, 689–708. [Google Scholar] [CrossRef]
  14. Agarwal, A.K.; Shukl, P.C.; Patel, C.; Gupta, J.G.; Sharma, N.; Prasad, R.K.; Agarwal, R.A. Unregulated emissions and health risk potential from biodiesel (KB5, KB20) and methanol blend (M5) fuelled transportation diesel engines. Renew. Energy 2016, 98, 283–291. [Google Scholar] [CrossRef]
  15. Xu, Z.; Jia, M.; Li, Y.; Chang, Y.; Xu, G.; Xu, L.; Lu, X. Computational optimisation of fuel supply, syngas composition, and intake conditions for a syngas/diesel RCCI engine. Fuel 2018, 234, 120–134. [Google Scholar] [CrossRef]
  16. Qian, Y.; Zhang, Y.; Wang, X.; Lu, X. Particulate matter emission characteristics of a reactivity controlled compression ignition engine fueled with biogas/diesel dual fuel. J. Aerosol Sci. 2017, 113, 166–177. [Google Scholar] [CrossRef]
  17. Wang, X.; Qian, Y.; Zhou, Q.; Lu, X. Modulated diesel fuel injection strategy for efficient-clean utilisation of low-grade biogas. Appl. Therm. Eng. 2016, 107, 844–852. [Google Scholar] [CrossRef]
  18. Gashaw, A.; Getachew, T.; Teshita, A. A Review on Biodiesel Production as Alternative Fuel. J. For. Prod. Ind. 2015, 4, 80–85. [Google Scholar]
  19. Kumar, A.; Shukla, S.K.; Tierkey, J.V. A Review of Research and Policy on Using Different Biodiesel oils as Fuel for CI Engine. Energy Procedia 2016, 90, 292–304. [Google Scholar] [CrossRef]
  20. Saxena, P.; Jawale, S.; Joshipura, M.H. A review on prediction of properties of biodiesel and blends of biodiesel. Procedia Eng. 2013, 51, 395–402. [Google Scholar] [CrossRef] [Green Version]
  21. Benajes, J.; Molina, S.; García, A.; Monsalve-Serrano, J. Effects of direct injection timing and blending ratio on RCCI combustion with different low reactivity fuels. Energy Convers. Manag. 2015, 99, 193–209. [Google Scholar] [CrossRef]
  22. Isik, Z.M.; Hüseyin, A. Analysis of ethanol RCCI application with safflower biodiesel blends in a high load diesel power generator. Fuel 2016, 184, 248–260. [Google Scholar] [CrossRef]
  23. Li, J.; Yang, W.M.; Zhou, D.Z. Modeling study on the effect of piston bowl geometries in a gasoline/biodiesel fueled RCCI engine at high speed. Energy Convers. Manag. 2016, 112, 359–368. [Google Scholar] [CrossRef]
  24. Wang, Y.; Yao, M.; Li, T.; Zhang, W.; Zheng, Z. A parametric study for enabling reactivity controlled compression ignition (RCCI) operation in diesel engines at various engine loads. Appl. Energy 2016, 175, 389–402. [Google Scholar] [CrossRef]
  25. Bora, B.J.; Saha, U.K. Optimisation of injection timing and a compression ratio of raw biogas powered dual fuel diesel engine. Appl. Therm. Eng. 2016, 92, 111–121. [Google Scholar] [CrossRef]
  26. Aklouche, F.Z.; Loubar, K.; Bentebbiche, A.; Awad, S.; Tazerout, M. Experimental investigation of the equivalence ratio influence on combustion, performance and exhaust emissions of a dual fuel diesel engine operating on synthetic biogas fuel. Energy Convers. Manag. 2017, 152, 291–299. [Google Scholar] [CrossRef] [Green Version]
  27. Bora, B.J.; Saha, U.K. Experimental evaluation of a rice bran biodiesel/biogas run dual fuel diesel engine at varying compression ratios. Renew. Energy 2016, 87, 782–790. [Google Scholar] [CrossRef]
  28. Shan, X.; Qian, Y.; Zhu, L.; Lu, X. Effects of EGR rate and hydrogen/carbon monoxide ratio on combustion and emission characteristics of biogas/diesel dual-fuel combustion engine. Fuel 2016, 181, 1050–1057. [Google Scholar] [CrossRef]
  29. Barik, D.; Murugan, S. Experimental investigation on the behavior of a DI diesel engine fueled with raw biogas/diesel dual fuel at different injection timing. J. Energy Inst. 2016, 89, 373–388. [Google Scholar] [CrossRef]
  30. Gund, M.D.; Tamboli, S.A.; Mohite, V.R. Performance Evaluation of Single Cylinder Diesel Engine in Dual Fuel Mode with Biogas as Primary Fuel and Diesel and Biodiesel as Pilot Fuel. Int. Res. J. Eng. Technol. 2017, 04, 1656–1660. [Google Scholar]
  31. Ohimain, E.I.; Izah, S.C. A review of biogas production from palm oil mill effluents using different configurations of bioreactors. Renew. Sustain. Energy Rev. 2017, 70, 242–253. [Google Scholar] [CrossRef] [Green Version]
  32. Bora, B.J.; Saha, U.K.; Chatterjee, S.; Veer, V. Effect of compression ratio on performance, combustion and emission characteristics of a dual fuel diesel engine run on raw biogas. Energy Convers. Manag. 2014, 87, 1000–1009. [Google Scholar] [CrossRef]
  33. Kadam, R.; Panwar, N.L. Recent advancement in biogas enrichment and its applications. Renew. Sustain. Energy Rev. 2017, 73, 892–903. [Google Scholar] [CrossRef]
  34. Senghor, A.; Dioh, R.M.N.; Müller, C.; Youm, I. Cereal crops for biogas production: A review of possible impact of elevated. Renew. Sustain. Energy Rev. 2017, 71, 548–554. [Google Scholar] [CrossRef]
  35. Jankowska, E.; Sahu, A.K.; Oleskowicz-popiel, P. Biogas from microalgae: Review on microalgae’s cultivation, harvesting and pretreatment for anaerobic digestion. Renew. Sustain. Energy Rev. 2017, 75, 692–709. [Google Scholar] [CrossRef]
  36. Ullah, I.; Othman, M.H.D.; Hashim, H.; Matsuura, T.; Ismail, A.F.; Rezaei-DashtArzhandi, M.; Azelee, I.W. Biogas as a renewable energy fuel—A review of biogas upgrading, utilisation and storage. Energy Convers. Manag. 2017, 150, 277–294. [Google Scholar] [CrossRef]
  37. Hagos, K.; Zong, J.; Li, D.; Liu, C.; Lu, X. Anaerobic co-digestion process for biogas production: Progress, challenges and perspectives. Renew. Sustain. Energy Rev. 2017, 76, 1485–1496. [Google Scholar] [CrossRef]
  38. Neshat, S.A.; Mohammadi, M.; Najafpour, G.D.; Lahijani, P. Anaerobic co-digestion of animal manures and lignocellulosic residues as a potent approach for sustainable biogas production. Renew. Sustain. Energy Rev. 2017, 79, 308–322. [Google Scholar] [CrossRef]
  39. Kakaee, A.; Rahnama, P.; Paykani, A. Influence of fuel composition on combustion and emissions characteristics of natural gas/diesel RCCI engine. J. Nat. Gas Sci. Eng. 2015, 25, 58–65. [Google Scholar] [CrossRef]
  40. Zamboni, G. Influence of fuel injection, turbocharging and EGR systems control on combustion parameters in an automotive diesel engine. Appl. Sci. 2019, 9, 484. [Google Scholar] [CrossRef] [Green Version]
  41. Dalha, I.B.; Said, M.A.; Abdul Karim, Z.A.; Abdul, A.R.A.; Firmansyah; Abidin, E.Z.Z.; Ismael, M.A. Reactivity controlled compression ignition: An advanced combustion mode for improved energy efficiency. In Energy Efficiency in Mobility Systems; Springer: Singapore, 2019; pp. 101–126. [Google Scholar] [CrossRef]
  42. Du, J.; Chen, X.; Liu, L.; Liu, D.; Ma, X. Mechanism of combustion noise influenced by pilot injection in PPCI diesel engines. Appl. Sci. 2019, 9, 875. [Google Scholar] [CrossRef] [Green Version]
  43. Shameer, P.M.; Ramesh, K. Assessment on the consequences of injection timing and injection pressure on combustion characteristics of sustainable biodiesel fuelled engine. Renew. Sustain. Energy Rev. 2018, 81, 45–61. [Google Scholar] [CrossRef]
  44. Shi, J.; Wang, T.; Zhao, Z.; Wu, Z.; Zhang, Z. Cycle-to-cycle variation of a diesel engine fueled with Fischer-Tropsch fuel synthesized from coal. Appl. Sci. 2019, 9, 32. [Google Scholar] [CrossRef] [Green Version]
  45. Bocci, E.; Sisinni, M.; Moneti, M.; Vecchione, L.; Di Carlo, A.; Villarini, M. State of art of small scale biomass gasification power systems: A review of the different typologies. Energy Procedia 2014, 45, 247–256. [Google Scholar] [CrossRef] [Green Version]
  46. Imtenan, S.; Varman, M.; Masjuki, H.H.; Kalam, M.A.; Sajjad, H.; Arbab, M.I.; Fattah, I.M.R. Impact of low temperature combustion attaining strategies on diesel engine emissions for diesel and biodiesels: A review. Energy Convers. Manag. 2014, 80, 329–356. [Google Scholar] [CrossRef]
Figure 1. Comparative methods of low reactivity fuel (LRF) delivery in the reactivity controlled compression ignition (RCCI) engine: (a) conventional premixed port injection, (b) dual direct injection, and (c) proposed injection at the valve.
Applsci 10 00452 g001
Figure 2. An illustration of the engine test rig.
Applsci 10 00452 g002
Figure 3. (a) An estimated percentage of initial direct-injected fuel reduced and (b) analytical mass of fuel injected at various load capacities and a speed of 2000 rpm.
Applsci 10 00452 g003
Figure 4. In-cylinder pressure traces for (a) combustion of B5/biogas injected at valve for various loads, (b) B5/biogas RCCI in premixed and injection at valve for 6.5 bar IMEP, and (c) diesel/biogas in a premixed and port injection at valve 6.5 bar IMEP.
Applsci 10 00452 g004
Figure 5. In-cylinder temperature for the combustion of B5/biogas injected at valve for various loads.
Applsci 10 00452 g005
Figure 6. Variation of (a) maximum in-cylinder pressure (PMax.) for B5/biogas RCCI combustion, (b) maximum in-cylinder pressure for biogas injection approaches in RCCI, (c) maximum in-cylinder temperature (TMax.) for B5/biogas RCCI combustion, and (d) maximum in-cylinder temperature for biogas injection approaches in RCCI.
Applsci 10 00452 g006
Figure 7. The heat release rate for the (a) combustion of B5/biogas injected at a valve for various load capacities, (b) B5/biogas RCCI in premixed and injection at a valve for 6.5 bar IMEP, and (c) diesel/biogas in a premixed and port injection at the valve for 6.5 bar IMEP.
Applsci 10 00452 g007
Figure 8. Variation of total heat release rate (HRR) for (a) B5/biogas RCCI in a premixed and injection at the valve and (b) diesel/biogas in a premixed and port injection at the valve.
Applsci 10 00452 g008
Figure 9. Variation of peak pressure rise rate for (a) B5/biogas RCCI in a premixed and injection at the valve and (b) diesel/biogas in a premixed and port injection at the valve.
Applsci 10 00452 g009
Figure 10. Variation of the combustion phase (CA50) for (a) B5/biogas RCCI in premixed and injection at the valve and (b) diesel/biogas in a premixed and port injection at the valve.
Applsci 10 00452 g010
Figure 11. Variation of the (a) fraction burned for the B5 and biogas injected at the valve in RCCI and (b) combustion period of the B5 and biogas RCCI for premixed and injection at the valve in various load capacities.
Applsci 10 00452 g011
Figure 12. Variation of (a) burning duration for B5/biogas RCCI combustion, (b) burning duration for biogas injection approaches in RCCI, (c) ignition delay period for B5/biogas RCCI combustion, and (d) ignition delay for biogas injection approaches in RCCI.
Applsci 10 00452 g012
Figure 13. Variation of indicated thermal efficiency (ITE) for (a) B5/biogas RCCI in premixed and injection at the valve and (b) diesel/biogas in a premixed and port injection at the valve.
Applsci 10 00452 g013
Figure 14. Variation of brake specific fuel consumption (BSFC) for (a) B5/biogas RCCI in premixed and port injection at the valve and (b) diesel/biogas in a premixed and port injection at the valve.
Applsci 10 00452 g014
Figure 15. Engine-out CO2 emission for (a) B5/biogas RCCI for premixed and port injection at the valve, (b) diesel/biogas in a premixed and port injection at the valve, and (c) B5 and premixed biogas RCCI combustion at various engine speeds.
Applsci 10 00452 g015
Figure 16. Engine-out CO emission for (a) B5/biogas RCCI for premixed and port injection at the valve, (b) diesel/biogas in a premixed and port injection at the valve, and (c) B5 and premixed biogas RCCI combustion at various engine speed.
Applsci 10 00452 g016
Figure 17. Engine-out UHC emission for (a) B5/biogas RCCI for premixed and port injection at the valve, (b) diesel/biogas in a premixed and port injection at the valve, and (c) B5 and premixed biogas RCCI combustion at various engine speeds.
Applsci 10 00452 g017
Figure 18. Engine-out NOx emission for (a) B5/biogas RCCI for premixed and port injection at the valve, (b) diesel/biogas in a premixed and port injection at the valve, and (c) B5 and premixed biogas RCCI combustion at various engine speed.
Applsci 10 00452 g018
Table 1. The technical specification of the test equipment (engine).
DescriptionSpecifications
ModelL100V
TypeSingle cylinder, 4-stroke, air-cooled engine
Bore 86 mm
Stroke75 mm
Displacement435 cm3
Compression ratio20.0 ± 0.3
Fuel injection timing21° CA BTDC
Continuous Rate OutputEngine speed3600 rpm
Output6.2 kW
Maximum Rated OutputEngine speed3600 rpm
Output6.8 kW
Table 2. Preliminarily estimated test parameters, on average, at various load capacities.
Engine LoadDiesel at 2000 rpmB5 at
2000 rpm
HRF
Mass
LRF Mass
(%)IMEP (bar)SDBrake (%)Throttle (%)Brake (%)Throttle (%)(g)SD(g)
04.495± 0.083225323530.0181±0.00660.0181
254.998± 0.092355536550.0256±0.00580.0256
505.520± 0.043545756570.0347±0.00510.0347
756.013± 0.076725974600.0408±0.00730.0408
1006.553± 0.068906191620.0499±0.00210.0499
Table 3. Characteristics of the fuels used for the test.
PropertiesBiogasDieselB5-Diesel
Proportion by mole75% CH4, 25% CO2C10–24
Density (kg/m3)1.353820–832 823.45
Lower flammability limit (mol%)6.1–22.40.6–7.50.75–4.6
Molecular weight (g/mol)23.5132168174
Specific gravity at 0 °C1.050.850.852
Specific volume (m3/kg)0.7391.18–1.22
Kinematic viscosity (cSt)12.741.5–5.81.5–5.8
Lower heating value (MJ/m3)26.2436.0
Cetane number 59.862–63
Stoichiometric air-fuel ratio4.56:115.05:114.97:1