Article

Signal-Processing Framework for Ultrasound Compressed Sensing Data: Envelope Detection and Spectral Analysis

Department of Electrical Engineering, Kwangwoon University, Seoul 139-701, Korea
*
Author to whom correspondence should be addressed.
Appl. Sci. 2020, 10(19), 6956; https://doi.org/10.3390/app10196956
Submission received: 20 August 2020 / Revised: 28 September 2020 / Accepted: 30 September 2020 / Published: 4 October 2020
(This article belongs to the Section Applied Biosciences and Bioengineering)

Abstract

:
Acquisition times and storage requirements have become increasingly important in signal-processing applications, as the sizes of datasets have increased. Hence, compressed sensing (CS) has emerged as an alternative processing technique, as original signals can be reconstructed using fewer data samples collected at frequencies below the Nyquist sampling rate. However, further analysis of CS data in both time and frequency domains requires the reconstruction of the original form of the time-domain data, as traditional signal-processing techniques are designed for uncompressed data. In this paper, we propose a signal-processing framework that extracts spectral properties for frequency-domain analysis directly from under-sampled ultrasound CS data, using an appropriate basis matrix, and efficiently converts this into the envelope of a time-domain signal, avoiding full reconstruction. The technique generates more accurate results than the traditional framework in both time- and frequency-domain analyses, and is simpler and faster in execution than full reconstruction, without any loss of information. Hence, the proposed framework offers a new standard for signal processing using ultrasound CS data, especially for small and portable systems handling large datasets.

1. Introduction

“Big Data” is an increasingly ubiquitous term that refers to the growing size and complexity of datasets due to the variety of sources from which they can be acquired. Big Data is transforming the fields of science, engineering, medicine, healthcare, finance, business, and society in general. As the sizes of datasets increase, efficient compression techniques are desperately required for acquisition, storage, and reliable retrieval of data. Compressed sensing (CS) has emerged as an alternative signal-processing solution that addresses the requirements for reductions in data storage and acquisition time, since, assuming they are sufficiently sparse, original signals can be reconstructed using fewer data samples acquired at frequencies lower than those dictated by the Shannon-Nyquist theory [1,2,3]. Accordingly, the CS technique has been applied in many fields, including imaging, communications, pattern recognition, sound processing, and video processing [4,5,6,7,8,9,10]. The CS technique also offers promising benefits for medical image processing applications [7,11,12,13]. For instance, the relatively long data acquisition times for MRI systems, which make patients uncomfortable as they are required to remain motionless for prolonged periods, is dramatically reduced with CS [14]. Similarly, many recent studies have focused on reducing the size of the hardware and data storage of portable systems used for medical ultrasound, by lowering the sampling rate using the CS theory [15].
In general, when CS signals are processed for additional analysis, reconstruction is required to convert them to their original forms, as most traditional methods for signal analysis utilize uncompressed signals acquired in the time domain. In particular, with medical imaging analysis, the envelope of the received signal in the time domain contains important anatomical information, while, in the frequency domain, spectral information provides fundamental background for quantitative analysis of tissue properties. For the applications of nuclear magnetic resonance spectroscopy, the CS reconstruction contains the spectral information since the sparse transformation is the Fourier transform itself [16,17]. Similarly, Shim et al. showed that the traditional processing framework for frequency-domain analysis of compressed medical ultrasound data contains a redundant transformation from the time domain to the frequency domain [18]. We have observed that the same redundancy exists with time-domain analyses such as envelope detection for time-varying signals for B-mode ultrasound images.
In this paper, we propose a signal-processing framework for ultrasound CS data that is simpler and faster in execution than the traditional framework, and produces more accurate results in both time- and frequency-domain analyses. With the traditional framework, CS signals first need to be recovered to the uncompressed forms and then transformed from the time domain into the frequency domain using a technique such as the fast Fourier transform (FFT), to estimate the spectral information required for frequency-domain analysis. Here, when an appropriate basis matrix is used, this spectral information is directly extracted from the CS data, avoiding reconstruction of the original signal and the redundant transformation of the reconstructed time-domain signal to the frequency domain. In addition, time-domain properties like the envelope of the original signal are computed during the reconstruction process without fully converting them into their original forms. More specifically, because the envelope of a signal is defined by its magnitude in a complex analytic form, the traditional framework uses the Hilbert transform to obtain analytic time-domain signals for envelope detection. In contrast, with the proposed method, the analytic signal is calculated directly from the frequency information obtained during the reconstruction process, using the inverse Fourier transform (IFFT).
To validate our framework, we performed envelope detection on ultrasound CS data to form a B-mode image, for time-domain analysis. Similarly, for frequency-domain analysis, we estimated ultrasonic attenuation coefficients from the same CS data using the centroid downshift method (CDM) [19]. Additionally, we compared the estimation performances of the discrete Fourier transform (DFT) and discrete cosine transform (DCT), to select the proper basis matrix for the measurement and reconstruction processes. We used several numerical tissue-mimicking (TM) phantoms with different attenuation and backscatterer properties to simulate the propagation of radiofrequency (RF) medical ultrasound signals, for further validation of the operation of the proposed framework in practical experiments.
The rest of the paper is organized as follows: in the next section, the CS technique and the CDM are briefly summarized, as well as the theoretical background of envelope detection using Fourier transform coefficients. We then introduce details about the proposed framework, experimental procedures, and numerical phantoms used in the experiments. In Section 3, we discuss the results of envelope detection, comparing the performances of the two basis matrices at a variety of compression rates, and then estimate attenuation coefficients using the DCT basis matrix. We also compare the traditional and proposed methods with respect to their computational times. In Section 4, we discuss several aspects of the proposed framework and introduce a complete signal-processing framework for medical ultrasound CS data, introducing the new concept of a Q-mode image that simultaneously presents qualitative and quantitative information from the time and frequency domains. The contributions of this paper to the literature are summarized in the final section.

2. Materials and Methods

2.1. Compressed Sensing Technique

CS enables the reconstruction of under-sampled discrete-time signals when the original signals satisfy the relevant conditions for sparsity and incoherence [1]. For the former condition, a signal is considered to be K -sparse if the number of non-zero values is K [1].
The core of CS theory is finding a solution to the following equation:
y = A x ,
where y is an ( M   ×   1 ) vector containing the compressive measurements from the original signal, x is the original ( N   ×   1 ) discrete-time signal, and A is the ( M   ×   N )   measurement matrix, in which random sampling is generally modeled with the Gaussian random distribution or the Bernoulli random distribution.
If x is K -sparse, there is a high probability that it can be completely recovered from y if M   , which is the number of compressive measurements, satisfies the condition that M O ( K log ( N / K ) )   . While x is not necessarily sparse in its original form, specific transformations exist to make it sparse in other domains. When these are applied, x is expressed as follows:
x = B 1 f ,
where B is an ( N   ×   N ) basis (transformation) matrix, and the ( N   ×   1 ) vector, f   , is the coefficient for the specific basis matrix. To apply CS theory, a basis matrix should be chosen such that f satisfies the K -sparse condition. In this case, with the matrix T = A B 1   , Equation (1) can be rewritten as follows:
y = A B 1 f   = T f
In reconstruction, f is first estimated from y   , before x is recovered using Equation (2). In general, Equation (3) has an infinite number of solutions, since this problem is underdetermined. However, if T satisfies the restricted isometry property (RIP) condition, it becomes possible to determine a unique solution using optimization techniques. This condition can be expressed as follows:
( 1 δ 2 K ) f 2 T f 2 ( 1 + δ 2 K ) f 2 ,
where   δ 2 K is the RIP constant, located in the range   0 < δ 2 K < 1   .
Several different optimization approaches exist for determining a unique solution to Equation (3), including l 0 -minimization and l 1 -minimization. While l 0 -minimization is not practical, since it is a nondeterministic polynomial-time hard problem [20], l 1 -minimization becomes a convex optimization problem by solving the linear programming in Equation (5) [21,22]:
f ¯   = argmin f 1   subject   to   T f = y

2.2. Centroid Downshift Method

Of the various medical imaging modalities, ultrasound pulse–echo systems have been widely utilized for visualizing the human body’s internal organs, as well as for evaluating the pathological state of soft tissue. To analyze the status of scanned tissue, several ultrasonic parameters, including speed of sound [23,24], integrated backscatter [25,26] and scatterer size [27], are extracted from RF data. Ultrasound attenuation is another critical parameter for evaluation of soft tissue, used to distinguish malignant from benign tumors, as well as provide fundamental information for quantitative ultrasound (QUS) [28].
To simplify representation in the frequency domain, most attenuation estimation methods for ultrasound pulse-echo systems assume constant sound speed and linear frequency dependence in a region of interest (ROI). After applying the Born approximation, which ignores multiple weak scattering of propagating acoustic waves in soft tissue, the intensity of the reflected RF signal in the frequency domain, R ( f , z )   , can be represented as a product of pulse characteristics ( G ( f ) ), diffraction effects ( D ( f , z ) ), and backscatterer ( B ( f ) ) and attenuation terms ( A ( f , z ) ) [29]:
R ( f , z )   =   G ( f )   D ( f , z )   B ( f )   A ( f , z ) ,
where z denotes the distance between the face of a transducer and the center of the ROI. Here, G ( f )   , represents the transmit pulse characteristics which are closely related to the geometrical design and beam shaping parameters of the transducer. Insonifying pulses are typically modeled as Gaussian in the spectral domain, which is an approximation that has shown to be accurate within 10%, from root-mean-square-error analysis [30].
Most array transducers in modern ultrasound systems utilize beam focusing techniques to improve the spatial resolution at the ROI. As a result, the propagating acoustic waves experience the diffraction effects, expressed as D ( f , z )   , along the depth of the tissue, and reflected RF signals acquired by linear array transducers contain diffraction effects around the pre- and post-focal sections. The spectral properties of the power spectra are also distorted before and/or after the beam focus. Fink et al. [31] showed, using classical sound theory and focused transducer models, that diffraction effects could underestimate (or overestimate) attenuation coefficients at pre- (or post-) focal regions. To compensate for the diffraction effects, we utilize a simple correction method using two reference TM phantoms whose attenuation properties are known a priori [28]. Since the reflected RF signals for reference and sample phantoms acquired with the same transducer settings (i.e., the same focus, TGC, and beam pattern) exhibit identical diffraction effects, these can be eliminated by comparing the changes to the center frequency at the same depth.
Because of the large number of randomly distributed small scatterers in the ROI, the frequency-domain characteristics for backscattered echo signals, B ( f )   , are expressed as a stochastic model [32]. In general, this backscatterer model is typically in a form that considers only nonlinear frequency dependence, which is incorporated as a power of frequency.
The cumulative attenuation through the beam path is modeled as being dependent on frequency and the distance. In a medium with uniform attenuation characteristics, A ( f , z )   , is given as,
A ( f , z )   =   exp { 4 α ( f ) z } ,
where z is the distance from the transducer to the ROI and α ( f )   is the frequency-dependent attenuation expressed in Neper/cm (or dB/cm). Since, α ( f ) is known to exhibit linear dependence on frequency [33,34], this function can be written as α ( f ) = β · f   , where β is the attenuation slope, also called the attenuation coefficient, expressed in Neper/cm/MHz (or dB/cm/MHz).
In medical ultrasound systems, estimation of the attenuation coefficients is based on the frequency-dependent attenuation in soft tissue. The power spectrum of RF signals reflected at a given depth demonstrate a downshift to lower frequencies with respect to the position of the center frequency (or centroid), since higher-frequency components attenuate faster than lower-frequency components. Previous research in the literature has found that the attenuation coefficient in soft tissue is almost linearly proportional at frequencies up to 10 MHz. Due to this linearity of the attenuation at higher frequencies, the downshift in center frequency with respect to depth is proportional to the attenuation coefficient,   β   . Assuming that a Gaussian-shaped transmit pulse is propagated, the relationship between the slope of this downshift with respect to depth and the attenuation coefficient is given by [19]:
β = 8.686 4 σ 2 d f c ( z ) d z ,
where z is the distance from the transducer to the ROI, σ 2 is the variance of the transmit pulse, and f c ( z ) denotes the center frequency of the power spectrum at depth z   .

2.3. Envelope Detection from Fourier Transform Coefficients

The envelope of a signal in the time domain represents the instantaneous amplitude of a time-varying signal. In medical imaging applications, this envelope conveys structural or anatomical information along the signal path. In general, an analytic expression of a signal is first derived to obtain the envelope of a time-domain signal. These analytic expressions, a widely used concept in signal processing, are alternative complex-valued representations of real-valued signals that make various processes related to a signal’s time dependence conceptually simpler [35]. In the time domain, the real part of the analytic signal, x a ( t )   , is simply the original signal, x ( t )   , and the new imaginary part, x h ( t )   , is calculated using the Hilbert transform ( x h ( t ) = HT { x ( t ) } ), which suppresses the negative frequency components, i.e.,
x a ( t ) =   x ( t ) +   j · x h ( t ) .
The mathematical definition of the Hilbert transform of x ( t )   , x h ( t )   , is given by:
x h ( t ) = p . v .   x ( t ) π ( t τ ) d τ ,
where p.v. is the Cauchy principal value of the integral. Figure 1 shows the spectral properties of the original and analytic signals in the frequency domain. Then, the envelope of a signal,   E   , is defined as the magnitude of the analytic signal as below,
E = x ( t ) 2 + x h ( t ) 2 .
An alternative approach that is valid for most engineering applications has been proposed for calculating discrete-time domain analytic signals, based on the spectral properties shown in Figure 1 [36]. Since, from the spectrum, an analytic signal has no negative frequency components, and its positive frequency components are double the size of that of the original signal, it can be estimated based on a DFT of the original signal. In this procedure, X [ m ] represents the coefficients of the N -point DFT of the original signal, x [ n ]   , defined as,
X [ m ] = T n N 1 x [ n ] exp ( j 2 π f n T ) ,   where   x [ n ] = x ( n T )   .
The coefficients of the DFT of the analytic signal, Z [ m ]   , can thus be obtained from X [ m ] as follows:
Z [ m ] = {   X [ 0 ] ,   for   m = 0                           2 X [ m ] ,       for   1 m N 2 1             X [ N 2 ] ,       for   m = N 2                                 0 ,       for   N 2 + 1 m N 1   .
The analytic signal in the discrete-time domain can subsequently be recovered from Z [ m ] using the inverse DFT. Finally, the envelope is also directly calculated from the real and imaginary parts of the complex discrete-time analytic signal, x [ n ] and x h [ n ]   , respectively, as follows:
E = x [ n ] 2 +   x h [ n ] 2

2.4. Signal-Processing Framework for Ultrasound Compressed Sensing Data

Although CS signals are advantageous for acquisition and storage processes in terms of the time and the space they save, most signal-processing frameworks used for temporal and spectral analysis require an uncompressed time-domain signal, and cannot be directly applied to CS data. The signal-processing framework for ultrasound CS data we propose in this paper involves the direct computation of the analytic representation of a measured signal, and estimation of its spectral properties without full reconstruction in the time domain. This is possible due to CS theory, which dictates that a basis matrix can be used to convert original signals into sparse signals. If an appropriate basis matrix is selected, the sparse signal’s coefficients will contain the spectral information necessary for analysis, avoiding the need for reconstruction and transformation [18].
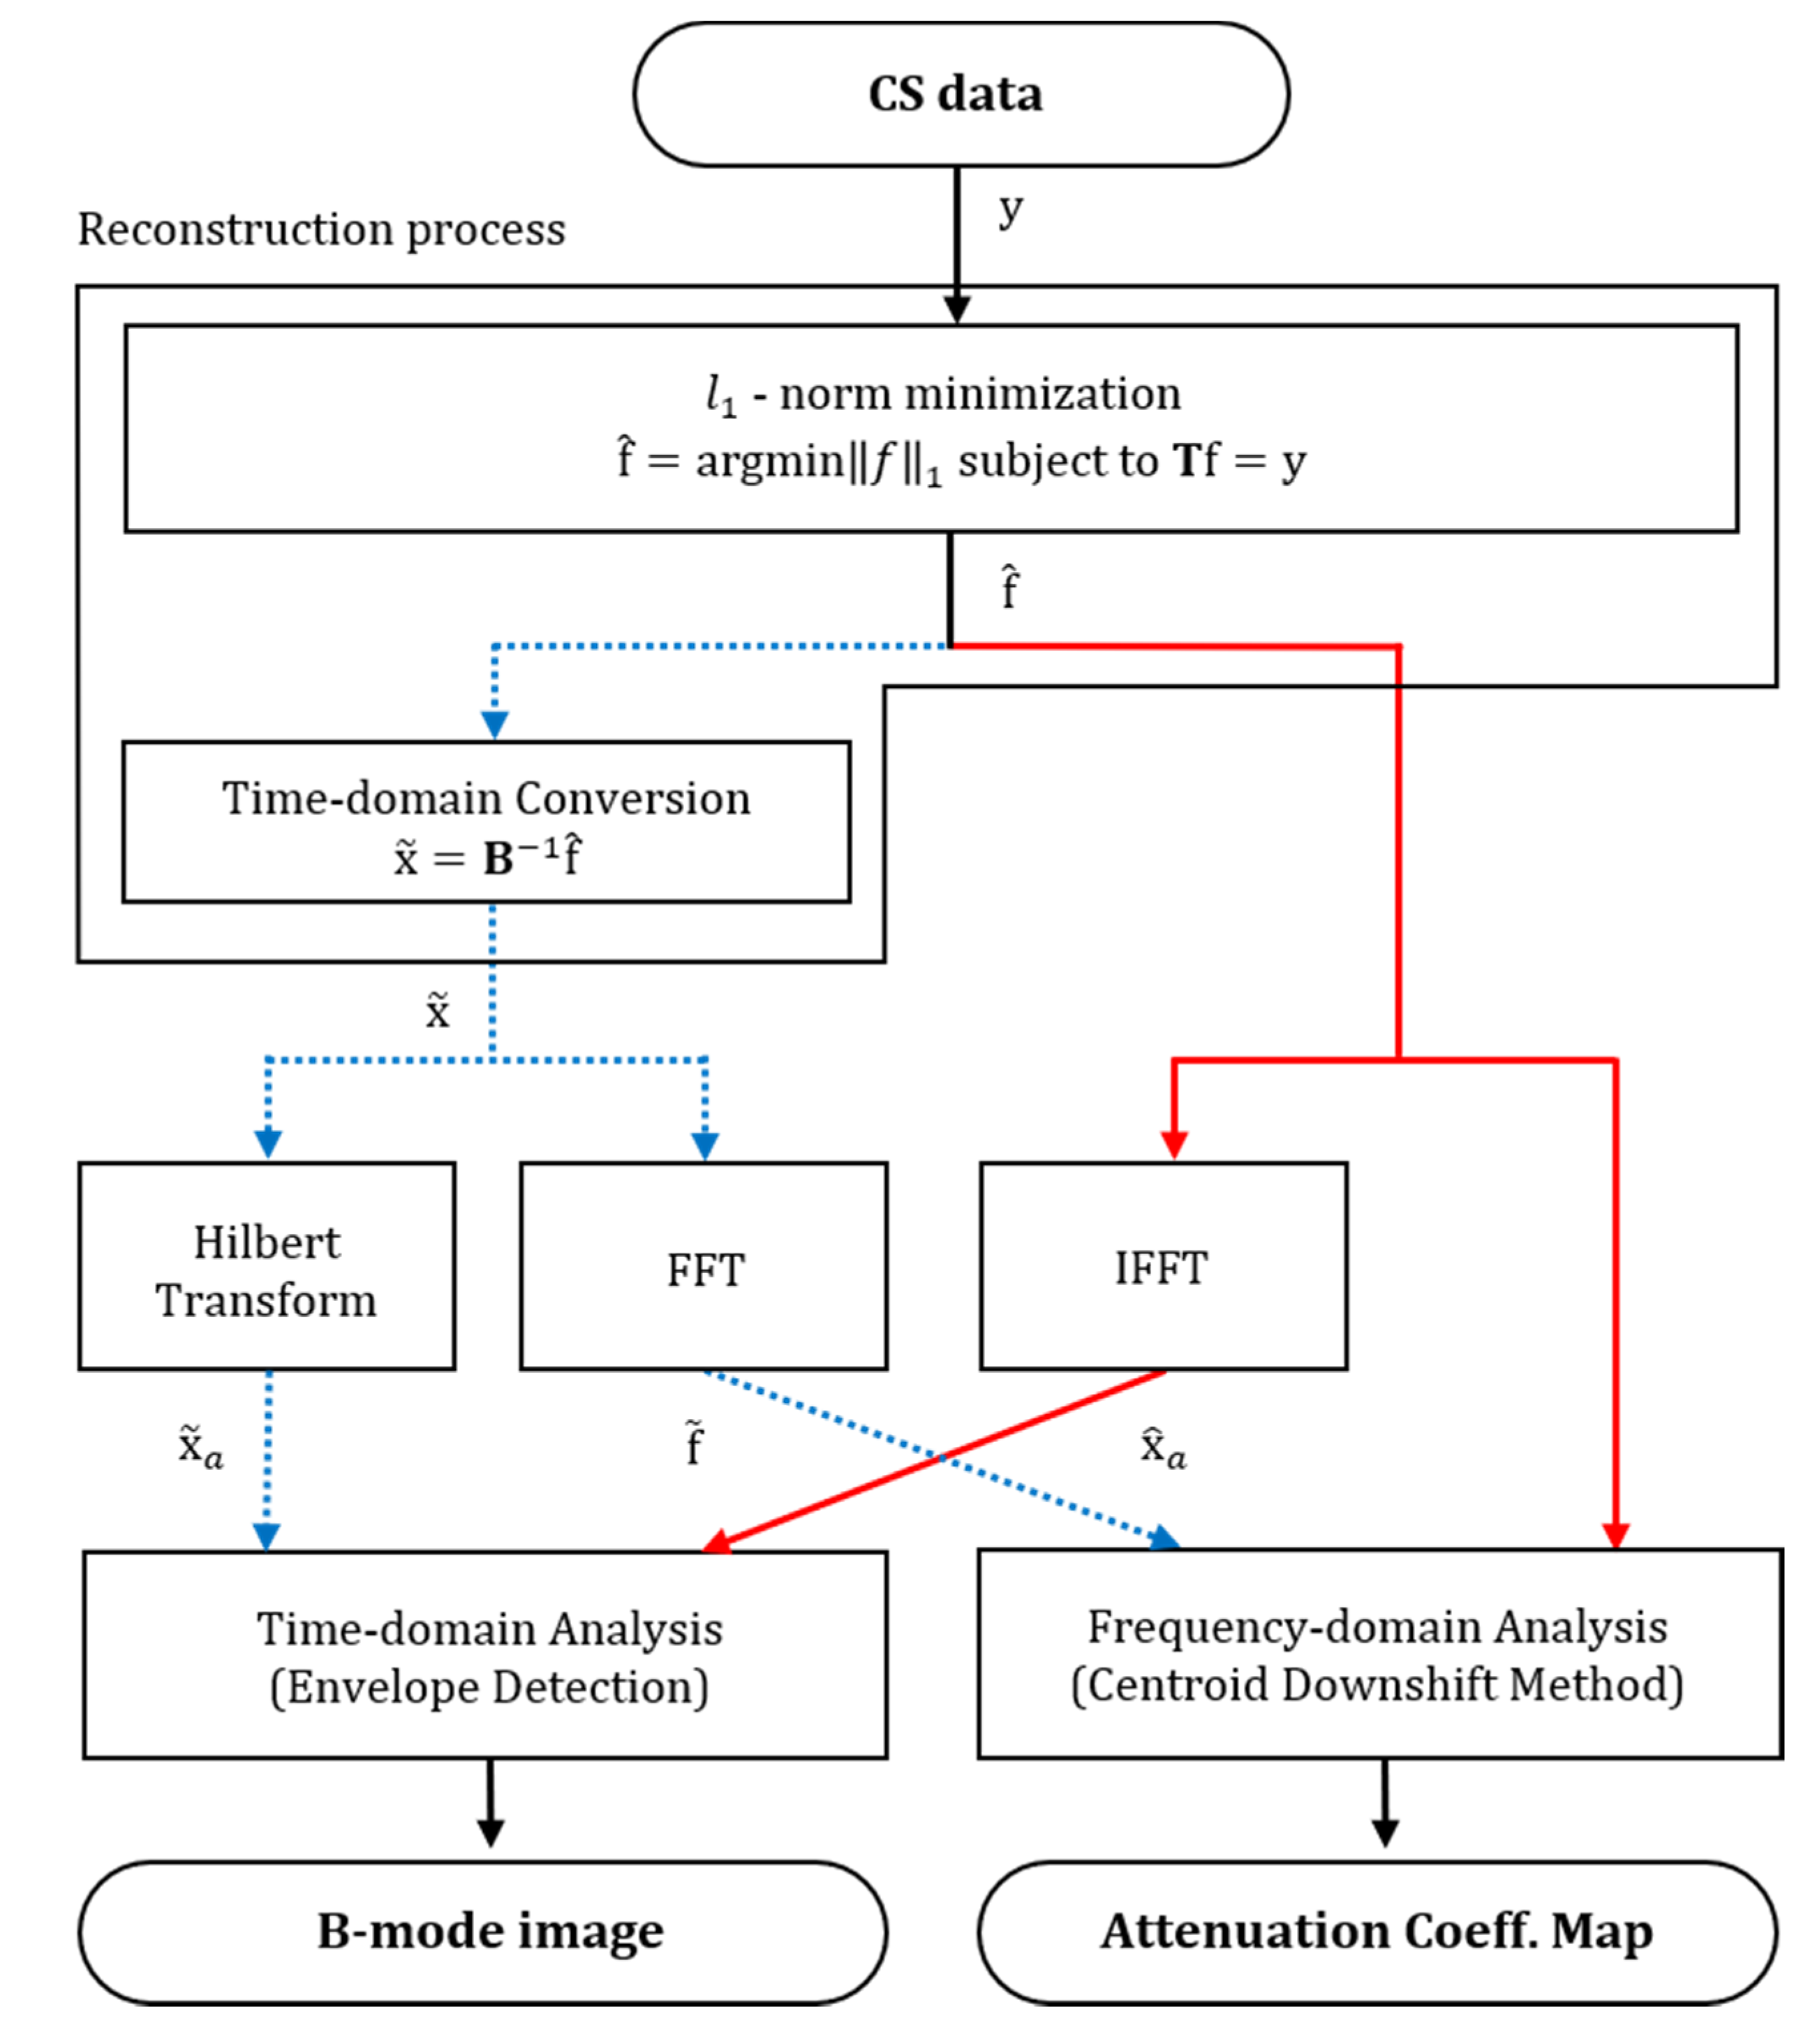
In Figure 2, two signal-processing procedures for CS data are summarized, with the blue dotted line representing the traditional framework, and the red solid line representing the proposed framework. For simplicity, a signal is recovered from sparse data using the l 1 -minimization algorithm. For envelope detection with the traditional method, the original time-domain signal ( x ~   ) is first reconstructed from CS data ( y ). The Hilbert transform is then applied to calculate the analytic signal ( x ~ a ) to perform the envelope detection. For frequency-domain analysis, spectral information ( f ~ ) is obtained by applying the FFT to the recovered time-domain signal x ~   . In contrast, with our proposed framework, spectral information ( f ^   ) obtained by a proper basis matrix during the signal recovery process is directly used for frequency-domain analysis, where attenuation coefficients are identified using the CDM, while a simple IFFT is performed to obtain the analytic signal ( x ^ a ) for detection of the envelope of the original time-domain signal. As there are no redundant transformations between time and frequency domains, shorter processing times for both temporal and spectral analyses are expected. In addition, we expect more accurate signal-processing results due to a reduced accumulation of round-off errors.
In our CS framework, the Gaussian random matrix was utilized as a measurement matrix to randomly sample the signal. The Basis Pursuit was a principle for decomposing a signal into a sub-optimal superposition of dictionary elements which have the smallest l1-norm of coefficients among all decompositions, and used as the reconstruction algorithm in the proposed framework [37]. For correct operation of the devised framework, the coefficients of the basis matrix should contain physically relevant spectral information, a fact that restricts the possible candidates for selection. To verify the effect of the basis matrix on the framework’s operation, we compare the performances of the DFT and DCT matrices when applied for measurement and reconstruction.

2.5. Numerical Phantoms

To verify the framework, we generated numerical RF signals with differing attenuation properties, for stimulation of the reference and sample TM phantoms, using a frequency-domain model based on the classical linear diffraction theory of continuous waves [38]. In this study, transmitters and receivers were modeled as linear array transducers consisting of 128 rectangular 0.2 × 10 mm elements (azimuthal direction × elevation direction), with a 0.2-mm center-to-center separation. Each element in the array generates an individual beam line. Hence, the array’s collective field is a superposition of simultaneous excitation from single elements. Dynamic focusing was applied for reflected RF signals in combination with a dynamic aperture, and the F-number was fixed at 2 during the reception process. Each transmit pulse was modeled as a Gaussian function with a center frequency of 5 MHz and a bandwidth of 80%. In this simulation, a complex wave number is used to calculate parameters related to attenuation and sound speed during wave propagation.
The numerical phantoms used in this study are shown in Figure 3. All phantoms were 34 mm wide, 80 mm deep, and 10 mm thick, and the interval between simulated beam lines was set to 0.2 mm. We assumed that the face of the transducer was in direct contact with the phantoms, and set both the axial transmit focus and elevation focus to 80 mm. We assumed a uniform sound speed of 1540 m/s through the entire depth of the phantoms, while distributions of 50-μm polystyrene beads were included to model backscatter. All simulations were performed in 0.1-MHz increments in the 1 to 15 MHz range.
Figure 3a,b depict the sample phantoms used in the experiments. Each phantom includes a cylindrical region with contrasting backscatter properties to the background medium, generated by adjusting the number density of polystyrene scatterers in the cylindrical inclusion. Hence, in Figure 3a (p12) the backscatter intensity is 12 dB higher in the cylindrical inclusion than it is in the background medium, while it is 12 dB lower in Figure 3b (m12). In contrast to the backscatter property, the attenuation coefficients of the inclusion and the background were same and set to 5 dB/cm/MHz in both phantoms.
The reference phantoms used for diffraction compensation (DC) are shown in Figure 3c,d. With these phantoms, the backscatter and attenuation properties in the entire medium are uniform. The scatterer number density was set as 9.7/mm3 for each phantom, while the attenuation coefficient was 0.3 dB/cm/MHz for Figure 3c, and 0.7 dB/cm/MHz for Figure 3d.

3. Results

3.1. Comparison of the DFT and DCT Basis Matrices

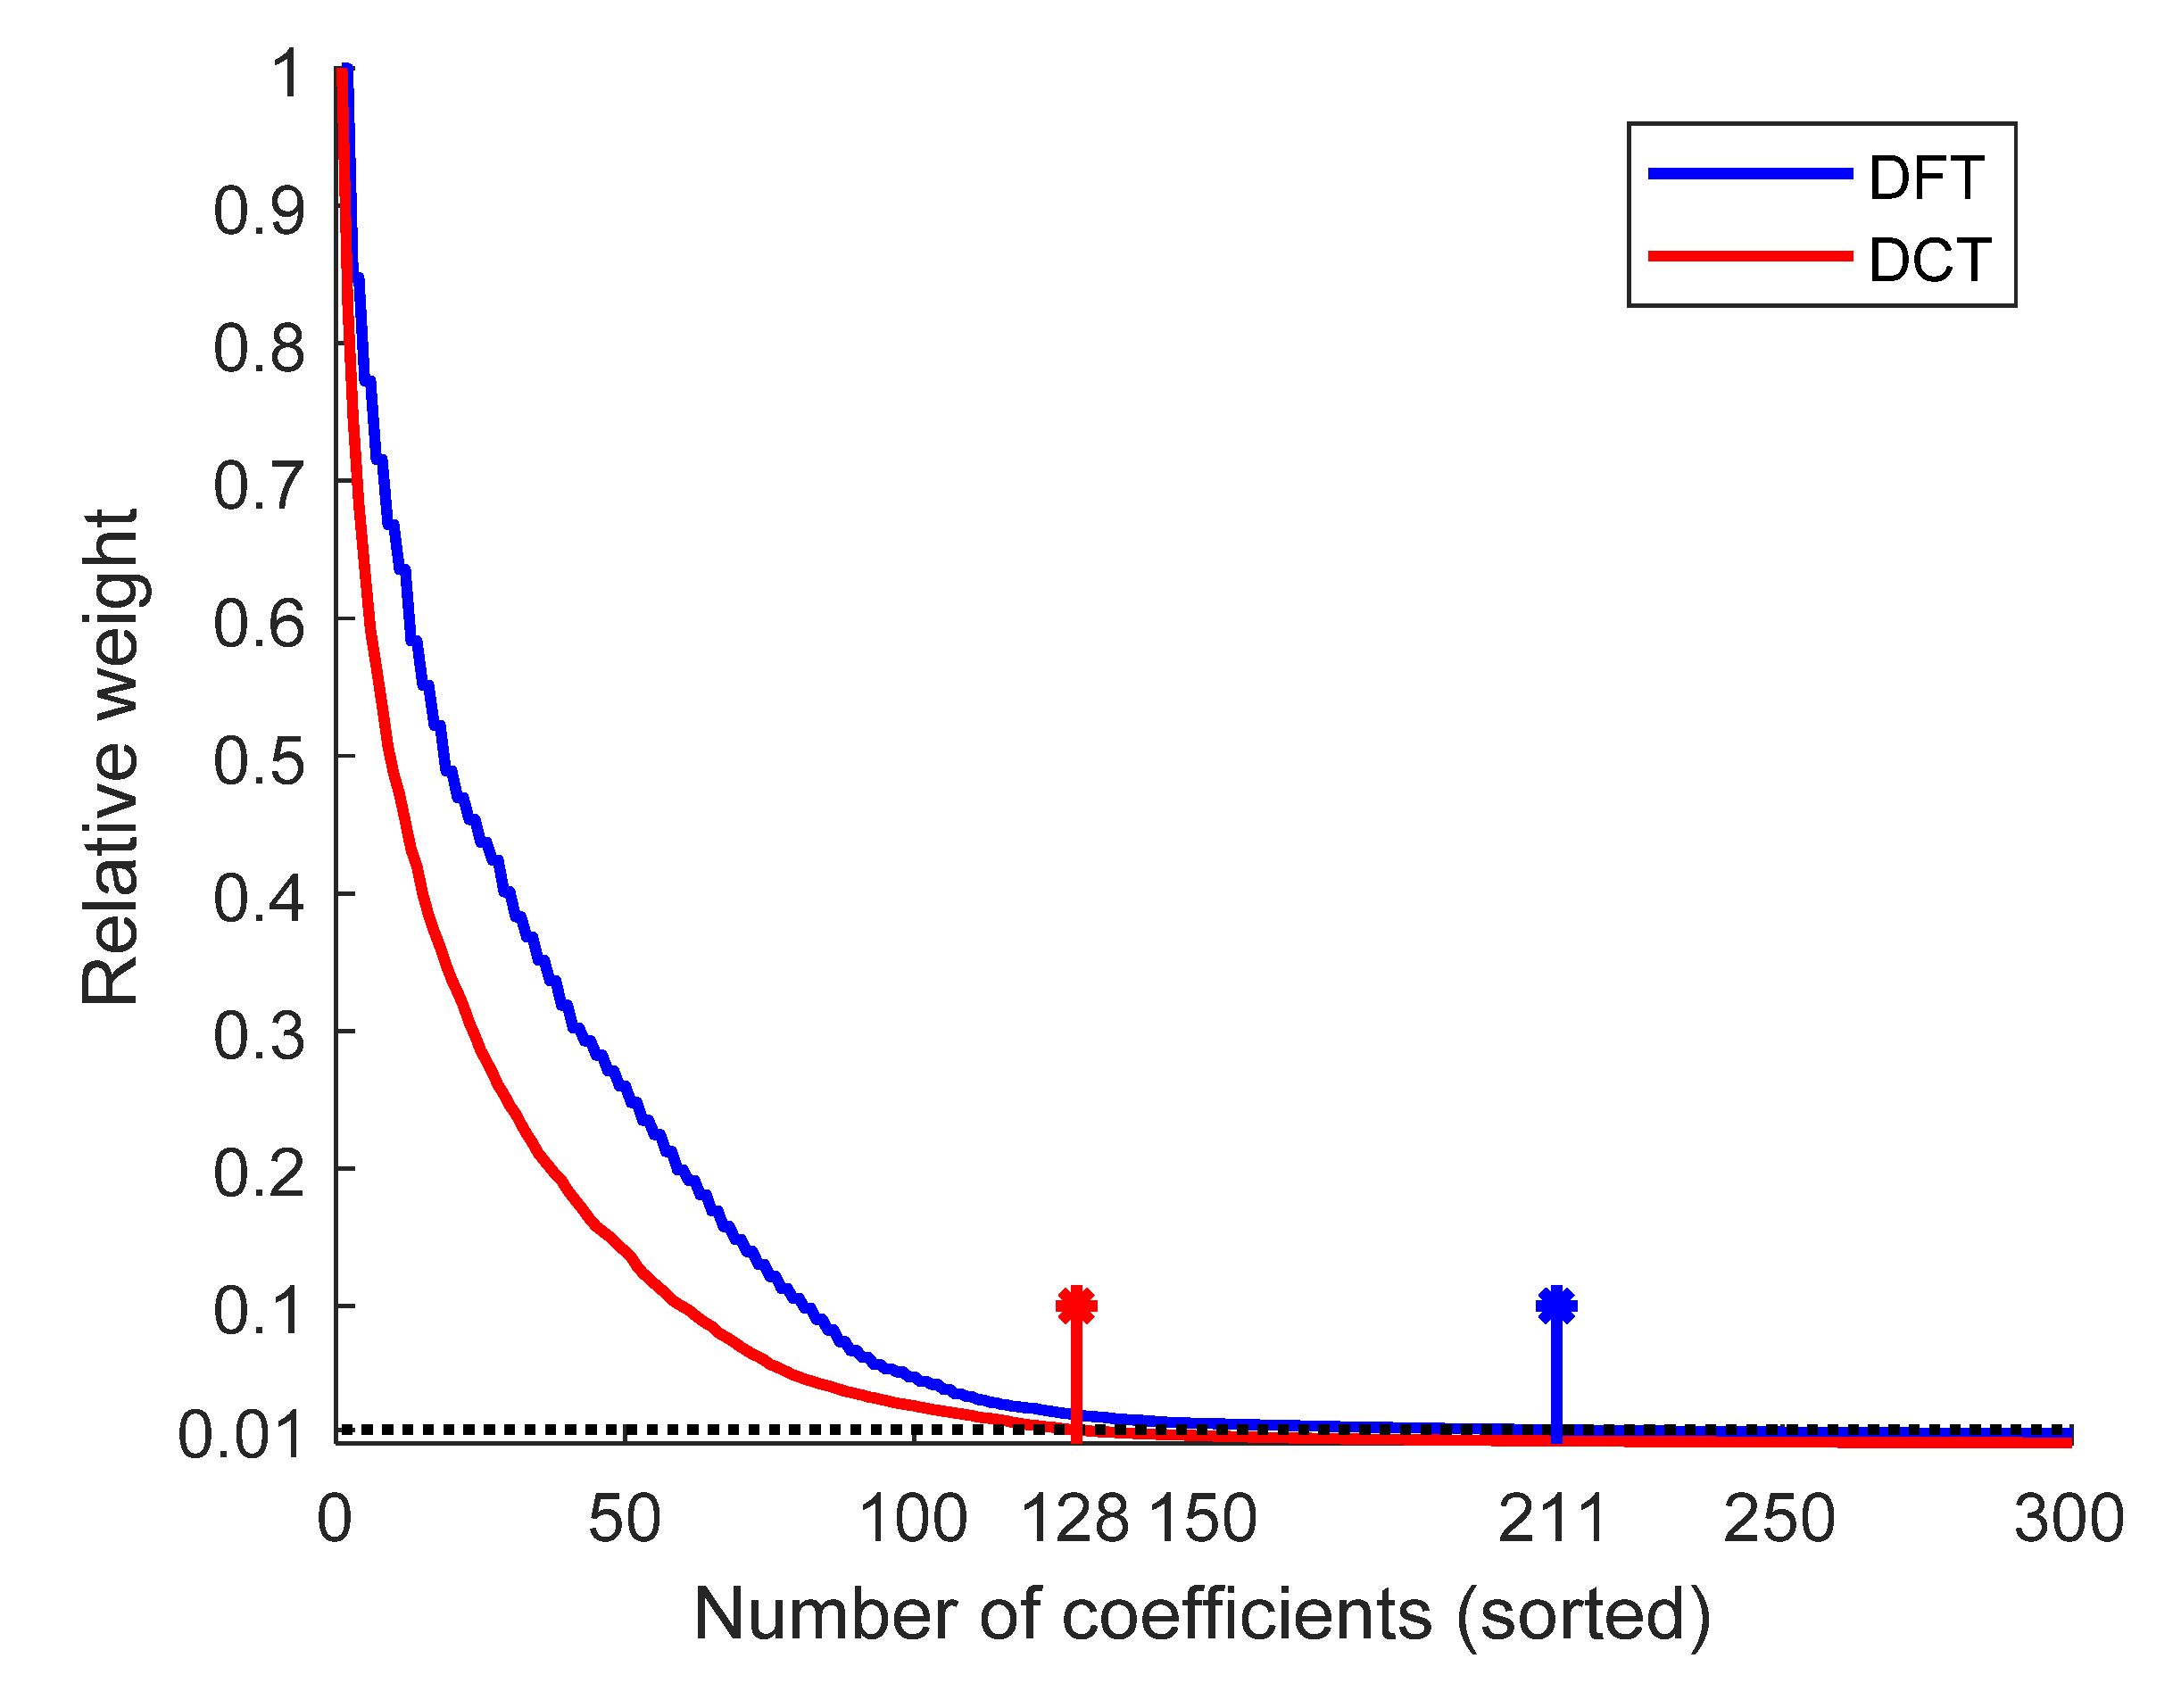
The DFT and DCT basis matrices for converting the original signal to a sparse form were chosen because they both contain the frequency information that is necessary to make the proposed framework viable. To identify the preferred option, we conducted a comparison of the performances of both matrices, based on the resulting sparsity after each was applied to the original signal. Here, the original signal is a random ultrasound pulse, 6 mm long in the axial direction, that was transformed by the DFT and DCT. The transformation coefficients for both matrices were sorted in descending order and normalized with respect to their maximum. Coefficients larger the 1% of maximum relative weight (Figure 4) were counted, and sparsity was subsequently compared based on the number of significant coefficients. From Figure 4, it can be observed that significant information was encoded in 128 coefficients with the DCT, compared to the 211 required with the DFT. This indicates that the DCT exhibits better sparsity than the DFT in contrasting inclusion images, suggesting that DCT basis matrix can achieve better spectral estimation performances under the same compression ratio. Note that although the transformation coefficients of the DCT do not strictly match the physical frequency components of the original signal, following averaging, this should not affect the accuracy of most spectral analysis processes.

3.2. Envelope Detection

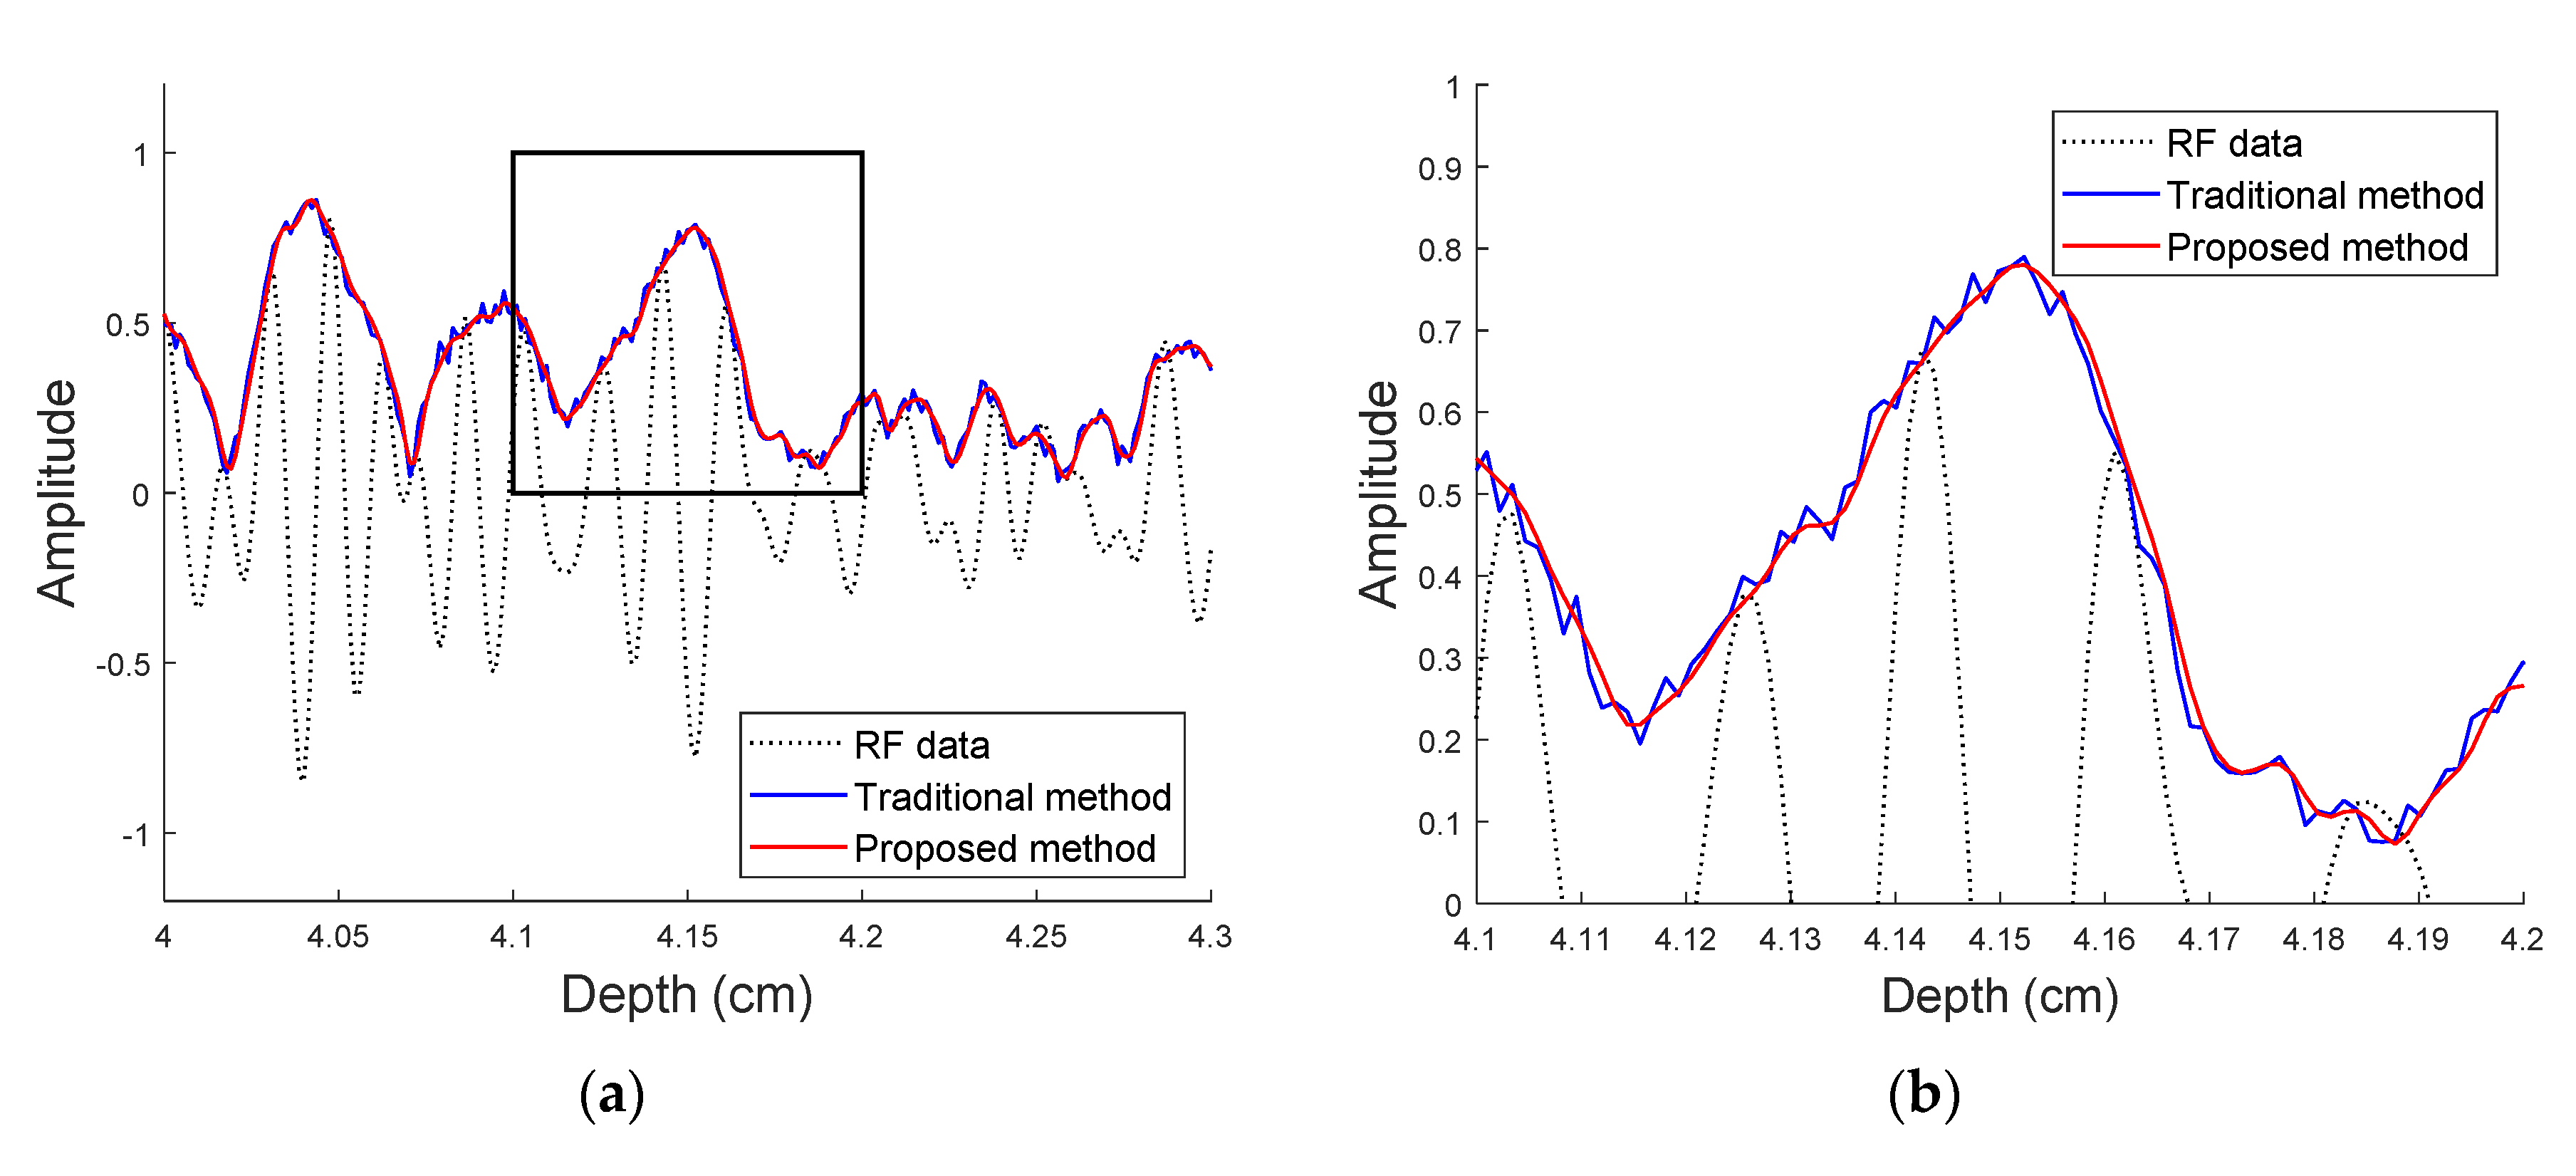
Figure 5 shows the results of envelope detection of CS ultrasound data using the p12 numerical phantom depicted in Figure 5a, where the backscatter intensity in the cylindrical inclusion is 12 dB higher than the background medium. Here, CS data were randomly sampled at a 50% ratio and reconstructed using the DCT basis matrix. For comparison, original RF data (dotted line) is plotted in the same graph as CS data processed using the traditional method (blue line) and the proposed framework (red line). Although both signal-processing methods produce representative envelopes of the original RF signal, the result obtained with the proposed framework is much smoother than that obtained with the traditional framework, as seen in Figure 5b (the magnified view of the region highlighted in Figure 5a).
For further quantitative analysis, quality of B-mode images was compared by the weighted mean and standard deviation for original data and reconstructed CS data with traditional and the proposed methods [39]. The ROIs were selected inside of the inclusion region of +12dB (p12), 0dB (uniform), and −12dB (m12) contrast TM phantoms of the 70% compression. As shown in Figure 6, the mean pixel values in B-mode images of two reconstructed data using traditional and the proposed methods were close to the original data for all three phantoms. As for the estimation variances, two reconstructed data showed larger than the original, but the proposed method exhibited smaller standard deviations than the traditional method for all three cases as expected in Figure 5b.
We also calculated the root mean square error (RMSE) of envelopes detected using the traditional framework and the proposed framework, with DFT and DCT basis matrices, at compression rates varying from 50% to 90% to present the overall performance. The resulting RMSE values were normalized with respect to the maximum, i.e., the results of envelope detection using DFT at 90% compression. A summary of these results is given in Table 1, which indicates that DCT produces more accurate results than the DFT, particularly at low compression rates, due to its effectiveness in producing a sparse signal. In addition, the proposed framework produces better results than the traditional framework for all compression rates. The combination of qualitative and quantitative evidence shown in Figure 5 and Table 1, respectively, demonstrates that the proposed framework can suitably replace existing frameworks for time-domain analysis.
We also compared the relative computational speeds of the traditional and proposed frameworks with DCT basis matrix, noting that the proposed framework completed computations in 63.6% of the time required for the traditional framework, based on the average for all compression rates. This shorter computational time was expected, as the lengthy time-domain conversion and Hilbert transform processes used by the traditional framework to obtain the analytic signal were replaced by the IFFT, as shown in Figure 2.

3.3. Attenuation Estimation

Since the DCT performs better than the DFT, as demonstrated in the previous two sections, in estimating the attenuation coefficients from CS ultrasound data, we selected a DCT basis matrix. In these simulations, CS data was randomly sampled from original RF data at a 50% ratio. Diffraction compensation (DC) was provided by the uniform attenuating phantoms as references depicted in Figure 3c,d.
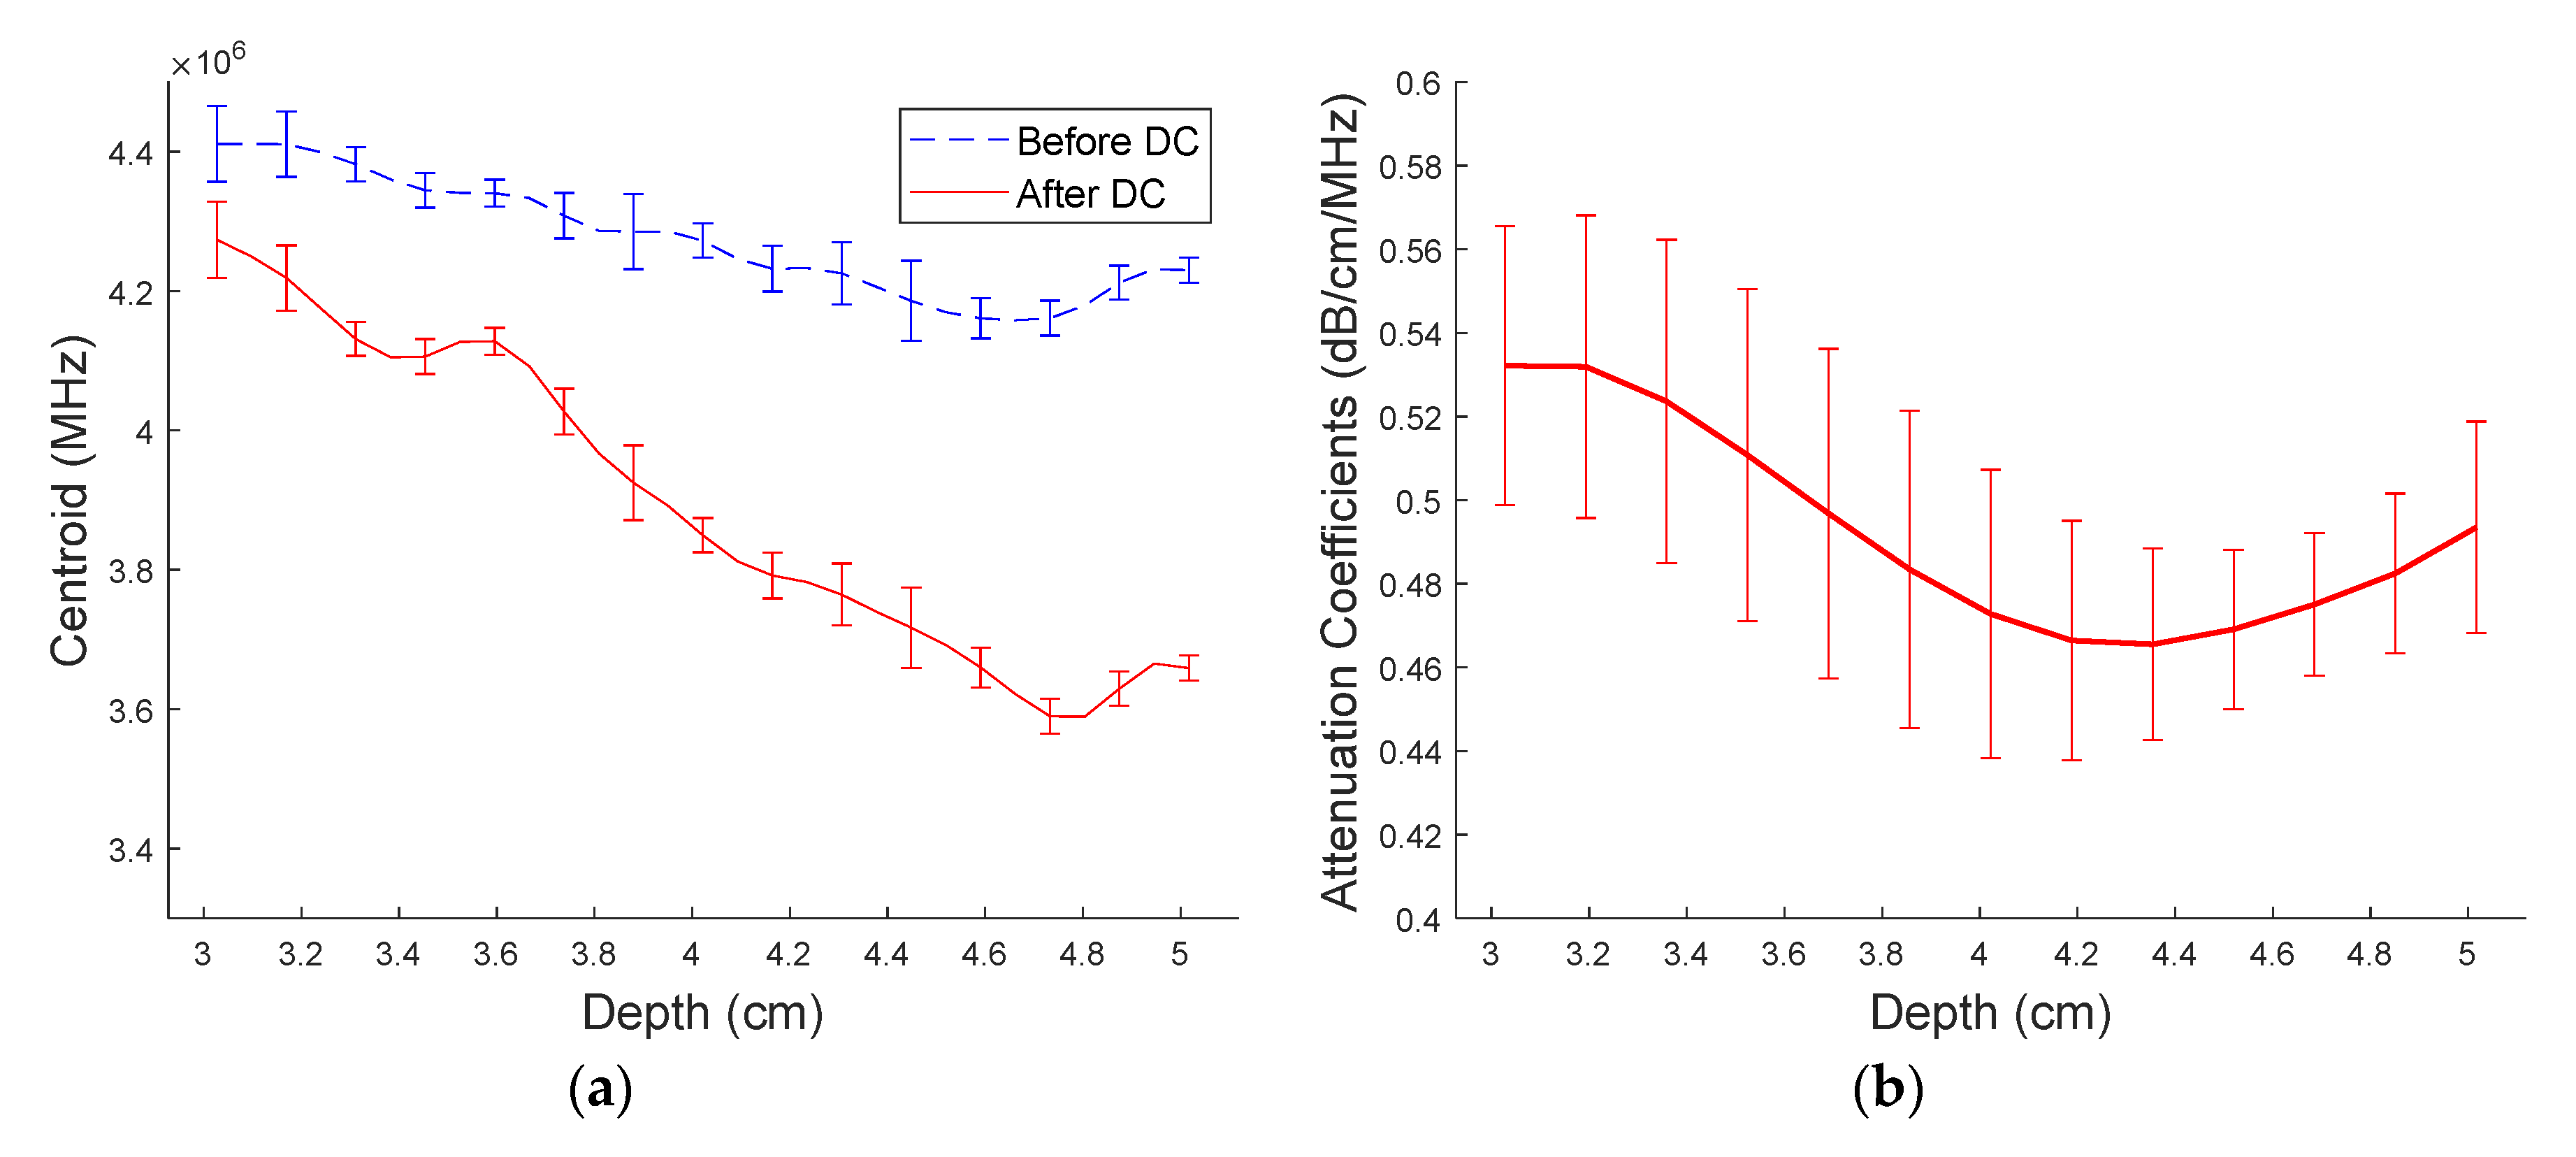
Figure 7a shows the variation of the estimated spectral centroid with respect to the depth dimension of the ROI, for the p12 numerical phantom. The beam focusing applied alleviates the original signal’s decay in the axial direction, as shown by the blue dotted line, making estimation of attenuation properties less accurate. A more representative relationship between the centroid and depth, shown as the red solid line, is obtained after applying DC, enabling accurate estimation of attenuation coefficients, as shown in Figure 7b. In spite of the fact that the ROI in the p12 phantom is brighter than the background in the B-mode image (due to its larger backscatter intensity), at 0.5 dB/cm/MHz, the attenuation coefficients estimated are, on average, the same as the coefficients estimated for the background.
A similar simulation was conducted with the m12 numerical phantom. The results are shown in Figure 8. Similar to the behavior noted for the p12 phantom, the attenuation coefficient estimated for the ROI following the application of DC (Figure 8b) is the same as that of the background, despite its darker appearance. These two cases demonstrate that spectral analysis of CS data can provide important signal characteristics that are unavailable from time-domain representations.
As before, for a quantitative comparison of the performance of the traditional and proposed frameworks in frequency-domain analysis, we calculated the RMSE of the attenuation coefficients estimated for the p12 phantom at compression rates varying from 50% to 90%. All resulting RMSE values were normalized with respect to the largest value, which was again obtained at a 90% compression rate, using the traditional framework. The results of this analysis are summarized in Table 2, which shows that the proposed framework produces much smaller RMSEs than the traditional method for lower compression rates, with the difference decreasing as the compression rate is increased. We posit that this improved performance is due to the ability of the proposed framework to avoid cumulative estimation errors, since its direct use of spectral information from CS data removes redundant transformation steps. As a further consequence, the speed of computation is also improved; the analysis using the proposed framework required only 24.6% of the time taken using the traditional method, based on the average time for all the compression rates.

4. Discussion

In this paper, we proposed a complete signal-processing framework for temporal and spectral analysis of ultrasound CS data. With our method, relevant spectral information is directly extracted from a compressed measurement. This framework is designed for ultrasound CS data that avoids a redundant reconstruction process. This is enabled by selecting an appropriate basis matrix for use in the data acquisition and reconstruction processes. Hence, we compared the performances of two fundamental basis matrices, determining that the DCT matrix offered the best performance for time and frequency domain analysis.
From our simulations, the proposed framework demonstrated good performance in both temporal and spectral analysis. Based on this, we introduce a novel imaging mode for medical ultrasound applications combining the results of time and frequency domains analysis, since each domain provides information that is inaccessible from the other. We term the resulting combination of a B-mode image and an attenuation coefficient map, shown in Figure 9, a QUS image (Q-mode image). As proposed, the Q-mode image offers a comprehensive representation of the quantitative measurements from frequency-domain medical ultrasound, and the spatial (or anatomical for in vivo case) relationship from the surrounding B-mode image. This thus makes it possible to conclude professional pathological judgments that cannot be provided from exclusive time-domain analysis (i.e., analysis of traditional B-mode images). With the careful selection of ROI, in addition, the combination of spatial information in the time domain and quantitative results in the frequency domain would aid the development of various deep learning applications for medical ultrasound data. As the deep learning application with a combined MRI images exhibited good performance [40], the new category of comprehensive dataset such as the Q-mode image, also makes it possible to obtain promising results for recognition of pathological characteristics which is not shown in a B-mode image alone.
The concept of the Q-mode image is also flexible, as any combination of results of quantitative analysis can be included with the B-mode image, which is recognized as the most important representation of time-domain information in medical ultrasound applications. Although our demonstration features the attenuation coefficient map as the result of frequency-domain analysis, QUS information such as backscatterer properties, speed of sound, or elasticity, resulting from frequency-domain analysis could be combined with a B-mode image for a new kind of Q-mode image.

5. Conclusions

The CS technique has been widely adopted in signal-processing applications due to the faster data acquisition times and smaller storage spaces it offers. However, its adoption in some applications has been hindered by the fact that compressed data requires reconstruction before further signal-processing for analysis in either the time or the frequency domains, a process that features redundant transformations between the two domains. In this paper, we proposed a simpler framework that avoids full reconstruction of ultrasound CS data. Here, using an appropriate basis matrix to transform the signal to its sparse form, spectral properties can be directly extracted from compressed data, and the conversion to a complex analytic signal for detection of the envelope of the original measurement in the time domain is made more efficient. Simulations conducted with numerical TM phantoms confirmed that this framework is simpler and faster in execution times than the traditional framework, average 63.6% of the time required for the envelope detection and average 24.6% for the attenuation estimation at compression rates varying from 50% to 90%. For the estimation accuracy, the RMSEs of envelope detection and attenuation estimation were averagely reduced by 10% and 38% compared to traditional method at all compression rates. Hence, we suggest that the proposed framework offers a new standard for signal processing using ultrasound CS data, especially for small and portable systems, and applications that handle large datasets.

Author Contributions

Conceptualization, Y.K. and H.K.; methodology, Y.K. and H.K.; software, J.P.; validation, Y.K. and J.P.; investigation, Y.K. and H.K.; resources, H.K.; data curation, J.P.; writing—original draft preparation, Y.K.; writing—review and editing, Y.K. and H.K.; visualization, J.P.; supervision, H.K.; project administration, Y.K.; funding acquisition, H.K. All authors have read and agreed to the published version of the manuscript.

Funding

This work was supported by the Korea Institute of Energy Technology Evaluation and Planning (KETEP); the Ministry of Trade, Industry & Energy (MOTIE) of the Republic of Korea (No. 20174010201620); and research grant of Kwangwoon University in 2018.

Conflicts of Interest

The authors declare no conflict of interest.

Abbreviations

The following abbreviations are used in this manuscript:
CDMCentroid Downshift Method
CSCompressed Sensing
DCTDiscrete Cosine Transform
DFTDiscrete Fourier Transform
FFTFast Fourier Transform
IFFTInverse Fast Fourier Transform
QUSQuantitative UltraSound
RFRadiofrequency
RMSERoot Mean Square Error
ROIRegion of Interest
TGCTime Gain Compensation
TM-phantomTissue-Mimicking Phantom

References

  1. Donoho, D.L. Compressed sensing. IEEE Trans. Inf. Theory 2006, 52, 1289–1306. [Google Scholar] [CrossRef]
  2. Shannon, C.E. Communication in the Presence of Noise. Proc. IRE 1949, 37, 10–21. [Google Scholar]
  3. Nyquist, H. Certain topics in telegraph transmission theory. Proc. IEEE 2002, 90, 280–305. [Google Scholar] [CrossRef]
  4. Otazo, R.; Candès, E.; Sodickson, D.K. Low-rank plus sparse matrix decomposition for accelerated dynamic MRI with separation of background and dynamic components. Magn. Reson. Med. 2015, 73, 1125–1136. [Google Scholar] [CrossRef] [Green Version]
  5. Metzler, C.A.; Maleki, A.; Baraniuk, R.G. From denoising to compressed sensing. IEEE Trans. Inf. Theory 2016, 62, 5117–5144. [Google Scholar] [CrossRef]
  6. Liu, X.Y.; Zhu, Y.; Kong, L.; Liu, C.; Gu, Y.; Vasilakos, A.V.; Wu, M.Y. CDC: Compressive data collection for wireless sensor networks. IEEE Trans. Parallel Distrib. Syst. 2015, 26, 2188–2197. [Google Scholar] [CrossRef]
  7. Liebgott, H.; Basarab, A.; Kouame, D.; Bernard, O.; Friboulet, D. Compressive sensing in medical ultrasound. In Proceedings of the IEEE International Ultrasonics Symposium, Dresden, Germany, 7–10 October 2012. [Google Scholar] [CrossRef]
  8. Wright, J.; Ma, Y.; Mairal, J.; Sapiro, G.; Huang, T.S.; Yan, S. Sparse representation for computer vision and pattern recognition. Proc. IEEE 2010, 98, 1031–1044. [Google Scholar] [CrossRef] [Green Version]
  9. Abrol, V.; Sharma, P.; Sao, A.K. Voiced/nonvoiced detection in compressively sensed speech signals. Speech Commun. 2015, 72, 194–207. [Google Scholar] [CrossRef]
  10. Do, T.T.; Chen, Y.; Nguyen, D.T.; Nguyen, N.; Gan, L.; Tran, T.D. Distributed compressed video sensing. In Proceedings of the 16th IEEE International Conference on Image Processing, Cairo, Egypt, 7–10 November 2009; pp. 1393–1396. [Google Scholar] [CrossRef] [Green Version]
  11. Schiffner, M.F.; Schmitz, G. Ultrafast image acquisition in pulse-echo ultrasound imaging using compressed sensing. In Proceedings of the IEEE International Ultrasonics Symposium (IUS), Tours, France, 18–21 September 2016; pp. 1–3. [Google Scholar] [CrossRef]
  12. Liebgott, H.; Prost, R.; Friboulet, D. Pre-beamformed RF signal reconstruction in medical ultrasound using compressive sensing. Ultrasonics 2013, 53, 525–533. [Google Scholar] [CrossRef]
  13. Chernyakova, T.; Eldar, Y.C. Fourier-domain beamforming: The path to compressed ultrasound imaging. IEEE Trans. Ultrason. Ferroelectr. Freq. Control 2014, 61, 1252–1267. [Google Scholar] [CrossRef] [Green Version]
  14. Lustig, M.; Donoho, D.; Pauly, J.M. Sparse MRI: The application of compressed sensing for rapid MR imaging. Magn. Reson. Med. 2007, 58, 1182–1195. [Google Scholar] [CrossRef] [PubMed]
  15. Nguyen, M.M.; Mung, J.; Yen, J.T. Fresnel-based beamforming for low-cost portable ultrasound. IEEE Trans. Ultrason. Ferroelectr. Freq. Control 2011, 58, 112–121. [Google Scholar] [CrossRef]
  16. Hiller, S.; Fiorito, F.; Wüthrich, K.; Wider, G. Automated projection spectroscopy (APSY). Natl. Acad. Sci. USA 2005, 102, 10876–10881. [Google Scholar]
  17. Gołowicz, D.; Kasprzak, P.; Kazimierczuk, K. Enhancing compression level for more efficient compressed sensing and other lessons from NMR spectroscopy. Sensors 2020, 20, 1325. [Google Scholar]
  18. Shim, J.; Hur, D.; Kim, H. Spectral analysis framework for compressed sensing ultrasound signals. J. Med. Ultrason. 2019, 46, 367–375. [Google Scholar] [CrossRef]
  19. Fink, M.; Hottier, F.; Cardoso, J.F. Ultrasonic signal processing for in vivo attenuation measurement: Short time Fourier analysis. Ultrason. Imaging 1983, 5, 117–135. [Google Scholar] [CrossRef]
  20. Knuth, D.E. Postscript about NP-hard problems. ACM SIGACT News 1974, 6, 15–16. [Google Scholar] [CrossRef]
  21. Candès, E.J.; Recht, B. Exact matrix completion via convex optimization. Found. Comput. Math. 2009, 9, 717–772. [Google Scholar] [CrossRef] [Green Version]
  22. Candes, E.J.; Wakin, M.B. An introduction to compressive sampling. IEEE Signal Process. Mag. 2008, 25, 21–30. [Google Scholar] [CrossRef]
  23. Techavipoo, U.; Varghese, T.; Chen, Q.; Stiles, T.A.; Zagzebski, J.A.; Frank, G.R. Temperature dependence of ultrasonic propagation speed and attenuation in excised canine liver tissue measured using transmitted and reflected pulses. J. Acoust. Soc. Am. 2004, 115, 2859–2865. [Google Scholar] [CrossRef] [Green Version]
  24. Levy, Y.; Agnon, Y.; Azhari, H. Measurement of speed of sound dispersion in soft tissues using a double frequency continuous wave method. Ultrasound Med. Biol. 2006, 32, 1065–1071. [Google Scholar] [CrossRef] [PubMed]
  25. Wear, K.A.; Stiles, T.A.; Frank, G.R.; Madsen, E.L.; Cheng, F.; Feleppa, E.J.; Hall, C.S.; Kim, B.S.; Lee, P.; O’Brien, W.D.; et al. Interlaboratory comparison of ultrasonic backscatter coefficient measurements from 2 to 9 MHz. J. Ultrasound Med. 2005, 24, 1235–1250. [Google Scholar] [CrossRef] [PubMed]
  26. Taggart, L.R.; Baddour, R.E.; Giles, A.; Czarnota, G.J.; Kolios, M.C. Ultrasonic characterization of whole cells and isolated nuclei. Ultrasound Med. Biol. 2007, 33, 389–401. [Google Scholar] [CrossRef]
  27. Liu, W.; Zagzebski, J.A.; Varghese, T.; Gerig, A.L.; Hall, T.J. Spectral and scatterer-size correlation during angular compounding: Simulations and experimental studies. Ultrason. Imaging 2006, 28, 230–244. [Google Scholar] [CrossRef] [PubMed]
  28. Kim, H.; Varghese, T. Attenuation estimation using spectral cross-correlation. IEEE Trans. Ultrason. Ferroelectr. Freq. Control 2007, 54, 510–519. [Google Scholar] [CrossRef] [PubMed]
  29. Kim, H.; Varghese, T. Hybrid spectral domain method for attenuation slope estimation. Ultrasound Med. Biol. 2008, 34, 1808–1819. [Google Scholar] [CrossRef]
  30. Wear, K.A. A Gaussian framework for modeling effects of frequency-dependent attenuation, frequency-dependent scattering, and gating. IEEE Trans. Ultrason. 2002, 49, 1572–1582. [Google Scholar] [CrossRef]
  31. Fink, M.A.; Cardoso, J. Diffraction effects in pulse-echo measurement. IEEE Trans. Ultrason. 1984, 31, 313–329. [Google Scholar] [CrossRef]
  32. Mohana Shankar, P. A general statistical model for ultrasonic backscattering from tissues. IEEE Trans. Ultrason. Ferroelectr. Freq. Control 2000, 47, 727–736. [Google Scholar] [CrossRef]
  33. Kuc, R. Bounds on estimating the acoustic attenuation of small tissue regions from reflected ultrasound. Proc. IEEE 1985, 73, 1159–1168. [Google Scholar] [CrossRef]
  34. Flax, S.W.; Pelc, N.J.; Glover, G.H.; Gutmann, F.D.; McLachlan, M. Spectral characterization and attenuation measurements in ultrasound. Ultrason. Imag. 1983, 5, 95–116. [Google Scholar] [CrossRef] [PubMed]
  35. Bridge, C.P. Introduction to the Monogenic Signal. arXiv 2017, arXiv:1703.09199. [Google Scholar]
  36. Marple, S.L. Computing the discrete-time “analytic” signal via FFT. In Proceedings of the Conference Record of the Thirty-First Asilomar Conference on Signals, Systems and Computers, Pacific Grove, CA, USA, 2–5 November 1997; pp. 1322–1325. [Google Scholar] [CrossRef]
  37. Chen, S.S.; Donoho, D.L.; Saunders, M.A. Atomic Decomposition by Basis Pursuit. SIAM Rev. 2001, 43, 129–159. [Google Scholar] [CrossRef] [Green Version]
  38. Li, Y.; Zagzebski, J.A. A frequency domain model for generating b-mode images with array transducers. IEEE Trans. Ultrason. Ferroelectr. Freq. Control 1999, 46, 690–699. [Google Scholar] [CrossRef]
  39. Sassaroli, E.; Crake, C.; Scorza, A.; Kim, D.S.; Park, M.A. Image quality evaluation of ultrasound imaging systems: Advanced B-modes. J. Appl. Clin. Med. Phys. 2019, 20, 115–124. [Google Scholar] [CrossRef]
  40. Kundu, S.; Kolouri, S.; Erickson, K.I.; Kramer, A.F.; McAuley, E.; Rohde, G.K. Discovery and visualization of structural biomarkers from MRI using transport-based morphometry. NeuroImage 2018, 167, 256–275. [Google Scholar] [CrossRef] [PubMed] [Green Version]
Figure 1. Frequency spectra of (a) an original time-varying signal, (b) the Hilbert transform of the original signal, and (c) the analytic form of the original signal.
Applsci 10 06956 g001
Figure 2. Summary of the framework for temporal and spectral analysis of compressed sensing data. The blue dotted line illustrates the traditional approach, while the red solid line depicts the approach devised in this study.
Applsci 10 06956 g002
Figure 3. B-mode images of tissue-mimicking phantoms (TM) phantoms used in simulation (with region of interest (ROI) highlighted in red). (a) p12 sample phantom. Backscatterer intensity in cylindrical inclusion is 12 dB higher than the background. (b) m12 sample phantom. Backscatterer intensity in cylindrical inclusion is 12 dB lower than the background. (c) Reference phantom with uniform backscatterer intensity and attenuation coefficient of 0.3 dB/cm/MHz. (d) Reference phantom with uniform backscatterer intensity and attenuation coefficient of 0.7 dB/cm/MHz.
Applsci 10 06956 g003
Figure 4. Comparison of K-sparsity of an original signal processed using the discrete Fourier transform (DFT) and discrete cosine transform (DCT) basis matrices.
Applsci 10 06956 g004
Figure 5. Results of time-domain analysis of compressed sensing (CS) data using the DCT basis matrix: (a) Envelope detection for the original signal propagating through the p12 phantom, using the traditional and proposed frameworks for CS data. (b) Magnified view of section highlighted in 6(a).
Applsci 10 06956 g005
Figure 6. Results of B-mode pixel values of the original data and the reconstructed CS data using traditional and the proposed methods for three contrast TM phantoms of the 70% compression.
Applsci 10 06956 g006
Figure 7. Results of spectral analysis of signal propagation through the p12 phantom: (a) Estimated variation of centroid with depth before (blue dotted line), and after (red solid line) DC. (b) Estimated attenuation coefficients.
Applsci 10 06956 g007
Figure 8. Results of spectral analysis of signal propagation through the m12 phantom: (a) Estimated variation of centroid with depth before (blue dotted line), and after (red solid line) DC. (b) Estimated attenuation coefficients.
Applsci 10 06956 g008
Figure 9. Representative Q-mode image combining B-mode image of TM phantoms with an attenuation map.
Applsci 10 06956 g009
Table 1. Normalized root mean square error (RMSE) of results of envelope detection.
50%60%70%80%90%
DFTTraditional0.6250.7180.8360.941
Proposed0.630.730.8390.9461
DCTTraditional0.1970.4110.6120.8250.982
Proposed0.1560.366 0.545 0.778 0.955
Table 2. Normalized RMSE of attenuation coefficient estimates.
50%60%70%80%90%
Traditional0.5820.5930.6550.8041
Proposed0.1080.2540.464 0.714 0.914