1. Introduction
Two-phase combustion flows play extremely important roles in the aircraft propulsion [
1,
2], power [
3], petroleum [
4,
5], and chemical [
6,
7] industries. In particular, aerated liquid sprays have been shown to effectively shatter the fuel jet or sheet into ligaments and then droplets for propulsion applications [
8,
9]. Additionally, it has been shown that the liquid aeration technique can generate a spray that penetrates deeply into high-speed crossflows and produces favorable plume/droplet properties, such as a high-concentration of smaller droplets distributed over a larger plume cross section [
10,
11]. Aerated nozzles such as those studied in [
8,
9,
10,
11] typically introduce air into the liquid stream through interior injectors upstream of the nozzle exit. Another type of aerating spray nozzle is the air-assisted atomizer; in this design, the liquid injector is surrounded by an annular air chamber, with the liquid injector terminating before the nozzle exit where the liquid stream is joined by the expelled high-speed air flowing from the chamber to promote liquid structure break-up. Nebulizers are a third type of aerating spray nozzle. The nebulizer design principle is similar to the air-assisted atomizer type, except that the co-flowing air combines with the liquid stream right at the exit as both fluids are expelled, rather than internally prior to exiting the nozzle. The resulting liquid spray is well-distributed and reliably consistent. Air-assisted atomizers and nebulizers have been utilized in the study of mixed spray flames [
12,
13,
14,
15].
While initial studies of applicable spray nozzle designs for fuel injection may be conducted with a commonly available test liquid (e.g., water), qualitative and quantitative characterizations are needed for practical fuels. Aviation fuels such as Jet A must be characterized individually, since the fuel properties of surface tensions and evaporation rates are dramatically different from water, ethanol, and transportation fuels [
16]. The use of actual fuel injectors or custom atomizing nozzles for spray combustion analysis under practical conditions may not be feasible without appropriate test rigs. Laboratory-grade two-phase flow systems with well-defined characteristics of air/liquid flow rates and dimensions can provide benchmark data of two-phase flows and flames. In this work, a commercially available nebulizer from Meinhard designed for benchtop chemical experimentation is utilized for combusting spray diagnostic applications. The Meinhard nebulizer is similar to the model used in [
15] but is of different geometry. This work presents an initial characterization of the Meinhard nozzle’s spray under variable fuel–air mixture conditions controlled by alteration of the fluid flow rates. Ethanol and Jet A in cold-flowing and combusting conditions are the demonstration fuels.
Three optical diagnostic tools (shadowgraph, Mie scattering, and high-speed chemiluminescence imaging) are used to characterize the developed region of two-phase liquid ethanol and Jet A spray flames at atmospheric pressures. Shadowgraphy is a well-known line-of-sight diagnostic [
17] that has been used to measure liquid spray penetration depth, angle, spray area, and spray development upon wall impingement [
10,
18,
19,
20,
21]. Mie scattering from the interaction of laser light with liquid sprays has been utilized for quantitative measurements of the concentration of liquid droplets and soot particles in sprays. The droplets scatter light much more intensely than the gaseous material [
22,
23,
24]. This intense scattering is governed by Mie theory and measurement of the intensity yields quantified concentration and distribution data. Flame chemiluminescence provides information about flame structure and is applicable to ignited fuel sprays. Species can be quantified by the wavelength of chemiluminescent emissions, and the intensity of the emissions has been used to determine characteristics such as heat release rate, local equivalence ratio, spray evolution, and reaction zone visualization [
24,
25,
26,
27]. The resulting data from the application of these diagnostics to the Meinhard nozzle are intended to provide benchmark data for further exploration. The nozzle characterization presented here was performed in tandem with separate work involving development of a novel spray diagnostic, wherein the Meinhard nozzle was used as a testbed for an experimental application of neutron radiography to observing the optically dense spray zone [
28]; the results presented here are therefore anticipated to inform future work on spray combustion studies and further development of the neutron spray diagnostic under elevated pressure conditions more closely approximating practical systems.
The techniques applied in this work were chosen for their requirement of minimal equipment and setup time as well as their well-documented history of successful spray applications, however the difficulty of penetrating the optically dense region near the nozzle exit due to multiple light scattering limits their useful range to the developed (i.e., well-atomized) spray region further downstream. The focus of this work was therefore on the characterization of the developed spray and correlated aspects of its combustion. A study of the dense-spray region would be benefited by the use of Structured Laser Illumination Planar Imaging (SLIPI), developed by Berrocal et al. to solve the problem of multiple scattering [
29]. SLIPI is capable of providing high quality reconstructions of dense spray structures and liquid concentration via imaging of the spray by patterned laser sheets. SLIPI was not attempted for this work due to its equipment requirements, but a future application of SLIPI to the Meinhard nozzle could provide direct quantitative validation data for neutron radiographic analysis of the nozzle exit.
2. Experimental Setup
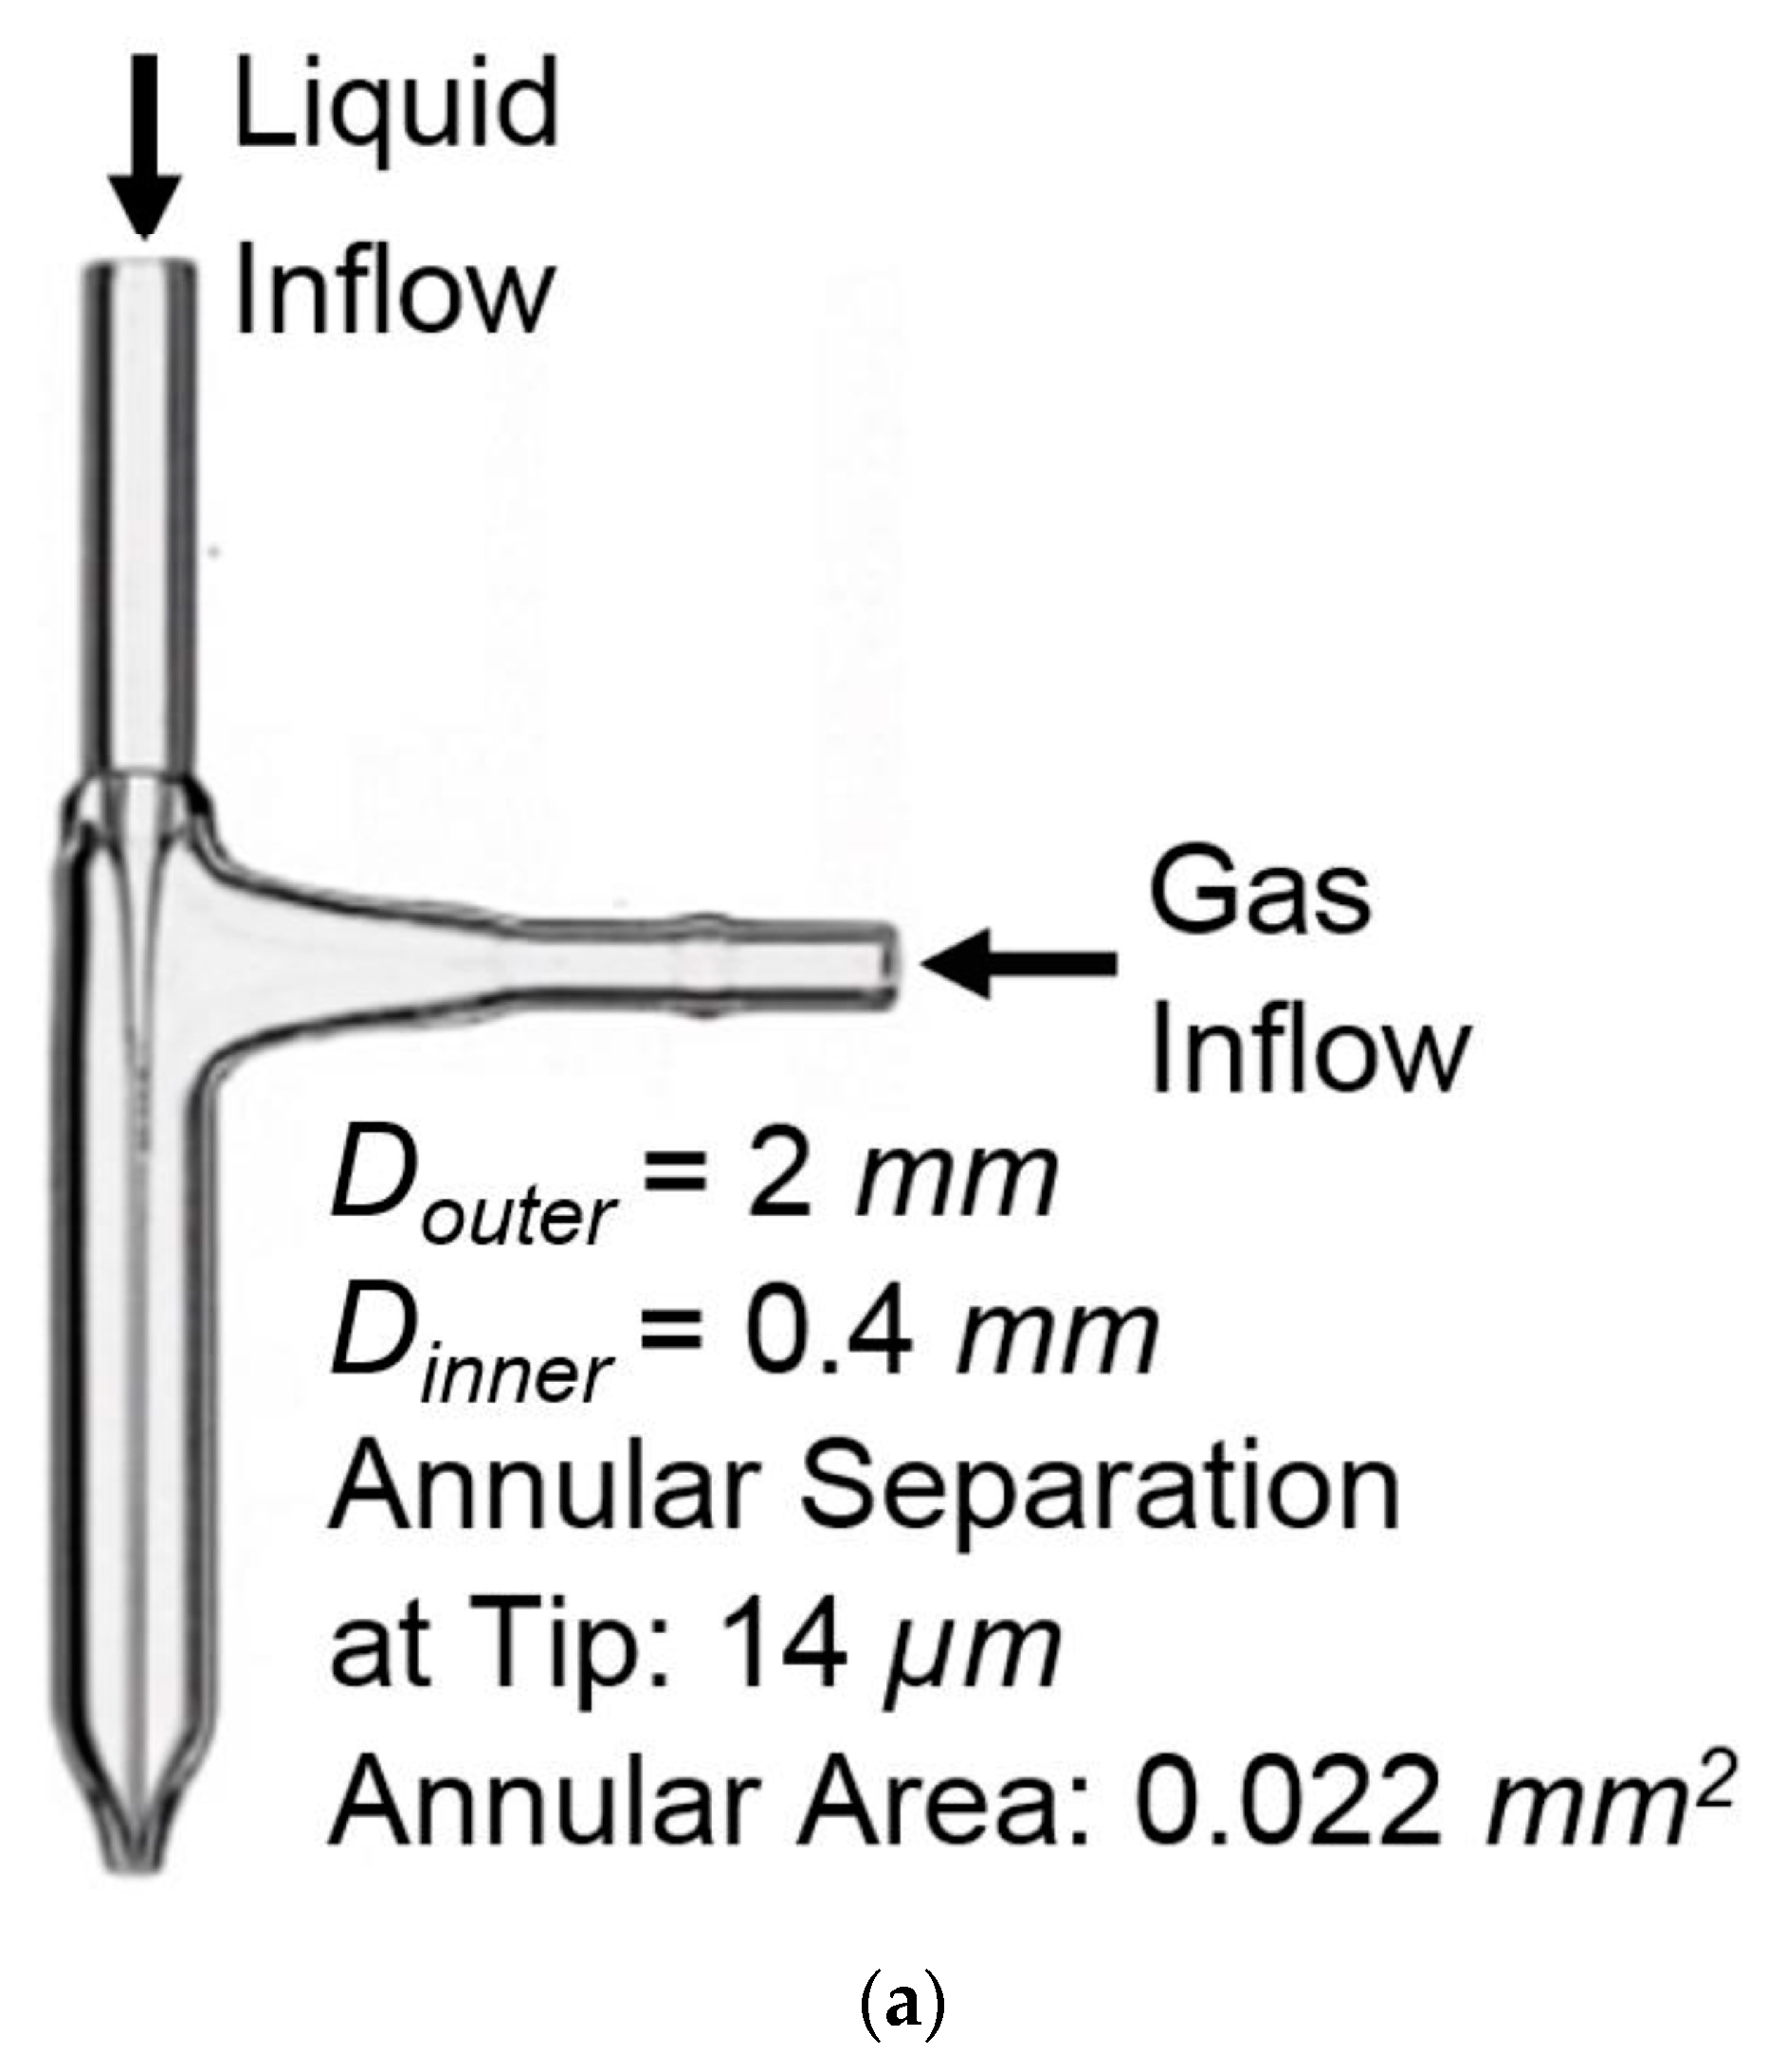
The experiments were performed on a borosilicate glass aerated nebulizer designed by Meinhard (part number TR-50-A0.5). The nebulizer had a liquid input capillary surrounded by an annular concentric tube for gas dispersion, converging to a 2 mm diameter nozzle with 0.4 mm capillary inner diameter, 14 µm annular separation at the nozzle, and 0.022 mm
2 annular area. Liquid fuel was released from the nozzle’s input capillary with oxygen co-flowing through the annular tube, resulting in a finely atomized spray of micro-scale droplets. An image of the nozzle is shown in
Figure 1a.
Ethanol was used for the initial nozzle characterization, and Jet A was used for a practical comparison. Liquid flow rates were controlled by an electronic syringe pump and oxidizer air flow rates were controlled by a flow controller; flow settings were established for equivalence ratios (denoted by φ) of 6.56, 7.55, 8.06, and 10.9 by leaving the air flow constant and changing the liquid flow rate. During the initial characterization of the nozzle, the ethanol flow rate was 4 mL/min and the oxygen flow rate was 0.4 L/min with input pressure of and exit pressure of = 114 kPa. The nozzle’s hydraulic diameter was = 28 µm and its Reynolds number was = 6400. When the spray was ignited, continued droplet vaporization and mixing with the room air caused self-sustaining combustion conditions to occur. The spray output was directed toward an outlet duct with a light suction force, which both exhausted the spray out of the room through a fume hood and helped to sustain its directional uniformity. The velocity of the air into the duct was not measured but the suction force was observed to be of a minimal degree, provided by the fume hood’s drawing of the room air through the duct.
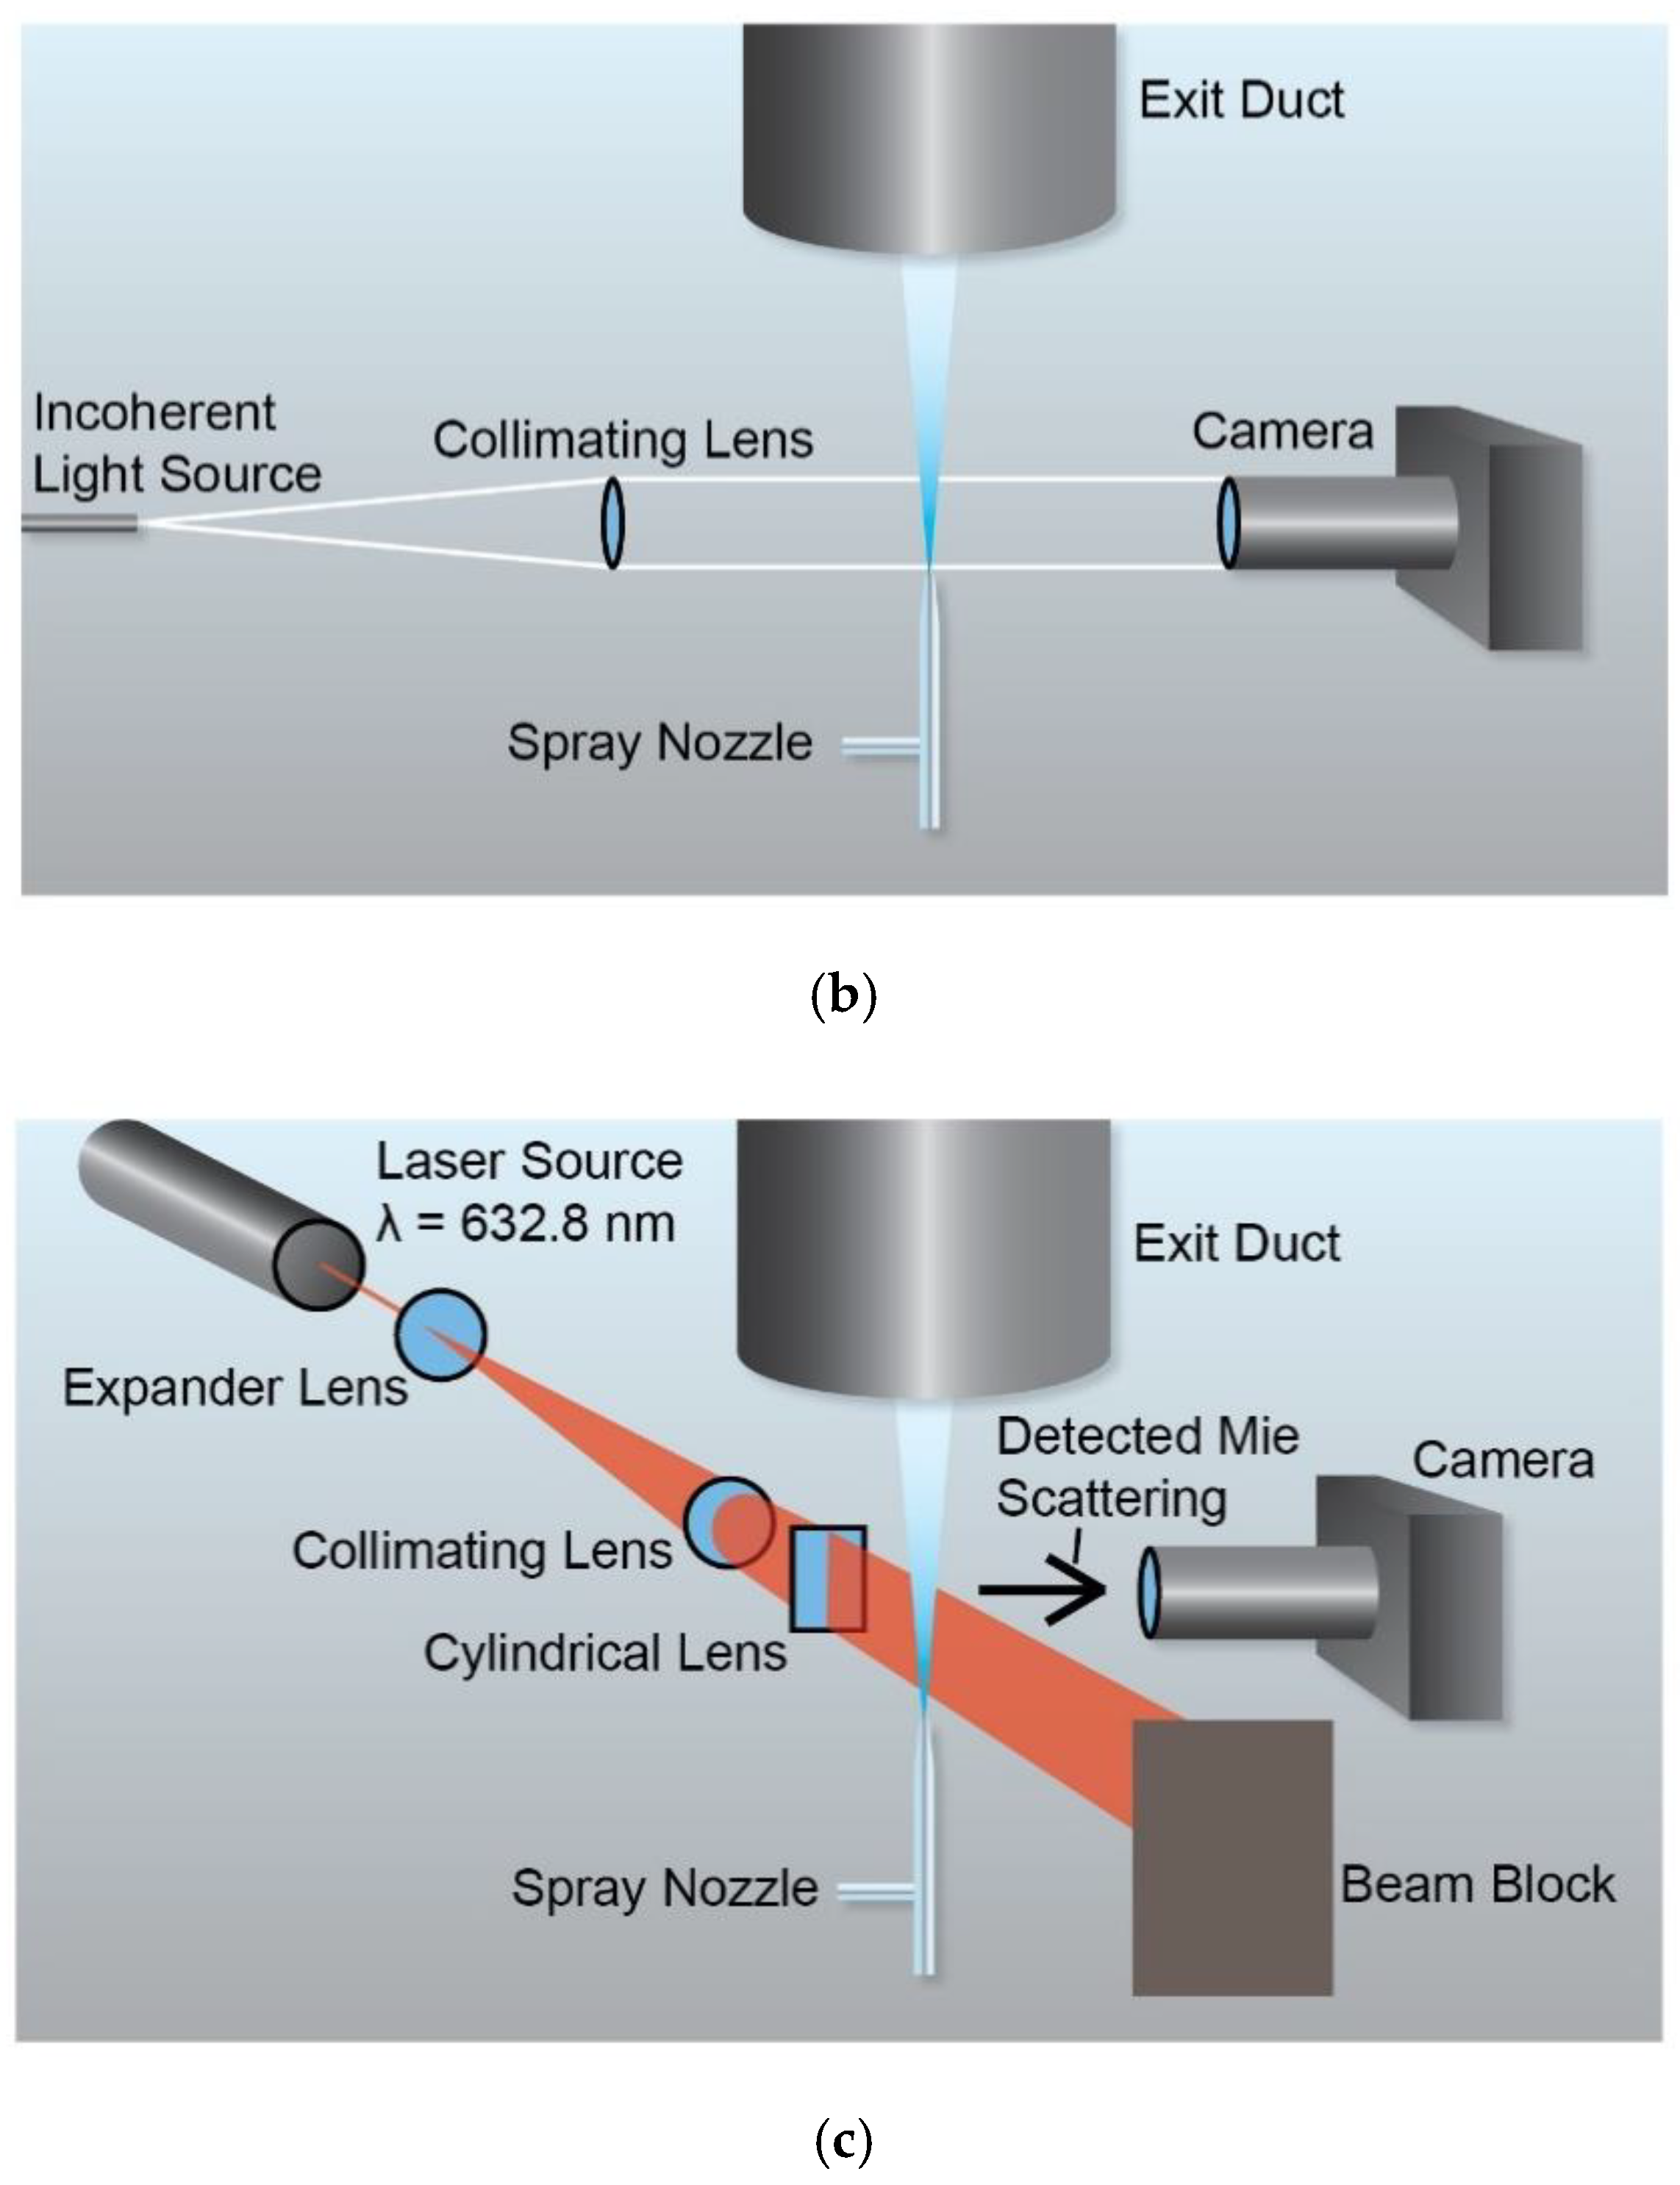
A time-gated, intensified CCD camera (Princeton Instruments PI-MAX4) with a 50 mm lens was used for shadowgraph imaging. The camera’s pixel array was 512 × 512. Shadowgraph experiments were performed with the spray nozzle tip placed in front of collimated white light and the shadows of the spray droplets projected directly into the camera lens. Images were collected sequentially with a gate width of 10 µs. A diagram of the shadowgraph setup is shown in
Figure 1b.
A Nikon DSLR camera with a 50 mm lens was used for imaging of Mie scattering and flame chemiluminescence of CH*, CO
2*, and C
2*. The light source for Mie scattering was a continuous He-Ne laser with a wavelength of 632.8 nm; the camera was fitted with a 632.8 nm line filter to eliminate background light. The laser beam was passed through the appropriate optics to be formed into a sheet which illuminated the spray, and the Mie scattering from the droplets was detected by the camera placed perpendicularly to the laser sheet. A diagram of the Mie scattering setup is shown in
Figure 1c. Chemiluminescence emissions of ignited sprays were detected by pointing the camera at the spray and imaging through a filter. The filters used were of 430, 450, and 513 nm wavelengths, appropriate for detecting the chemiluminescence emissions for CH*, CO
2*, and C
2*, respectively, and simultaneously removing other emissions.
3. Results and Discussion
Cold-flow images were taken with the fuels held at fixed liquid flow rates and under varied levels of oxygen flow (0.10 up to 0.5 L/min for ethanol and 1.0 L/min for Jet A) to provide a range of atomization levels. Since the cold-flow images were intended to provide a global observation of the nozzle’s atomizing behavior, the liquid flow settings were arbitrarily chosen based on their ability to produce visually distinguishable droplet atomization for the different gas flow settings, unlike the other data in this work wherein flow settings were established based on target equivalence ratios.
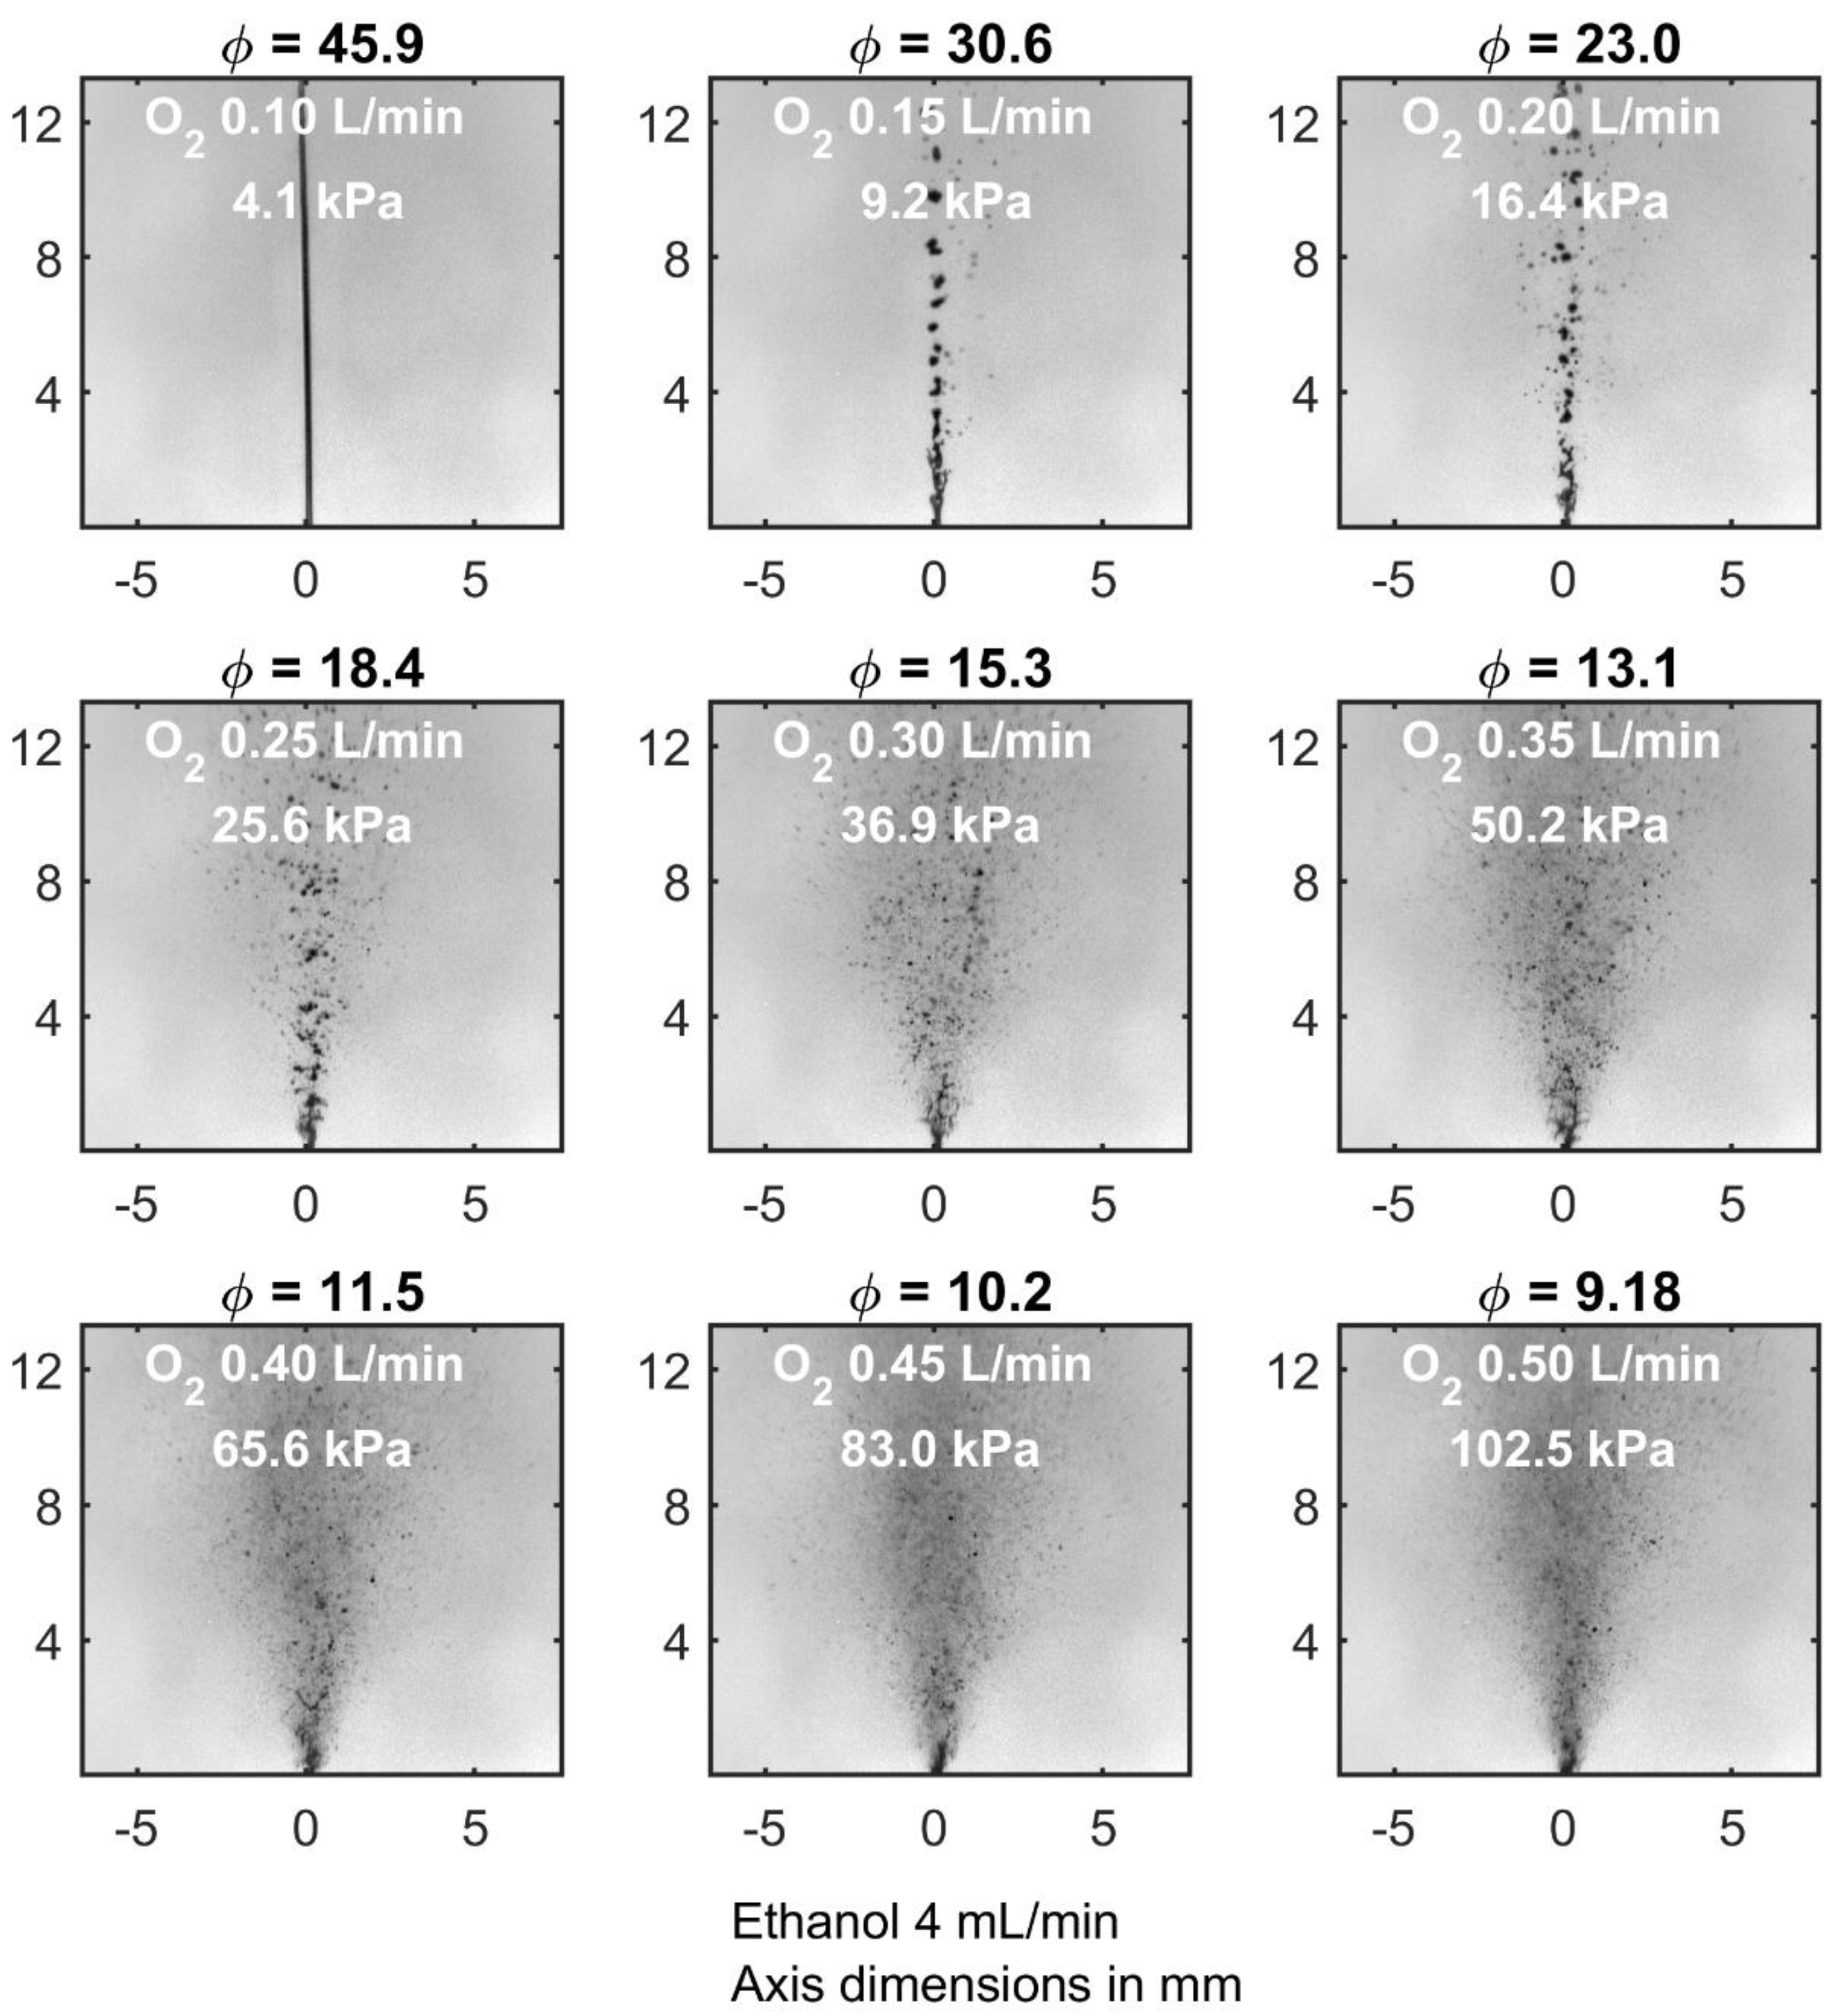
Figure 2 shows single-shot shadowgraph images of cold-flow ethanol sprays with the liquid flow rate fixed at 4 mL/min and varied gas flow rates. The equivalence ratios and dynamic pressures of the gas flow were both calculated and are presented. To preface discussion of the shadowgraph results, it should be noted that shadowgraphy does not provide truly quantitative droplet sizing due to its inability to distinguish depth along the axis of viewing, therefore causing potential merging in the visualization of multiple droplets which may have passed in front of one another. However, the images qualitatively demonstrate the effect of increasing gas flow rate (i.e., increasing dynamic pressure) on the spray angle and droplet break-up. Beginning with a continuous stream of liquid when the oxygen flow rate was limited to 0.10 L/min, the continuity of the stream began to break up when the oxygen flow rate was raised to 0.15 L/min, and liquid ligaments and elongated structures had disintegrated into smaller spheroidal droplets once the oxygen flow rate had reached 0.30 L/min. Continued increasing of the oxygen flow rate resulted in the droplet field becoming more finely atomized and its dispersion widening in angle near the nozzle exit. Once oxygen flow rate had reached 0.50 L/min the droplet field was relatively uniform in size and dispersion. Choking of the gas flow through the annular nozzle outlet is anticipated when the O
2 flow rate is raised above ~0.45–0.50 L/min, therefore further increase in the gas flow rate would not cause the dynamic pressure to rise any higher without changing the experimental conditions (i.e., using a different gas for air injection). Experimentation with higher gas flow rates than 0.50 L/min correlated to this assumption, as it did not demonstrate any notable effect on the spray dynamics.
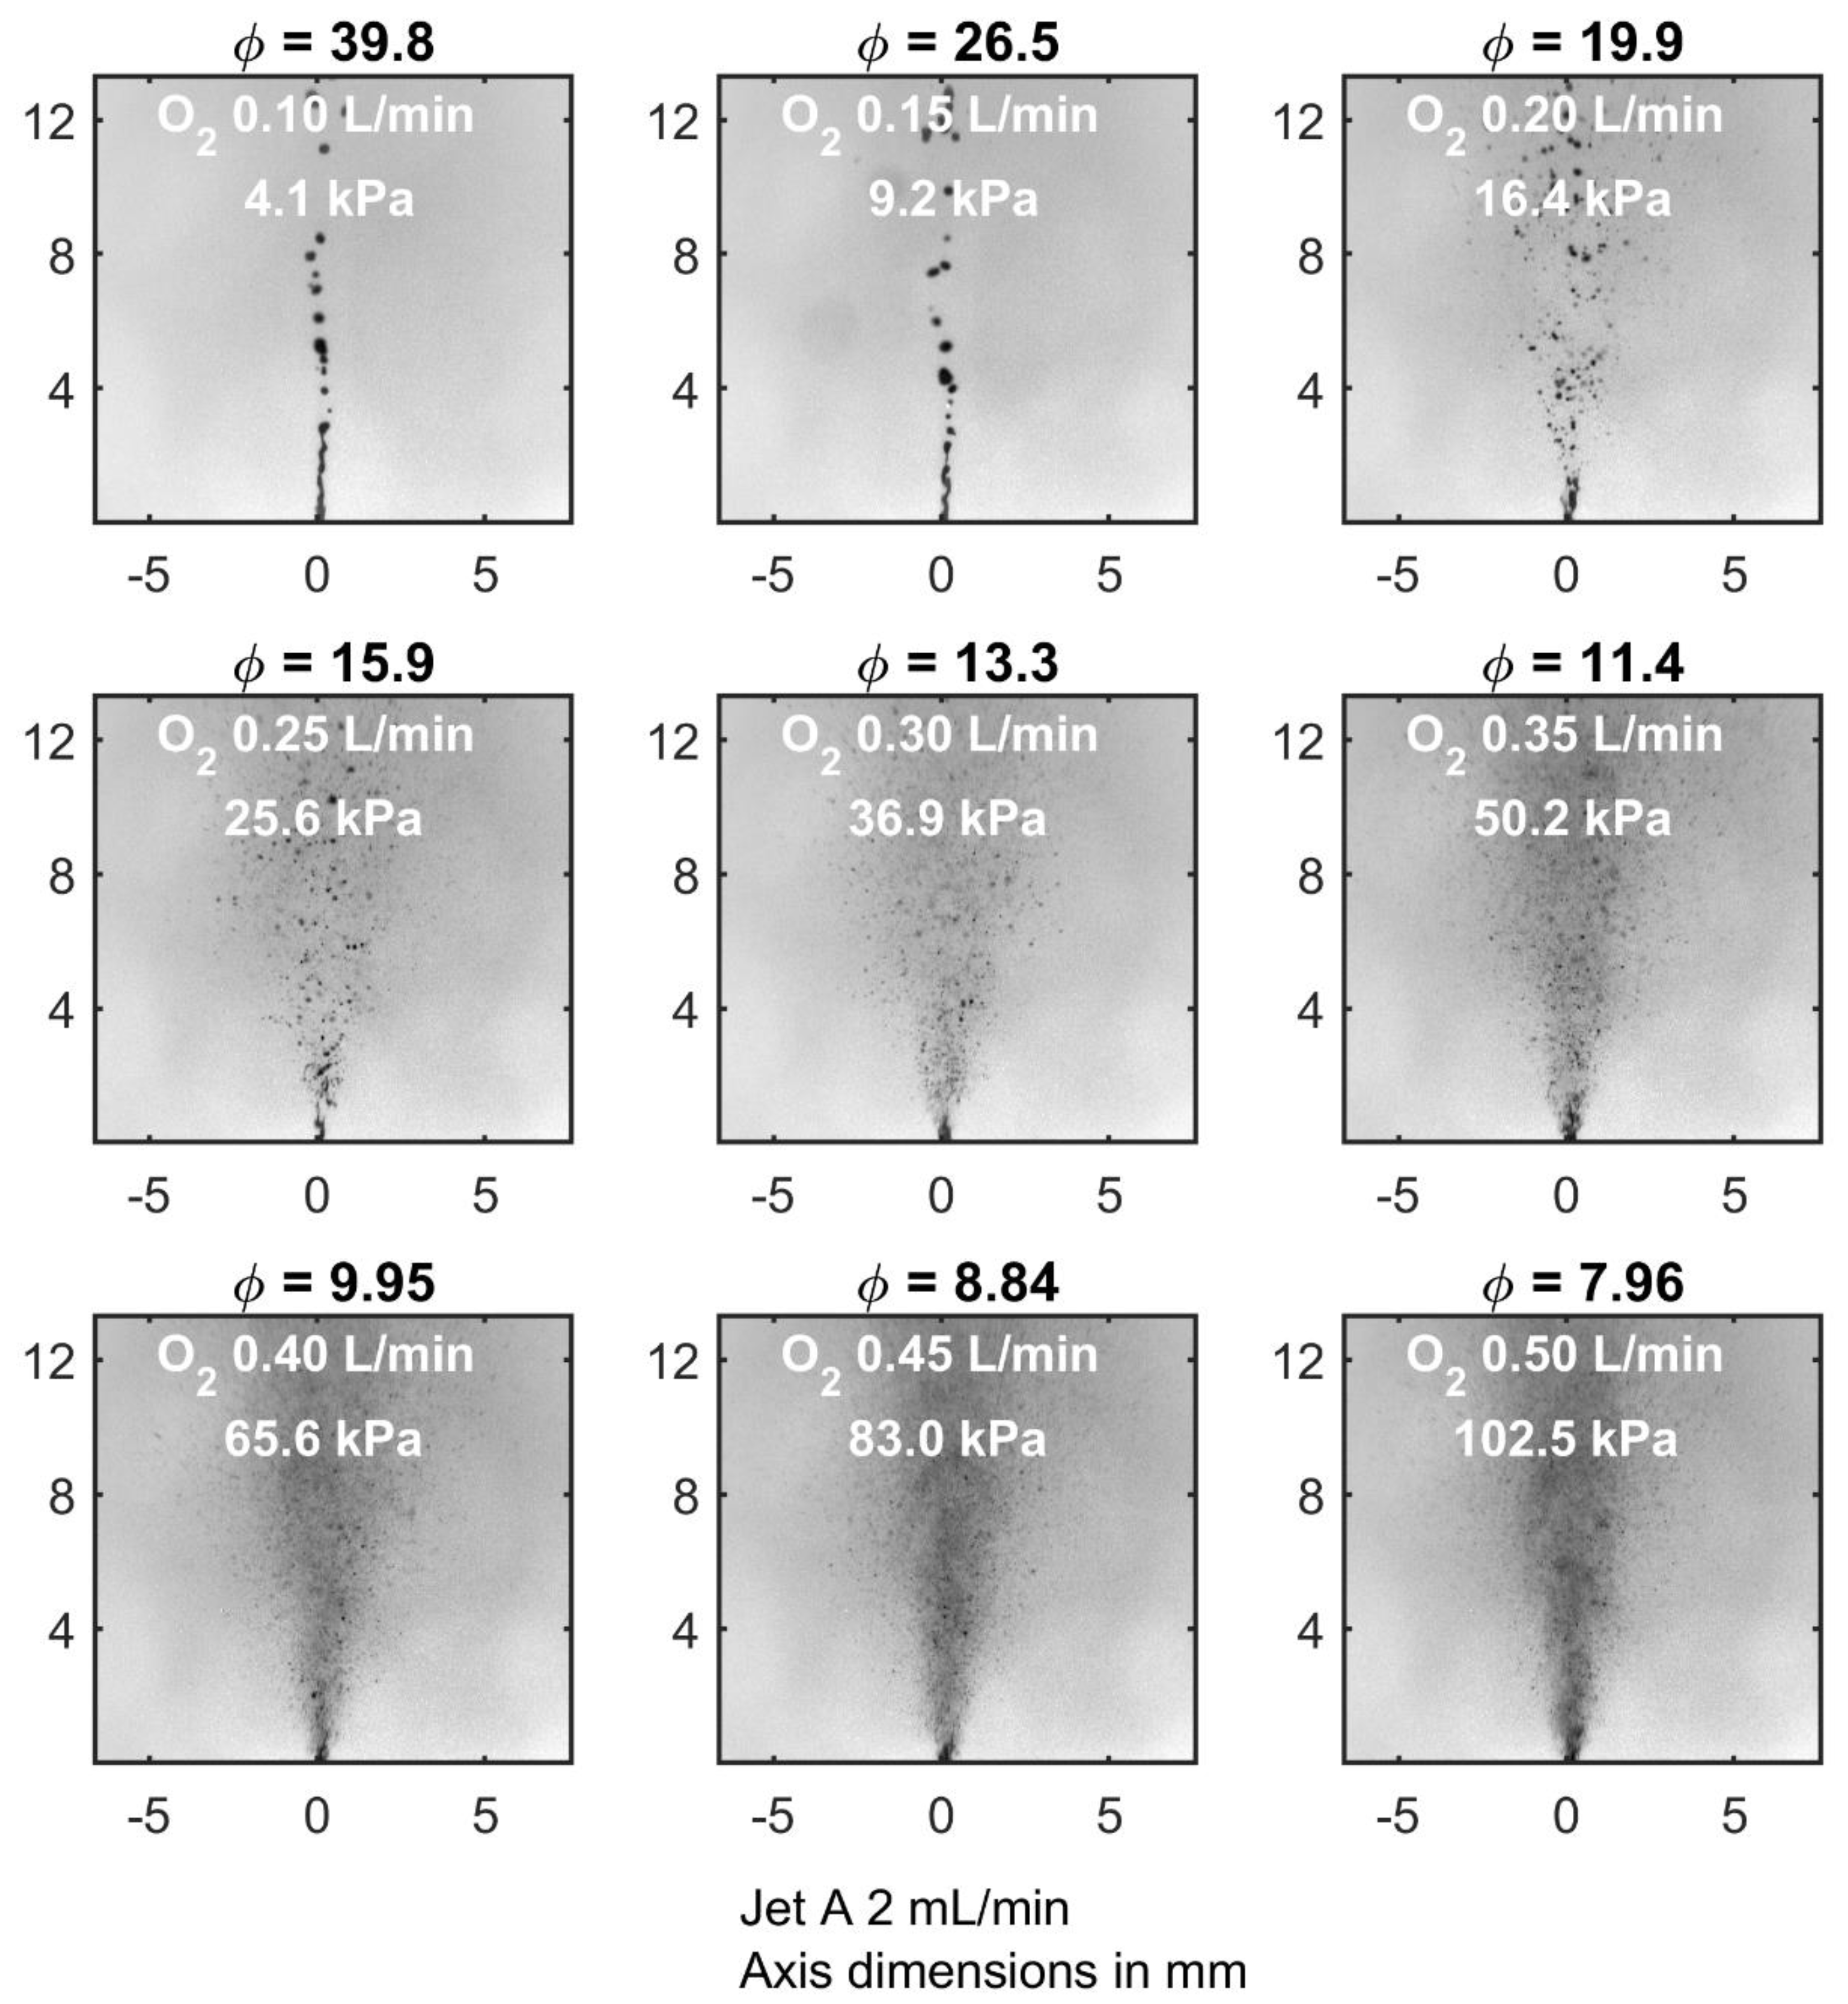
Single-shot shadowgraphs for Jet A sprays held at 2 mL/min liquid flow rate and with varied gas flow rates are shown in
Figure 3, with calculated equivalence ratios and gas dynamic pressures. The lower Jet A liquid flow rate than that of ethanol was chosen after preliminary observation indicated better similarity in flow behavior to ethanol at the various levels of oxygen input; therefore, the 2 mL/min liquid flow rate was anticipated to produce observable differences in atomization for the same range of oxygen levels. At an oxygen flow rate setting of 0.10 L/min, the liquid stream was already exhibiting break-up, though the liquid structures were still relatively large until the oxygen flow rate had been increased to 0.25 L/min. Droplet size and distribution qualitatively appeared to be the most uniform when oxygen was flowing at 0.40 L/min.
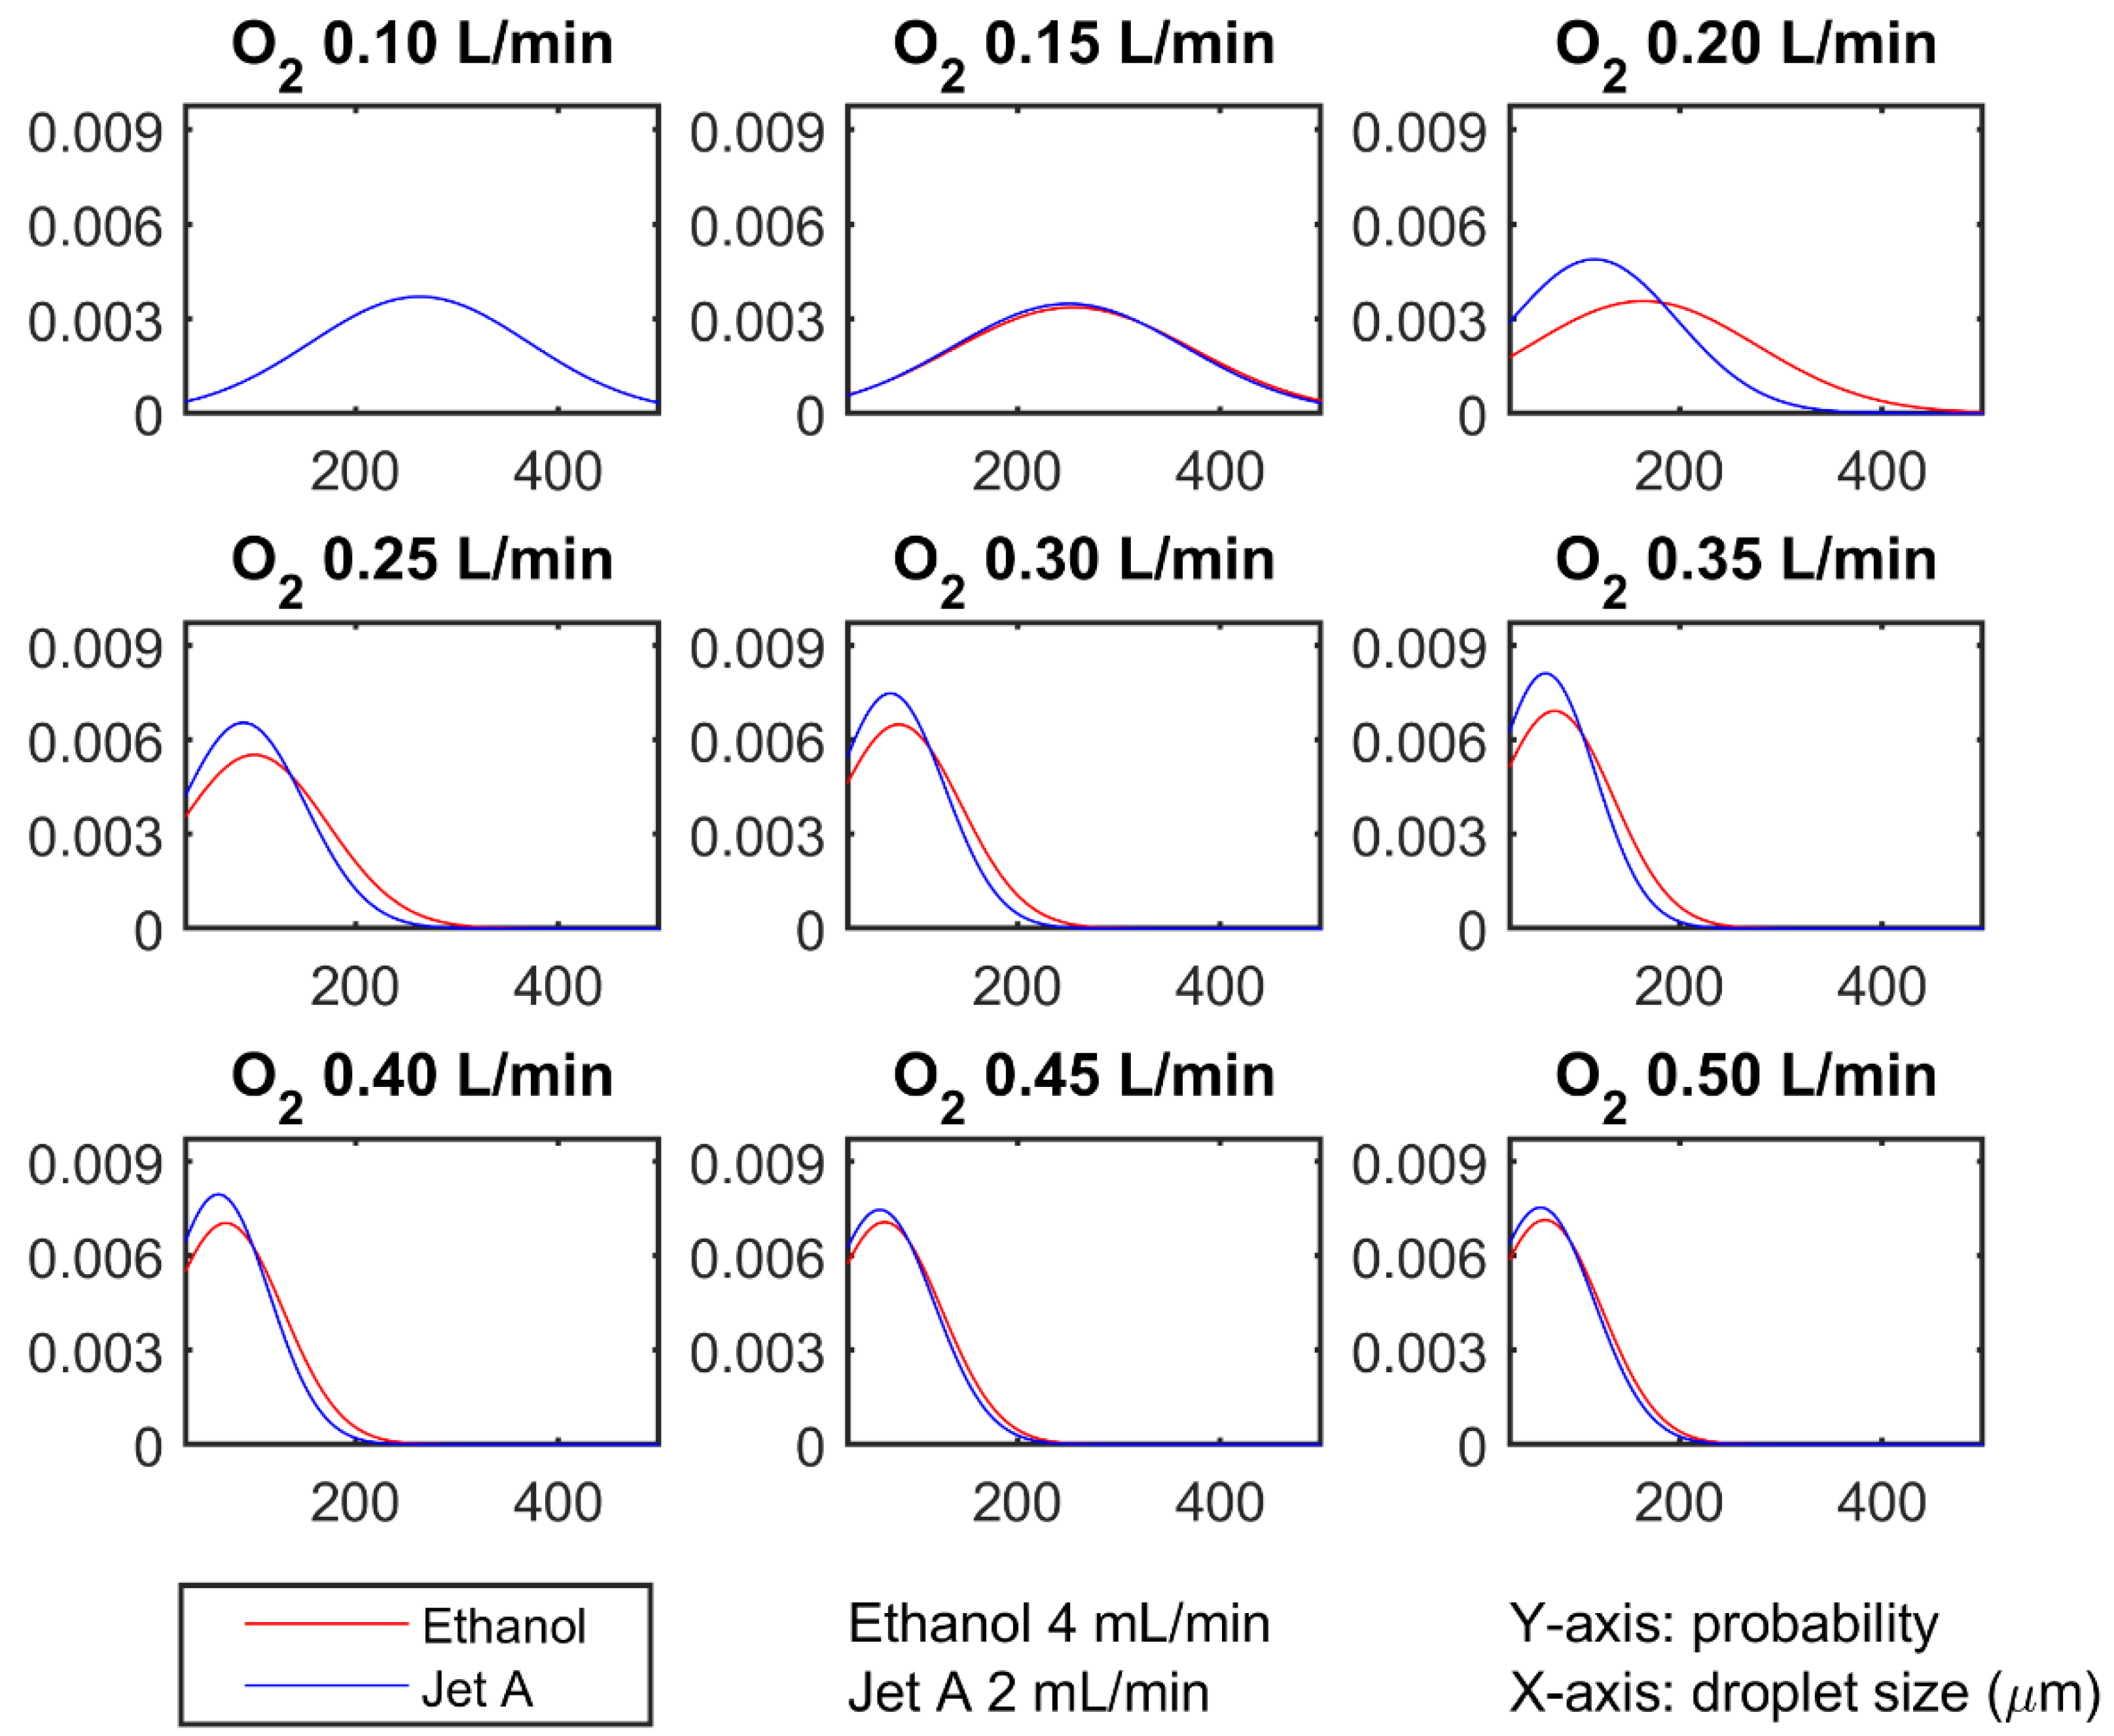
Though shadowgraphy does not provide quantitative droplet size information as noted at the beginning of this section, a simplified image contrast analysis was performed to obtain a general predicted droplet probability distribution by diameter for the shadowgraphs, shown in
Figure 4. The analysis was performed on 100-shot shadowgraph image sets in each case using particle detection commands in MATLAB, in which the images were reduced to binary black-and-white with 50% thresholding and particles greater than 500 µm were ignored. The MATLAB command for determining properties of image regions (regionprops) was used to detect particles in the 50% thresholded black-and-white images, and the particle data were then passed into the probability distribution function (pdf) command. The centroids and major axis lengths of standout objects (i.e., diameter of droplets and liquid ligaments which were of high contrast to the background and therefore preserved by the image thresholding) were automatically detected by the regionprops command and were used to estimate the number of particles for a given droplet diameter, and the detected particle data was then used to generate the probability distribution functions of particle size. The image thresholding caused the central region of the spray to appear as an amalgamated singular structure, but the well-resolved and relatively sparse droplets at the edge of the spray could be identified by the particle detection algorithm. Due to the magnification and the resolution of the camera’s 512 × 512 pixel array, droplet diameters below ~30 µm were not resolved, therefore the probability distributions should be interpreted as models of the droplet atomization rather than precision measures of it. The probability distributions predicted that the peak droplet distribution occurred near ~50 µm with the highest probabilities when the O
2 flow rate was 0.35 to 0.50 L/min. Although the probability distribution for the O
2 flow rate of 0.10 L/min was anomalous and is excluded from the plot since its shadowgraphs displayed a nearly uniform stream with no discernable droplet breakup for each of the 100 shots, the remaining probability distributions show a trend of increasingly smaller droplets in larger concentrations as the O
2 flow rate was increased. Similar to the ethanol spray, the Jet A spray droplet probability distribution exhibited increasing concentrations of decreasing droplet diameters as the O
2 flow rate was increased.
Further experiments were performed to characterize spray flames from the nebulizer. Equivalence ratios of 6.56, 7.55, 8.06, and 10.9 were used with constant oxygen flow rates in order to provide a range of fuel presence. The oxygen flow rate was set at 0.4 L/min for both fuels based on qualitative observation as well as the indications of sufficient droplet breakup from the probability distributions shown in
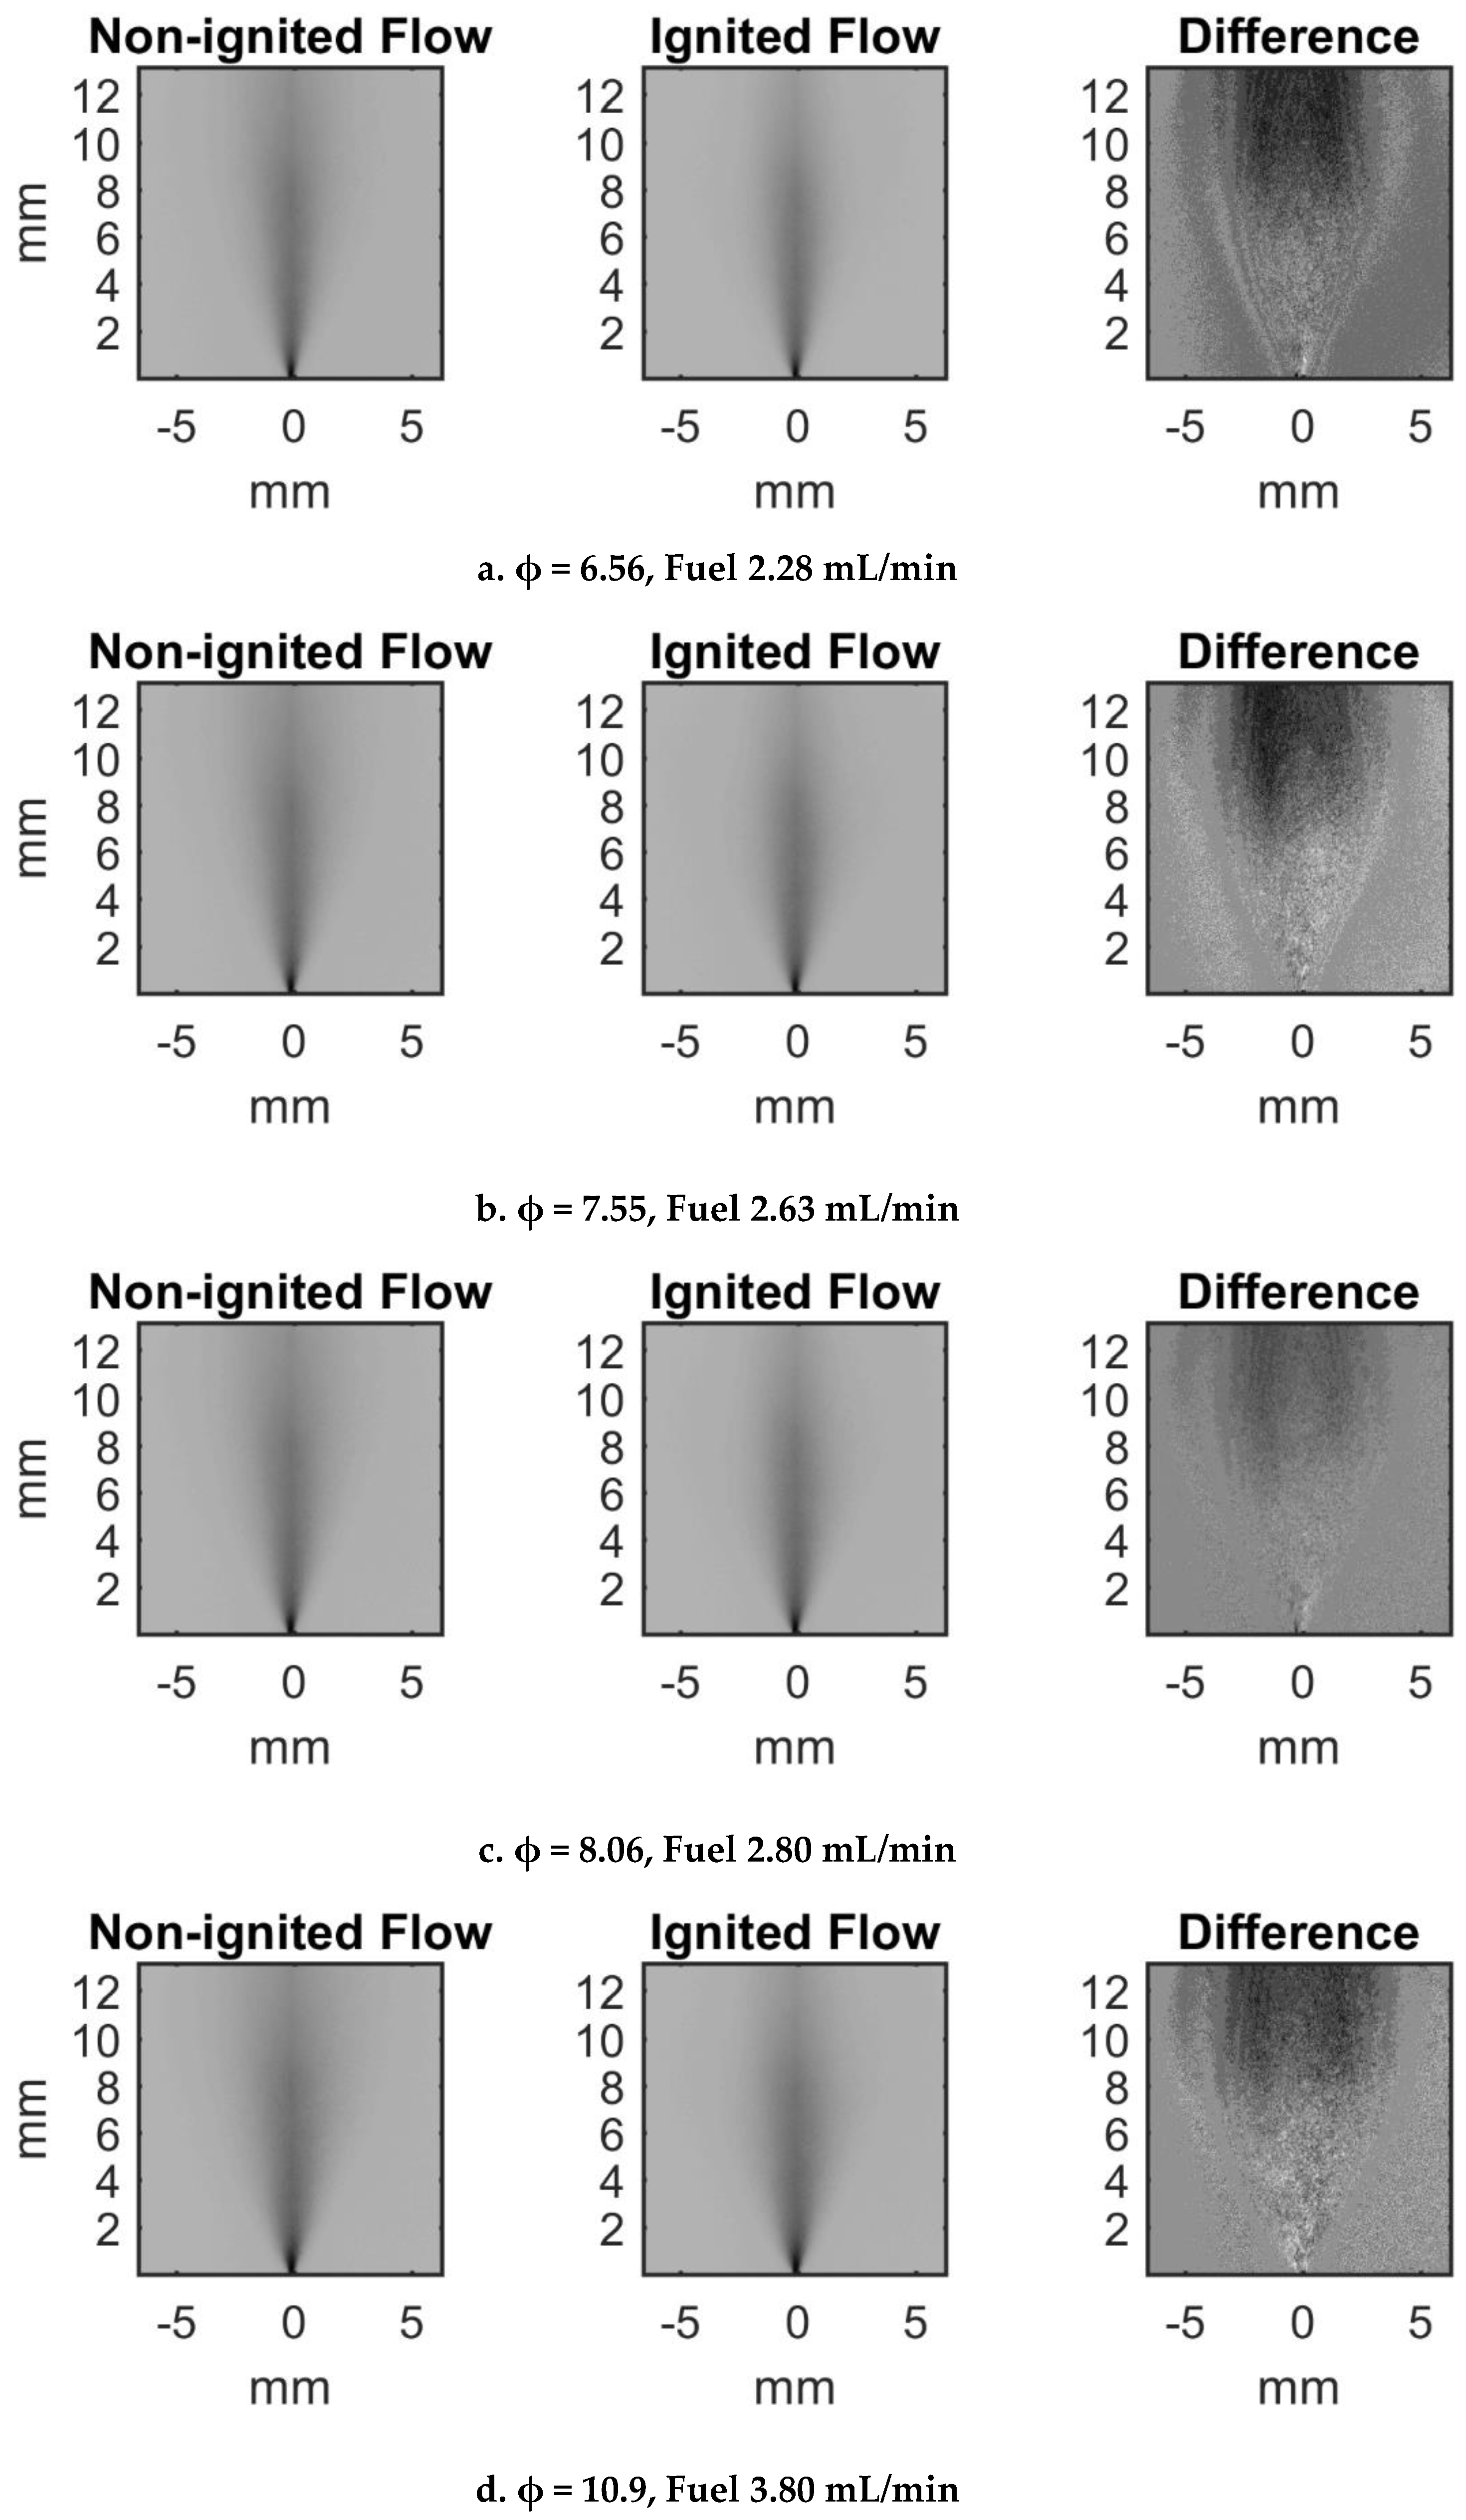
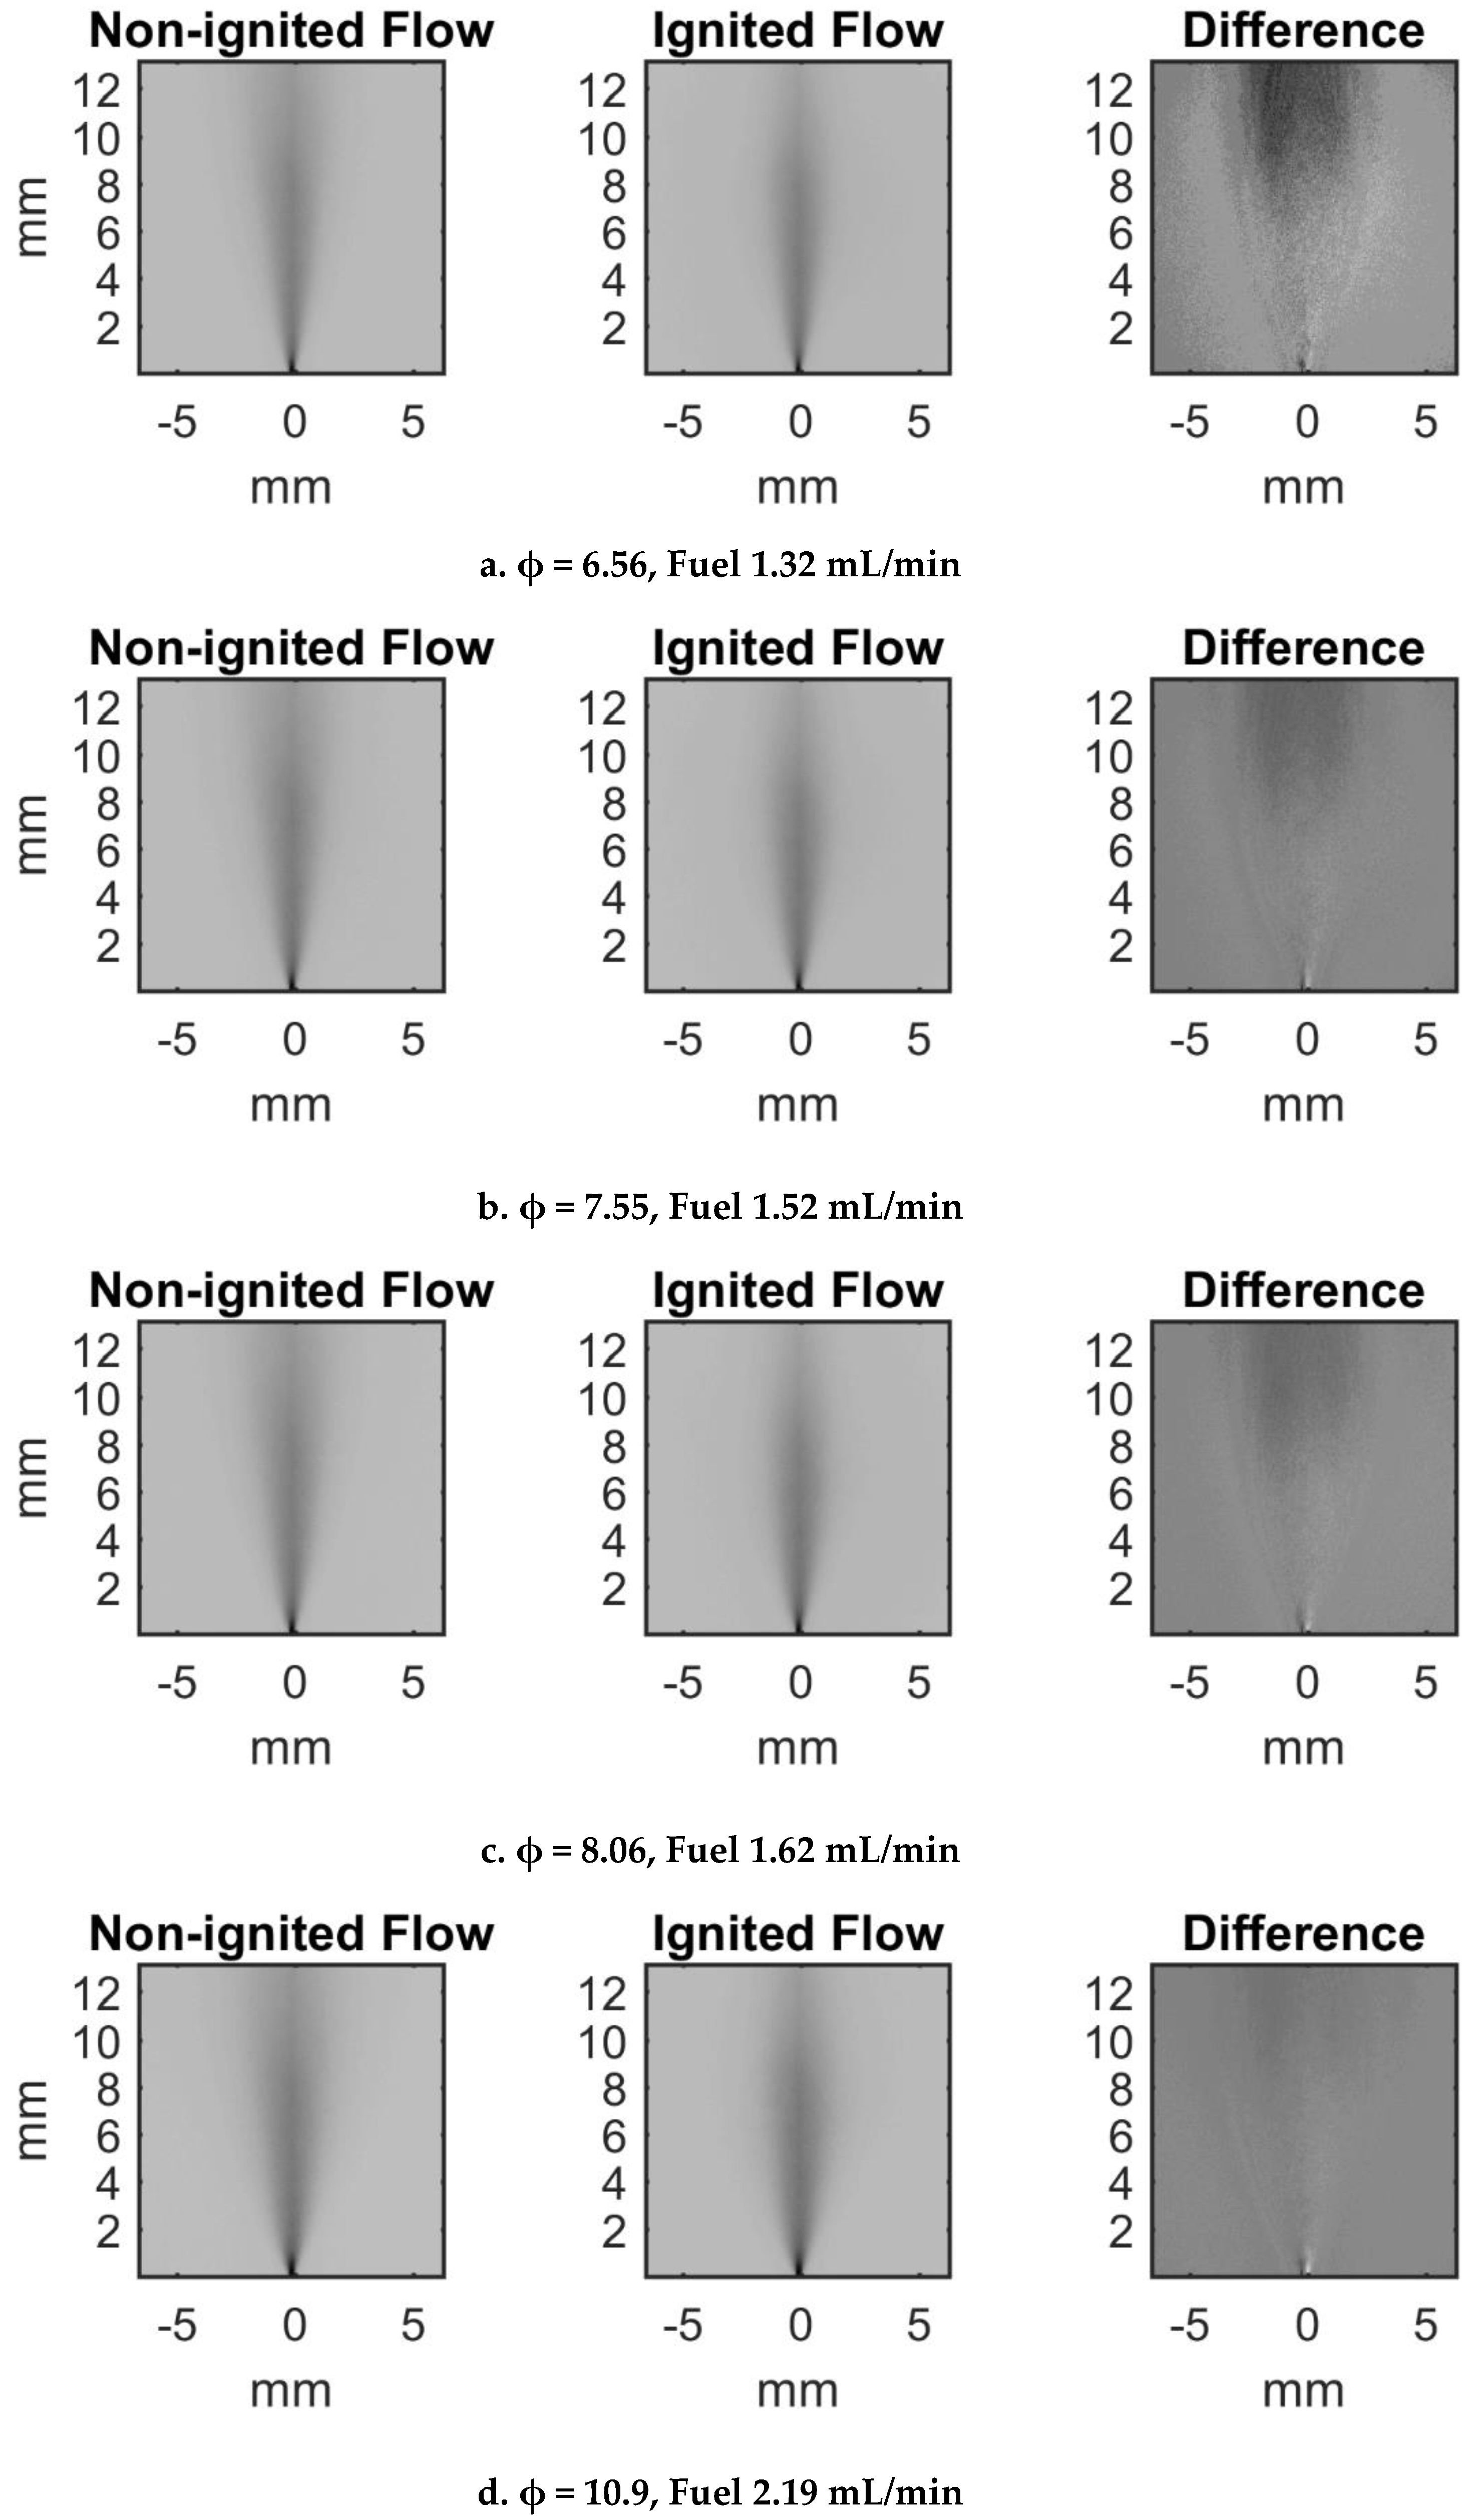
Figure 4, and the target equivalence ratios corresponded to liquid flow rates (in mL/min) of 2.28, 2.63, 2.80, and 3.80 for ethanol and for Jet A 1.32, 1.52, 1.62, and 2.19. These flow settings were arrived at from initial experimentation to determine optimum ignition stability for the setup. Shadowgraphs of cold- and ignited-flow ethanol sprays for four equivalence ratios are shown in
Figure 5. The images are 100-shot averages, with the ignited flow average image subtracted from the cold-flow image to obtain the estimated lifted flame height from the dark regions in the difference image. The flame appeared to begin ~6 mm above the nozzle exit in each case based on the difference images. The flame maintained a cylindrical shape, however the flame lift height above the nozzle was visually observed to be uneven, and this discrepancy was attributed to annular asymmetry of the gas co-flow due to a minor manufacturing error. Shadowgraphs of Jet A sprays under the same conditions are shown in
Figure 6. The flame height again appeared to begin ~6 mm above the nozzle exit. The similarity of the lifted flame height for both fuels across different equivalence ratios suggests that the nebulizer promotes flame stability; droplet evaporation may deliver reliable establishment of a prime mixture fraction for sustained combustion.
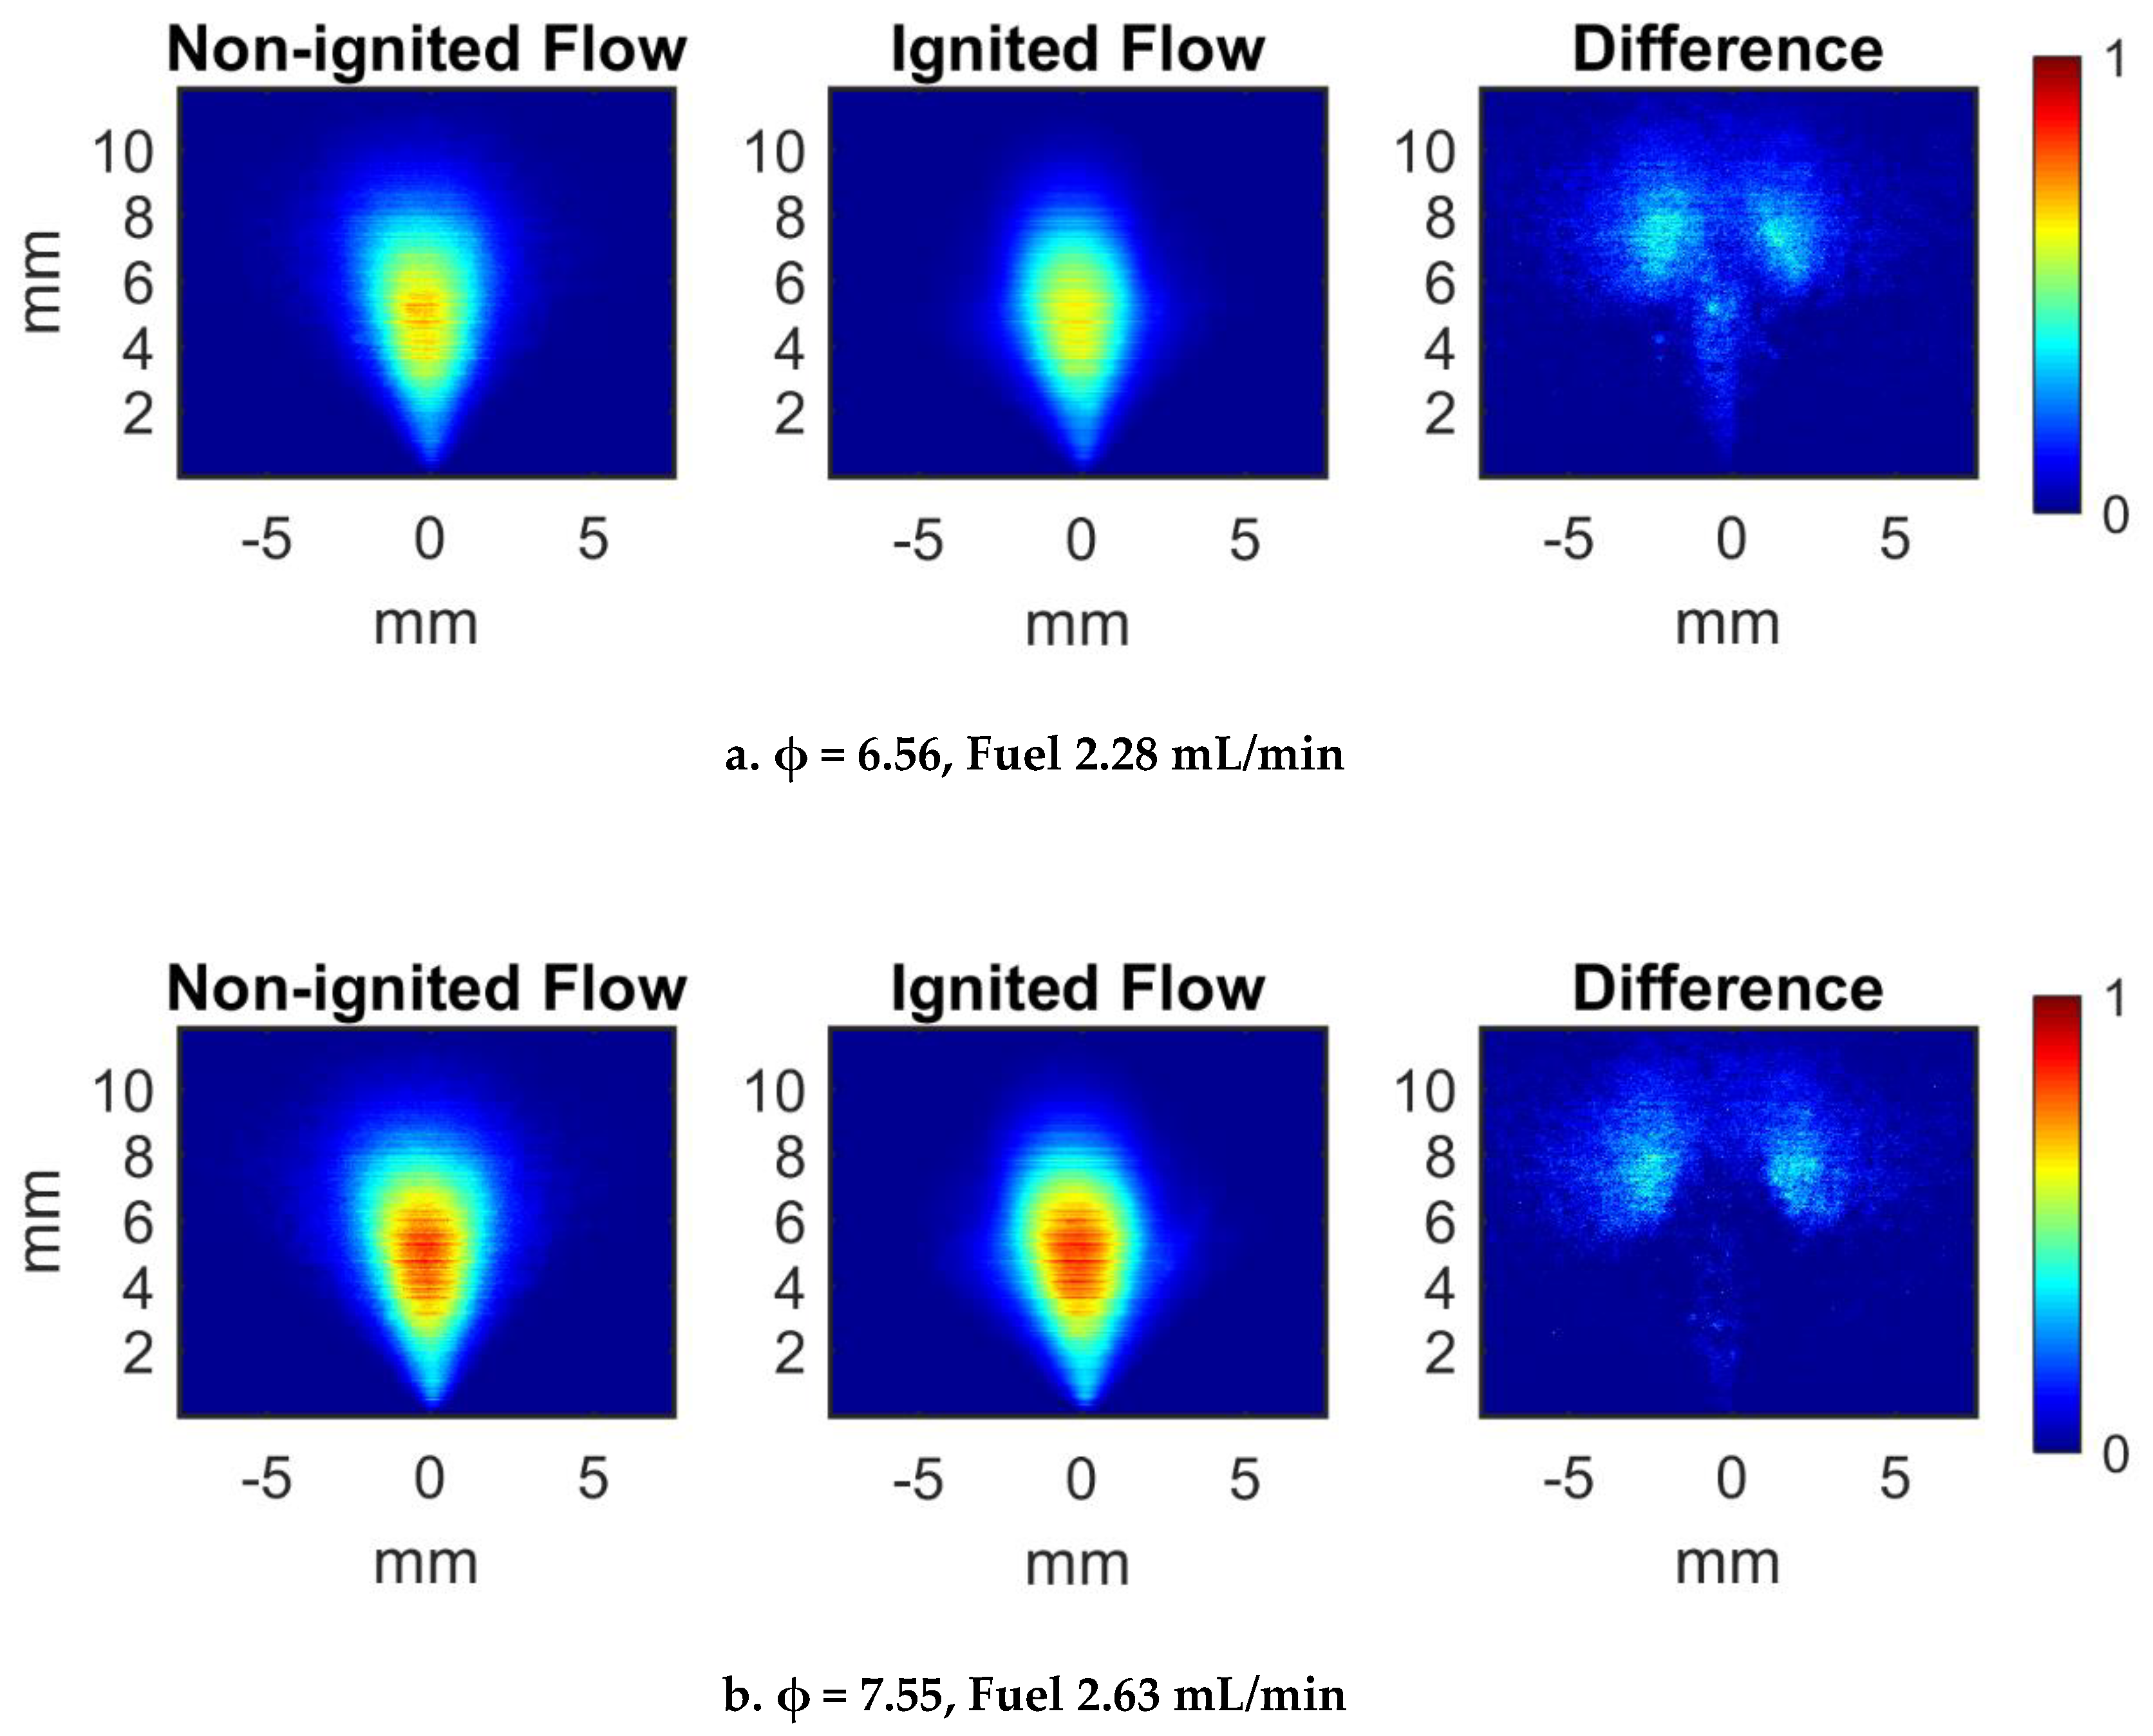
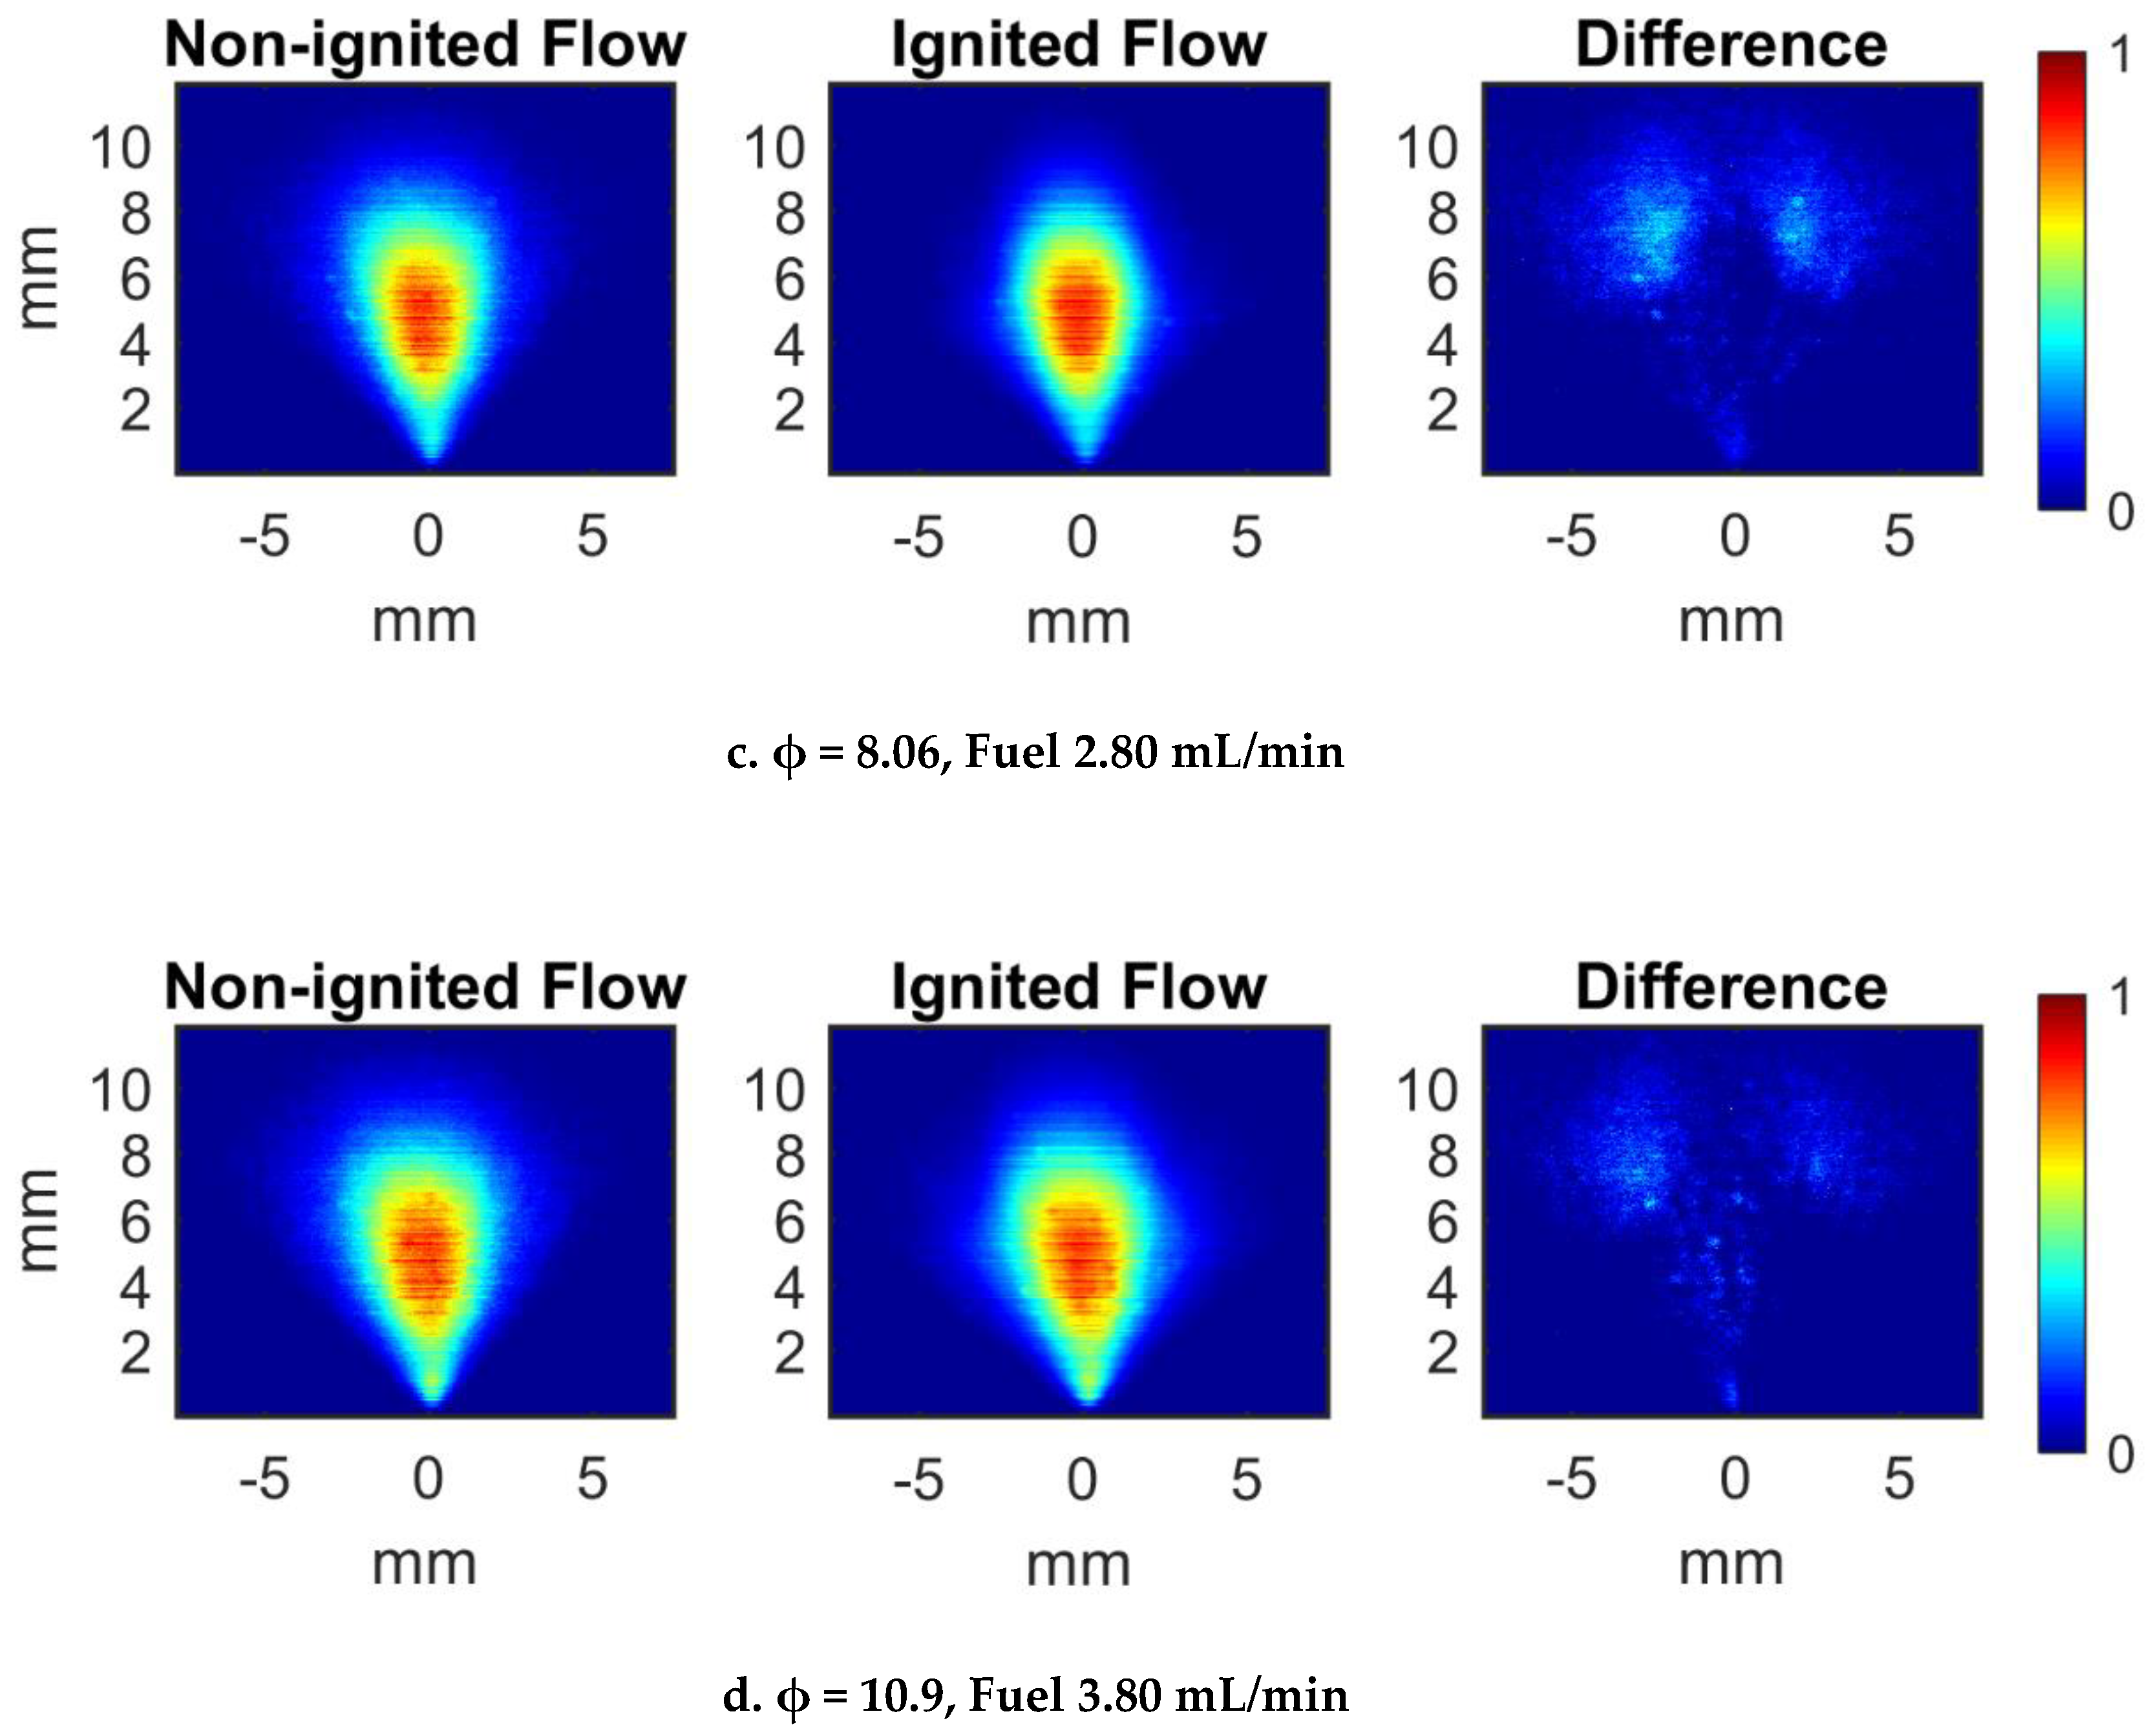
Mie scattering was used to detect liquid concentration in cold- and ignited-flow ethanol sprays under the four equivalence ratios, as shown in
Figure 7. A total of 100 sequential shots at an exposure time of 1 ms each were taken of both non-ignited and ignited flow. The shot groups were averaged to produce the images shown in the figure. Flame emission at 632.8 nm was removed by subtracting 100-shot averaged images of the ignited flow without the laser sheet present from the Mie scattered ignited flow images; this was done to prevent any flame chemiluminescence detectable after passing through the line filter from interfering with the Mie scattering signal. The images are normalized to the maximum value of each image; the normalization scale corresponds to scattering intensity, i.e., local liquid concentration. The difference images, obtained by subtracting the ignited flow image from the cold flow image as in
Figure 5 and
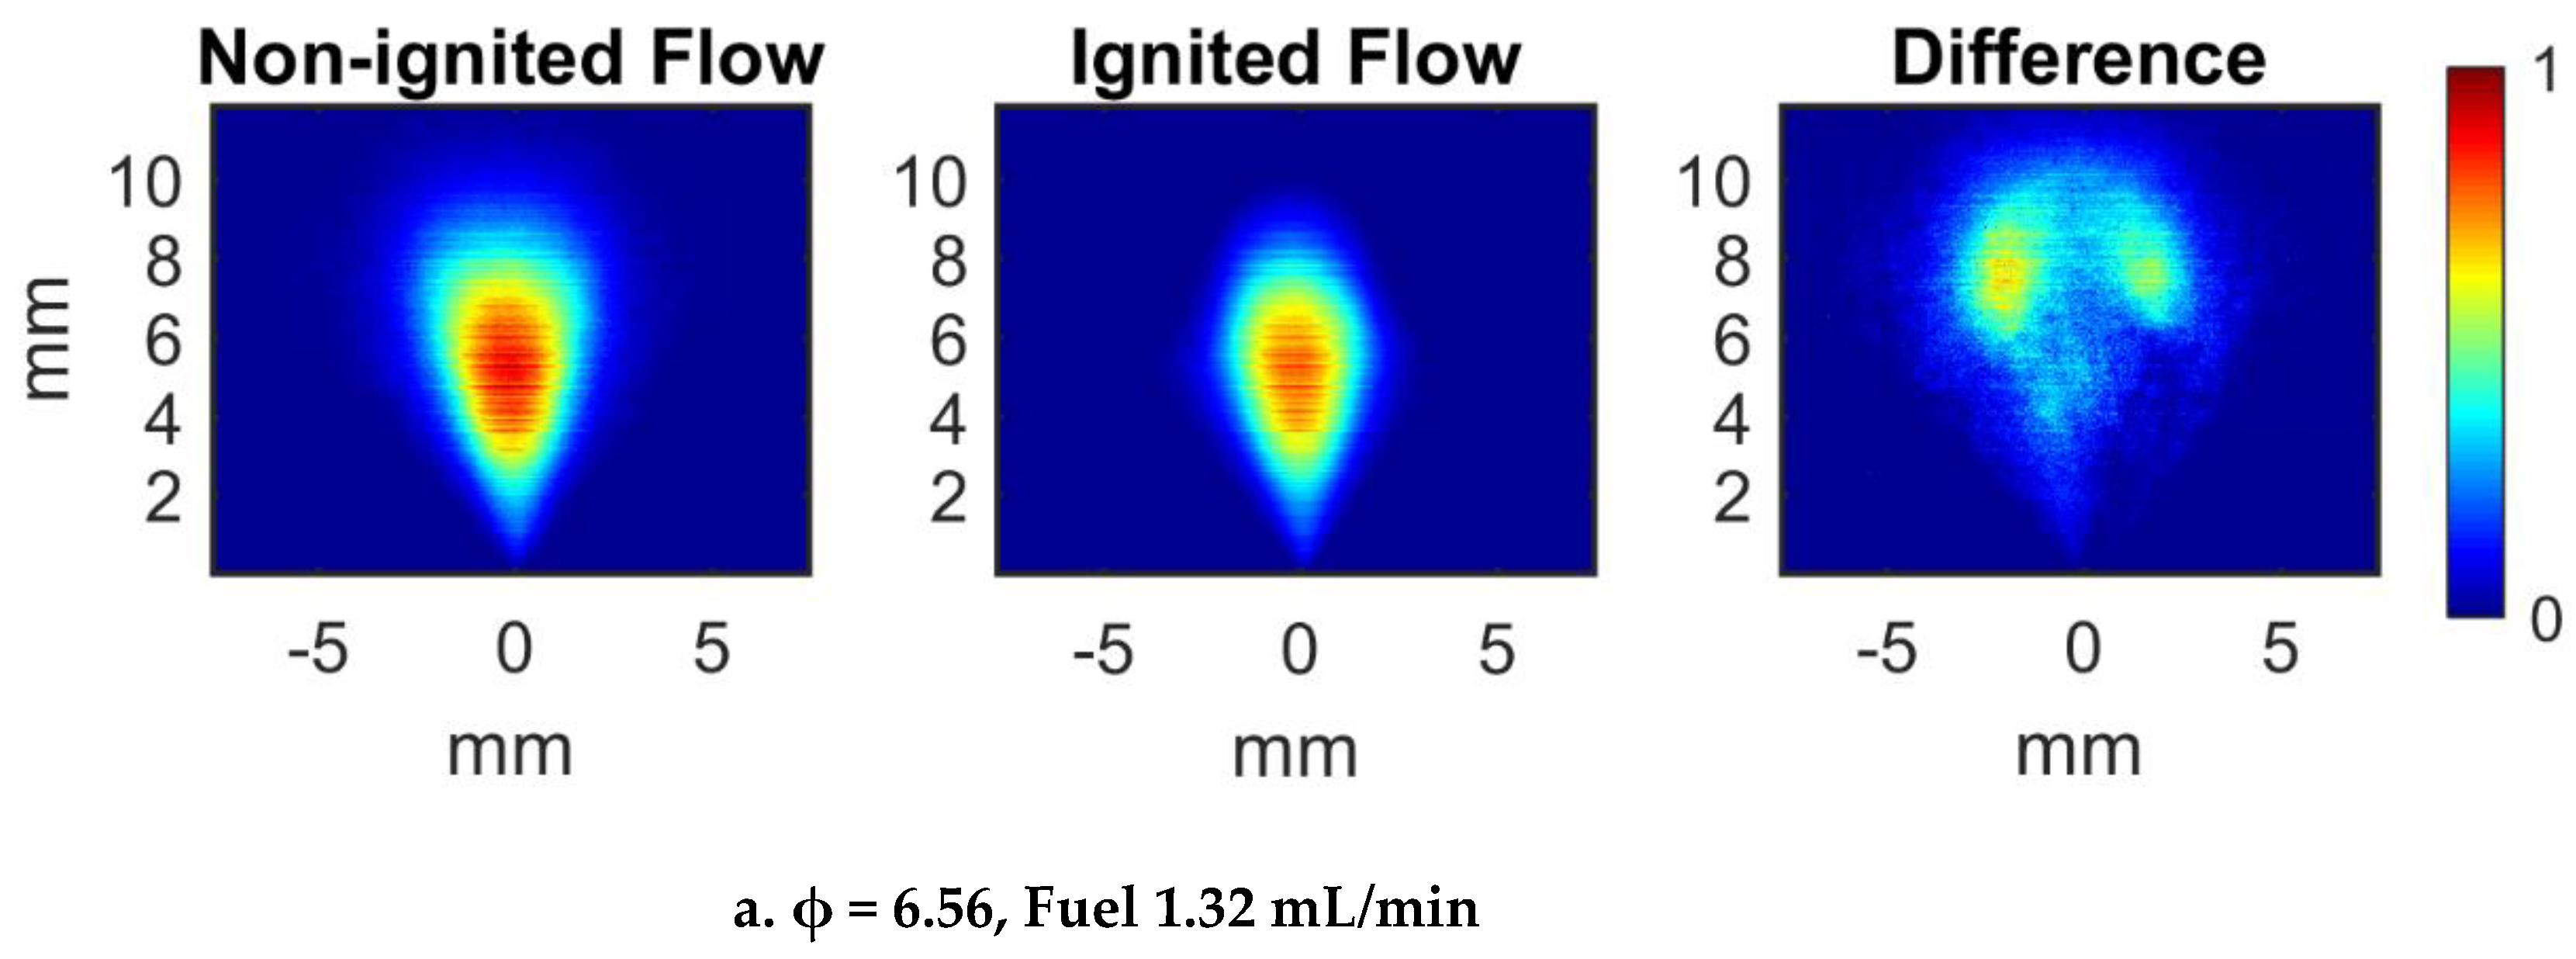
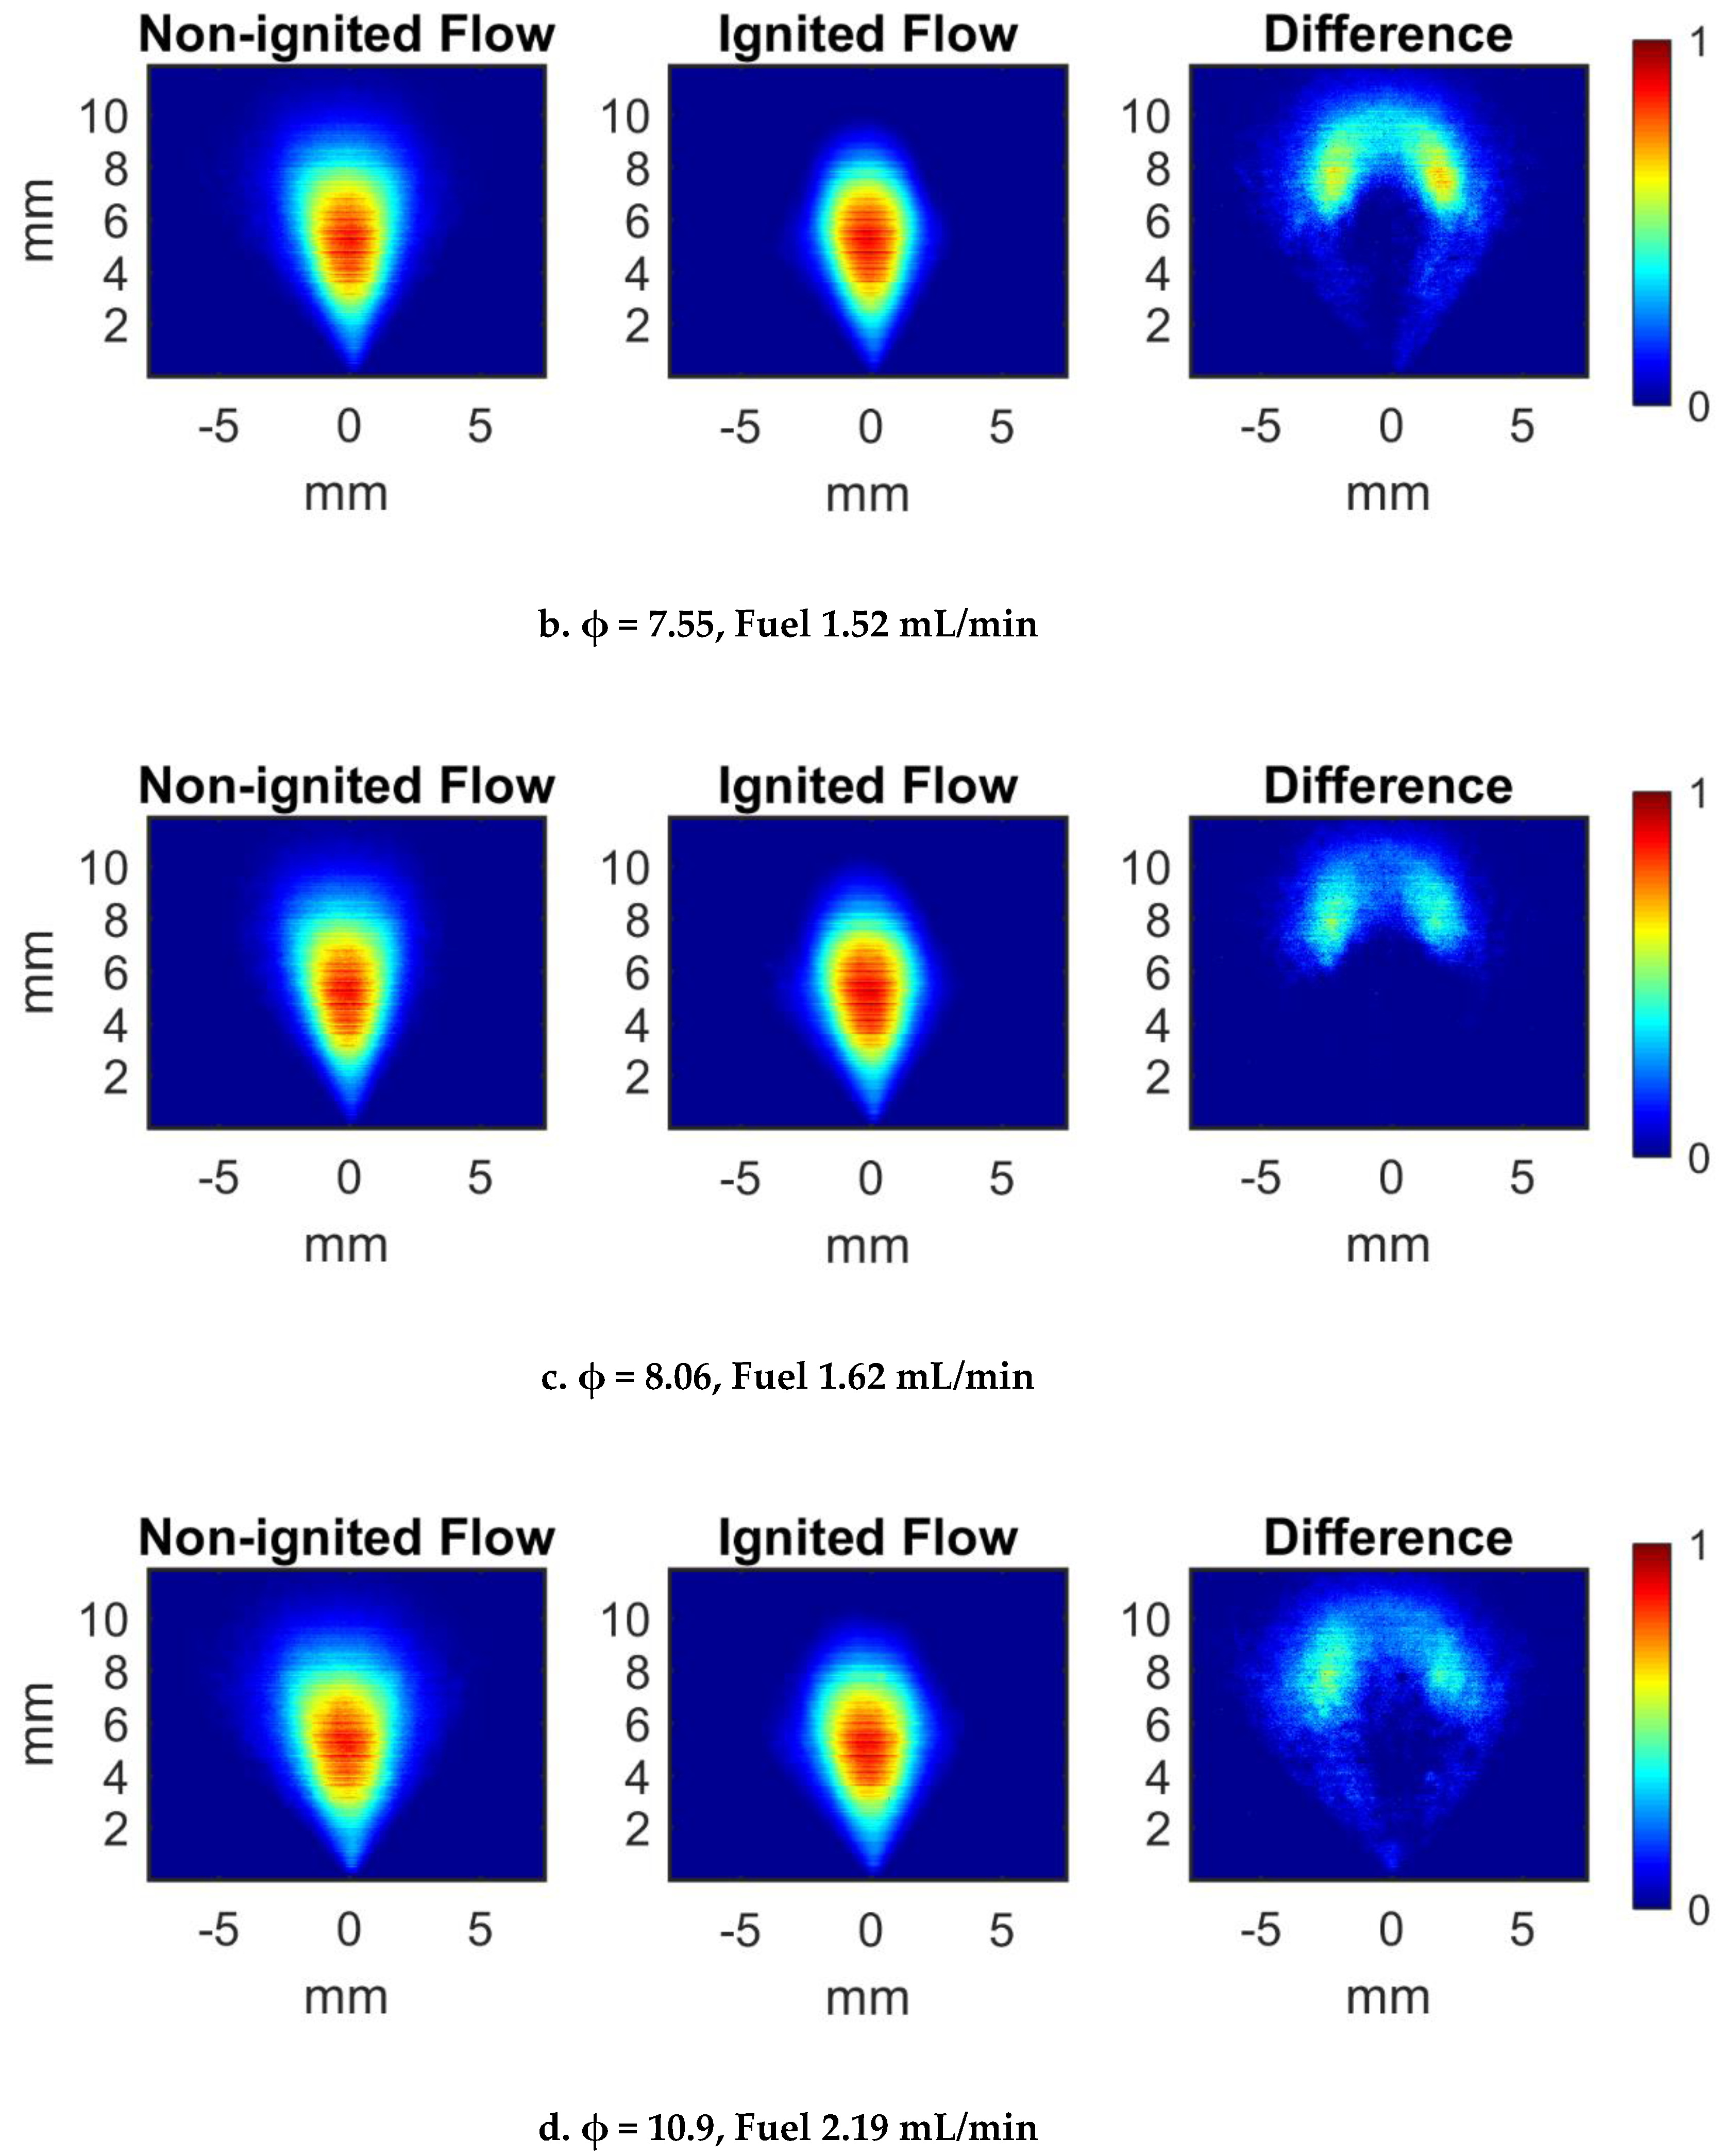
Figure 6, show that the flame height occurred near 6 mm above the nozzle in all cases, corroborating the shadowgraph data. Mie scattering data for the Jet A sprays with the four equivalence ratios is shown in
Figure 8. Again, the flame height was observed to begin ~6 mm above the nozzle similarly to the shadowgraph data. Spray angles for both fuels in non-ignited and ignited conditions are summarized in
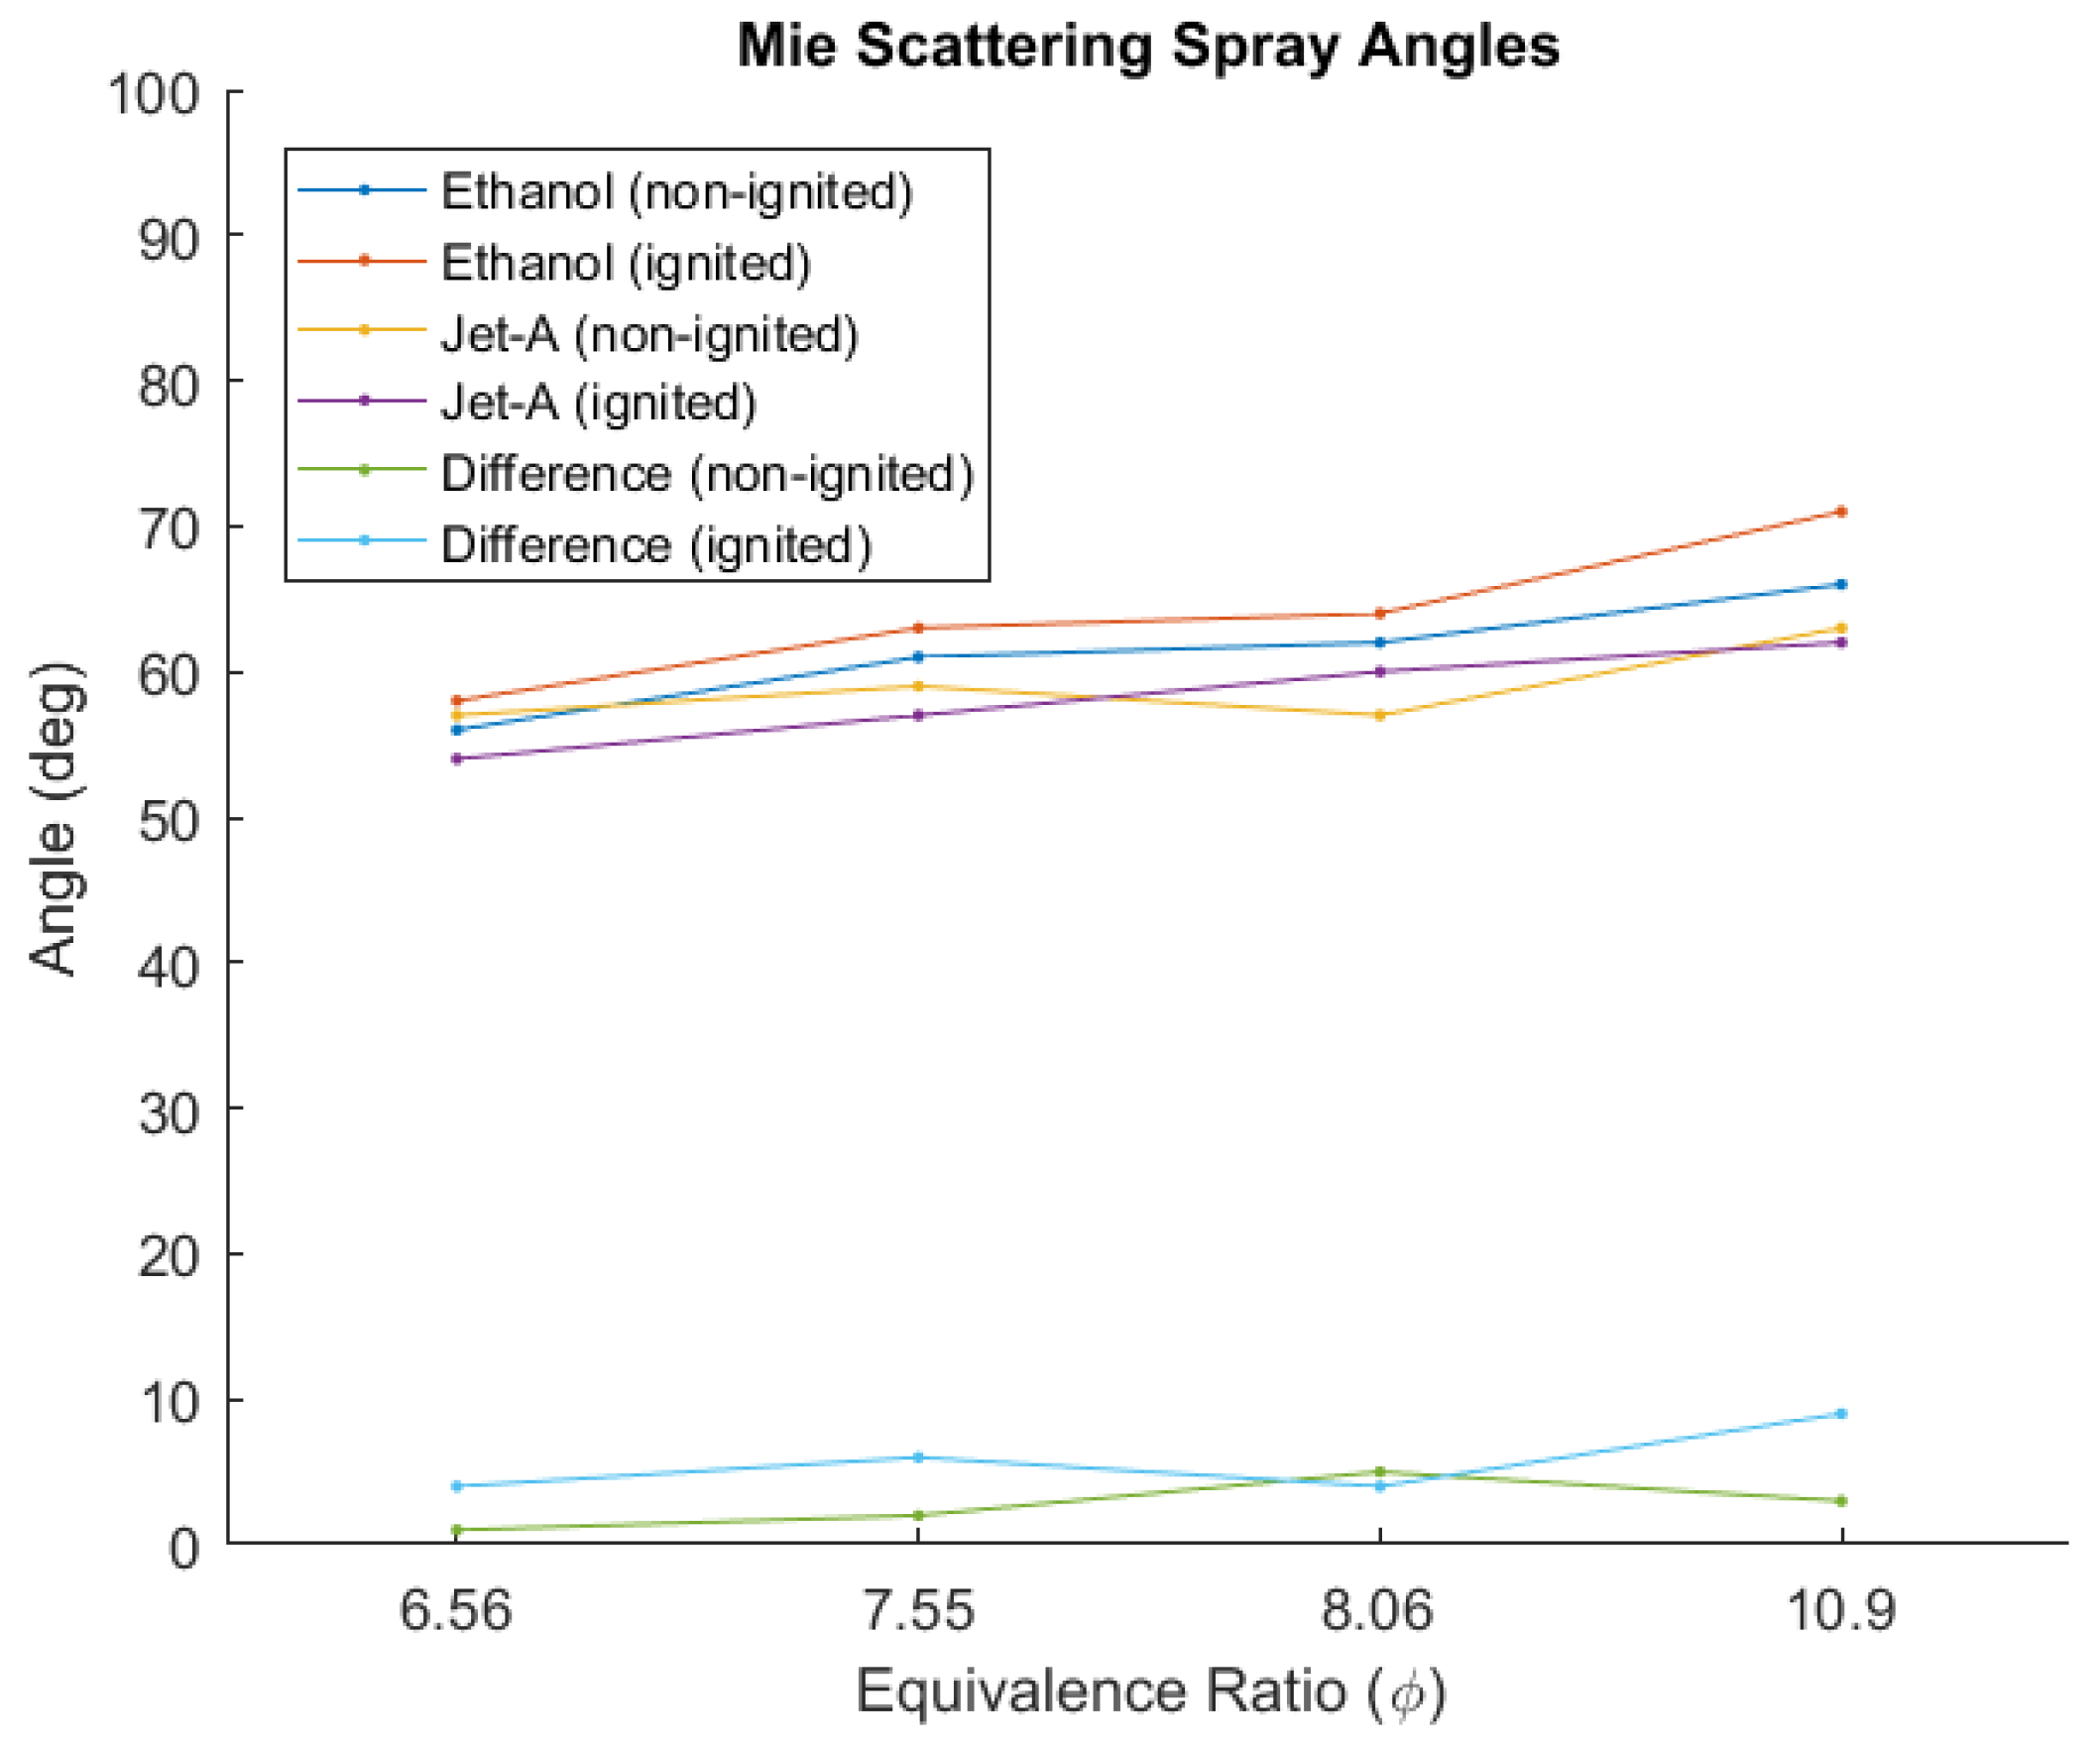
Table 1 and shown in
Figure 9. The angles were determined from the flow at the nozzle exit in the Mie scattering images using the angle measuring tool in ImageJ. Spray angles showed an increasing trend correlating to increasing liquid concentration, suggesting heavier liquid flow was associated with a greater degree of spread from the nozzle exit. Ethanol angles were consistently larger than their Jet A counterparts, but the differences between ethanol and Jet A angles did not exceed 10 degrees as shown by the difference lines in
Figure 9. The ignited spray angles were observed to typically be larger than the non-ignited spray angles for ethanol, while for Jet A the ignited sprays generally had smaller spray angles than their non-ignited counterparts. This finding may indicate that the Jet A spray consumed fuel more quickly than the ethanol spray, while the ethanol flame’s effect on the dynamics of the air in and around the spray may have had the effect of widening the overall spread of the droplets prior to their ignition; however, the visual measurement basis of the spray angle analysis method and small sample size of these results should be acknowledged as limits on drawing extensive conclusions regarding the differences in the ignited and cold-flowing spray angles, and future investigations focusing on the spray angles might elucidate the phenomenon.
Flame chemiluminescence of C
2*, CH*, and CO
2* was captured for both fuels in each of the four equivalence ratio cases. Averaged images were produced from 100-shot sequences as with the Mie scattering data.
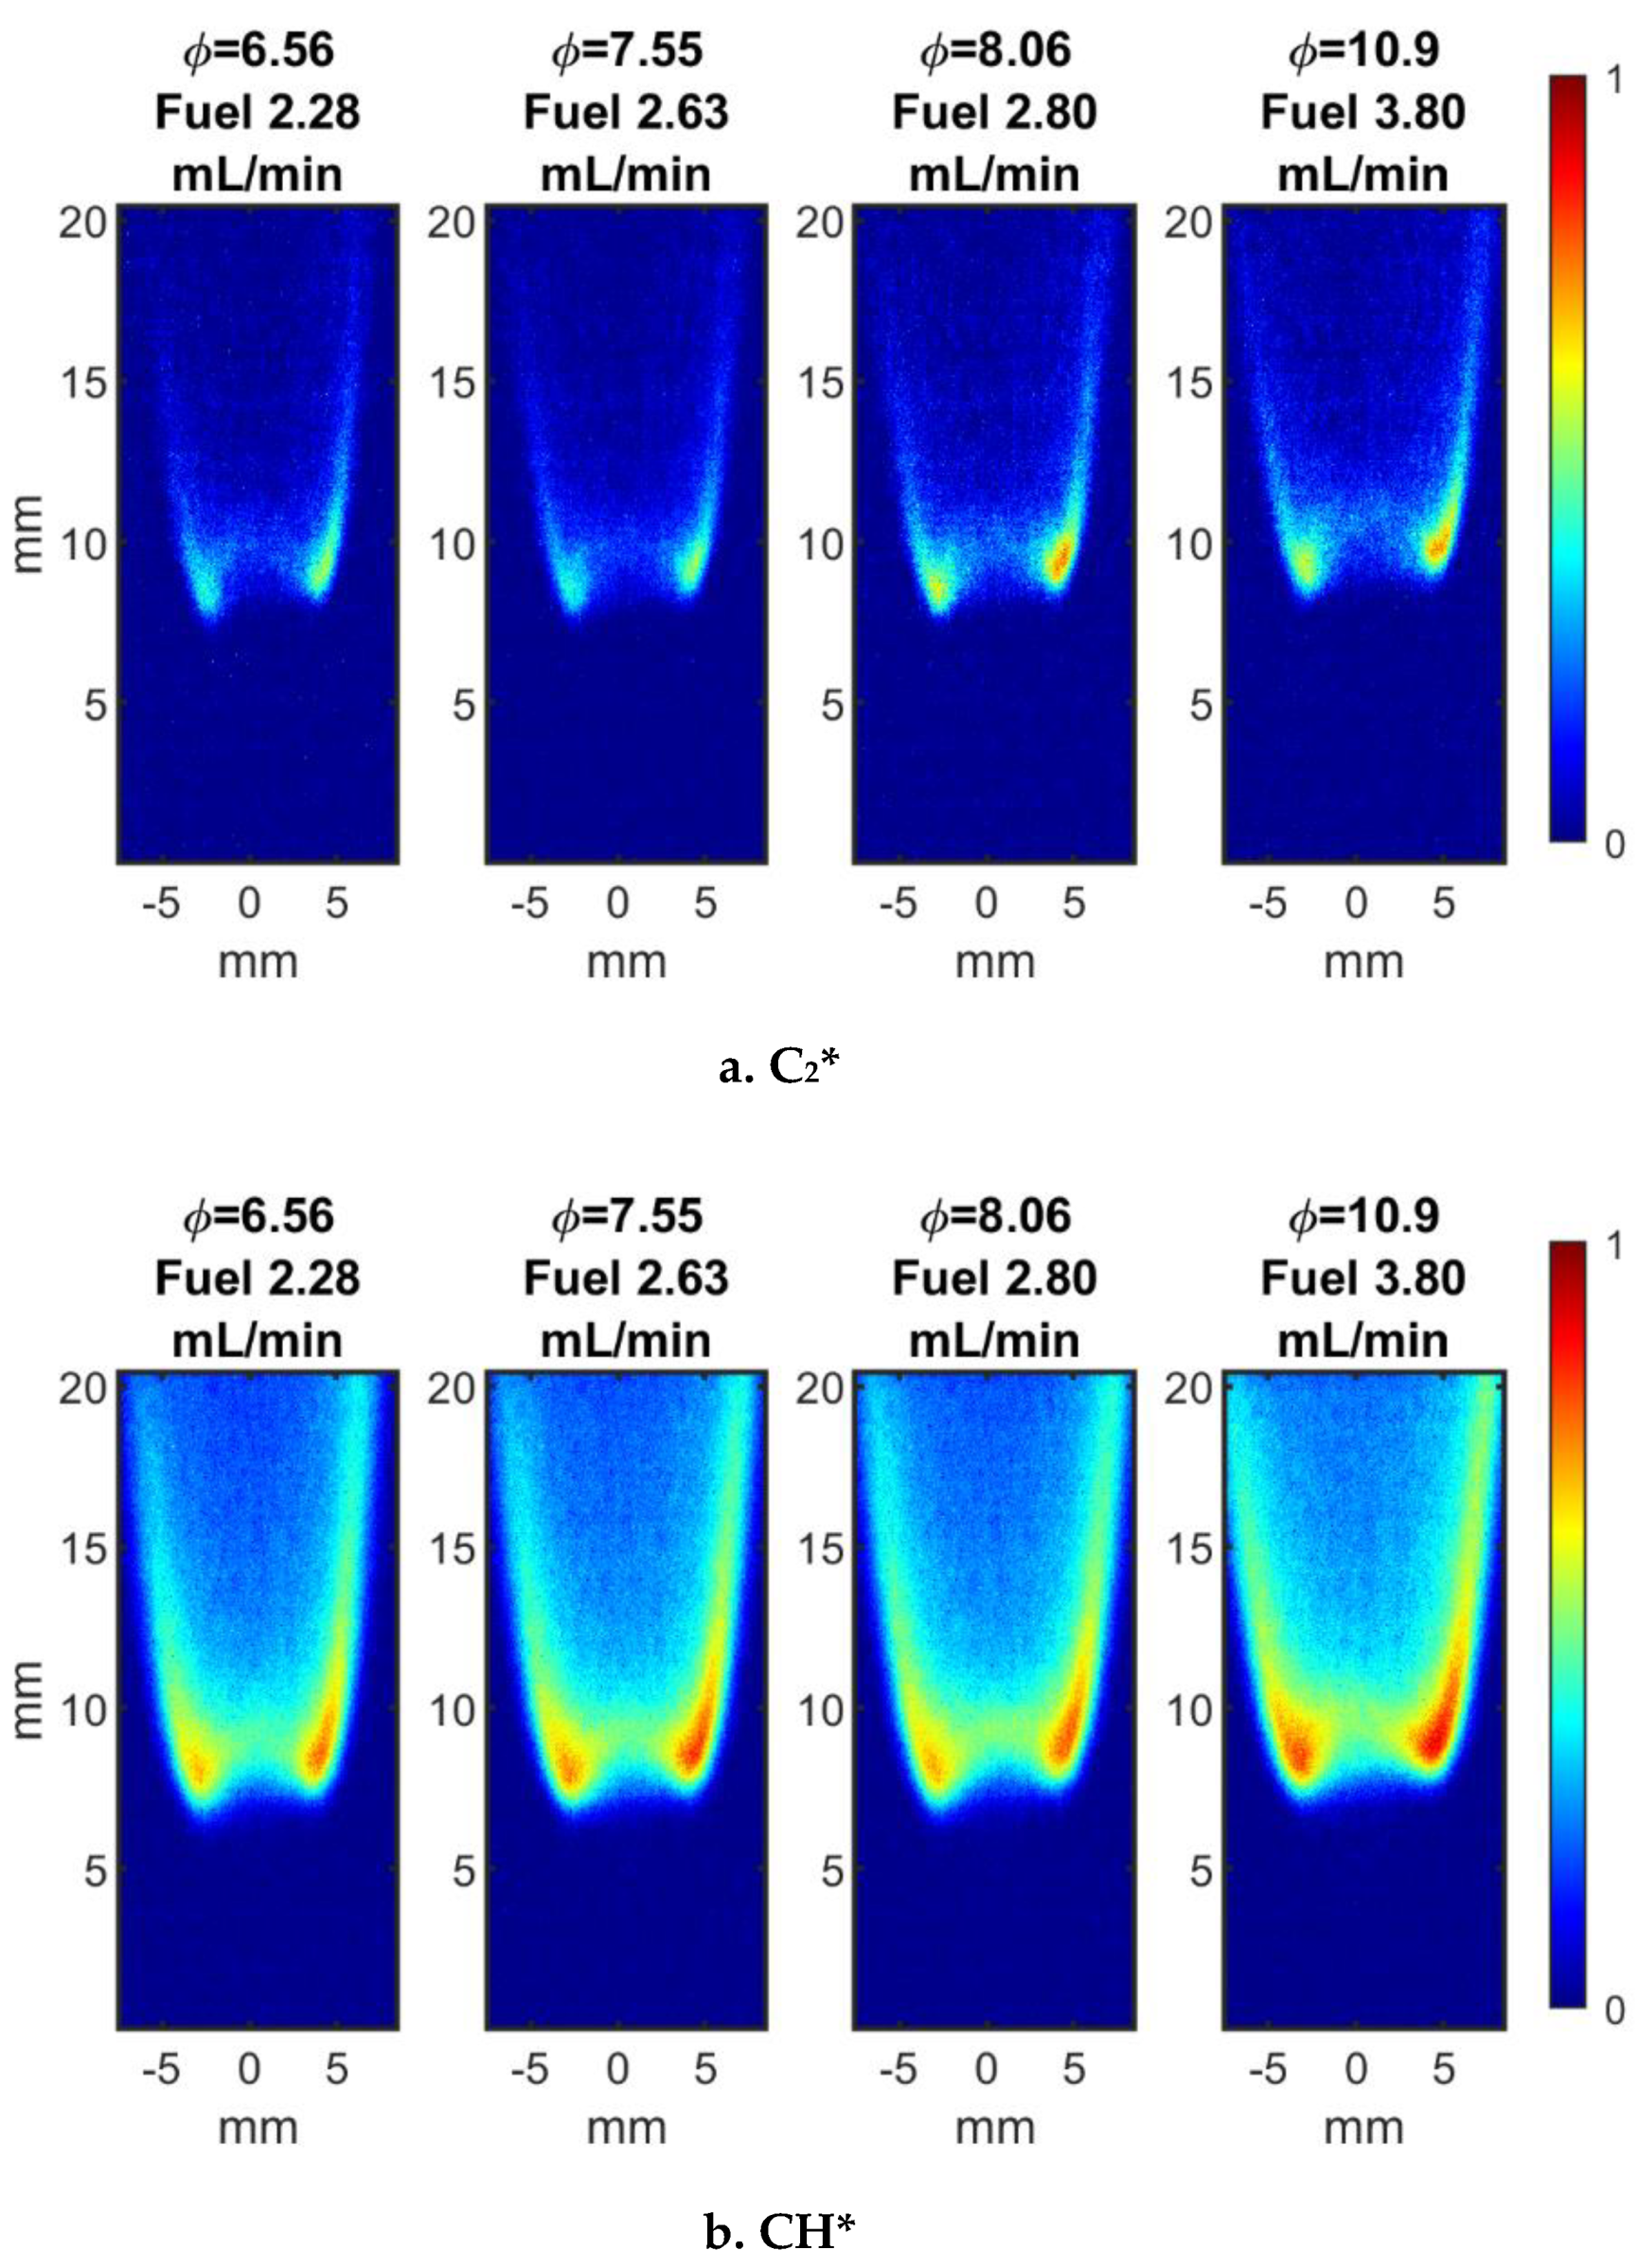
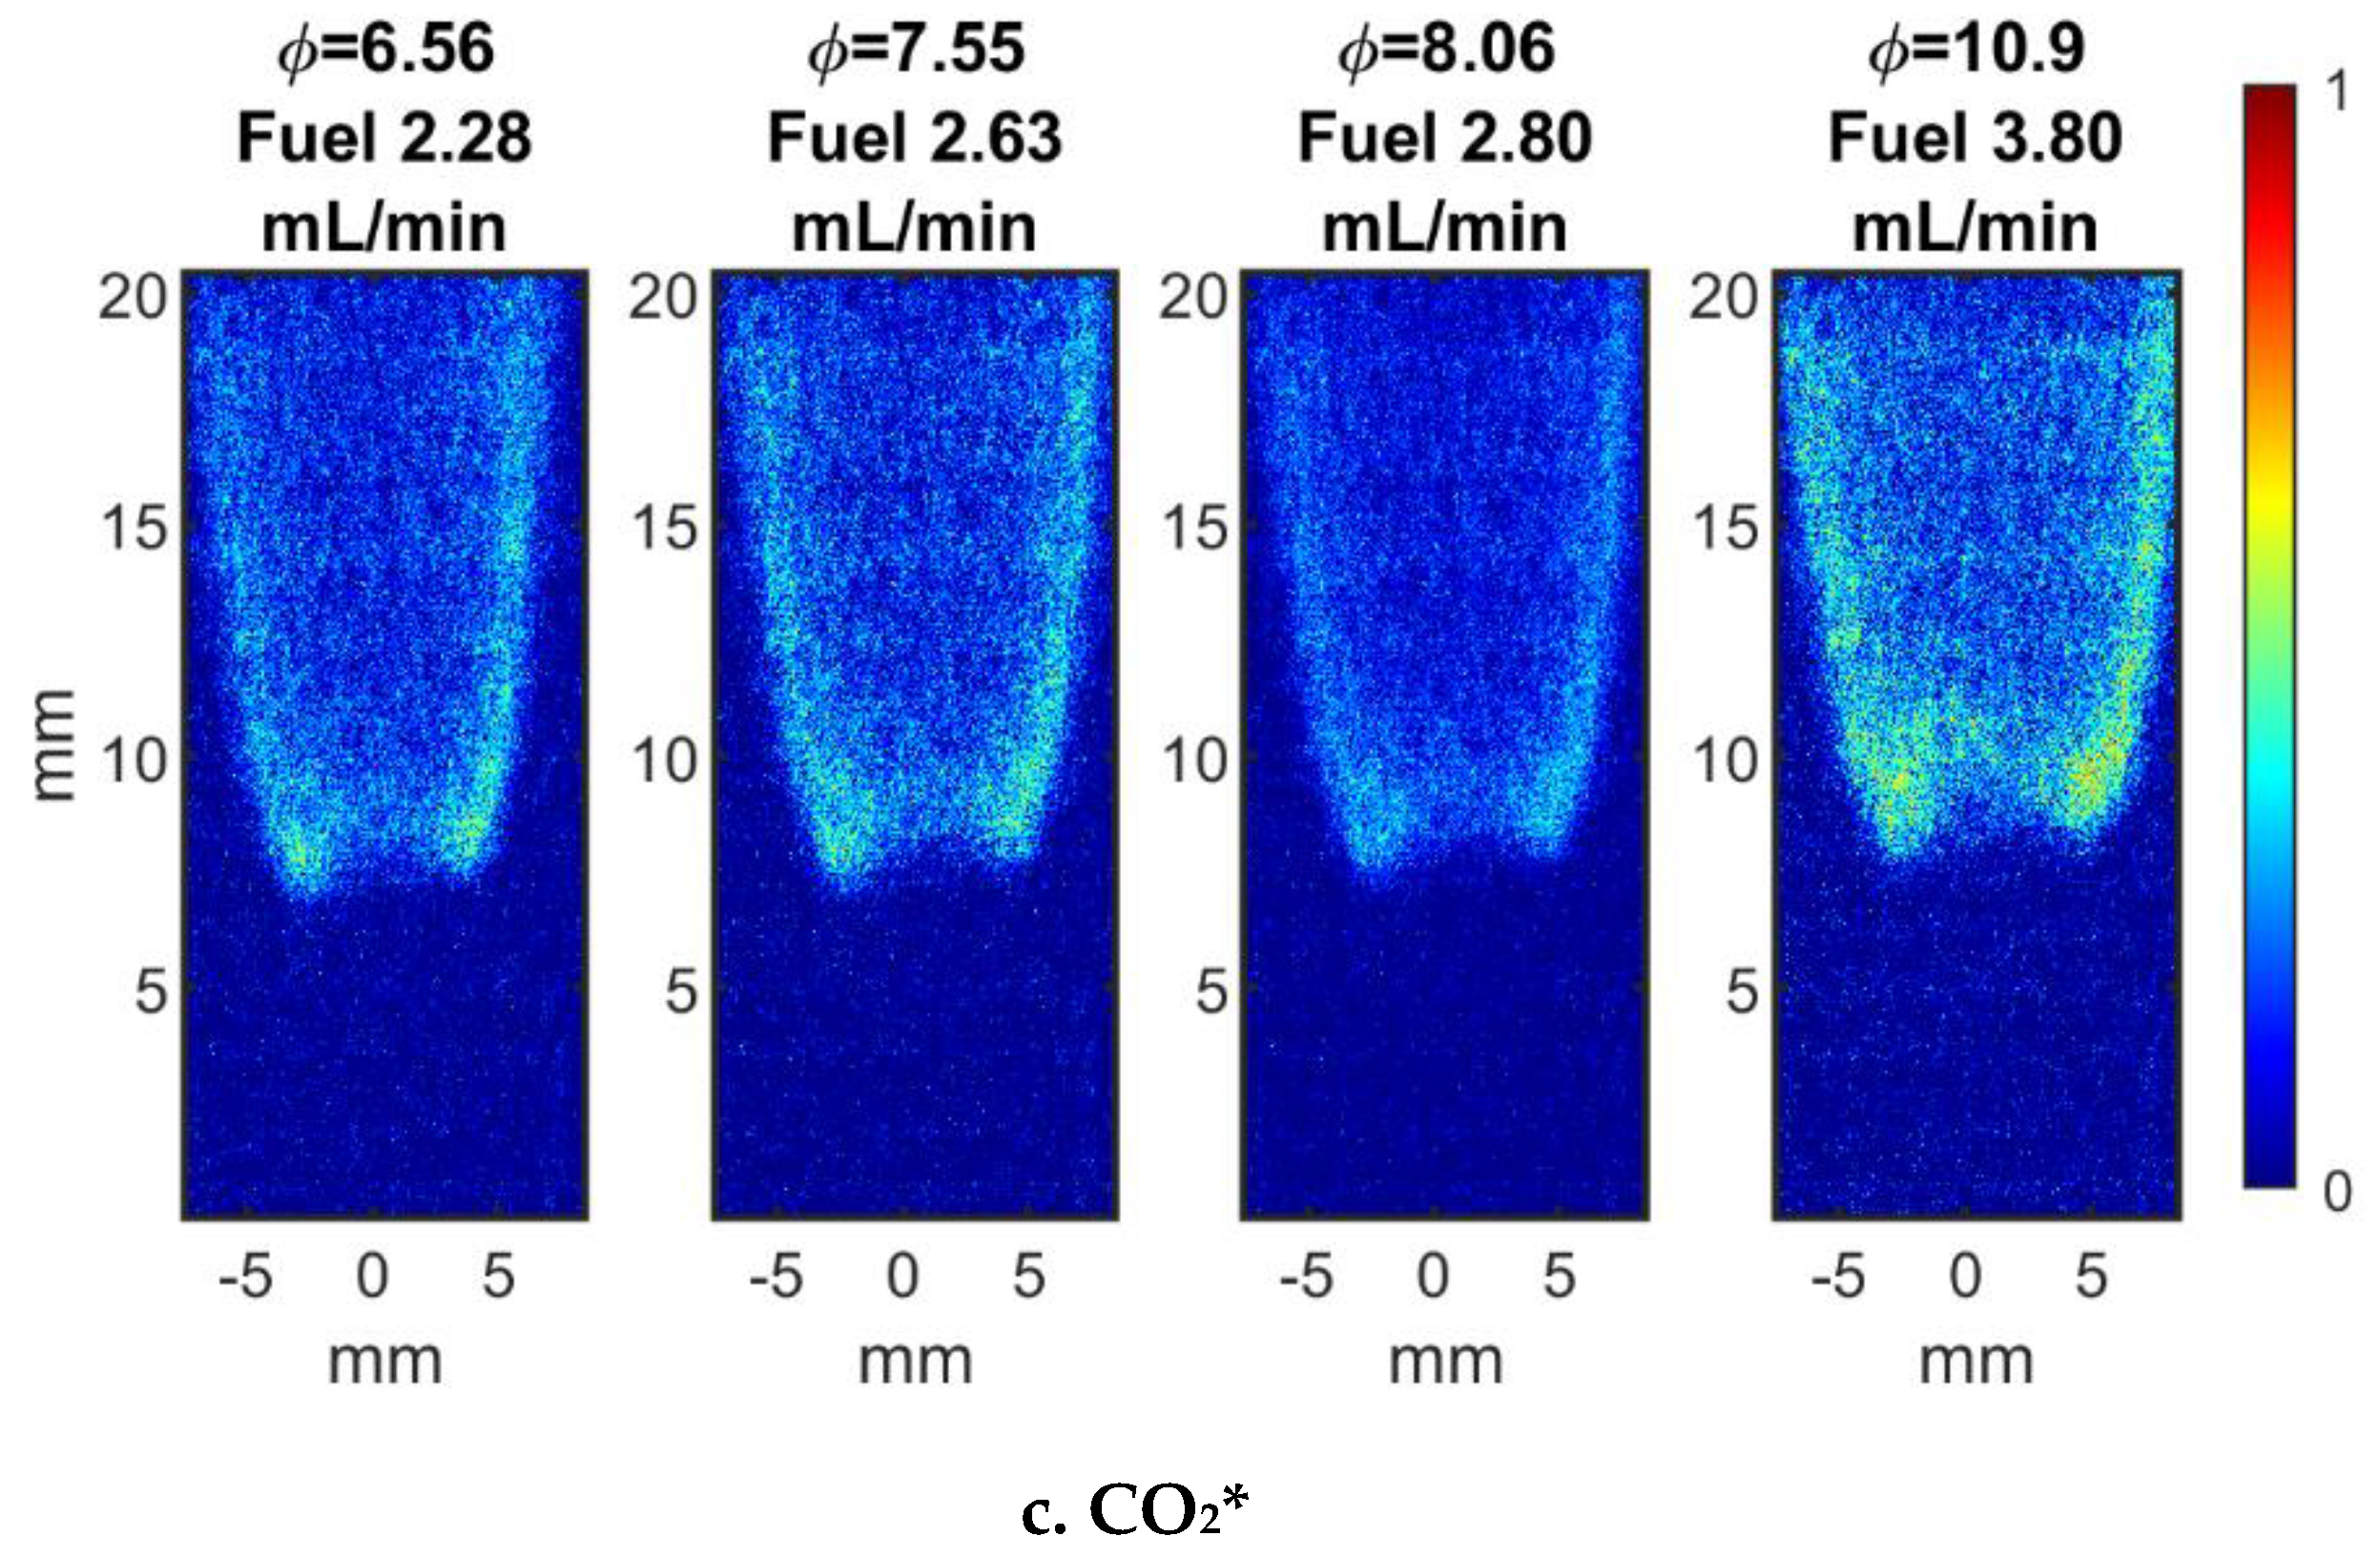
Figure 10a–c show the emissions for ethanol, and
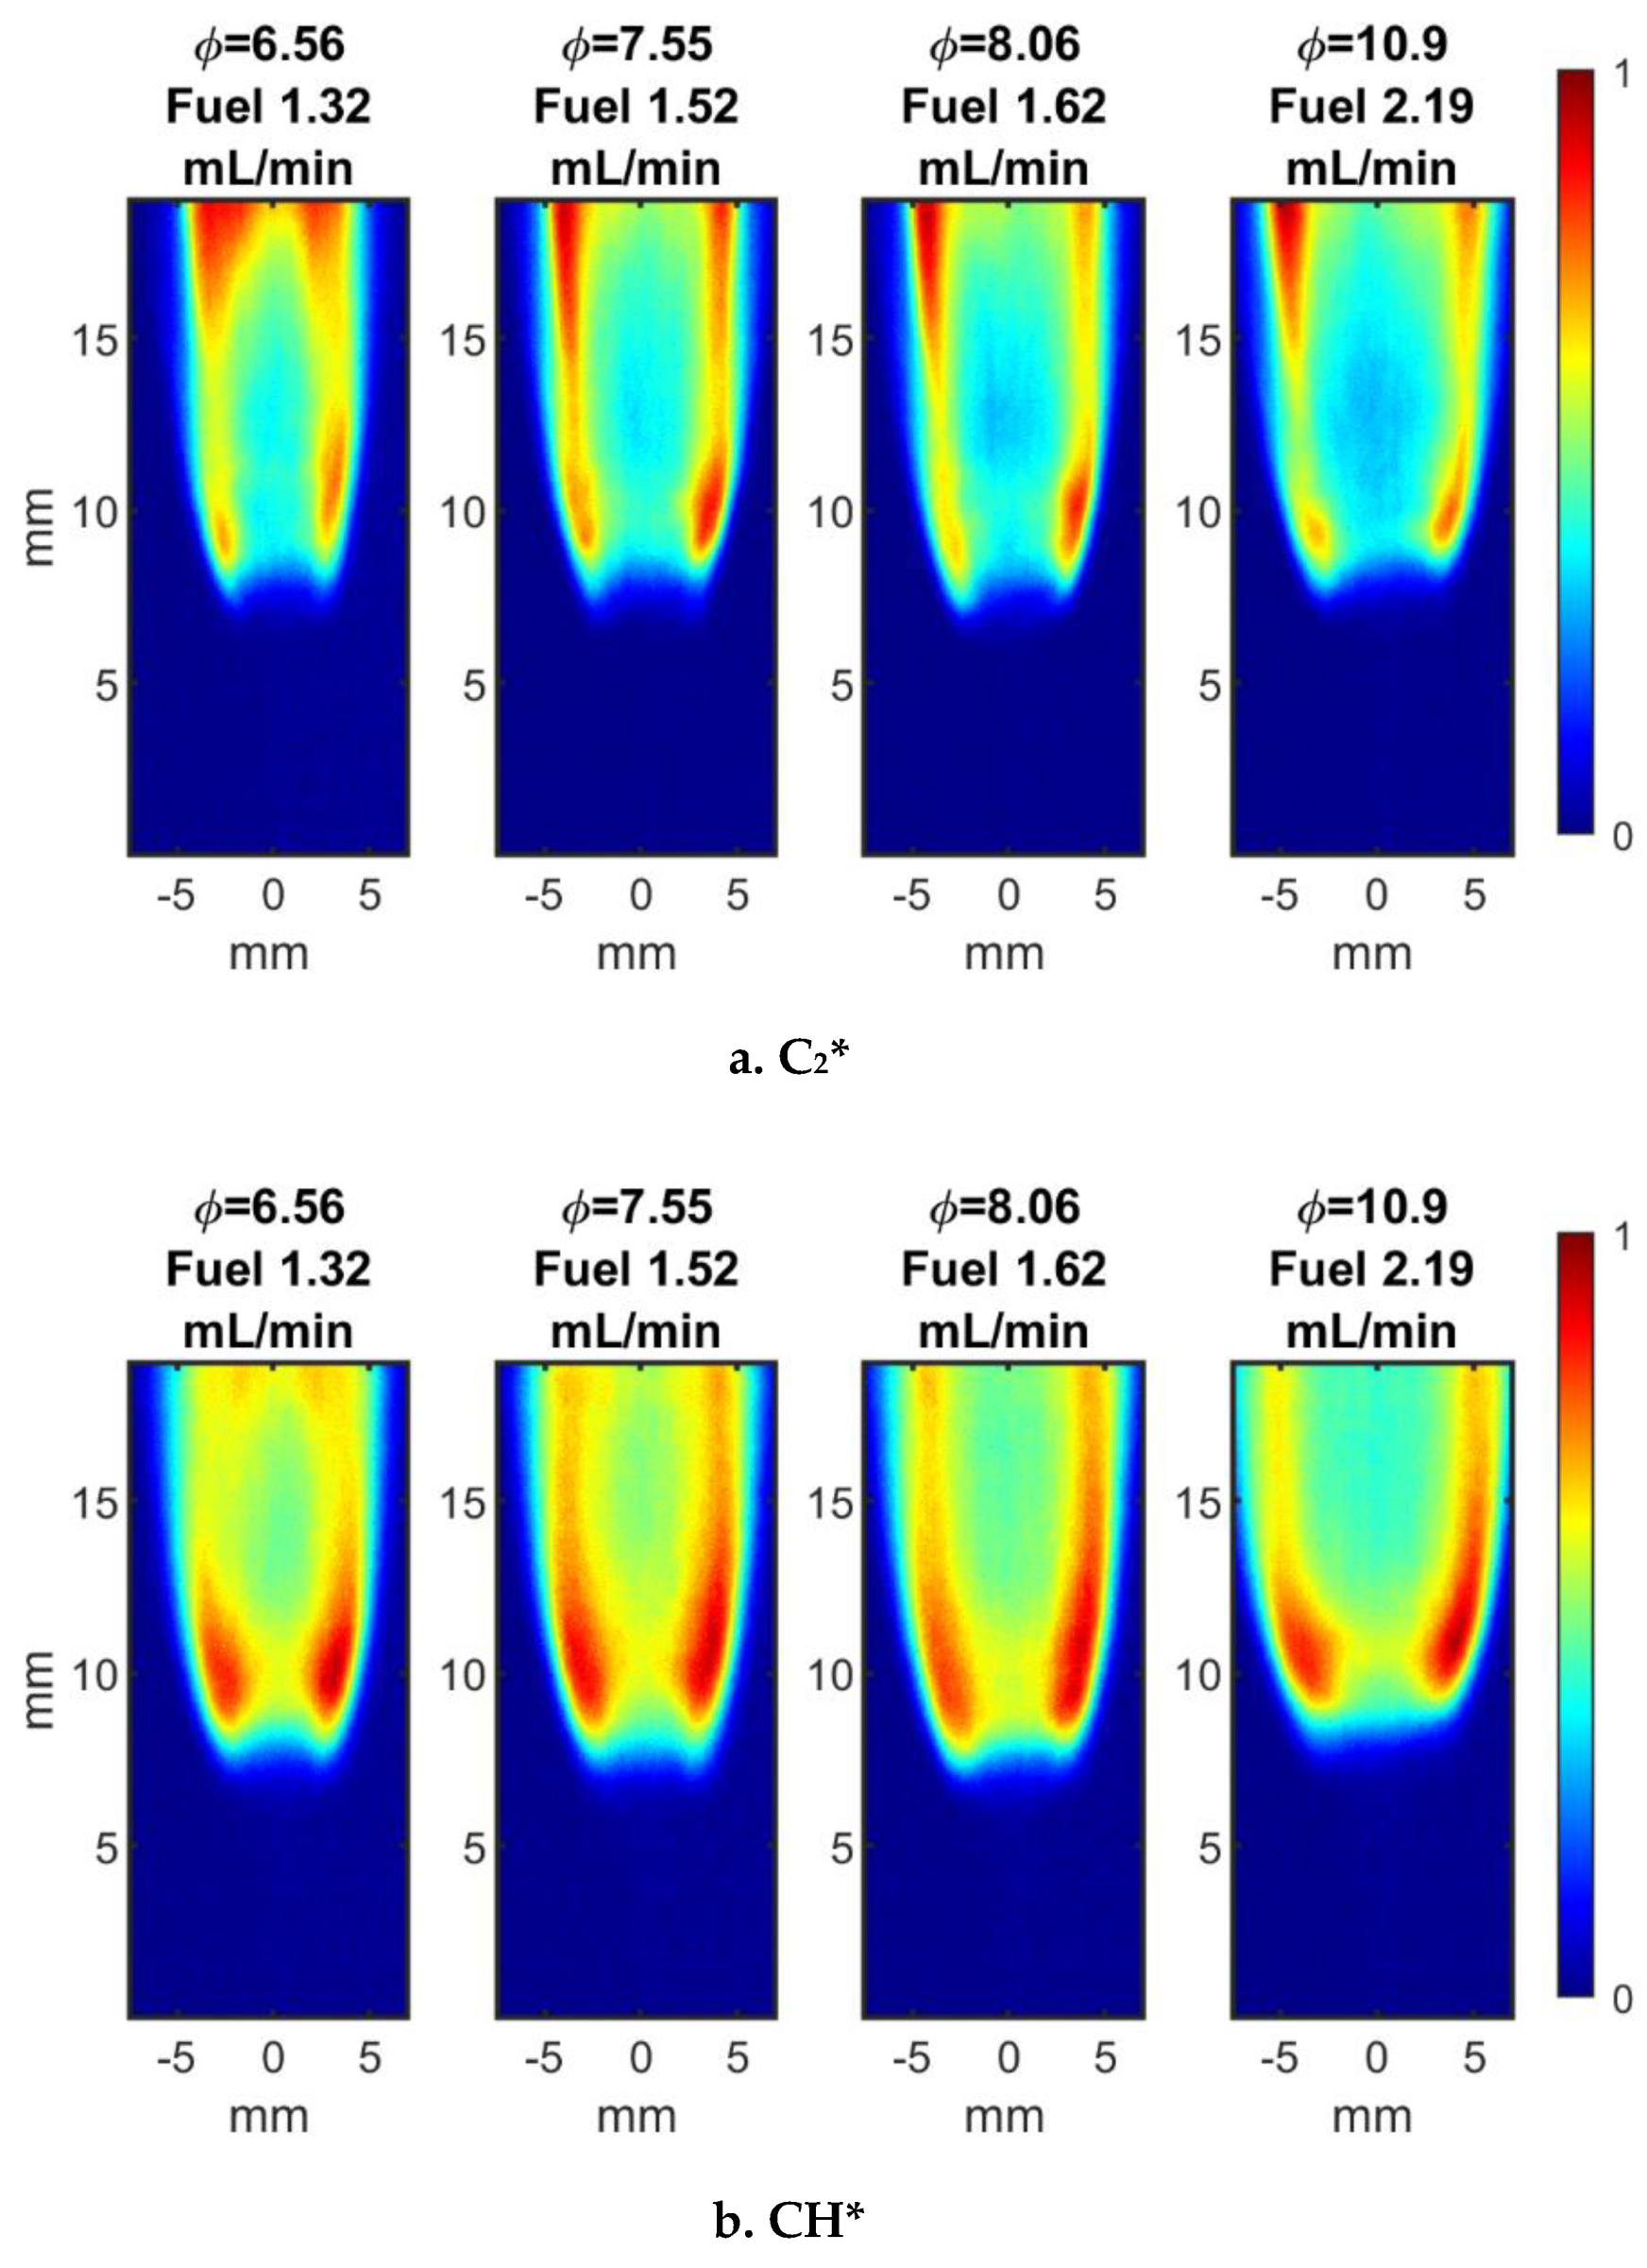
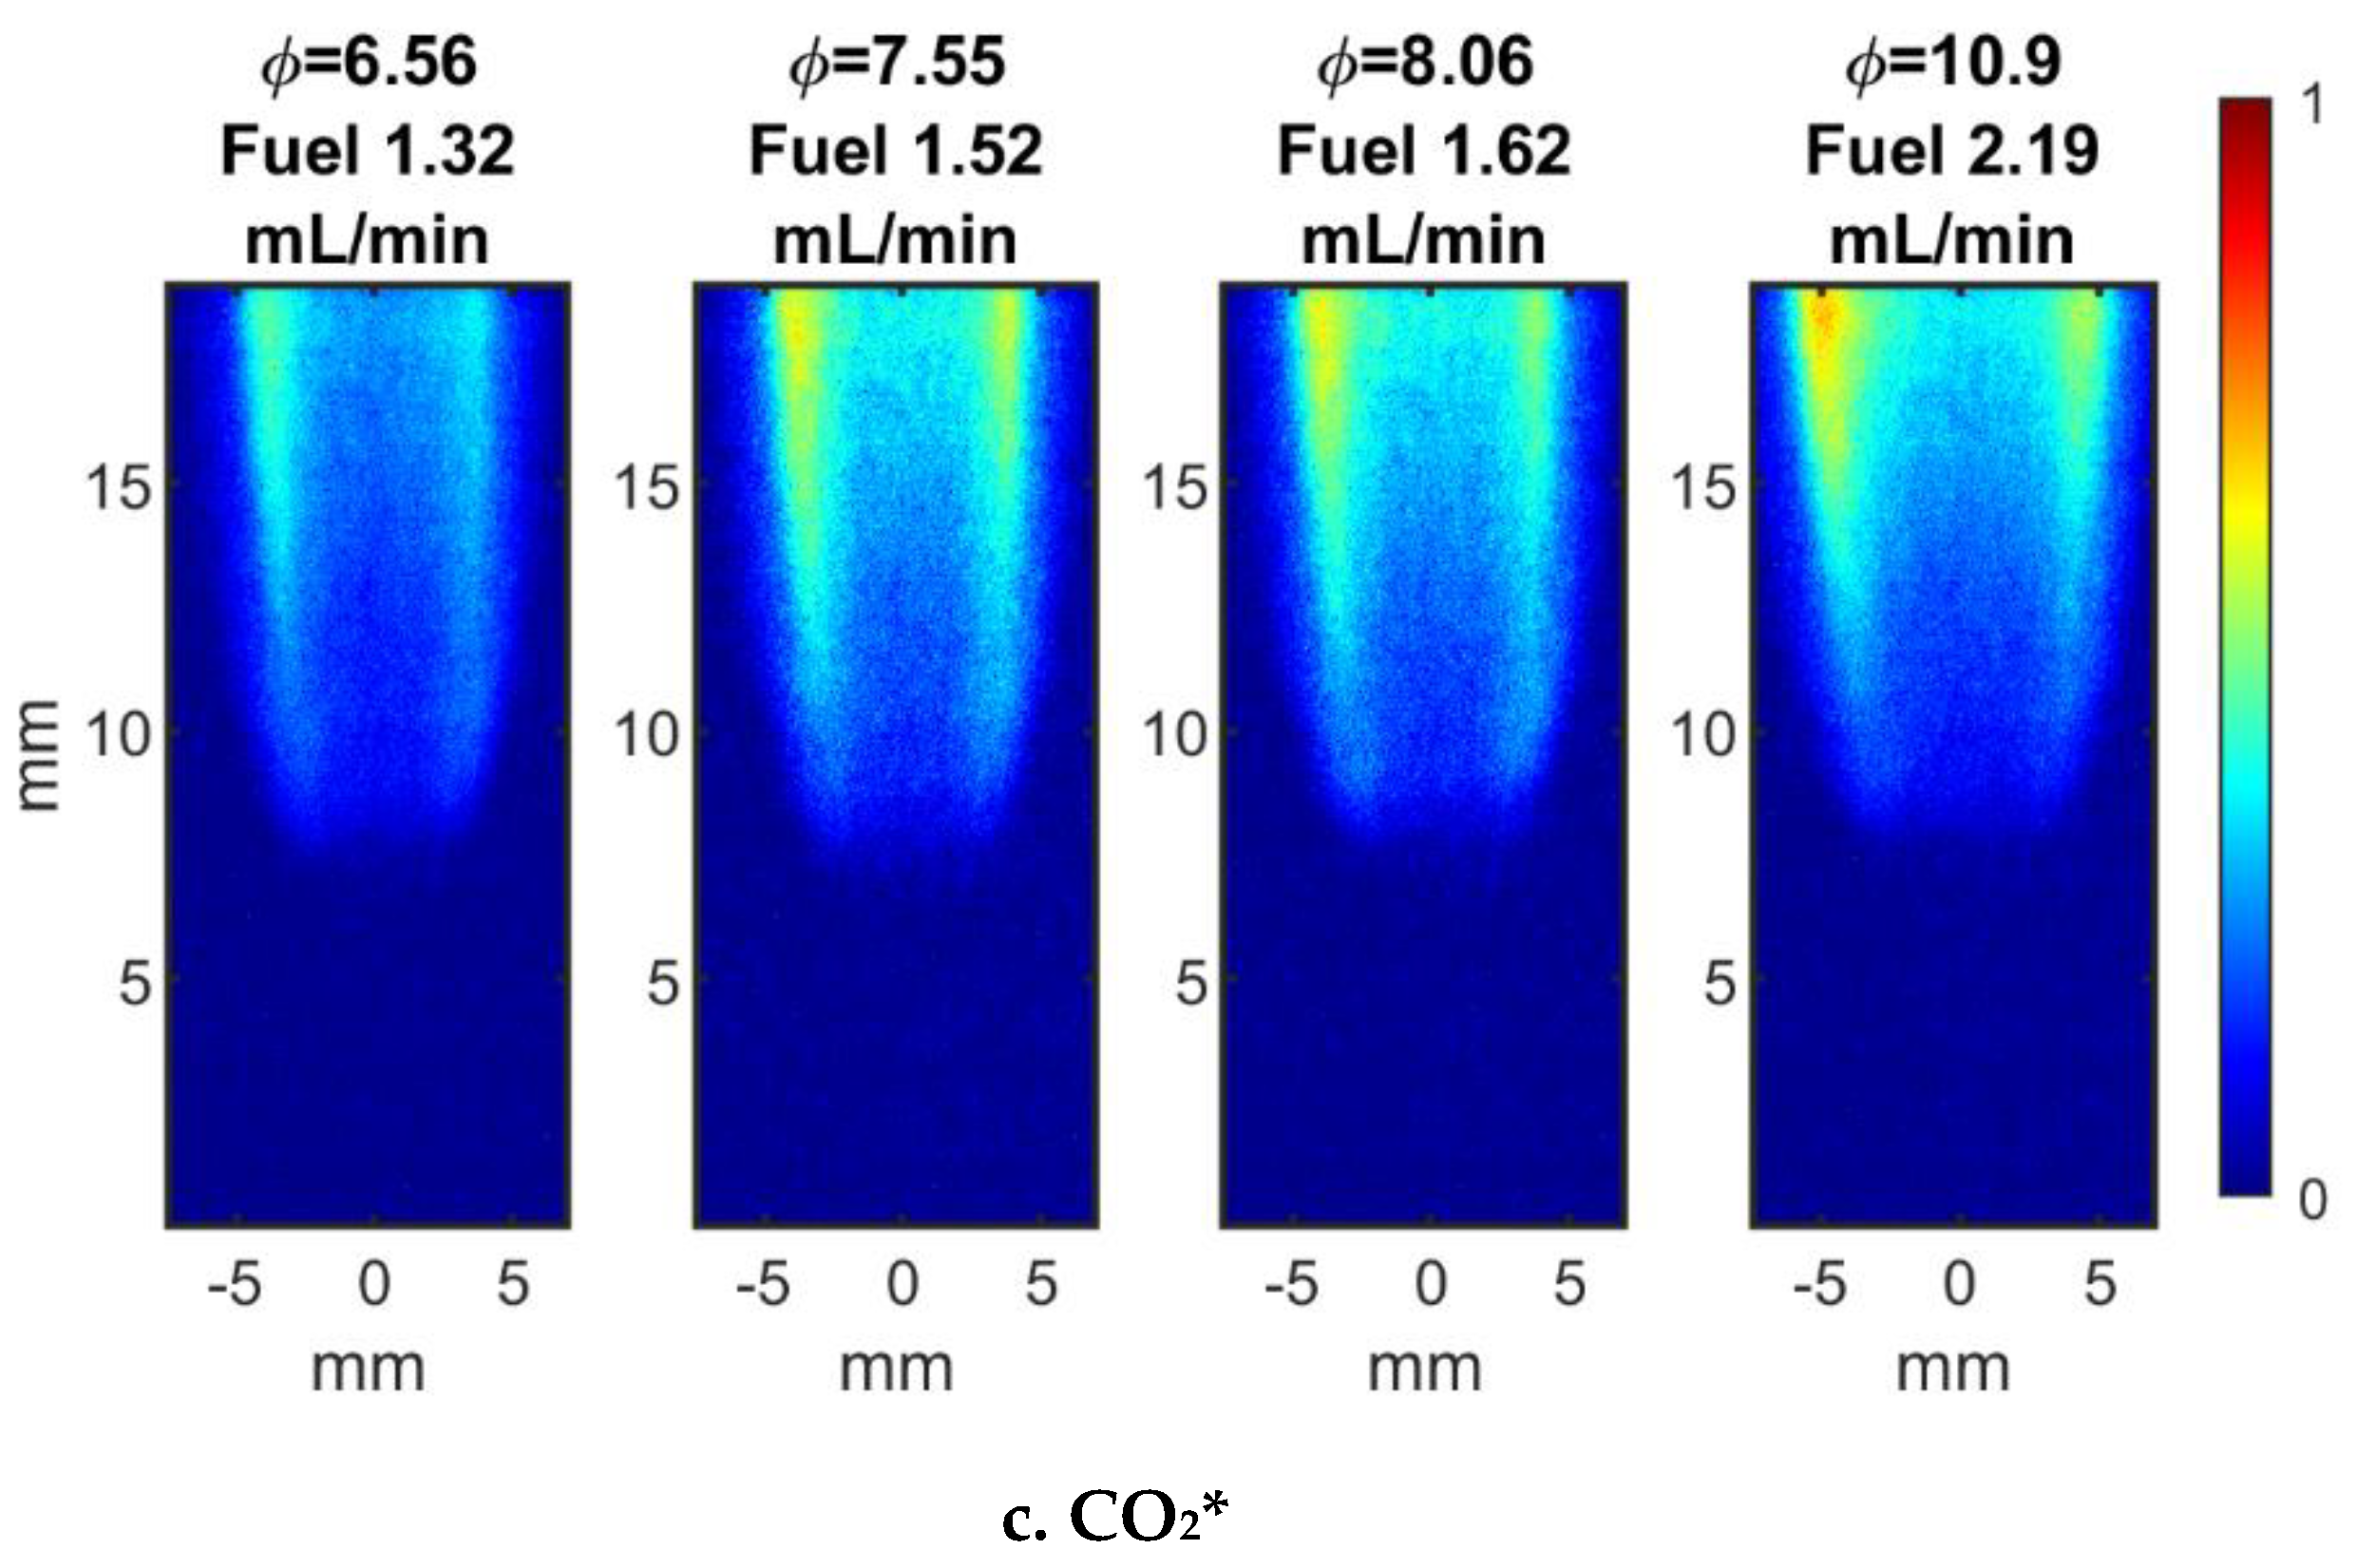
Figure 11a–c show the emissions for Jet A. For a particular fuel, the four equivalence ratio images per emission product have each been normalized by the maximum value of the four images in that emission product set. The emission intensity was low enough to be close to the background in the cases of C
2* and CO
2* with ethanol, resulting in noise from standout pixels which interfered with the normalization; those image sets were thus further normalized to a threshold percentage of their maximum values to negate the pixel noise. The reaction zone is defined by the high-intensity edges of the chemiluminescence emissions; therefore, the average flame height above the nozzle (assumed in this analysis to begin when the emission intensity reached ~30% of the maximum intensity of the full image) was observed to be ~7.5 mm based on the heights of the emission image groups for both fuels. The exceptional case of CO
2* for Jet A showed the emission only reaching the 30% intensity threshold at a height of around 10 mm or higher above the nozzle, but otherwise the emissions appeared to reach the threshold at ~7–8 mm. Additionally, the flame edges exhibited movement further from the center of the images as equivalence ratio was increased for both fuels. The enlargement of the spray angle with increasing equivalence ratio observed in the Mie scattering data may be correlated to the widening of the flame edges in the chemiluminescence emissions, suggesting that liquid was spread over a larger volume as the equivalence ratio was raised. Additionally, correlation of increasing equivalence ratio with the increase in the size of the core region of the flame may indicate that oxygen deprivation in the center region also increased and pushed the flame reaction zone to encompass a larger area until achieving sufficient oxygen draw from the surrounding air. Furthermore, the continuous suction of surrounding air as well as the combusting spray into the exit duct may have acted as a stabilizer on flame shape; preliminary experiments showed that continuous flame ignition was less likely to be maintained in the absence of the duct.
The CH* emission was clearly dominant in the ethanol spray flame, while C2* and CO2* were of lower intensity; the CH* and C2* emissions were concentrated near the bottom of the flame and at the edges. These regions also represent areas of high flame volume, therefore the edge intensity of the emissions exhibited in the chemiluminescence images was expected. The CO2* emission was relatively uniform throughout the flame. In the Jet A cases, the emissions were all of higher intensity than their ethanol counterparts; Jet A’s energy density is higher than that of ethanol, ergo the Jet A spray was expected to be much more combustible than the ethanol spray and the increase in emission intensity showed this. Additionally, Jet A has a lower hydrogen-to-carbon ratio than ethanol and the chemiluminescence of the carbon products therefore appear to be more highly potent for Jet A over ethanol. C2* presence was highest at the bottom and outer edges of the Jet A flame and less so in the central region, compared to the concentration of intensity at the bottom edges of the ethanol flame’s C2* emission. CH* showed similar high intensity at the outer edges of the flame with maximized presence at the flame bottom for Jet A, and the overall intensity of the emission was higher than C2* or CO2*. Conversely, the ethanol flame exhibited intensity concentration at the bottom edges but dropped off significantly at the upper region of the flame. The Jet A’s CO2* emission was lowest at the bottom of the flame and showed higher intensity with increasing distance from the flame bottom, unlike the ethanol result; the Jet A’s CO2* therefore did not become significantly present until after the initial combustion region, compared to the negligible CO2* level of ethanol which was concentrated at the bottom of the flame along with its other emissions.
4. Conclusions
An experimental characterization was performed on the two-phase far-field fuel spray produced by a laboratory-grade glass nebulizer in cold-flow and combusting conditions using shadowgraph, Mie scattering, and flame chemiluminescence. Analysis of the spray using ethanol as fuel yielded data on the non-ignited and ignited spray core angles, flame geometry, fuel concentration, liquid droplet atomization characteristics, and levels of CH*, C2*, and CO2*. Comparison of the ethanol spray was made with Jet A spray at multiple equivalence ratios. The results indicated that the Jet A spray atomized from the nebulizer at a rate similar to that of the ethanol spray since both sprays featured similar angles and produced flames beginning ~6 mm above the nozzle, and showed the higher energy density (and thus greater combustibility) of the nebulizer’s Jet A spray over that of ethanol by the higher overall intensity of chemiluminescence emissions in the Jet A spray flames. Additionally, the Jet A’s emission products showed more widespread concentration throughout the flame vs. the ethanol’s emission concentrations in the initial combustion region at the bottom of the flame. The results provide an initial characterization of the nozzle’s spray cold-flow and combusting spray output for the two fuels. This characterization can act as a benchmark for further analysis of the nozzle performance as well as future work which focuses on fuel studies and diagnostic development.
Potential future work may involve quantification of the droplet sizes and chemical species presence in the nozzle’s spray output using further applications of Mie scattering, chemiluminescence, and laser-induced fluorescence. The nozzle has thus far been applied only in a quiescent environment, and could be analyzed under elevated pressures and in cross-flowing environments. Additionally, the demonstrated successful flow conditions for ethanol and Jet A combustion from the nozzle could be used for designing experimental parameters for comprehensive combustion characterizations using this nebulizer, and comparison of combusting sprays from other liquid fuels of current interest such as aviation biojet propellants. Liquid structures in the dense-spray region near the nozzle exit could also be analyzed via application of SLIPI.
