Article

Assessment of Optimum CaO Content Range for High Volume FA Based Concrete Considering Durability Properties

1
Department of Safety Engineering, Seoul National University of Science and Technology, 232 Gongneung-ro, Nowon-gu, Seoul 01811, Korea
2
Department of Fire and Disaster Prevention, Semyung University, 65 Semyung-ro, Jecheon-si, Choongbuk 27136, Korea
3
School of Architecture, Civil, Environment, and Energy Engineering, Kyungpook National University, Buk-Gu, Daegu 41566, Korea
*
Author to whom correspondence should be addressed.
These authors contributed equally to this work as first author.
Appl. Sci. 2020, 10(19), 6944; https://doi.org/10.3390/app10196944
Submission received: 16 September 2020 / Revised: 28 September 2020 / Accepted: 30 September 2020 / Published: 4 October 2020
(This article belongs to the Section Materials Science and Engineering)

Abstract

:
There have been many studies on the effect of durability and compressive strength on the increase of the mixing rate of admixtures. However, there is no research that can provide a guide on the optimal mixture proportions for maintaining compressive strength and secure durability properties when using local materials. Therefore, the purpose of this article is to assess the durability and engineering performances of concrete based on local fly ash (FA), as well as to derive the optimum CaO content scope for ensuring durability. The results of this study were compared with the results of the previous study of high-volume ground-granulated blast-furnace slag (GGBFS) concrete. To achieve this, tests were carried out by increasing the admixture mixing rate in 10% increments from 0% to 70%. The unit water was set at 175 kg/m3 and the amount of binder was set at 330 kg/m3. It was found that the overall compressive strength of the hardened concrete decreased when the admixture mixing rate increased. In addition, the compressive strength of specimens tended to improve as all the CaO contents of the admixture types increased. When the durability properties were examined, it was found that the relative dynamic elasticity modulus and carbonation depth decreased, and the chloride penetration depth increased as the CaO content increased for both GGBFS and FA. The weight loss rate, however, remained similar. Based on the results of this study, the optimal CaO content that achieved satisfactory engineering and durability properties was found to be between 39% and 48% for FA. The results of this study will be able to offer guidelines for the mixture rates of FA when mixing durable concrete for use in the field. Additionally, these results are expected to be utilized as a basis for determining instructions relating to chemical composition in order to develop binders with improved durability.

1. Introduction

The new global standards in relation to engineering have resulted in the development of recycled building materials, as an increased amount of energy-saving and eco-friendly infrastructure is required [1,2]. Traditional concrete, the most frequently used building material worldwide, is known to result in severe environmental pollution because it uses both energy and raw materials in large quantities [3,4]. Therefore, research on methods to minimize its negative impact on the environment is essential. For this reason, ground-granulated blast-furnace slag (GGBFS) and fly ash (FA), which are industrial byproducts, have been extensively used as substitutes of ordinary Portland cement (OPC), and many related studies have been conducted on this subject [5,6,7]. GGBFS and FA act not only as alkali-activated materials (AAMs), but also as supplementary cementitious materials (SCMs) [8]. If admixtures are used as SCMs, they can improve the durability, long-term strength, and constructability of the fabricated concrete [9,10]. Geopolymers are a representative example of an admixture that may be used as an AAM. Xie et al. [11] experimentally verified that GGBFS- and FA-based geopolymers can provide the excellent sulfuric acid resistance of recycled concrete. AAMs, however, are not yet used in the field due to their fast setting time, large shrinkage, and high unit price. Therefore, an in-depth study on the usability of SCMs is required to improve their construction site applicability.
GGBFS is an industrial by-product, generated when producing pig iron. It turns into a granular and amorphous fine powder through quenching and grinding. GGBFS is mainly composed of SiO2, Al2O3, CaO, and MgO. Therefore, it can be called aluminosilicate, which uses CaO and MgO as its base components [12,13,14]. When in contact with water, GGBFS slowly undergoes a hydration reaction, and the reaction rate increases as the pH value is increased [10,15]. Khatib et al. [16] conducted an experiment by replacing up to 80% of cement with GGBFS and reported that compressive strengths equivalent to that of OPC concrete were obtained when the mixing rate was 60% or less. In particular, they verified that GGBFS is effective in improving the long-term strength of concrete by confirming that the compressive strength was increased after 28 days of aging. In addition, Parron-Rubio et al. [17] found that the specimens for which cement was replaced with GGBFS exhibited 10% higher compressive strength than the plain specimen after 90 days of aging. They also reported that the specimens with GGBFS showed similar or higher compressive strengths than the conventional concrete after seven days of aging.
Moreover, the durability of 100% OPC concrete could be improved by using GGBFS as an SCM [18]. The improvement of durable concrete is an important issue in relation to the extension of the service lives of concrete structures. It was verified that the use of GGBFS can improve the microstructures of concrete by adding a C-S-H phase, and it is effective in reducing the conductivity of chloride due to its provision of an increased alumina content [19]. Jang et al. [20] conducted a 180-day immersion test with a 30% CaCl2 solution and reported that the system with GGBFS and MgO endured damage far more effectively. Cheng et al. [21] claimed that the partial substitution of cement with GGBFS had a significant effect on the total flexural stiffness, corrosion rate, and permeability of a fabricated concrete beam.
FA is a byproduct of coal-fired power generation and can be used as an SCM in concrete [22]. Van Nguyen et al. [23] experimentally verified that the long-term compressive strength of concrete mixed with FA increases due to the continuous hydration process, even though its compressive strength decreases initially. They also reported that FA increases the sulfuric acid resistance of concrete but has a limited effect on reducing the corrosion potential of the steel reinforcement structures in concrete. According to Thomas et al. [24], the focus on the use of FA in concrete has shifted towards quantifying the benefits for boosting the sustainability of concrete. Moreover, Papadakis et al. [25] reported that the substitution of FA in an appropriate proportion can improve the chlorine resistance as well as the compressive strength of concrete.
As mentioned above, an increase in the admixture mixing rate generally improves the durability of concrete under the same mixing conditions, but decreases the compressive strength. There is, however, currently no study that presents guidelines for optimum mixing rates that can address compressive strength degradation and ensure durability using local GGBFS and FA materials in the actual field. There are also no practical data that can be used as a basis for determining the chemical compositions required to develop GGBFS- and FA-based binders with excellent durability. However, in a previous study, Lee [26] evaluated engineering performance and durability according to the CaO content rates of concrete mixed with high-volume GGBFS produced in a local area. The optimum range of CaO content was derived, which can secure durability. Therefore, studies related to concrete based on high-volume FA are urgently required.
In this article, the durability properties and engineering performance of binary mixed concrete with locally produced FA were evaluated to derive the optimum CaO content, to obtain concrete with remarkable durability for use in standard construction applications. In addition, by comparing the results of this study with those of previous studies, we intend to enhance its applicability for construction sites.

2. Experimental Procedure

2.1. Materials

Table 1 shows the chemical composition rate of the binders used. OPC showed the highest CaO content at 60.20%, whereas FA showed the highest SiO2 content at 57.90%. This result was derived from X-ray fluorescence, using Axios PW 4400 equipment (Malvern Panalytical, Seongnam-si, Korea). In addition, the second highest constituents of OPC and FA were SiO2 and Al2O3, respectively, indicating that the chemical composition of the two materials was significantly different. Table 2 summarizes the physical characteristics of OPC, FA, aggregate, and chemical admixture used in this study. The OPC type 1 was used according to KS L 5201 [27], and in the case of FA, type 2 was used according to KS L 5405 [28]. As fine aggregates, crushed sand and washed sea sand were blended at a weight rate of 60:40, respectively. In addition, crushed granitic aggregate was applied for coarse aggregate, and polycarboxylate superplasticizer (widely used in the field) was applied for the liquid admixture. The density and fineness of OPC and FA were calculated according to ASTM C188 [29] and ASTM C204 [30], respectively. The density and absorption of aggregates were calculated based on ASTM C127 [31], whereas the fineness modulus (FM) was calculated based on ASTM C136 [32].

2.2. Experimental Proceses

Table 3 shows the experimental design used in this study. The unit binder was set at 330 kg/m3, and the unit water was fixed at 175 kg/m3 according to the most commonly used mixing ratio standards in the local field. The test was carried out under the condition that the temperature was kept constant at 20 °C. The rate of the admixture changed between 0% and 70% using increments of 10%. The test parameters of this study consisted of 13 items, and were used to evaluate raw material properties, engineering properties, and durability properties. Table 4 shows the concrete mix table, and the mix ID is divided into 8 types, from Plain to F70. The water/binder ratio was fixed at 0.53. The standard of ready-mixed concrete was 25-24-180, which is most commonly used in the general field.

2.3. Testing Methods

Table 5 shows the testing methods used in terms of the items evaluated in this study. The results of all tests were calculated as the average value for three specimens. In evaluation parameter 1, for the raw material properties, the article size distribution and grading distribution were measured according to the standards of ASTM C204 [30] and ASTM C136 [32]. Furthermore, X-ray fluorescence (XRF), X-ray diffraction (XRD), and scanning electron microscopy (SEM) were used for microstructure analysis, and tests were performed according to the standards of ASTM C114 [33] and ASTM C457 [34], and ASTM C1723 [35], respectively. In evaluation parameter 2, slump and air volume tests were conducted based on ASTM C143 [36] and ASTM C231 [37]. For the compressive strength test, ASTM C873 [38] and ASTM C39 [39] were referenced. Compressive strength specimens were fabricated at a columnar mold (size: Ø 100 × 200 mm) for these tests.
In evaluation parameter 3, for checking the chloride penetration and carbonation depth, KS F 2584 (columnar specimen size: Ø 100 × 200 mm) [40] and NT Build 492 (columnar specimen size: Ø 100 × 50 mm) [41] were used as the test standardization. In addition, the test for the relative dynamic elasticity modulus and weight loss rate were conducted according to ASTM C666 (cubic specimen size: 100 × 100 × 400 mm) [42]. For this test, a specimen was prepared and standard curing was performed until the age of 28 days, and then an accelerated carbonization test was performed. At this time, the accelerated carbonation was set under the conditions of 10% CO2 concentration, 60% ± 3% relative humidity, and 20 °C ± 1 °C temperature. The carbonation depth was measured by spraying a 1% phenolphthalein solution at the age of 4 and 8 weeks. In addition, 0.5 M NaCl solution was used as a negative electrode cell solution and a saturated Ca(OH)2 solution was used as a positive electrode cell solution in order to test the chlorine ion penetration resistance according to the potential difference.

3. Experimental Test Results

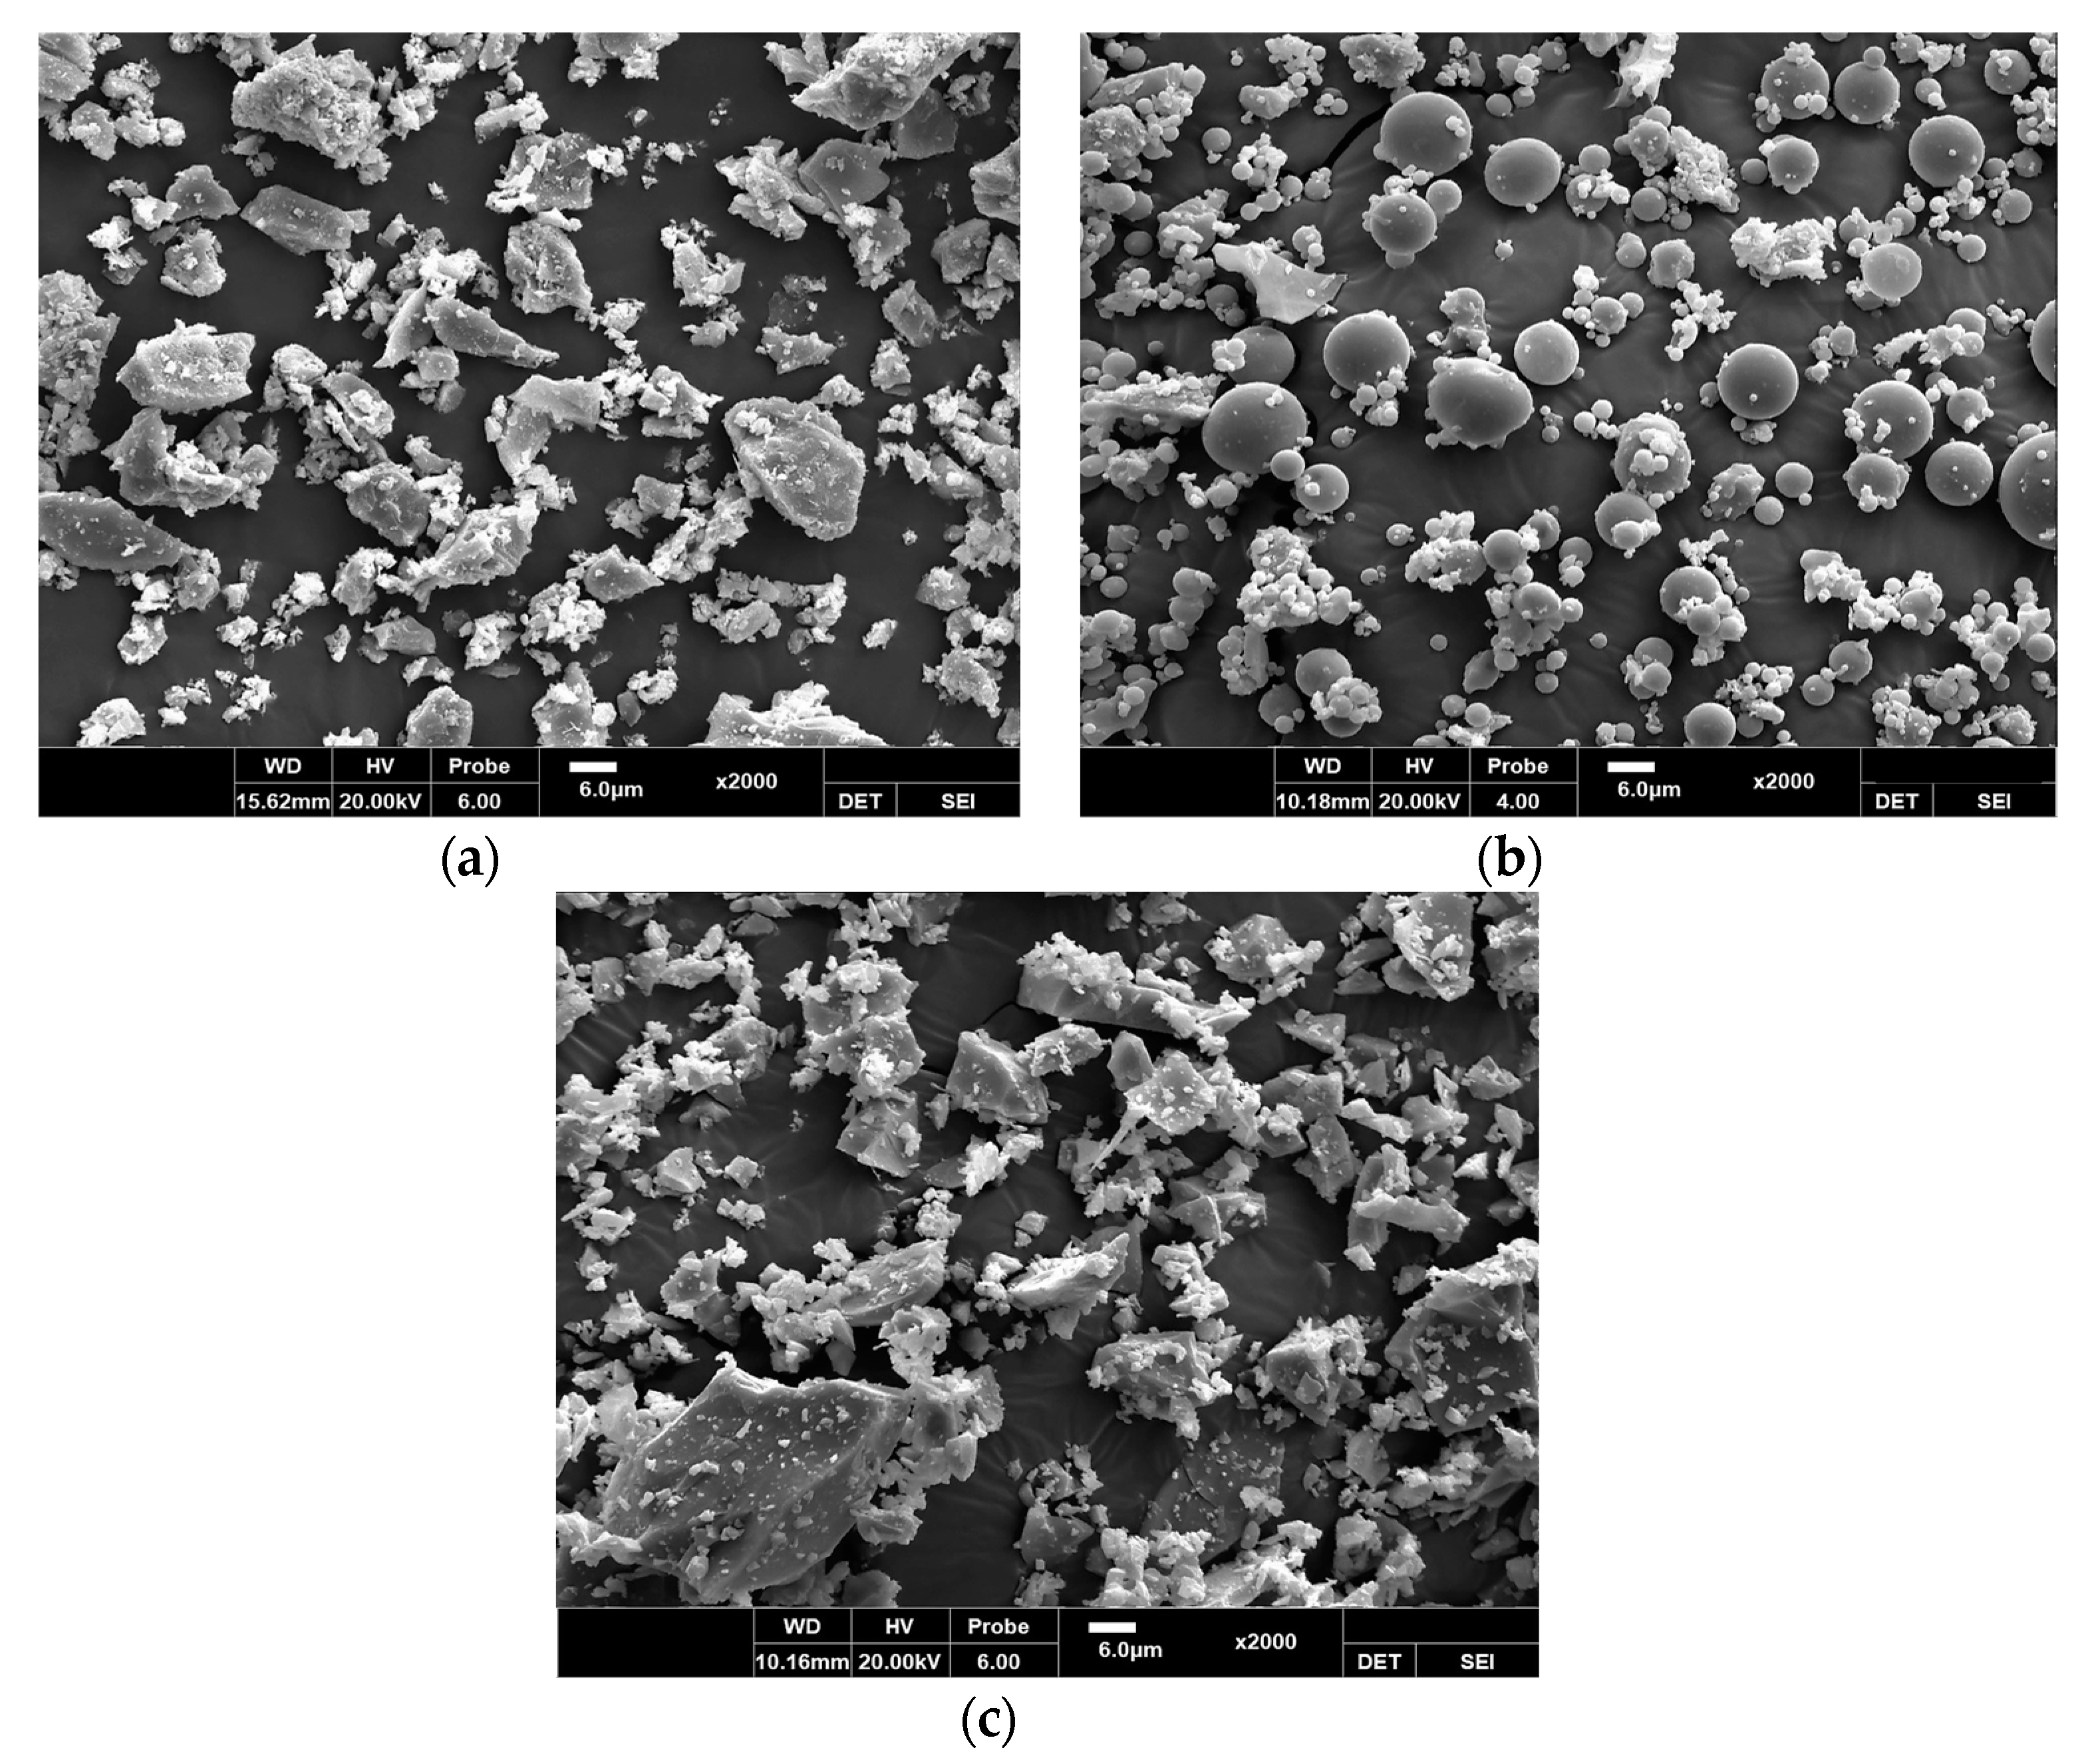
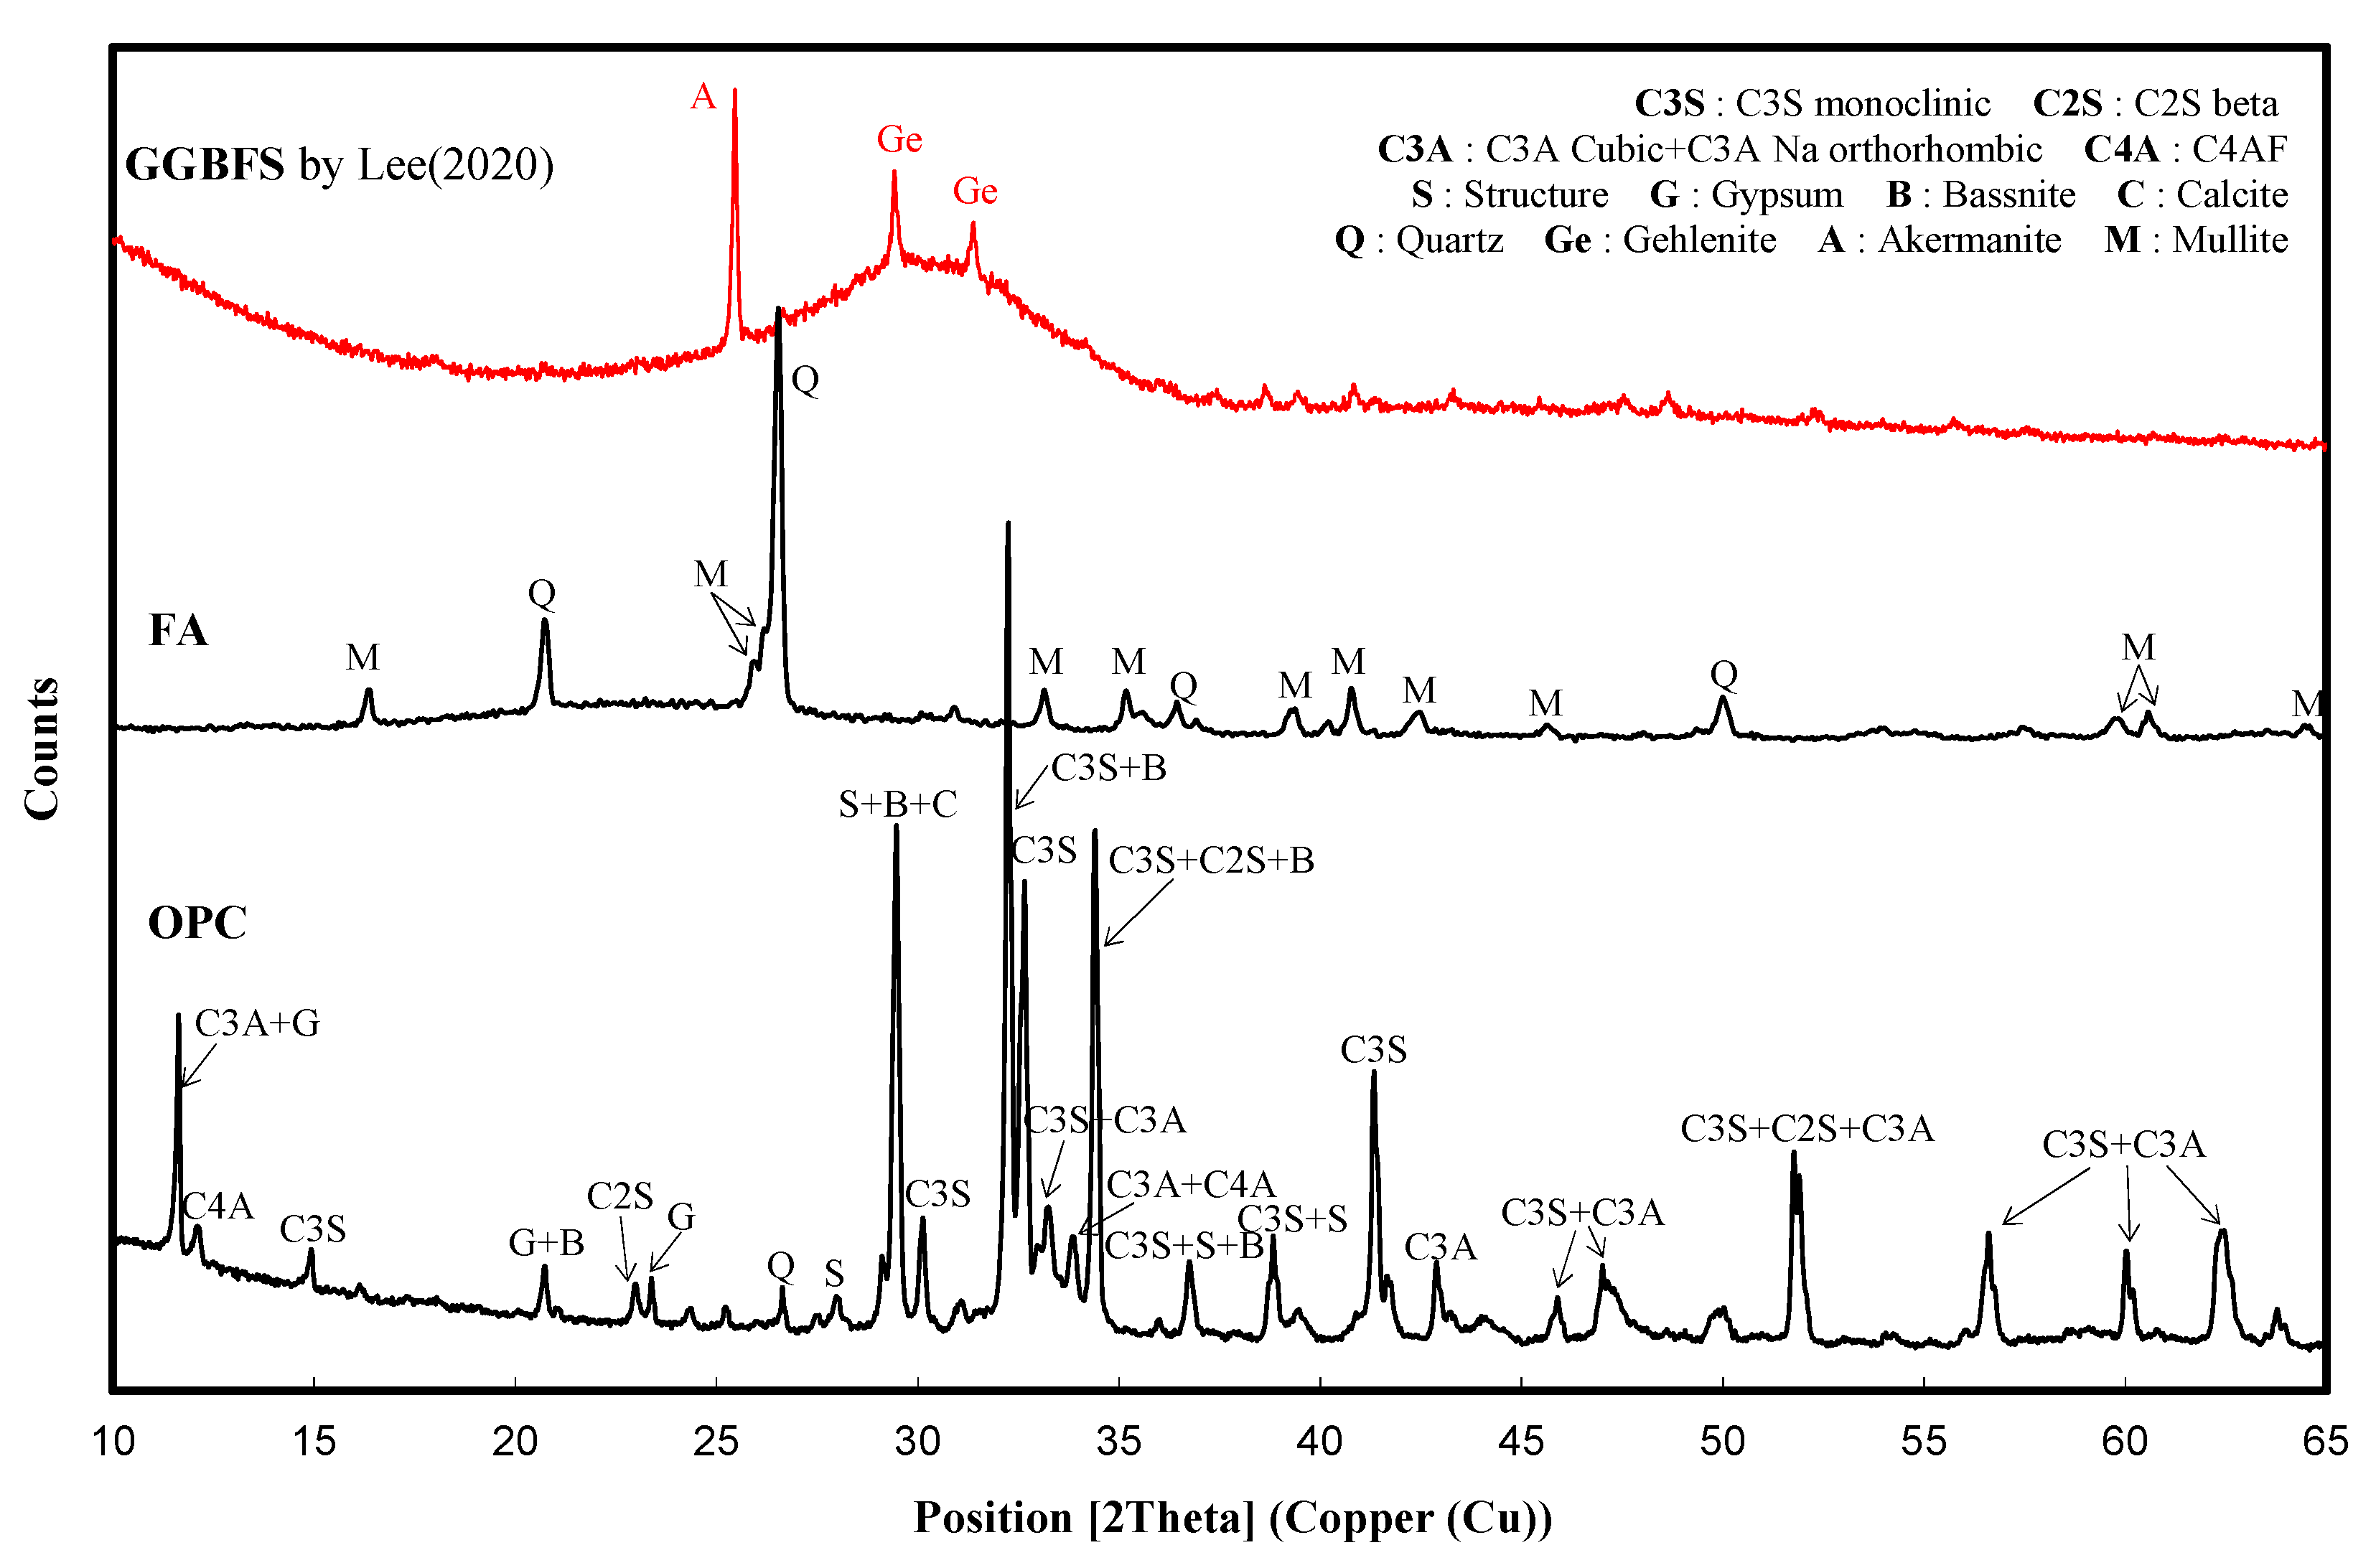
3.1. Raw Material Properties

The particle size distributions of OPC and FA are showed in Figure 1, and are compared with the results of GGBFS obtained by Lee [26]. The mean sizes and fineness moduli of OPC, GGBFS, and FA were measured to be 19.46 μm and 1.18, 22.47 μm and 1.08, and 21.30 μm and 1.23, respectively. As shown in Figure 2, to compare the shape of the grain of the OPC, GGBFS, and FA powders, SEM analysis was conducted using a Genesis-2020 (Emcrafts, Gwangju-si, Korea). It was observed that OPC and GGBFS similarly appeared as ellipsoidal polyhedrons when their particles were larger than 10 μm and as atypical crystals when the particles were smaller than 10 μm, through SEM imaging. In the case of FA, however, a spherical shape and atypical crystals were observed.
In addition, for analyzing the grading of the coarse and fine aggregates, sieve analysis was carried out. The analysis results satisfied all the cumulative passing criteria based on ASTM C136 [33] according to the sieve opening size for the fine and coarse aggregates, as shown in Figure 3. The FM of the mixed fine aggregate was found to be 2.84, whereas that of the coarse aggregate was found to be 6.94. In order to know the types of crystalline substances contained in particles by binder types used, X’pert3 Powder PW 3050 equipment (Malvern Panalytical, Seongnam-si, Korea) was used to analyze the XRD patterns and the result is shown in Figure 4. It was found that OPC was primarily composed of 3CaO∙SiO2 (C3S), 2CaO∙SiO2 (C2S), 3CaO∙Al2O3 (C3A), and 4CaO∙Al2O3∙Fe2O3 (C4AF) minerals. In addition, GGBFS was formed of akermanite (2CaO·MgO·2SiO2) and gehlenite (2CaO·Al2O3·SiO2) minerals. Li et al. [43] reported that GGBFS contains a mixture of depolymerized calcium aluminosilicate glass in addition to the two minerals. On the other hand, FA was composed of mullite and quartz minerals.

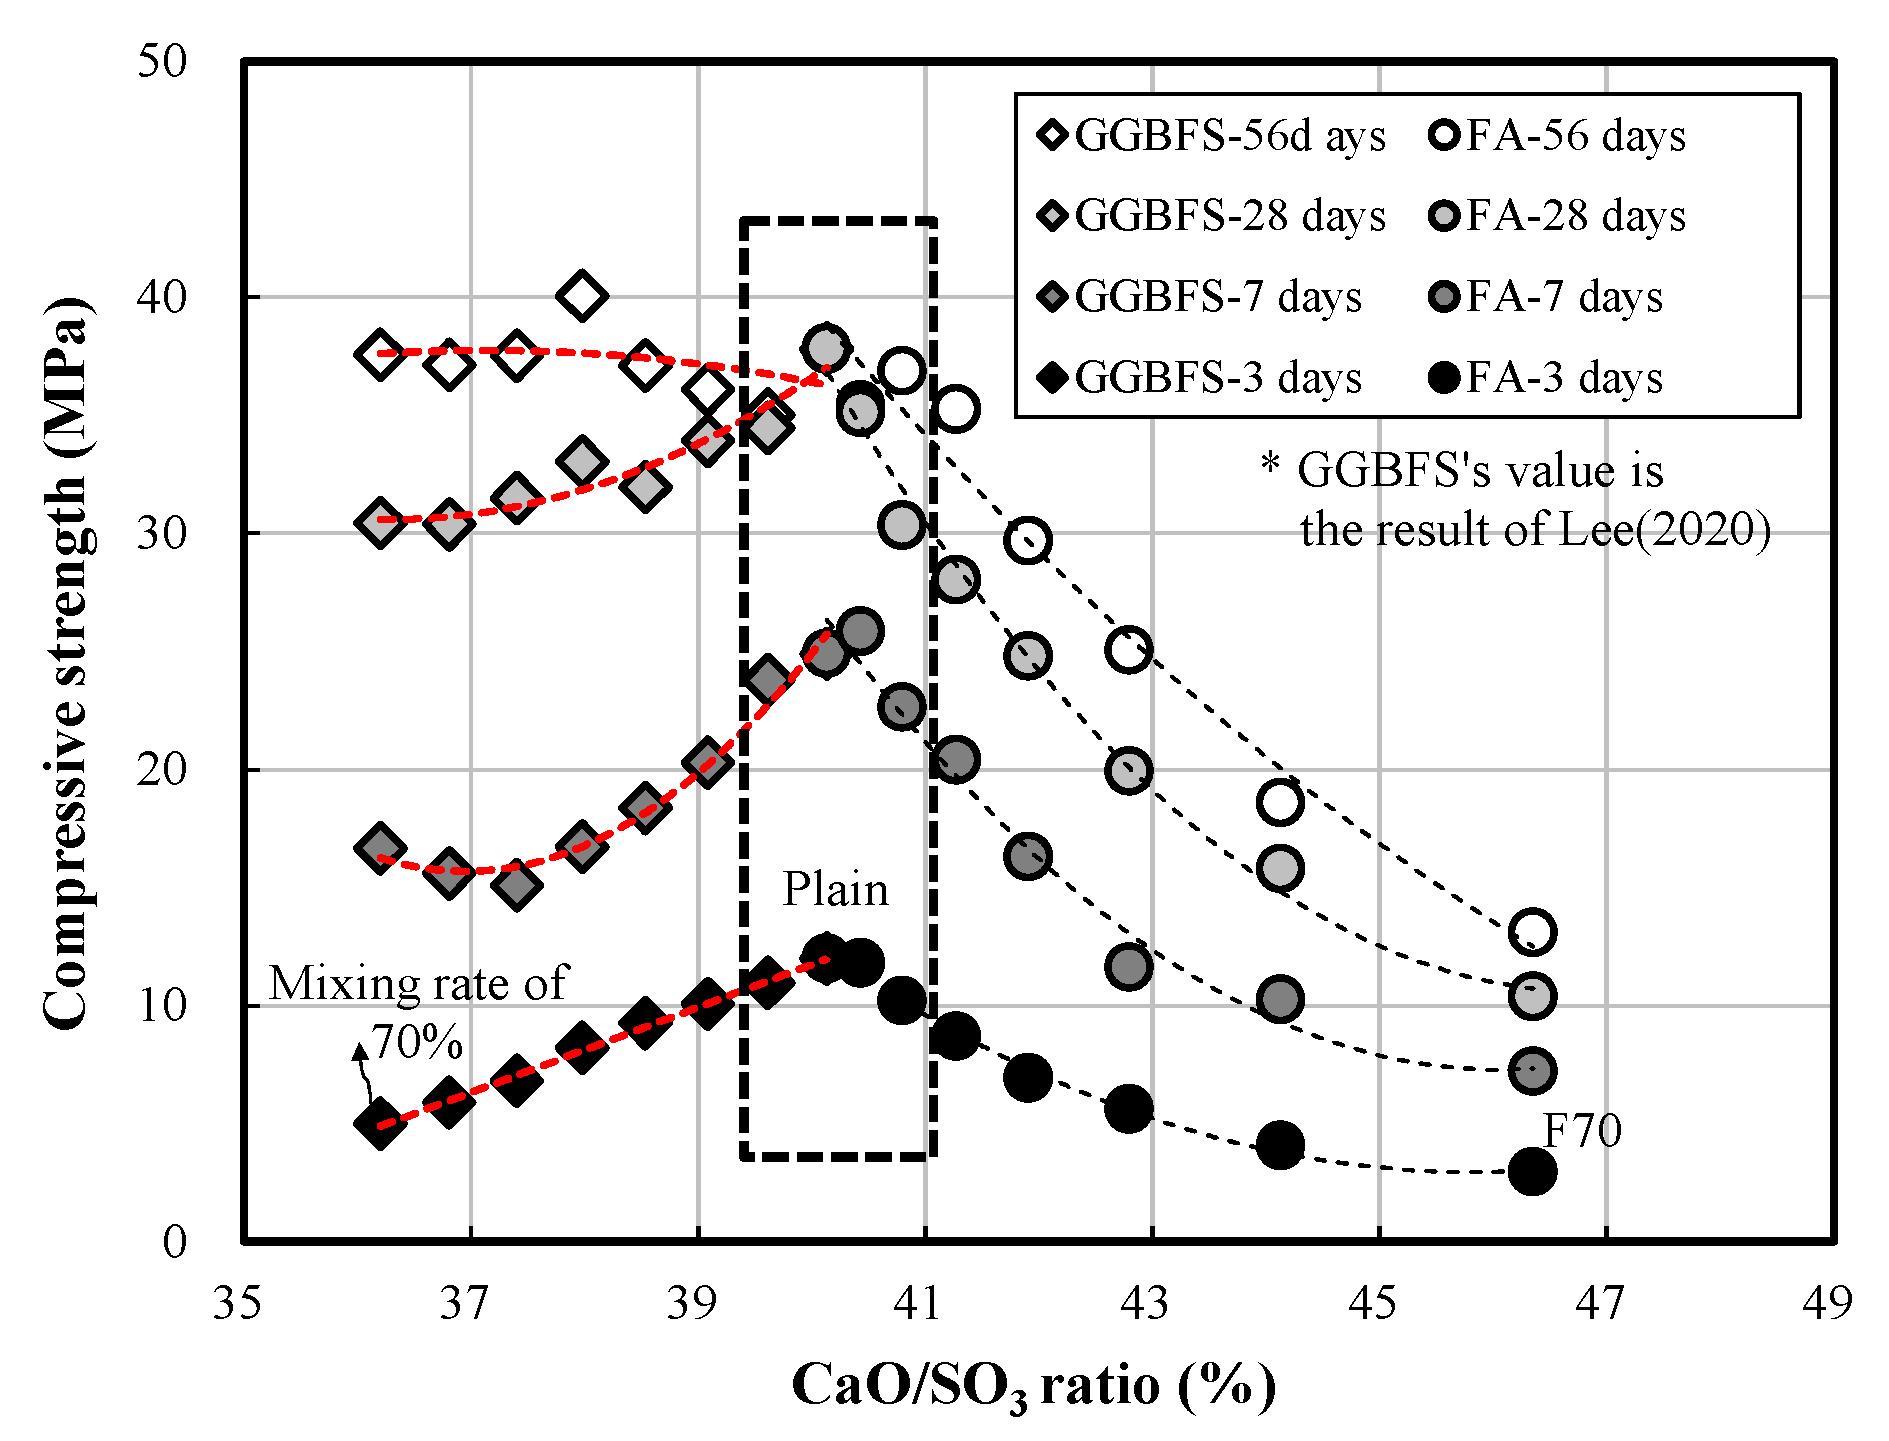
3.2. Engineering Properties

Figure 5 shows the measured values of slump and air content of OPC and FA compared with GGBFS by Lee [26] for fresh concrete by the admixture mixing rate. The slumps of GGBFS and FA were 165~205 mm and 195~205 mm, whereas the air contents were 4.1%~5.3% and 4.6%~5.7%, respectively. Therefore, the slump was suitable for the target value of 180 ± 25 mm, and the air content also was within the standards of 4.5% ± 1.5% for all mixing proportions. Under the same mixing conditions, both the slump and air content of FA were found to have lower properties than those of GGBFS. In this study, to examine the influences of the admixture type and mixing rate on workability, the water content required to guarantee the target slump range of 180 ± 25 mm was measured after fixing the unit binder content and chemical admixture content at 330 and 2.31 kg/m3, respectively. As shown in Figure 6, it was found that the unit water content decreased by approximately 2.75 kg/m3 for GGBFS and 3.00 kg/m3 for FA as the admixture mixing rate increased by 10%. This indicates that workability can be improved through the substitution of the admixtures under the same unit binder content conditions, and that FA demonstrates a higher workability improvement effect than GGBFS at the same mixing rate.
Figure 7 shows the compressive strength of OPC and FA compared with GGBFS by Lee [26] at different ages for each admixture mixing rate. Overall, FA exhibited less compressive strength development with aging than GGBFS. At 3 and 7 days of aging, the GGBFS and FA specimens began to show a difference in compressive strengths when the admixture mixing rate was 40%. At 28 and 56 days of age, conversely, a difference in these compressive strengths occurred when the admixture mixing rates were 10% and 30%, respectively. To examine the compressive strength development rate with aging, the compressive strength rate—compressive strength of FA/compressive strength of GGBFS—was calculated according to the admixture mixing rate, as shown in Figure 8. The result showed a tendency to decrease along the curve of a quadratic equation as the admixture mixing rate increased, even though the error range increased.
Figure 9 shows that the compressive strength tended to slightly decrease, except at 28 days of aging, as the GGBFS mixing rate increased. FA exhibited larger decrements in compressive strength than GGBFS at all ages. To examine the long-term strength development rate of each admixture after 28 days of aging, an analysis was conducted, as shown in Figure 10. Both GGBFS and FA exhibited high long-term strength development rates as the mixing rate exceeded 15%. In particular, the development rate of GGBFS was higher than that of FA, indicating that GGBFS has a higher strength improvement effect after 28 days than FA at the same mixing rate.

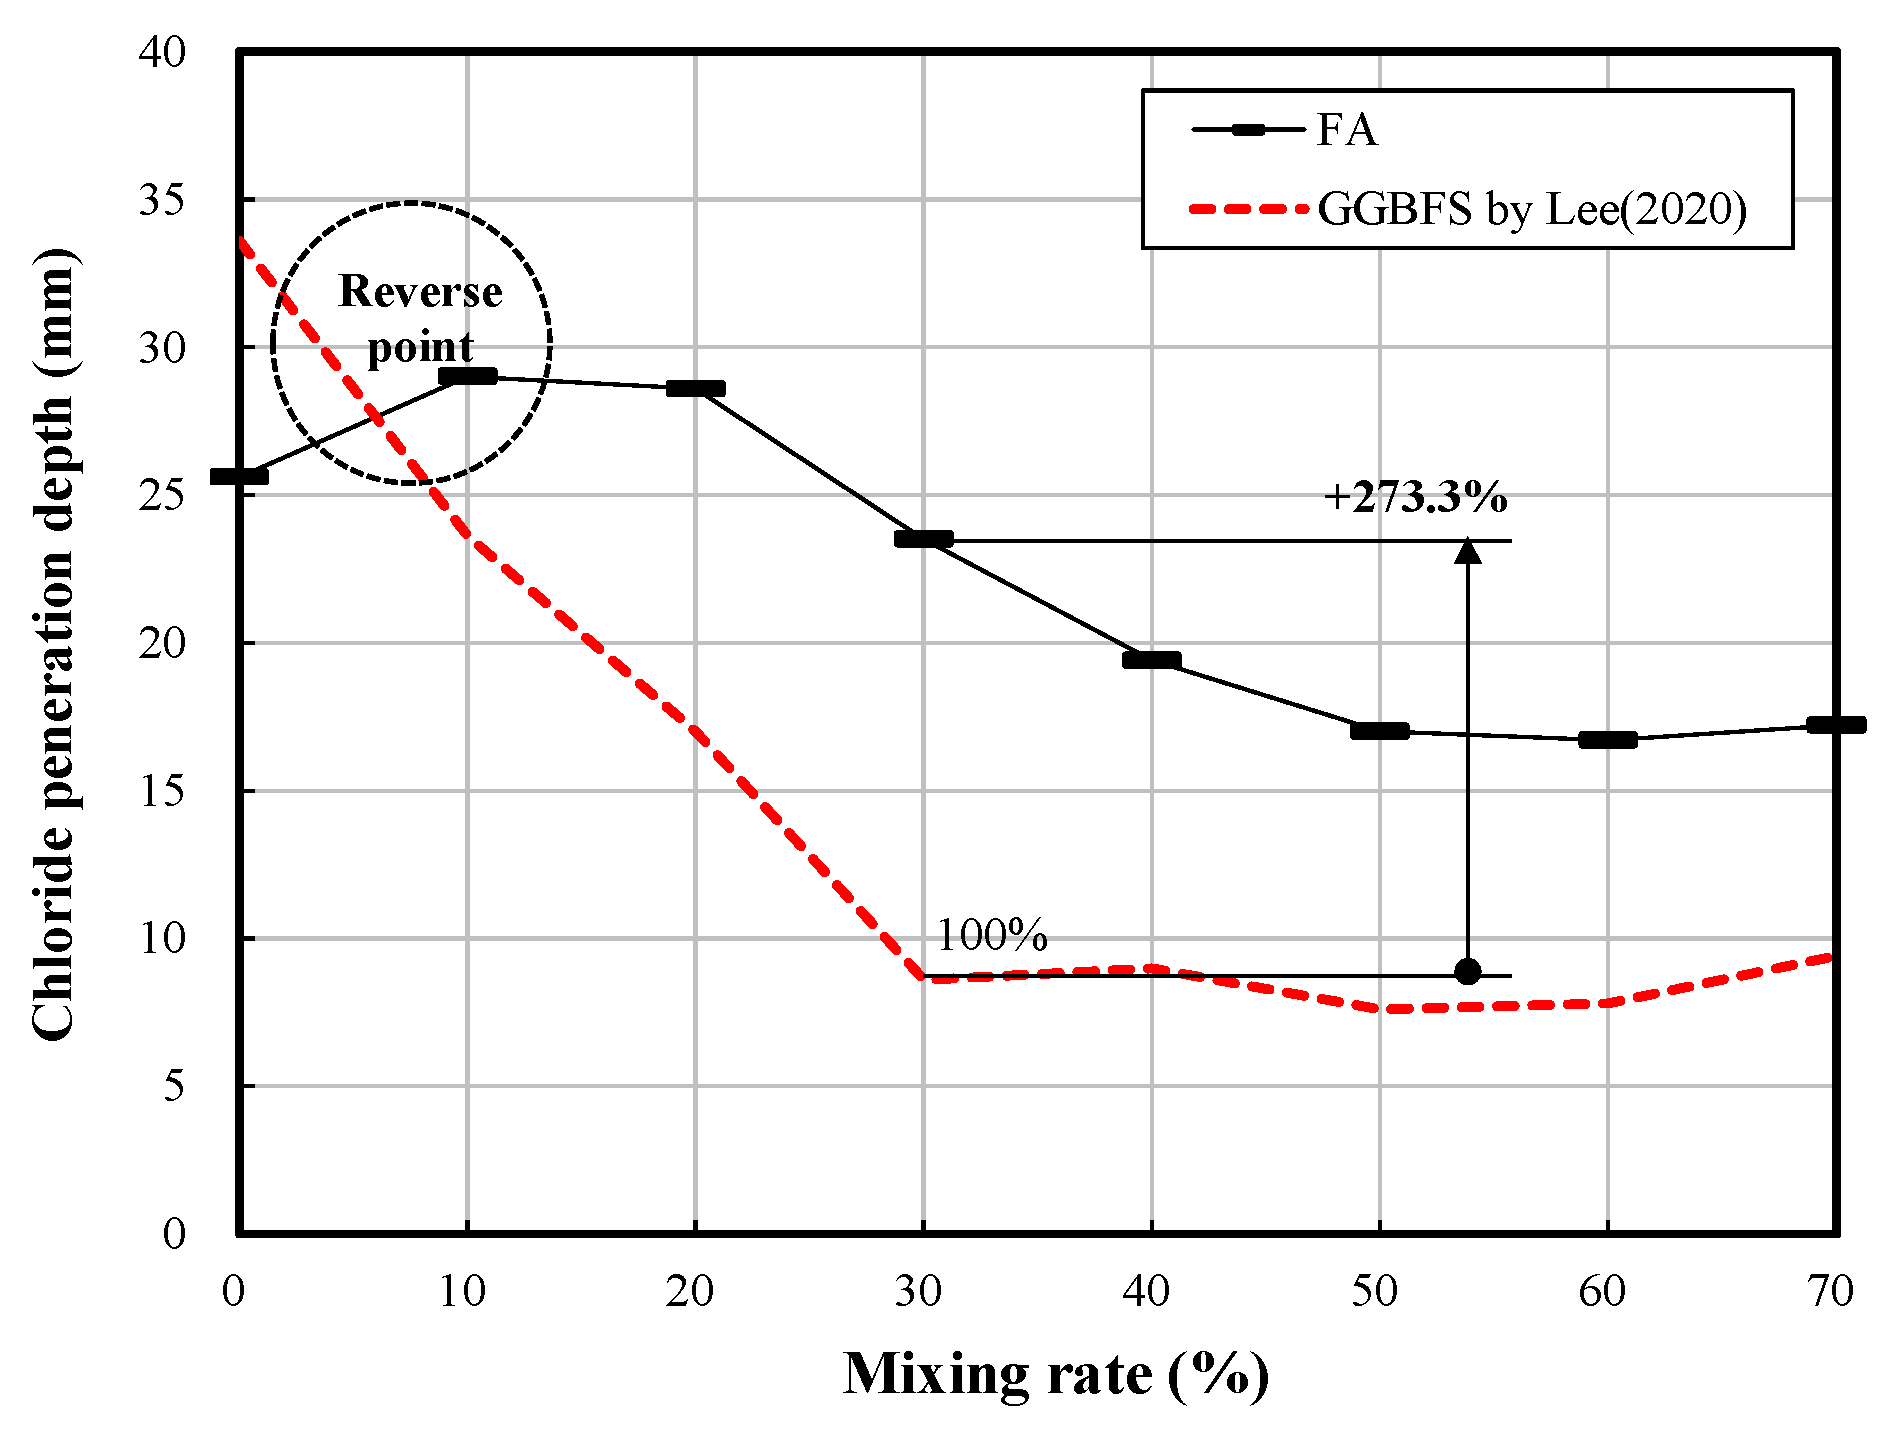
3.3. Durability Properties

Figure 11 shows the measured values of carbonation depth of OPC and FA compared with GGBFS as measured by Lee [26], according to the mixing rate. The carbonation depth also tended to increase as the admixture mixing rate increased. At an age of eight weeks, the carbonation depth of GGBFS grew up to about 161.7% in comparison with the lowest value, 70% mixing rate. In addition, the carbonation depth of FA increased to approximately 379.0% under the same conditions. FA exhibited a relatively higher carbonation depth than GGBFS at the same mixing rate, confirming that FA has a lower carbonation resistance than GGBFS at the same mixing rate.
Figure 12 shows the measured values of chloride penetration depth by the admixture mixing rate. The results showed a tendency to decrease as the mixing rate increased. The rate of the highest and the lowest value was 442.1% for GGBFS and 153.3% for FA, indicating that the substitution of GGBFS is more beneficial than that of FA in terms of a resistance towards chloride. It is necessary to further examine the appropriate mixing rates for each admixture type in terms of the carbonation depth and chloride penetration depth for their application in the field.
Tests for weight reduction rates and relative dynamic elasticity modulus were performed to evaluate the influences of the admixture mixing rate on freeze-thawing and different chemical attacks.
Figure 13 shows the relative dynamic elasticity modulus of OPC and FA compared with GGBFS as measured by Lee [26], according to the mixing rate. As the admixture mixing rate increased, the relative dynamic elasticity modulus tended to go up. Under the same mixing conditions, FA more rapidly increased towards 100% than GGBFS and exhibited higher relative dynamic elasticity modulus values.
To review the influences of the admixture mixing rate on the specimens’ surface degradation, the weight loss rate was measured by the admixture mixing rate, as shown in Figure 14. The FA and GGBFS specimens reached 100% or higher when the mixing rate exceeded 5% and 15%, respectively. This indicates that it is necessary to design the mixing proportions reflecting the weight reduction rate and relative dynamic elasticity modulus for application in construction sites.

4. Discussions

4.1. Engineering Properties Determined via Chemical Composition

Figure 15 shows the measured values of CaO content and CaO/SO3 rate according to the admixture mixing rate. As the mixing rate increased, the CaO content and CaO/SO3 rate of GGBFS decreased to 82.2% and 90.2%, respectively. In the case of FA, conversely, the CaO content decreased to 34.7% and the CaO/SO3 rate increased to 110.9%. Moreover, the representative chemical components (SO3, CaO, and Fe2O3) tended to decrease, whereas CaO, Fe2O3, and SO3 increased as the mixing rate of GGBFS increased. For FA, SiO2, Al2O3, and Fe2O3 increased, whereas CaO, MgO, and SO3 decreased.
Figure 16 shows the measured values of CaO/SiO2 and SiO2/Al2O3 molar rates according to the admixture mixing rate. As the GGBFS mixing rate increased, both the CaO/SiO2 and SiO2/Al2O3 molar rates decreased. In the case of FA, however, the CaO/SiO2 molar rate increased and the SiO2/Al2O3 molar rate decreased. When regression analysis was conducted using the triangular graph of the CaO/SiO2 and SiO2/Al2O3 molar rates, it was confirmed that GGBFS is more beneficial in terms of long-age strength and less beneficial in terms of rapid hardening compared to FA.
Figure 17a shows the compressive strength of the fabricated specimens by the CaO content. As the unit CaO weight went up, the compressive strength also tended to increase. When the CaO content was between 49.49% and 58.67%, however, the compressive strength of GGBFS was lower than that of FA at ages of 3 and 7 days. This appears to be because GGBFS is less beneficial in terms of rapid hardening compared to FA, as indicated in the results of Figure 16. Figure 17b shows the compressive strength development rate of each admixture by age. As the CaO content increased, the compressive strength development rate tended to slightly decrease. In the case of the GGBFS specimens, in particular, the strength development rate was higher for strengths at the early ages.
Figure 18 shows the compressive strength of each admixture type by the CaO/SO3 rate. As the CaO/SO3 rate increased, the compressive strength of the GGBFS specimens showed a tendency to increase except at 56 days of age, whereas that of the FA specimens showed a tendency to decrease at all ages.

4.2. Derivation of an Optimum CaO Content Range

Figure 19 shows the optimum CaO content range for ensuring an adequate durability performance, which was derived for FA by considering all of the contents mentioned above. For concrete replaced with FA to ensure an adequate durability properties, it is desirable to reduce the carbonation and chloride penetration depth while maximizing the relative dynamic elasticity modulus and weight reduction rate when mixing concrete.
As can be seen from Figure 19, the optimum CaO content of FA was found to be between 39% and 48%. This corresponds to a FA mixing rate range between 21.7% and 37.7%. In this range, the compressive strength value at the age of 28 days was found to be between 25.1 and 31.0 MPa, which exceeded the target compressive strength (fck = 24 MPa). For reference, according to a previous study by Lee [26], the optimum CaO content of GGBFS used to satisfy all of the four durability test conditions was found to be between 53% and 56%. This corresponds to a GGBFS mixing rate range between 27.5% and 47.1%. Therefore, the optimum mixing rate of FA was evaluated to be slightly lower than that of GGBFS.

5. Conclusions

In this article, the engineering performance and durability properties of binary blended concrete containing a large amount of fly ash (FA) were evaluated, and the optimum CaO content range to ensure adequate durability was deduced by each admixture type. In addition, the results of this study and the results of a previous study by Lee [25,27] on high-volume GGBFS concrete were compared with each other on the basis of various properties. The conclusions of this article are as follows:
(1) When the unit content of water required to ensure the target slump range of 180 ± 25 mm was measured after fixing the unit binder content and chemical admixture content in fresh concrete, it was found that the unit water content decreased by 3.00 kg/m3 in the case of FA (approximately 2.75 kg/m3 for GGBFS) as the admixture mixing rate increased by 10%.
(2) In hardened concrete, the compressive strength decreased when the admixture mixing rate increased, and FA more significantly reduced the compressive strength than GGBFS. In addition, it was found that both GGBFS and FA increased the compressive strength development rate after 28 days of aging when the admixture mixing rate exceeded 15%.
(3) The overall compressive strength increased as the CaO content increased, regardless of the admixture type. When the CaO content was between 49.49% and 58.67%, however, the compressive strength of GGBFS was lower than that of FA at ages of 3 and 7 days. The GGBFS specimens exhibited higher compressive strength development rates at the early ages.
(4) When the durability properties were examined, it was found that the depth of carbonation and relative dynamic elasticity modulus decreased, whereas the depth of chloride penetration tended to increase as the CaO content increased for both GGBFS and FA. The weight loss rate, however, was relatively unchanged.
(5) The optimum CaO content satisfying all of the desired engineering and durability properties required in this study was found to be between 39% and 48% for FA (i.e., an FA mixing rate of 21.7% to 37.7%). Therefore, the optimum CaO content of FA was found to be slightly lower than the results of the previous study (i.e., between 53% and 56% for GGBFS).
The engineering and durability property evaluation data comparing FA and GGBFS derived in this study and the optimum CaO content ranges derived to secure durability will be able to provide guidelines for mixing proportions when applying high-volume FA-based concrete in local construction fields in future projects. They are also anticipated to be utilized as a basis for determining chemical composition standards for developing binders to improve the durability of the fabricated concrete.

Author Contributions

J.L., T.L., and H.C. equally contributed to the research conceptualization and all investigations performed under its purview. Resource procurement was handled by J.L. and T.L. The original draft of the manuscript was prepared by J.L. and T.L., whereas the final draft was reviewed and edited by J.L., T.L., D.-E.L., and H.C. All authors have read and agreed to the published version of the manuscript.

Funding

This work was supported by the National Research Foundation of Korea (NRF) grant funded by the Korea government (MSIT) (No. NRF-2018R1A5A1025137).

Conflicts of Interest

The authors declare no conflict of interest. The funders had no role in the design of the study; in the collection, analyses, or interpretation of data; in the writing of the manuscript, or in the decision to publish the results.

References

  1. Szweda, Z.; Ponikiewski, T.; Katzer, J. A study on replacement of sand by granulated ISP slag in SCC as a factor formatting its durability against chloride ions. J. Clean. Prod. 2017, 156, 569–576. [Google Scholar] [CrossRef]
  2. Rafal, L.; Piotr, W.; Karol, K. Sustainable Concrete Performance-CO2-Emission. Environments 2018, 5, 27. [Google Scholar]
  3. Bulatović, V.; Melešev, M.; Radeka, M.; Radonjanin, V.; Lukić, I. Evaluation of sulfate resistance of concrete with recycled and natural aggregates. Constr. Build. Mater. 2017, 152, 614–631. [Google Scholar] [CrossRef]
  4. Lee, J.; Kim, G.; Kim, Y.; Mun, K.; Nam, J. Engineering properties and optimal conditions of cementless grouting materials. Materials 2019, 12, 3059. [Google Scholar] [CrossRef] [Green Version]
  5. Crossin, E. The greenhouse gas implications of using ground granulated blast furnace slag as a cement substitute. J. Clean. Prod. 2015, 95, 101–108. [Google Scholar] [CrossRef]
  6. Lin, K.; Wang, K.; Tzeng, B.; Lin, C. The reuse of municipal solid waste incinerator fly ash slag as a cement substitute. Resour. Conserv. Recycl. 2003, 39, 315–324. [Google Scholar] [CrossRef]
  7. Shang, J.; Dai, J.; Zhao, T.; Guo, S.; Zhang, P.; Mu, B. Alternation of traditional cement mortars using fly ash-based geopolymer mortars modified by slag. J. Clean. Prod. 2018, 203, 746–756. [Google Scholar] [CrossRef]
  8. Lee, J.; Lee, T. Effects of high CaO FA and sulfate activator as a finer binder for cementless grouting material. Materials 2019, 12, 3664. [Google Scholar] [CrossRef] [Green Version]
  9. Çakır, Ö.; Aköz, F. Effect of curing conditions on the mortars with and without GGBFS. Constr. Build. Mater. 2008, 22, 308–314. [Google Scholar] [CrossRef]
  10. Özbay, E.; Erdemir, M.; Durmuş, H.İ. Utilization and efficiency of ground granulated blast furnace slag on concrete properties–A review. Constr. Build. Mater. 2016, 105, 423–434. [Google Scholar] [CrossRef]
  11. Xie, J.; Zhao, J.; Wang, J.; Wang, C.; Huang, P.; Fang, C. Sulfate resistance of recycled aggregate concrete with GGBS and FA-based geopolymer. Materials 2019, 12, 1247. [Google Scholar] [CrossRef] [PubMed] [Green Version]
  12. Pal, S.C.; Mukherjee, A.; Pathak, S.R. Investigation of hydraulic activity of ground granulated blast furnace slag in concrete. Cem. Concr. Res. 2003, 33, 1481–1486. [Google Scholar] [CrossRef]
  13. Jin, F.; Gu, K.; Al-Tabbaa, A. Strength and hydration properties of reactive MgO-activated ground granulated blastfurnace slag paste. Cem. Concr. Compos. 2015, 57, 8–16. [Google Scholar] [CrossRef] [Green Version]
  14. Lee, J.; Lee, T. Influences of Chemical Composition and Fineness on the Development of Concrete Strength by Curing Conditions. Materials 2019, 12, 4061. [Google Scholar] [CrossRef] [PubMed] [Green Version]
  15. Yi, Y.; Gu, L.; Liu, S.; Jin, F. Magnesia reactivity on activating efficacy for ground granulated blastfurnace slag for soft clay stabilisation. Appl. Clay Sci. 2016, 126, 57–62. [Google Scholar] [CrossRef]
  16. Khatib, J.; Hibbert, J.; Khatib, J. Selected engineering properties of concrete incorporating slag and metakaolin. Constr. Build. Mater. 2005, 19, 460–472. [Google Scholar] [CrossRef]
  17. Parron-Rubio, M.E.; Perez-Garcia, F.; Gonzalez-Herrera, A.; Oliveira, M.J.; Rubio-Cintas, M.D. Slag Substitution as a Cementing Material in Concrete: Mechanical, Physical and Environmental Properties. Materials 2019, 12, 2845. [Google Scholar] [CrossRef] [Green Version]
  18. Uysal, M.; Sumer, M. Performance of self-compacting concrete containing different mineral admixtures. Constr. Build. Mater. 2011, 25, 4112–4120. [Google Scholar] [CrossRef]
  19. Otieno, M.; Beushausen, H.; Alexander, M. Effect of chemical composition of slag on chloride penetration resistance of concrete. Cem. Concr. Compos. 2014, 46, 56–64. [Google Scholar] [CrossRef]
  20. Jang, J.K.; Kim, H.G.; Kim, J.H.; Ryou, J.S. The evaluation of damage effects on MgO added concrete with slag cement exposed to calcium chloride deicing salt. Materials 2018, 11, 793. [Google Scholar] [CrossRef] [Green Version]
  21. Cheng, A.; Huang, R.; Wu, J.K.; Chen, C.H. Influence of GGBS on durability and corrosion behavior of reinforced concrete. Mater. Chem. Phys. 2005, 93, 404–411. [Google Scholar] [CrossRef]
  22. Balakrishnan, B.; Abdul Awal, A.S.M. Durability properties of concrete containing high volume Malaysian FA. Int. J. Res. Eng. Technol. 2014, 4, 529–533. [Google Scholar]
  23. Van Nguyen, C.; Lambert, P.; Hung Tran, Q. Effect of Vietnamese FA on selected physical properties, durability and probability of corrosion of steel in concrete. Materials 2019, 12, 593. [Google Scholar] [CrossRef] [Green Version]
  24. Thomas, M.; Shehata, M.; Shashiprakash, S. The use of FA in concrete: Classification by composition. Cem. Concr. Aggreg. 1999, 21, 105–110. [Google Scholar]
  25. Papadakis, V.G.; Tsimas, S. Supplementary cementing materials in concrete—Part I: Efficiency and design. Cem. Concr. Res. 2002, 32, 1525–1532. [Google Scholar] [CrossRef]
  26. Lee, J.; Lee, T. Durability and Engineering Performance Evaluation of CaO Content and Rate of Binary Blended Concrete Containing Ground Granulated Blast-Furnace Slag. Appl. Sci. 2020, 10, 2504. [Google Scholar] [CrossRef] [Green Version]
  27. Korean Standards Association. Portland Cement (KS L 5201); Korean Industrial Standards: Seoul, Korea, 2006; pp. 1–8. [Google Scholar]
  28. Korean Standard Association. KS L 5405, FA; Korean Standard Association: Seoul, Korea, 2016. [Google Scholar]
  29. ASTM. ASTM C188-17. Standard Test Method for Density of Hydraulic Cement; American Society of Testing and Materials: West Conshohocken, PA, USA, 2017. [Google Scholar]
  30. ASTM. ASTM C204. Standard test methods for fineness of hydraulic cement by air-permeability apparatus. In Annual Book of ASTM; American Society of Testing and Materials: West Conshohocken, PA, USA, 2007. [Google Scholar]
  31. ASTM. ASTM C127-15. Standard Test Method for Relative Density (Specific Gravity) and Absorption of Coarse Aggregate; American Society of Testing and Materials: West Conshohocken, PA, USA, 2015. [Google Scholar]
  32. ASTM. ASTM C136/C136M-19. Standard Test Method for Sieve Analysis of Fine and Coarse Aggregates; American Society of Testing and Materials: West Conshohocken, PA, USA, 2019. [Google Scholar]
  33. ASTM. ASTM C114-18. Standard Test Methods for Chemical Analysis of Hydraulic Cement; American Society of Testing and Materials: West Conshohocken, PA, USA, 2018. [Google Scholar]
  34. ASTM. ASTM C457/C457M. Standard Test Method for Microscopical Determination of Parameters of the Air-Void System in Hardened Concrete; American Society of Testing and Materials: West Conshohocken, PA, USA, 2016. [Google Scholar]
  35. ASTM. ASTM C1723-16. Standard Guide for Examination of Hardened Concrete Using Scanning Electron Microscopy; American Society of Testing and Materials: West Conshohocken, PA, USA, 2016. [Google Scholar]
  36. ASTM. ASTM C143/C143M. Standard Test Method for Slump of Hydraulic-Cement Concrete; American Society of Testing and Materials: West Conshohocken, PA, USA, 2020. [Google Scholar]
  37. ASTM. ASTM C231/C231M. Standard Test Method for Air Content of Freshly Mixed Concrete by the Pressure Method; American Society of Testing and Materials: West Conshohocken, PA, USA, 2017. [Google Scholar]
  38. ASTM. ASTM C873/C873M. Standard Test Method for Compressive Strength of Concrete Cylinders Cast in Place in Cylindrical Molds; American Society of Testing and Materials: West Conshohocken, PA, USA, 2015. [Google Scholar]
  39. ASTM. ASTM C39/C39M. Standard Test Method for Compressive Strength of Cylindrical Concrete Specimens; American Society of Testing and Materials: West Conshohocken, PA, USA, 2018. [Google Scholar]
  40. Korean Standards Association. Standard Test Method for Accelerated Carbonation of Concrete [KS F 2584]; Korean Standards Association: Seoul, Korea, 2015. [Google Scholar]
  41. NT Build 492. Chloride Migraten Coefficient from Non Steady State Migraten Experiments; NORDTEST METHOD: Espoo, Finland, 1999.
  42. ASTM. ASTM C666/C666M. Standard Test Method for Resistance of Concrete to Rapid Freezing and Thawing; American Society of Testing and Materials: West Conshohocken, PA, USA, 2015. [Google Scholar]
  43. Li, C.; Sun, H.; Li, L. A review: The comparison between alkali-activated slag (Si+ Ca) and metakaolin (Si+ Al) cements. Cem. Concr. Res. 2010, 40, 1341–1349. [Google Scholar] [CrossRef]
Figure 1. The particle size distributions of OPC and FA compared with ground-granulated blast-furnace slag (GGBFS) by Lee, adapted from [26].
Applsci 10 06944 g001
Figure 2. Scanning electron microscope images of the binder types: (a) OPC and (b) FA, compared with (c) GGBFS by Lee, adapted from [26].
Applsci 10 06944 g002
Figure 3. Gradation sieve analysis curves of the aggregates: (a) mixed fine aggregates; (b) coarse aggregates.
Applsci 10 06944 g003
Figure 4. X-ray diffraction patterns of OPC and FA compared with GGBFS as measured by Lee, adapted from [26].
Applsci 10 06944 g004
Figure 5. Results of the air content and slump values of OPC and FA compared with GGBFS as measured by Lee (adapted from [26]) in terms of the mixing rate.
Applsci 10 06944 g005
Figure 6. Results of the unit water content of OPC and FA compared with GGBFS as measured by Lee (adapted from [26]) in terms of the mixing rate.
Applsci 10 06944 g006
Figure 7. Results of the compressive strength of OPC and FA compared with GGBFS as measured by Lee (adapted from [26]) by age.
Applsci 10 06944 g007
Figure 8. Result of compressive strength (FA)/compressive strength (GGBFS) as measured by Lee (adapted from [26]) in terms of the mixing rate.
Applsci 10 06944 g008
Figure 9. Results of the compressive strength of OPC and FA compared with GGBFS as measured by Lee (adapted from [26]) in terms of the mixing rate.
Applsci 10 06944 g009
Figure 10. Results of compressive strength (56 days)/compressive strength (28 days) of OPC and FA compared with GGBFS as measured by Lee (adapted from [26]) in terms of the mixing rate.
Applsci 10 06944 g010
Figure 11. Results of the carbonation depth of OPC and FA compared with GGBFS as measured by Lee (adapted from [26]) in terms of the mixing rate.
Applsci 10 06944 g011
Figure 12. Results of the chloride penetration depth of OPC and FA compared with GGBFS as measured by Lee (adapted from [26]) in terms of the mixing rate.
Applsci 10 06944 g012
Figure 13. Results of the relative dynamic elasticity modulus of OPC and FA compared with GGBFS as measured by Lee (adapted from [26]) in terms of the mixing rate.
Applsci 10 06944 g013
Figure 14. Results of the weight loss rate of OPC and FA compared with GGBFS as measured by Lee (adapted from [26]) in terms of the mixing rate.
Applsci 10 06944 g014
Figure 15. Results of the CaO content and CaO/SO3 rate in terms of the mixing rate.
Applsci 10 06944 g015
Figure 16. CaO/SiO2 and SiO2/Al2O3 molar rates in terms of the mixing rate.
Applsci 10 06944 g016
Figure 17. Results of the (a) compressive strength and (b) compressive strength development rate according to the varied CaO content.
Applsci 10 06944 g017
Figure 18. Results of the compressive strength in terms of the CaO/SO3 rate.
Applsci 10 06944 g018
Figure 19. Optimum CaO content range of FA for ensuring adequate durability performance.
Applsci 10 06944 g019
Table 1. Chemical compositions of the binders used.
BinderChemical Composition (%)
SiO2Fe2O3Al2O3 CaO MgONa2O K2O SO3Others
OPC (1)21.603.305.1560.202.300.530.991.504.43
FA (2)57.906.8020.504.001.380.891.18-7.35
(1) OPC: Ordinary Portland cement; (2) FA: Fly ash.
Table 2. Physical properties of the materials used.
MaterialTypeDensity
(g/cm3)
Fineness
(cm2/g)
Fineness
Modulus
Absorption
(%)
OPCType 1
(KS L 5201)
3.153322--
FAType 2
(KS L 5405)
2.143964--
Fine aggregateS1Washed sea sand2.60-2.010.79
S2Crushed sand2.57-3.290.87
Coarse aggregateCrushed granitic aggregate2.60--0.76
Chemical admixturePolycarboxylic acid group1.05---
Table 3. Experimental design.
Fixed ItemBinder TypeAdmixture Mixing Rate (%)Test Parameter
B (1): 330 kg/m3
W (2): 175 kg/m3
T (3): 20 °C
OPC
FA
0
10
20
30
40
50
60
70
Raw material properties
-
Particle size distribution and grading distribution (%)
-
X-ray fluorescence and X-ray diffraction
-
Scanning electron microscope
Engineering properties
-
Unit water content (kg/m3)
-
Slump (mm) and air content (%)
-
Compressive strength (MPa)
Durability properties
-
Chloride penetration depth and carbonation depth (mm)
-
Relative dynamic elasticity modulus and weight loss rate (%)
(1) B: Binder weight per unit; (2) W: Water weight per unit; (3) T: Curing temperature.
Table 4. Mixing rates of concrete.
Mix IDUnit Weight (kg/m3)AD (4)
(B × wt.%)
OPCFAWSS (1)CS (2)CGA (3)
Plain33003515218780.90
F10297333495178720.85
F20264663465148660.80
F30231993445108600.75
F401981323425078540.70
F501651653395038480.65
F601321983375008430.60
F70992313354968370.55
(1) WSS: washed sea sand; (2) CS: crushed sand; (3) CGA: crushed granitic aggregate; (4) AD: chemical admixture.
Table 5. Testing methods for the assessed parameters.
Assessed ParameterTesting MethodGeometry
Raw material properties
-
Particle size distribution and grading distribution (%)
-
X-ray fluorescence and X-ray diffraction
-
Scanning electron microscope
 
ASTM C204 and
ASTM C136
ASTM C114 and
ASTM C457
ASTM C1723
 
-
-
-
-
-
Engineering properties
-
Slump (mm) and air content (%)
-
Compressive strength (MPa)
 
ASTM C143 and ASTM C231
ASTM C873, ASTM C39
 
-
Ø 100 × 200 mm
Durability properties
-
Chloride penetration depth and carbonation depth (mm)
-
Relative dynamic elasticity modulus and weight loss rate (%)
 
KS F 2584 and
NT Build 492
ASTM C666
 
Ø 100 × 200 mm
Ø 100 × 50 mm
100 × 100 × 400 mm

