Abstract
Nine commercial hemp seed oils from different countries were studied using a multimethodological approach to obtain information about their quality and chemical composition. Due to the lack of a specific regulation for hemp seed oils, quality parameters used in the case of olive oils (free acidity, peroxides number, spectrophotometer parameters) and anisidine number were measured and compared with those reported for extra virgin olive oil (EVOO). Free acidity and peroxides number showed a great variability, ranging from 0.4 to 17.24% and from 4.32 to 22.14 meqO2/kg, respectively, whereas the anisidine number ranged from 0.11 to 3.58. K232 value turned out to be generally below the limit reported for EVOO, whereas K270 and ΔK values were higher, with respect to EVOO limits, due to the high amount of tri-unsaturated fatty chains. Colorimetric analysis showed a peculiar curve trend that could represent the fingerprint of this product. Untargeted nuclear magnetic resonance methodology allowed to measure the amount of fatty chains, ω-6:ω-3 ratio, β-sitosterol, and aldehydes. The ω-6:ω-3 ratio turned out to be, in some cases, different from that reported on the bottle labels. Finally, lipoperoxidation assays were also carried out under different storage (light and temperature) and time exposure conditions, confirming that the exposure to direct light is the condition that interferes more with the product quality.
1. Introduction
Cannabis sativa L. is an annual plant belonging to the family of Cannabinaceae, widely spread in all five continents. Although its name is frequently associated with drugs of abuse (marijuana), due to the presence of psychotropic Δ9-tetrahydrocannabinol (THC) [1], the recent evidence of Cannabis sativa L. cultivars characterized by low amounts of Δ9-THC (known as industrial hemp) raised a growing interest toward this plant in different fields, including pharmaceutical, food, and cosmetic sectors. In Europe, hemp cultivars with an amount of Δ9-THC lower than 0.2% (in dry matter basis) are allowed for cultivation, and are reported in the EU approved list [2].
Among the different parts of the plant, hemp seeds are the only one to be authorized for food applications [3], as cannabinoids are present mainly due to cross-contamination during harvesting and processing [4]. Since ancient times, hemp seeds were consumed in the human diet; however, they were replaced by other seeds and used as feed materials for all animal species. Only in recent times the discovery of hemp seeds’ high nutritional value led to a revaluation of this source for human consumption. Literature regarding the investigation of hemp seeds’ composition has increased, making them an emerging source for value-added functional food ingredients and nutraceuticals [5,6]. Hemp seeds are consumed shelled in salad dressings, and in the production of snack bars, or they can be cold pressed to obtain edible hemp seed oil, and the residual cake is grinded to have a fiber-rich flour used in processed food (such as bread, biscuits, and pasta). The high nutritional value lies in the presence of secondary metabolites and the characteristic fatty acids profile, which stands out for the higher levels of polyunsaturated fatty acids (PUFAs) with respect to saturated ones. The two essential fatty acids, linoleic acid (C18:2 ω-6) and α-linolenic acid (C18:3 ω-3), account for more than 50% and 15–25% respectively, resulting in a perfect balanced 3:1 ratio ω-6:ω-3, optimal for healthy human nutrition [5]. Moreover, the presence of secondary metabolites such as phenolic compounds and tocopherols [7,8,9,10,11], with antioxidant properties, improves the health benefits and helps to prevent the PUFA oxidation process, improving hemp seed oil shelf-life. Some studies recommend a dietary intake of hemp seed oils [12,13,14], nowadays largely present in the markets of different countries (Canada, the European Union, Australia, and China) [15].
It is important to underline that a specific regulation concerning the analytical parameters for the quality assessment of hemp seed oils is still lacking, although the increasing interest towards hemp food products for human consumption has prompted few countries to issue guidelines about the acceptable level of Δ9-THC in hemp seeds, hempseed oil, or processed food [4,16,17,18]. Indeed, some studies discuss the development of a proper analytical procedure for the detection of cannabinoids levels and ratio in hemp seeds and hempseed oils [4,19,20,21,22].
However, a plethora of different factors could influence the oil quality, such as the area of cultivation [23,24], the type of cultivars [25], the origin of seeds [26], agronomic practices, and extraction processing [27,28] that usually indicate the cold pressing as the preferred method to preserve the ω-3:ω-6 ratio [11]. Moreover, the price of commercial hempseed oil ranges from 20 to 100 €/L, making it an expensive food product sold on the market without any quality assurance. Taking into account the variability in composition and the price, quality parameters need to be established in order to both valorize products and preserve consumer safety and awareness.
Hemp seed oils are sold as food, and labeled accordingly [29]. In this context, the final product has to guarantee the safety standard for consumers, but relevant information, such as plant identity, variety, chemical characterization in terms of unsaturated fatty acid, secondary metabolites, and similar, are not mandatory, and therefore not reported in the bottle labels.
In the present study, nine commercial hemp seed oils were analyzed, by a multimethodological approach, to provide information regarding the quality of the products present on the markets. Due to the lack of a specific regulation for hemp seed oils, quality criteria reported in the olive oil Regulation (EU) 2015/1830 (European commission), namely free acidity, peroxides number, and spectrophotometric parameters such as K270, ΔK, and K232, were measured and compared with those reported for extra virgin olive oil (EVOO). Moreover, anisidine number, colorimetric analysis, and lipoperoxidation assays were also evaluated. Untargeted nuclear magnetic resonance (NMR) methodology was applied to identify and quantify simultaneously different classes of compounds [30,31].
2. Materials and Methods
2.1. Reagents and Materials
All chemical reagents (potassium hydroxide (KOH), phenolphthalein, potassium iodide (KI), acetic acid (CH3COOH), sodium thiosulfate (Na2S2O3), p-anisidine, glacial acetic acid, linoleic acid, iron (II) chloride (FeCl2), potassium thiocyanate (KSCN), and solvents (ethanol (EtOH), methanol (MeOH), chloroform (CHCl3), diethyl ether (Et2O), iso-octane, and cyclohexane) were purchased from Sigma-Aldrich Co (St. Louis, MO, USA) (all purity ≥98%). Deionized water, purified with a Milli-Q system (Millipore, Bedford, USA), was used. Dimethyl sulfoxide D6 99.80% and chloroform D 99.80% were purchased from Euriso-Top (Saclay, France).
2.2. Sampling
Nine commercial hemp seed oils were purchased in organic foods stores and in the e-marketplace, chosen as the best representatives of the consumer’s choices (the most common hempseed oils from greatly organized distribution, and the ones with top customer reviews from the e-marketplace). Hemp seed oils are usually sold in 250 mL bottles. Provenience and prices (€/L) are reported in Table 1. The labels of samples 2, 4, 5, 7, 8, and 9 stated that the preparation was performed using cold extraction. In all labels, the ω-6:ω-3 ratio was indicated. Before carrying out analysis, samples were stored in a cool and dry place, away from sources of light and heat, in order to prevent oxidation reactions. All analyses were carried out 6 months before the expiry date. The original bottle was opened just before analysis and divided in 10 mL tubes, completely fulfilled, hermetically closed, and stored in a cold place in the dark, in order to prevent oil–air and oil–light interactions.

Table 1.
Geographical provenience and price of the commercial hemp seed oils.
2.3. Quality Parameters
Hemp seed oil quality was evaluated measuring free acidity, peroxides number, anisidine number, and spectrophotometer parameters (K232, K270, and ΔK). Since the methodologies usually applied to determine all these parameters require great quantities of samples and reagents, specific miniaturized methods were applied to analyze the hemp seed oil, according to Rapa et al. [32]. All the experiments were performed three times, and the results were expressed as the mean value ± SD (standard deviation).
2.3.1. Free Acidity
An aliquot of 3.33 g of hemp seed oil was dissolved in 10 mL of diethyl ether/ethanol (60/40 v/v) mixture. Then, free fatty acids were titrated with KOH 0.01 N until the tuning of the phenolphthalein indicator. Free acidity (A%) was determined, following Equation (1):
where: V is the titrant volume (expressed in mL); C is the exact concentration of KOH (expressed in mol/L); M is the molar weight of the oleic acid (282 g/mol) used for the expression of the result; and m is the weight of the analyzed substance (expressed in g) [33] (Table 2).
A% = (V × C × M)/(10 × m)
Table 2.
Free acidity (A%), peroxides number (P.N.), anisidine number (A.N.), and spectrophotometric parameters (K232, K270, and ΔK) of the analyzed hemp seed oil samples.
2.3.2. Peroxides Number (P.N.)
An aliquot of 0.5 g hemp seed oil was introduced in a flask with 2 mL of chloroform. After shaking (30 s), 3 mL of glacial acetic acid and 0.1 mL of potassium iodide saturated aqueous solution were added. The flask was shaken for 1 min and then left, protected from light, at a temperature between 15 and 25 °C. After 5 min, 75 mL of distilled water was added. The released iodine was titrated with a sodium thiosulfate solution (0.0005 N) by vigorously shaking, using a starch solution as indicator. The peroxides number (P.N.), expressed as meqO2/kg, and was calculated as follows (Equation (2)):
where: V is the volume of titrant (expressed in mL); T is the normality of the sodium thiosulfate solution (expressed in n.eq./L); and m is the weight in g of the analyzed sample [33].
P.N. = (V × T)/m × 1000
2.3.3. Anisidine Number (A.N.)
An amount of 0.2 g of hemp seed oil was dissolved in 10 mL of iso-octane (2,2,4-trimethylpentane) (solution A). Then, the extinction at 350 nm was determined in a 10 mm quartz cuvette. A 2.5% (w/v) solution of p-anisidine was prepared in glacial acetic acid. An aliquot of 2.5 mL of solution A was added to 0.5 mL of p-anisidine (2.5% in glacial acetic acid). The mixture (solution B) was shaken and set to rest for 10 min. Then, the extinction at 350 nm was measured. To obtain the p-anisidine number (A.N.), the following expression (Equation (3)) was applied:
where: Ea is the extinction of solution A; Eb is the extinction of the solution B; and m is the weight of the sample (expressed in g) [34].
A.N. = [25 × (1.2 Ea − Eb)]/m
2.3.4. Spectrophotometric Investigation in the Ultraviolet
An amount of 0.25 g of hemp seed oil was dissolved in 25 mL of cyclohexane solvent and homogenized to obtain a 1% solution (w/v). The extinction coefficients were measured at 232 nm, 266 nm, 270 nm, and 274 nm, with respect to the pure solvent as reference in a 10 mm quartz cuvette. The extinction absolute value (ΔΚ) was calculated as follows (Equation (4)):
where K270, K266, and K274 are the wavelength-specific extinction [33].
∆K = K270 × (K266 + K274)/2
2.4. Colorimetry
The hemp seed oils were submitted to colorimetric analyses. CIEL*a*b* parameters (L*, a*, b*, C*ab, and hab) were obtained using a colorimeter X-Rite SP-62 (X-Rite Europe GmbH, Regensdorf, Switzerland), equipped as previously described [35]. The color description is based on three parameters: L* (lightness), a* (greenness for negative, or redness for positive, values) and b* (blueness for negative, or yellowness for positive, values). Cylindrical coordinates C*ab and hab were calculated from the parameters a* and b*, as described in our previous works [36]. All the experiments were performed four times, and the results were expressed as the mean value ± SD (Table 3).
Table 3.
Colorimetric parameters obtained by CIELAB analyses performed on hemp seed oils 1–9.
2.5. NMR Analysis
Each hemp seed oil sample (20 µL) was dissolved in DMSO-d6 (20 µL) and CDCl3 (700 µL) in a 5 mm NMR tube, which was flame-sealed. The NMR spectra were recorded at 27 °C on a Bruker AVANCE 600 spectrometer (Milan, Italy) operating at the proton frequency of 600.13 MHz and equipped with a Bruker multinuclear z-gradient 5 mm probe head. 1H spectra were acquired using the following conditions: number of scans 1024, 90° pulse 9.5 μs, time domain 64 K data points, relaxation delay plus acquisition time 3.5 s, and spectral width 10,802 Hz. 1H NMR spectra were obtained by the FT (Fourier transform) of the free induction decay, applying an exponential multiplication with a line-broadening factor of 0.3 Hz and a zero filling (size 64 K) procedure. 1H NMR spectra were manually phased. Chemical shifts were reported with respect to the residual CHCl3 signal set at 7.26 ppm. The baseline was corrected using the Cubic Spline Baseline Correction routine in the Bruker Topspin software. The integrals of seven selected signals were measured. In particular, the selected proton resonances were due to hexanal (CH) at 9.699 ppm, trans-2-hexenal (CH) at 9.448 ppm, diallylic protons of tri-unsaturated fatty acids (CH2) at 2.778 ppm, diallylic protons of di-unsaturated fatty acids (CH2) at 2.729 ppm, α-methylene protons of all fatty acids (CH2) at 2.251 ppm, allylic protons of all unsaturated fatty acids (CH2) at 1.999 ppm, and β-sitosterol (CH3) at 0.622 ppm. The integrals of the selected resonances were normalized with respect to the resonance at 2.251 ppm set to 100. β-Sitosterol, fatty acids, and aldehydes were expressed as molar %, following the Equations previously described [37], with some modifications:
where %β-SIT, %TRI, %DI, %MONO, %SAT, %INS, %t-2-HEX, and %HEX are molar % of β-sitosterol, tri-unsaturated fatty acids, di-unsaturated fatty acids, mono-unsaturated fatty acids, saturated fatty acids, unsaturated fatty acids, trans-2-hexenal, and hexanal, respectively. Iβ-SIT, ITRI, IDI, IUNS, IFA, It-2-HEX, and IHEX are integrals of β-sitosterol, tri-unsaturated fatty acids, di-unsaturated fatty acids, allylic protons of all unsaturated fatty acids, α-methylene protons of all fatty acids, trans-2-hexenal, and hexanal, respectively. Itot was calculated according to Equation (13).
%β-SIT = 100 × 0.66Iβ-SIT/Itot
%TRI = 100 × 0.5ITRI/Itot
%DI = 100 × IDI/Itot
%MONO = 100 × 0.5(IUNS − 2IDI − ITRI)/Itot
%SAT = 100 × (IFA − IDI − 0.5ITRI − %MONO)/Itot
%INS = %MONO + %DI + %TRI
%t-2-HEX = 100 × 2It-2-HEX/Itot
%HEX = 100 × 2IHEX/Itot
Itot = IFA + 0.66Iβ-SIT + 2It-2-HEX + 2IHEX
2.6. Lipoperoxidation
The assay was carried out by the ferric thiocyanate method according to Di Sotto et al. [38], with minor changes. Preliminarily, both linoleic acid and the oil samples were subjected to storage for 24 h under different temperature conditions, including room temperature (RT), room temperature plus light exposure (RT plus white light; distance of lamp, 30 cm), refrigerated temperatures of +4 °C and −20 °C, and warm temperature of +60 °C. After storage sodium phosphate buffer (625 µL; 0.2 M, pH 7.0) was added to linoleic acid or the hemp seed oil samples (625 µL; 2.5% v/v in pure EtOH) and incubated at 37 °C for 72 h. Various aliquots (10 µL) were taken at different incubation times (0, 24, 48, 72 h) and mixed with ethanol (970 µL; 75% v/v), FeCl2 (10 µL; 200 mM in 3.5% w/v HCl) and KSCN (10 µL; 30% w/v in deionized water). Peroxides, generated during fatty acid peroxidation, oxidize Fe+2 to Fe+3; the latter ion forms a complex with thiocyanate that can be measured spectrophotometrically at 500 nm.
The percentage of the Lipid Peroxidation (LP) was calculated, as follows (Equation (14)):
where Astandard is the highest absorbance of linoleic acid used as reference, whereas Asample is the absorbance of the tested sample. The experiments were repeated two times, and, in each experiment, three technical replicates were assayed for each storage condition.
LP = Asample/Astandard × 100
3. Results and Discussion
3.1. Quality Parameters
Due to the lack of a specific regulation on hemp seed oils, quality parameters established for olive oils [33], namely free acidity, peroxides number, anisidine number, and spectrophotometric parameters (K232, K270, and ΔK) (ISO 6885:2016), were evaluated.
3.1.1. Free Acidity
Free Acidity (A%), expressed as oleic acid, points out the degree of fat hydrolytic alteration. Triglycerides hydrolysis occurs in the presence of water and enzymes (lipases), naturally present in raw vegetable matrix. In the Regulation (EU) 2015/1830 for virgin oils, a maximum limit of 2.0% is provided [33]. However, the Pharmacopoeia provides a maximum value of 6% in A% for seeds oils [39]. Among the commercial hemp seed oils here investigated (Table 2), samples 3, 7, and 8 showed an A% less than 1% (0.40%, 0.76% and 0.43%, respectively), whereas samples 1, 4, and 6 showed a value above the 2.0% threshold (17.24%, 4.15% and 2.22%, respectively). Considering the limit established by the Pharmacopoeia for seed oils, only sample 1 exceeds the 6% limit. It possible that this commercial product was not stored using adequate temperature and light conditions.
In literature, few studies have investigated the free acidity of hemp seed oils, and a great variability of values was found. A% of 0.074–0.890% has been reported for noncommercial hemp seed oils [32,40], whereas for Italian commercial hemp seed oils, the maximum value of 9.9% has been reported [7].
3.1.2. Oxidation Parameters: Peroxides Number and Anisidine Number
Fatty acids oxidation can occur in two steps. First, unsaturated fatty acids react with oxygen, producing odorless peroxides that, in the second step, decompose in aldehydes, responsible for rancid taste. The degree of the first oxidation step is evaluated by peroxides number (P.N.) (EU Regulation (EU) 2015/1830); a limit of 20 meqO2/kg P.N. is reported for virgin and extra virgin olive oils. The peroxides value is useful for assessing the spoilage progression, especially in fresh oils or oil produced with low temperature technologies [41]. On the other hand, the anisidine number (A.N.) provides the assessment of the second oxidation step: an acceptable number for fat matrices is 10.
The nine hemp seed oils here investigated showed a relevant variability for P.N. values, ranging from 4.32 to 22.14 meqO2/kg. Only sample 6 showed a P.N. value above 20 meqO2/kg. Again, as in the case of A%, these values are higher than the values from 1.94 to 7.20 meqO2/kg reported in the case of noncommercial samples [40,42,43] and Italian commercial hemp seed oils [7].
All the investigated samples showed A.N. values ranging from 0.11 to 3.58 (below the limit), in agreement with literature data [44].
3.1.3. K232, K270, and ΔK Spectroscopic Values
Regarding the spectroscopic measurements, the K232 value evaluates the presence of conjugated dienes, whereas K270 and ΔK indicate the presence of conjugated trienes. Almost all the samples showed a K232 value below the EVOO limit (2.6 L/g·cm), with sample 8 showing the lowest value (1.72 L/g·cm). The only exception was sample 1, with a value of 2.65 L/g·cm. Generally, the values here reported were lower than those reported by Anwar et al. for Pakistan samples [23].
The K270 and ΔK values turned out to be higher than the limits reported in the Regulation (0.25 L/g·cm, 0.01), in agreement with the previously reported data [45]. The higher conjugated trienes content, with respect to olive oils, is due to the high amount of PUFAs in hemp seed oils.
3.2. Colorimetry
The color of a product plays a preeminent role in the consumer acceptance and, consequently, in the choice of a food. In the case of oils, color could represent an index of good manufacturing practice, a warranty of quality and genuineness, and, not least important, of the right storage conditions. To evaluate the color properties of hemp seed oils, the tristimulus colorimetry was employed. To our knowledge, only one work is available in literature regarding colorimetric studies on hemp seed oil samples, reporting an L* value of 18.13, an a* of 2.40 and a b* of 30.87 [46], so that a significant yellow parameter (+b*) can be shown, compared to a very weak red value (+a*) and a quite dark sample.
In a previous work [46], a comparison among medium reflectance profiles of hemp seed, olive, and neem oils has been carried out: a similarity among olive oils and hemp oils has been observed, although hemp seed oils turned out to be darker.
The analyses, performed on the selected nine samples, only in part confirm these data (Table 3). Two samples (6 and 7) were turbid, and were analyzed before and after filtration. All samples covered a very wide range between 25 to 46 of lightness, −0.6–5.4 of a* and 1.2–33 of b*, substantially confirming a yellow color completely dominant on the slight reddish nuance, but also showing significant differences in the lightness and the tonality, hab = tan−1(a*/b*), most likely due to the different cultivars, the work-up, and the purification steps applied by the producers. All the obtained reflectance curves, shown in Figure 1, account for the relevant differences found among the samples.
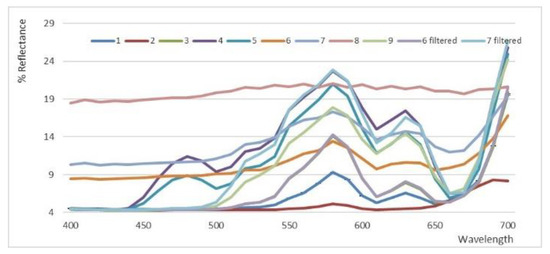
Figure 1.
Spectral reflectance curves obtained by CIEL*a*b* analyses applied to 1–9 hemp seed oils. Samples 6 and 7 were measured after filtration.
The profile of sample 2 corresponded to a very dark oil, whereas the profile of sample 8 corresponded to a very faded oil. In samples 6 and 7, turbidity and sediments were present. Therefore, when samples 2, 8, 6, and 7 were discarded, a clear reflectance profile was observed (Figure 1), accounting for a different lightness, corresponding to a higher b*/a* ratio, that indicates a dominant yellow color with respect to a reddish nuance. Samples 4 and 5, characterized by a quite different profile in the region between 450 and 500 nm, showed the lowest a* values and, consequently, the highest b*/a* ratios.
Therefore, with respect to the reflectance profiles of other commercially available oils, such as corn, rice, and EVOO, hemp seed oils showed a peculiar curve trend that could represent a fingerprint for this product [40].
3.3. NMR Analysis
In Figure 2, the 1H spectrum of a hemp seed oil is reported. Hemp seed oils spectra, similarly to other vegetable oils, were characterized by strong signals, due to the fatty chains on the glycerol moiety and minor compounds. The amount of β-sitosterol, hexanal, trans-2-hexenal, saturated fatty chains, and unsaturated fatty chains (including mono-unsaturated, di-unsaturated, and tri-unsaturated fatty chains) are reported as molar percentages in Figure 3.
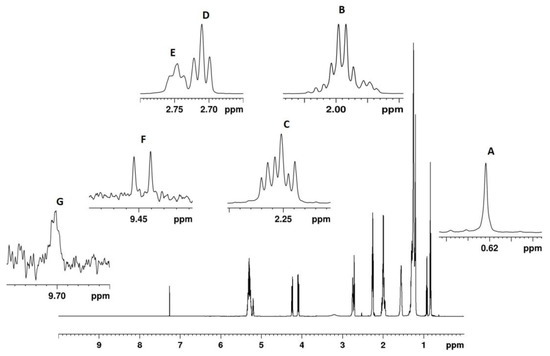
Figure 2.
600.13 MHz 1H NMR spectrum of a hemp seed oil. Quantified selected NMR signals are reported in expanded regions. (A) β-sitosterol (0.622 ppm); (B): allylic protons of all fatty chains (1.999 ppm); (C): α-methylene protons of all acyl chains (2.251 ppm); (D): diallylic protons of linoleic fatty chains (2.729 ppm); (E): diallylic protons of linolenic fatty chains (2.778 ppm); (F): trans-2-hexenal (9.448 ppm); (G): hexanal (9.699 ppm).
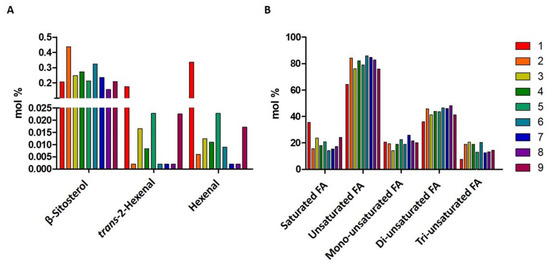
Figure 3.
Histograms resulting from the quantitative NMR analysis of (A) β-sitosterol and aldehydes, and (B) fatty acids. The relative molecular abundances (molar percentage) are reported.
As expected, fatty acid chain profiles of all nine hemp seed oils were characterized by a higher content of unsaturated fatty acid chains with respect to saturated ones, and, among them, di-unsaturated fatty chains resulted in more abundance (35–48%), compared to mono- (15–28%) and tri-unsaturated ones (8–20%). In particular, sample 1 was characterized by the lowest tri-unsaturated fatty chain content.
Hemp seed oils are renowned for their optimal 3:1 ratio in ω-6:ω-3. However, on the bottle labels of samples 2, 6, and 9 (see Table 4), a ratio lower than 3:1 was reported, and, in some cases, the ω-6:ω-3 ratio measured by NMR was different from the ratio reported on the labels. For instance, 2, 3, and 4 hemp seed oil samples showed an ω-6:ω-3 ratio lower than that declared in the labels. Only 7, 8, 5, and 1 hemp seed oil samples, with values of 3.6, 3.6, 3.3, and 4.7, respectively, turned out to have an optimal ω-6:ω-3 ratio. In particular, sample 1 presented a particularly high ratio compared to other ones. According to NMR data, samples 4, 2, 9, and 6 did not reach the 3:1 ω-6:ω-3 ratio value, with sample 3 having a particularly low value.
Table 4.
Comparison between ω-6:ω-3 ratios reported on the bottle labels and the ones measured by NMR analysis. Integrals of signals D (diallylic protons of linoleic fatty chains at 2.729 ppm) and E (diallylic protons of linolenic fatty chains at 2.778 ppm) of the nine commercial hemp seed oils analyzed were measured.
It is interesting to note that sample 9, with an ω-6:ω-3 ratio of 2.86, was sold at 80 €/L, whereas sample 5, with a 3.36 ratio value, was sold at 26 €/L, a much more affordable price.
Regarding the content of minor compounds, the β-sitosterol amount ranged from 0.15% (sample 8) to 0.33% and 0.45% (samples 6 and 5, respectively).
The content of trans 2-hexanal and hexanal was generally low in all the samples (between 0 and 0.5%). However, sample 1 showed the highest content of hexanal (0.34%) and trans-2-hexenal (0.17%).
3.4. Evaluation of Oxidation Susceptibility
In order to evaluate the susceptibility of hemp seed oils to lipid peroxidation, the samples were subjected to different temperatures of storage and to a specific light exposure condition under laboratory testing [7,47]. The results showed peculiar stability profiles of the oils with respect to linoleic acid, used as reference. Lipoperoxidation of hemp seed oils was not significantly increased over 24 h of incubation time, since the susceptibility to lipid peroxidation after 48 and 72 h was the same as of 24 h (Figure 4). Differences among the percentage of lipoperoxidation were estimated at time zero and after 24 h of exposure of the samples to different storage conditions (Table 5).
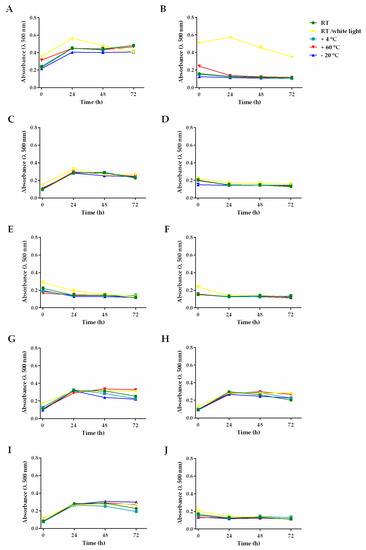
Figure 4.
Absorbance (λ 500 nm) of lipoperoxides produced in different hemp seed oils, with respect to linoleic acid (A) under multiple storage conditions and incubation times (t = 0, 24, 48, and 72 h). Hemp seed oils: (B) 1, (C) 2, (D) 3, (E) 4, (F) 5, (G) 6, (H) 7, (I) 8, (J) 9.
Table 5.
Lipoperoxidation (%) of linoleic acid, used as standard, and the hemp seed oils 1–9 under different storage conditions.
Linoleic acid displayed a very low stability, being significantly oxidized under all storage conditions (Figure 4A): the maximum percentage of peroxidation was achieved after 24 h incubation at RT/light (about 2.4-fold higher than RT at time zero), followed by storage at 60 °C warm temperature (1.5-fold higher than the RT oxidation at time zero). Conversely, an oxidation reduction (almost twofold, compared to RT oxidation at time zero) occurred under ultra-frost temperature (−20 °C).
Sample 1 exhibited a high stability under almost all the experimental conditions, except for RT/light, wherein it resulted in being strongly oxidized already at time zero (Figure 4B), with about a 3.3- and 4.5-fold peroxidation increase, compared to the RT oxidation at time zero and after 24 h, respectively. Moreover, after warm storage (60 °C), it showed about a twofold increase in oxidation with respect to RT at time zero, although the basal level was recovered during incubation (Figure 4B). Conversely, the ultra-frost temperature (−20 °C) weakly (about 1.2-fold) affected the basal oxidation of sample 1.
The other commercial hemp seed oils displayed a different behavior compared to sample 1. Samples 3, 4, 5, and 9 were only slightly affected by storage at warm and cold temperatures, or by light, at all incubation times (Figure 4D–F,L).
Regarding the hemp seed oils 4, 5, and 9, the storage at RT/light induced a weak but significant lipoperoxidation increase (1.3–1.6-fold), compared RT at time zero, which progressively disappeared during incubation time. Conversely, sample 3 turned out to be stable, also, to light exposure.
On the basis of this evidence, hemp seed oils appear to be stable under the tested storage conditions, although the direct exposure to light should be considered with caution, because of the higher susceptibility of some samples to oxidation, likely due to a high content of polyunsaturated fatty acids or to the presence of antioxidant constituents. Further studies could clarify this issue.
4. Conclusions
In this paper, nine commercial hemp seed oils were analyzed, by both targeted and untargeted analyses, to determine their chemical composition and, therefore, to obtain information regarding the quality of the products present in the markets. The results show a great variability between the samples. Applying the parameters used for EVOO, the quality was poor in above 50% of the samples, as showed by A%, P.N., and ω-6:ω-3 ratio, although price was very high. Lipoperoxidation assay confirmed that storage conditions can affect the shelf life of the product, however, the quality, in terms of healthy properties, should be assured at least until the expiration date. It is well established that several parameters (cultivars, pedoclimatic conditions, and agronomical practices) do affect the chemical composition and sensorial features of foodstuffs, however, the great variability of data obtained on the commercial hemp seed oil matrix highlights the urgent need to find reference parameters that define the quality of this product. Moreover, although in some European countries hemp seed oil has been a product on the market for years, in other countries, such as Italy, hemp seed oil can be considered a young product, with no history of production.
These results, together with other data recently reported on hemp oils [7], can constitute the starting point for development, and drawing up, of harmonized guidelines with suitable quality and safety parameters specific for hemp seed oils. Furthermore, these studies might drive producers to standardize procedures of hemp seed oil production, guaranteeing the achievement of a good food objective, consumer safety, and the further expansion of the hemp food industry.
Author Contributions
L.M. (Luisa Mannina) and G.V.; methodology: A.P.S., A.D.S., S.D.G., A.M.G., S.C. (Salvatore Ciano), S.C. (Simone Carradori), M.R., S.C. (Stefania Cesa), and C.I.; validation: M.S. and G.D.M.; formal analysis: M.R. and S.C. (Salvatore Ciano); investigation: A.P.S., C.I., A.D.S., S.C. (Salvatore Ciano), L.M. (Luigi Menghini), and G.V.; data curation: A.P.S., C.I., A.D.S., S.C. (Stefania Cesa), A.M.G., and G.V.; writing—original draft preparation: G.V.; writing—review and editing: G.V. and L.M. (Luisa Mannina); visualization: M.S., G.D.M., A.D.S., S.C. (Salvatore Ciano), S.C. (Simone Carradori), and G.V.; supervision: L.M. (Luisa Mannina) and G.V., project administration and funding acquisition: L.M. (Luisa Mannina). All authors have read and agreed to the published version of the manuscript.
Funding
This work has been realized with funds received from the following agencies: Italian Ministry of Education, Universities and Research—Dipartimenti di Eccellenza—L. 232/2016; Regione Lazio, “LACanapa” Project (Progetto di Ricerca, finanziato ai sensi della L.R. 13/08 -Protocol 85-2017-15069 CUP: B86C18000730002).
Acknowledgments
This work is part of a project supported by Lazio Region entitled “La Canapa industriale: sviluppo e valorizzazione di una nuova filiera agroalimentare ecosostenibile”.
Conflicts of Interest
The authors declare no conflict of interest.
References
- TNI. The UN Drug Control Conventions. Available online: https://www.tni.org/en/publication/the-un-drug-control-conventions#box3 (accessed on 6 September 2020).
- European Commission. EU Plant Variety Database. Available online: https://ec.europa.eu/food/plant/plant_propagation_material/plant_variety_catalogues_databases/search/public/index.cfm?event=SearchVariety&ctl_type=A&species_id=240&variety_name=&listed_in=0&show_current=on&show_deleted= (accessed on 6 September 2020).
- Ministero della Salute. Produzione e Commercializzazione di Prodotti a Base di Semi di Canapa Per L’utilizzo nci Settori Dell’alimentazione Umana; Ministero della Salute: Roma, Italy, 2009; pp. 1–4.
- Jang, E.; Kim, H.; Jang, S.; Lee, J.; Baeck, S.; In, S.; Kim, E.; Kim, Y.; Han, E. Concentrations of THC, CBD, and CBN in commercial hemp seeds and hempseed oil sold in Korea. Forensic Sci. Int. 2020, 306, 110064. [Google Scholar] [CrossRef] [PubMed]
- Farinon, B.; Molinari, R.; Costantini, L.; Merendino, N. The seed of industrial hemp (Cannabis sativa L.): Nutritional Quality and Potential Functionality for Human Health and Nutrition. Nutrients 2020, 12, 1935. [Google Scholar] [CrossRef] [PubMed]
- Xu, Y.; Li, J.; Zhao, J.; Wang, W.; Griffin, J.; Li, Y.; Bean, S.; Tilley, M.; Wang, D. Hempseed as A Nutritious and Healthy Human Food or Animal Feed Source: A Review. Int. J. Food Sci. Technol. 2020, 14755. [Google Scholar] [CrossRef]
- Izzo, L.; Pacifico, S.; Piccolella, S.; Castaldo, L.; Narváez, A.; Grosso, M.; Ritieni, A. Chemical Analysis of Minor Bioactive Components and Cannabidiolic Acid in Commercial Hemp Seed Oil. Molecules 2020, 25, 3710. [Google Scholar] [CrossRef] [PubMed]
- Smeriglio, A.; Galati, E.M.; Monforte, M.T.; Lanuzza, F.; D’Angelo, V.; Circosta, C. Polyphenolic Compounds and Antioxidant Activity of Cold-Pressed Seed Oil from Finola Cultivar of Cannabis sativa L. Phytother. Res. 2016, 30, 1298–1307. [Google Scholar] [CrossRef]
- Crescente, G.; Piccolella, S.; Esposito, A.; Scognamiglio, M.; Fiorentino, A.; Pacifico, S. Chemical composition and nutraceutical properties of hempseed: An ancient food with actual functional value. Phytochem. Rev. 2018, 17, 733–749. [Google Scholar] [CrossRef]
- Pojić, M.; Mišan, A.; Sakač, M.; Hadnađev, T.D.; Šarić, B.; Milovanović, I.; Hadnađev, M. Characterization of Byproducts Originating from Hemp Oil Processing. J. Agric. Food Chem. 2014, 62, 12436–12442. [Google Scholar] [CrossRef]
- Ustun-Argon, Z. Phenolic Compounds, Antioxidant Activity and Fatty Acid Compositions of Commercial Cold-Pressed Hemp Seed (Cannabis Sativa L.) Oils from Turkey. Int. J. Sci. Eng. Res. 2019, 10, 166–173. [Google Scholar]
- Callaway, J.; Schwab, U.; Harvima, I.; Halonen, P.; Mykkänen, O.; Hyvönen, P.; Järvinen, T. Efficacy of dietary hempseed oil in patients with atopic dermatitis. J. Dermatol. Treat. 2005, 16, 87–94. [Google Scholar] [CrossRef]
- Rodriguez-Leyva, D.; Pierce, G.N. The cardiac and haemostatic effects of dietary hempseed. Nutr. Metab. 2010, 7, 32. [Google Scholar] [CrossRef]
- Ghirga, F.; Quaglio, D.; Ghirga, P.; Berardozzi, S.; Zappia, G.; Botta, B.; Mori, M.; D’Acquarica, I. Occurrence of Enantioselectivity in Nature: The Case of (S)-Norcoclaurine. Chirality 2016, 28, 169–180. [Google Scholar] [CrossRef] [PubMed]
- Carus, M.; Karst, S.; Kauffmann, A. The European Hemp Industry: Cultivation, Processing and Applications for Fibres, Shivs and Seeds; European Industrial Hemp Assocaition: Hürth, Germany, 2016. [Google Scholar]
- Skoczinski, P.; Carus, M.; Grotenhermen, F.; Beitzke, B.; Kruse, D. Limit and Guideline Values for THC (Tetrahydrocannabinol) in Hemp Foods; European Industrial Hemp Assocaition: Hürth, Germany, 2019. [Google Scholar]
- Ministero della Salute. DECRETO 4 Novembre 2019 Definizione di Livelli Massimi di Tetraidrocannabinolo (THC) Negli Alimenti; Ministero della Salute: Roma, Italy, 2019; pp. 1–5.
- Berardozzi, S.; Bernardi, F.; Infante, P.; Ingallina, C.; Toscano, S.; De Paolis, E.; Alfonsi, R.; Caimano, M.; Botta, B.; Mori, M.; et al. Synergistic inhibition of the Hedgehog pathway by newly designed Smo and Gli antagonists bearing the isoflavone scaffold. Eur. J. Med. Chem. 2018, 156, 554–562. [Google Scholar] [CrossRef] [PubMed]
- Di Marco Pisciottano, I.; Guadagnuolo, G.; Soprano, V.; De Crescenzo, M.; Gallo, P. A rapid method to determine nine natural cannabinoids in beverages and food derived from Cannabis sativa by liquid chromatography coupled to tandem mass spectrometry on a QTRAP 4000. Rapid Commun. Mass Spectrom. 2018, 32, 1728–1736. [Google Scholar] [CrossRef] [PubMed]
- Meng, Q.; Buchanan, B.; Zuccolo, J.; Poulin, M.-M.; Gabriele, J.; Baranowski, D.C. A reliable and validated LC-MS/MS method for the simultaneous quantification of 4 cannabinoids in 40 consumer products. PLoS ONE 2018, 13, e0196396. [Google Scholar] [CrossRef]
- Christinat, N.; Savoy, M.-C.; Mottier, P. Development, validation and application of a LC-MS/MS method for quantification of 15 cannabinoids in food. Food Chem. 2020, 318, 126469. [Google Scholar] [CrossRef]
- Citti, C.; Linciano, P.; Panseri, S.; Vezzalini, F.; Forni, F.; Vandelli, M.A.; Cannazza, G. Cannabinoid Profiling of Hemp Seed Oil by Liquid Chromatography Coupled to High-Resolution Mass Spectrometry. Front. Plant Sci. 2019, 10, 120. [Google Scholar] [CrossRef]
- Anwar, F.; Latif, S.; Ashraf, M. Analytical characterization of hemp (Cannabis sativa) seed oil from different agro-ecological zones of Pakistan. J. Am. Oil Chem. Soc. 2006, 83, 323–329. [Google Scholar] [CrossRef]
- Chen, T.; He, J.; Zhang, J.; Zhang, H.; Qian, P.; Hao, J.; Li, L. Analytical Characterization of Hempseed (Seed of Cannabis sativa L.) Oil from Eight Regions in China. J. Diet. Suppl. 2010, 7, 117–129. [Google Scholar] [CrossRef]
- Dimić, E.; Romanić, R.; Vujasinović, V. Essential fatty acids, nutritive value and oxidative stability of cold pressed hempseed (Cannabis sativa L.) oil from different varieties. Acta Aliment. 2009, 38, 229–236. [Google Scholar] [CrossRef]
- Abdollahi, M.; Sefidkon, F.; Calagari, M.; Mousavi, A.; Mahomoodally, M.F. A comparative study of seed yield and oil composition of four cultivars of Hemp (Cannabis sativa L.) grown from three regions in northern Iran. Ind. Crop. Prod. 2020, 152, 112397. [Google Scholar] [CrossRef]
- Devi, V.; Khanam, S. Optimization of the Ratio of ω-6 Linoleic and ω-3 α-Linolenic Fatty Acids of Hemp Seed Oil with Jackknife and Bootstrap Resampling. Chem. Prod. Process. Model. 2019, 15. [Google Scholar] [CrossRef]
- Da Porto, C.; Decorti, D.; Tubaro, F. Fatty acid composition and oxidation stability of hemp (Cannabis sativa L.) seed oil extracted by supercritical carbon dioxide. Ind. Crop. Prod. 2012, 36, 401–404. [Google Scholar] [CrossRef]
- European Parliament and Council. Regulation (EC) No 178/2002 Reguarding the General Principles and Requirements of Food Law, Establishing the European Food Safety Authority and Laying down Procedures in Matters of Food Safety. Off. J. 2002, 31. [Google Scholar]
- Mannina, L.; Sobolev, A.P.; Viel, S. Liquid state 1H high field NMR in food analysis. Prog. Nucl. Magn. Reson. Spectrosc. 2012, 66, 1–39. [Google Scholar] [CrossRef]
- Mannina, L.; D’Imperio, M.; Gobbino, M.; D’Amico, I.; Casini, A.; Emanuele, M.C.; Sobolev, A.P. Nuclear magnetic resonance study of flavoured olive oils. Flavour Fragr. J. 2012, 27, 250–259. [Google Scholar] [CrossRef]
- Rapa, M.; Ciano, S.; Rocchi, A.; D’Ascenzo, F.; Ruggieri, R.; Vinci, G. Hempseed Oil Quality Parameters: Optimization of Sustainable Methods by Miniaturization. Sustainability 2019, 11, 3104. [Google Scholar] [CrossRef]
- European Commission. COMMISSION DELEGATED REGULATION (EU) 2015/1830 of 8 July 2015 amending Regulation (EEC) No 2568/91 on the characteristics of olive oil and olive-residue oil and on the relevant methods of analysis. Off. J. 2015, L266, 9–13. [Google Scholar]
- British Standards Institution Animal and Vegetable Fats and Oils. Determination of Anisidine Value. Available online: https://www.iso.org/standard/40052.html (accessed on 6 September 2020).
- Patsilinakos, A.; Ragno, R.; Carradori, S.; Petralito, S.; Cesa, S. Carotenoid content of Goji berries: CIELAB, HPLC-DAD analyses and quantitative correlation. Food Chem. 2018, 268, 49–56. [Google Scholar] [CrossRef]
- Cairone, F.; Carradori, S.; Locatelli, M.; Casadei, M.A.; Cesa, S. Reflectance colorimetry: A mirror for food quality—A mini review. Eur. Food Res. Technol. 2020, 246, 259–272. [Google Scholar] [CrossRef]
- Ingallina, C.; Sobolev, A.P.; Circi, S.; Spano, M.; Giusti, A.M.; Mannina, L. New Hybrid Tomato Cultivars: An NMR-Based Chemical Characterization. Appl. Sci. 2020, 10, 1887. [Google Scholar] [CrossRef]
- Di Sotto, A.; Di Giacomo, S.; Toniolo, C.; Nicoletti, M.; Mazzanti, G. Sisymbrium Officinale (L.) Scop. and its Polyphenolic Fractions Inhibit the Mutagenicity of Tert-Butylhydroperoxide in Escherichia Coli WP2 uvr AR Strain. Phytother. Res. 2016, 30, 829–834. [Google Scholar] [CrossRef] [PubMed]
- European Directorate for the Quality of Medicines & HealthCare. Council of Europe European Pharmacopoeia, 9th ed.; European Directorate for the Quality of Medicines & HealthCare: Strasbourg, France, 2016. [Google Scholar]
- Teh, S.-S.; Birch, J. Physicochemical and quality characteristics of cold-pressed hemp, flax and canola seed oils. J. Food Compos. Anal. 2013, 30, 26–31. [Google Scholar] [CrossRef]
- Lutterodt, H.; Luther, M.; Slavin, M.; Yin, J.-J.; Parry, J.; Gao, J.-M.; Yu, L. Fatty acid profile, thymoquinone content, oxidative stability, and antioxidant properties of cold-pressed black cumin seed oils. LWT Food Sci. Technol. 2010, 43, 1409–1413. [Google Scholar] [CrossRef]
- Borhade, S.S. Chemical Composition and Characterization of Hemp (Cannabis sativa) Seed oil and essential fatty acids by HPLC Method. Arch. Appl. Sci. Res. 2013, 5, 5–8. [Google Scholar]
- Rezvankhah, A.; Emam-Djomeh, Z.; Safari, M.; Askari, G.; Salami, M. Microwave-assisted extraction of hempseed oil: Studying and comparing of fatty acid composition, antioxidant activity, physiochemical and thermal properties with Soxhlet extraction. J. Food Sci. Technol. 2019, 56, 4198–4210. [Google Scholar] [CrossRef]
- Oomah, B.D.; Busson, M.; Godfrey, D.V.; Drover, J.C. Characteristics of hemp (Cannabis sativa L.) seed oil. Food Chem. 2002, 76, 33–43. [Google Scholar] [CrossRef]
- Da Porto, C.; Decorti, D.; Natolino, A. Potential Oil Yield, Fatty Acid Composition, and Oxidation Stability of the Hempseed Oil from FourCannabis sativaL. Cultivars. J. Diet. Suppl. 2015, 12, 1–10. [Google Scholar] [CrossRef]
- Cesa, S.; Sisto, F.; Zengin, G.; Scaccabarozzi, D.; Kokolakis, A.K.; Scaltrito, M.M.; Grande, R.; Locatelli, M.; Cacciagrano, F.; Angiolella, L.; et al. Phytochemical analyses and pharmacological screening of Neem oil. S. Afr. J. Bot. 2019, 120, 331–337. [Google Scholar] [CrossRef]
- Singh, A.P.; Fathordoobady, F.; Guo, Y.; Singh, A.; Kitts, D.D. Antioxidants help favorably regulate the kinetics of lipid peroxidation, polyunsaturated fatty acids degradation and acidic cannabinoids decarboxylation in hempseed oil. Sci. Rep. 2020, 10, 1–12. [Google Scholar] [CrossRef]
© 2020 by the authors. Licensee MDPI, Basel, Switzerland. This article is an open access article distributed under the terms and conditions of the Creative Commons Attribution (CC BY) license (http://creativecommons.org/licenses/by/4.0/).