Article

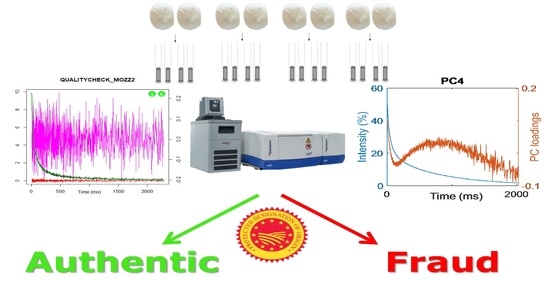
Spotting Frozen Curd in PDO Buffalo Mozzarella Cheese Through Insights on Its Supramolecular Structure Acquired by 1H TD-NMR Relaxation Experiments

1
Department of Agricultural and Food Sciences DISTAL, Alma Mater Studiorum University of Bologna, 47521 Cesena, Italy
2
Department of Agricultural Sciences, University of Naples Federico II, 80055 Portici, Italy
3
Interdepartmental Centre for Industrial Agrofood Research, Alma Mater Studiorum University of Bologna, 47521 Cesena, Italy
*
Author to whom correspondence should be addressed.
Appl. Sci. 2021, 11(4), 1466; https://doi.org/10.3390/app11041466
Submission received: 31 December 2020 / Revised: 29 January 2021 / Accepted: 3 February 2021 / Published: 5 February 2021

Abstract

:

Featured Application

Food fraud detection via relaxometry and chemometrics.

Abstract

The addition of frozen curd (FC) during the production process of “Mozzarella di Bufala Campana”, an Italian cheese with Protected Designation of Origin (PDO), is a common fraud not involving modifications of the chemical composition in the final product. Its detection cannot thus be easily obtained by common analytical methods, which are targeted at changes in concentrations of diagnostic chemical species. In this work, the possibility of spotting this fraud by focusing on the modifications of the supramolecular structure of the food matrix, detected by time domain nuclear magnetic resonance (TD-NMR) experiments, was investigated. Cheese samples were manufactured in triplicate, according to the PDO disciplinary of production, except for using variable amounts of FC (i.e., 0, 15, 30, and 50% w/w). Relaxation data were analysed through different approaches: (i) Discrete multi-exponential fitting, (ii) continuous Laplace inverse fitting, and (iii) chemometrics approach. The strategy that lead to best detection results was the chemometrics analysis of raw Carr-Purcell-Meiboom-Gill (CPMG) decays, allowing to discriminate between compliant and adulterated samples, with as low as 15% of FC addition. The strategy is based on the use of machine learning for projection on latent structures of raw CPMG data and classification tasks for fraud detection, using quadratic discriminant analysis. By coupling TD-NMR raw decays with machine learning, this work opens the way to set up a system for detecting common food frauds modifying the matrix structure, for which no official authentication methods are yet available.

Graphical Abstract

1. Introduction

Food authenticity issues are of great awareness between the agri-food system actors. Fraudulent practices determine misinformation and safety concerns for consumers, unfair competition towards honest producers, and non-compliances to national and international legislations and standards [1,2].
Many food frauds involve the chemical composition alteration of the product: a large part of analytical methods thus aims to detect differences in chemical compositions of non-compliant products, involving highly sophisticated techniques [1].
However, when the fraud involves the modification of the physical state of the food matrix rather than its chemical composition, common food authentication methods are not effective. This task remains challenging in the case of mozzarella cheese added with frozen curd (FC), as no effective molecular markers of this kind of adulteration have been detected so far, at a difference with other frauds such as geographical or milk species origin [3,4]. The fragment 69–209 of beta-casein, deriving from the hydrolysis of β casein by plasmin, also called γ4-CN, was reported by some authors [5] as marker of frozen milk and curd in buffalo mozzarella cheese with Protected Designation of Origin (PDO). However, further studies did not confirm these findings [6].
A different approach based on supramolecular structure characterisation could therefore prove to be efficient where traditional methods fail. Foods are indeed structurally complex materials, due to the compresence of different physical states as well as wide lengths and time scales of their components [7]. As such, the food structure could be used as a fingerprint of a product with a specific formulation and transformation process.
This approach to authentication has been applied to the case study of “Mozzarella di Bufala Campana” PDO cheese. Mozzarella cheese is a complex system and its water distribution differs from most other cheeses because of a particular step of the cheese-making process that corresponds to curd stretching. This step is responsible for changes in its microstructure: During the stretching, an elastic network of oriented parallel protein fibres is created [8,9]. As certified within the European quality label “Protect Denomination of Origin”, the product must be compliant to the regulations regarding geographical origin, raw materials, and production procedures [10] (D.P.C.M. 10/05/1993). However, due to the scarcity of buffalo milk supply during certain years, some producers freeze part of the fresh curd produced during periods of abundance of raw material, to be used when needed in mixtures of fresh and frozen curd [6]. This is a fraudulent practice, deceptive for the consumer and representing a form of unfair competition and a damage to the product brand as well. Food control authorities require analytical or spectroscopic methods to discriminate between fresh water-buffalo Mozzarella PDO cheese and Mozzarella produced from frozen intermediates, which are not compliant to the PDO manufacturing process.
To exploit mozzarella microstructure changes as a proxy for fraudulent practices, a method to detect FC in the final product has been investigated in the current study, measuring the transversal nuclear relaxation decay curves of hydrogen nuclei. Water protons T2 relaxation times in biopolymers are influenced by the presence of exchangeable protons at the biopolymer interface on a nanoscale. Furthermore, structural morphology of the system as well as diffusion exchange processes influence T2 relaxation times at the microscale [11]. Relaxation measurements are also influenced by the physical state (e.g., liquid and solid water or lipids). Thus, transverse relaxation signals can be divided into different components representing 1H populations experiencing different physico-chemical conditions, and the resulting exponential decay can be described as:
I t =   N = 1 n I 0 , n   e x p t T 2 n
Different 1H populations are raised for relaxation sites with different intrinsic relaxation velocities (e.g., 1H at the interface with a protein gel, and in the bulk), physically separated by the system’s structure (e.g., compartments, membranes, insoluble phases). In this condition, 1H nuclei have to diffuse from one site to another to experience a different relaxation rate. If the diffusion time between these two relaxation sites is bigger than the proton residence time within the site with higher intrinsic relaxation velocity, a slow diffusion exchange regime arises. In this condition, a population of 1H is experiencing fast relaxation, while at least another population’s relaxation is determined by the diffusion process to the fast relaxation site, which in turns depends on the morphology and dimensions of the system [12].
By this approach, it has been demonstrated that it is possible to detect dehydration of caseins in mozzarella cheese as affected by frozen and refrigerated storage [13].
The proposed method is based on the study of the evolution of 1H populations, in a structurally and chemically heterogeneous system such as mozzarella cheese, as a function of frozen curd addition during the production process.

2. Materials and Methods

2.1. Mozzarella Cheese Samples

The term frozen curd (FC) refers to freshly prepared curd slowly frozen at −18 °C. The FC used in this work was stored at a freezing temperature for 6 months before samples production.
Cheese samples were manufactured at a production plant within the ‘Mozzarella di Bufala Campana’ PDO Consortium, under the supervision of the Department of Agricultural Sciences of the University of Naples ‘Federico II’, according to the PDO Disciplinary of Production (Italian Ministry of Agriculture & Forestry, 2008), but using variable amounts of FC. The produced cheeses were equally divided in four sample classes: 0, 15, 30, and 50% (w/w), based on the FC content. All samples, including controls, were produced in triplicate.
Freshly prepared curd and thawed FC were shredded and mixed in different ratios depending on sample’s class. The curd mixture was melted with boiling water and stretched following traditional practices to obtain the pasta filata cheese.

2.2. Nuclear Magnetic Resonance (NMR) Relaxometry

Samples were preserved at refrigeration temperature for seven days, reproducing the normal storage conditions of the product; measurements were carried out on day 2 and 6. Each mozzarella sample was split in two equal parts, and from both samples a slice, 1 cm in height, was cut after splitting. From each slice, a cylindrical sample with a 0.8 cm diameter and 1 cm height was excised and placed into a 0.9 cm diameter, Nuclear Magnetic Resonance (NMR) tube (Merck KGaA, Darmstadt, Germany) and sealed with a Polytetrafluoroethylene (PTFE) lid.
Relaxation measurements were performed on a MiniSpec PC/20 benchtop spectrometer (Bruker BioSpin, Karlsruhe, Germany) operating at a 1H resonance frequency of 20 MHz, corresponding to a magnetic field strength equal to 0.47 T. The probe temperature was set to 25 °C and each sample was thermostatically kept at 25 °C for 10 min to reach the measurement temperature prior to analysis.
T2 relaxation times of hydrogen protons were measured in duplicate using the Carr-Purcell-Meiboom-Gill (CPMG) sequence during which 3875 Spin Echoes were acquired with an interpulse spacing of 0.3 ms, 16 scans were accumulated with a recycle delay of 5 s, and the receiver gain was set to 65%. Discrete multi-exponential and continuous curve fitting were carried out respectively on MATLAB R2019a (The MathWorks, Inc., Natick, MA, USA) and UPEN [14]. In the case of continuous fitting, the first five experimental points and those at a time longer than 2150 s were discarded, the former because of instrumental instabilities and the latter because it was subjected to high noise.

2.3. Chemometric Analysis

A dataset of 60 samples was constructed after the removal of four outliers, two for the 0% class and two for the 30% FC class. The dataset was divided into a training set and an independent test, set randomly selecting three samples from each class (Table 1).
Features reduction was performed on the raw Carr-Purcell-Meiboom-Gill (CPMG) relaxation curves with Principal Component Analysis; the PC scores were then used as predictors to build a quadratic discriminant analysis model on the training set. The number of features retained in the model was reduced through a stepwise feature selection, obtaining a subset of predictors that minimises the model’s error rate calculated from a 6-fold cross validation to prevent overfitting. In deeper details, the stepwise features selection starts from a single predictor as a candidate to minimise the misclassification rate of the model through cross-validation. For every subsequent iteration, a further predictor minimising the misclassification rate was added to the subset of the best predictors so far selected. The selection stopped when adding predictors to the subset did not lower the misclassification rate any further. The feature selection process was essential, as the classification problem may not necessarily lie within the maximum variance direction: as a consequence, PCs explaining little variance may be important for the classification task. Finally, the predictive performance of the optimised model was assessed predicting the independent test set. Data analysis was performed with the Statistics and Machine Learning Toolbox in MATLAB R2019a and custom scripts.

3. Results and Discussion
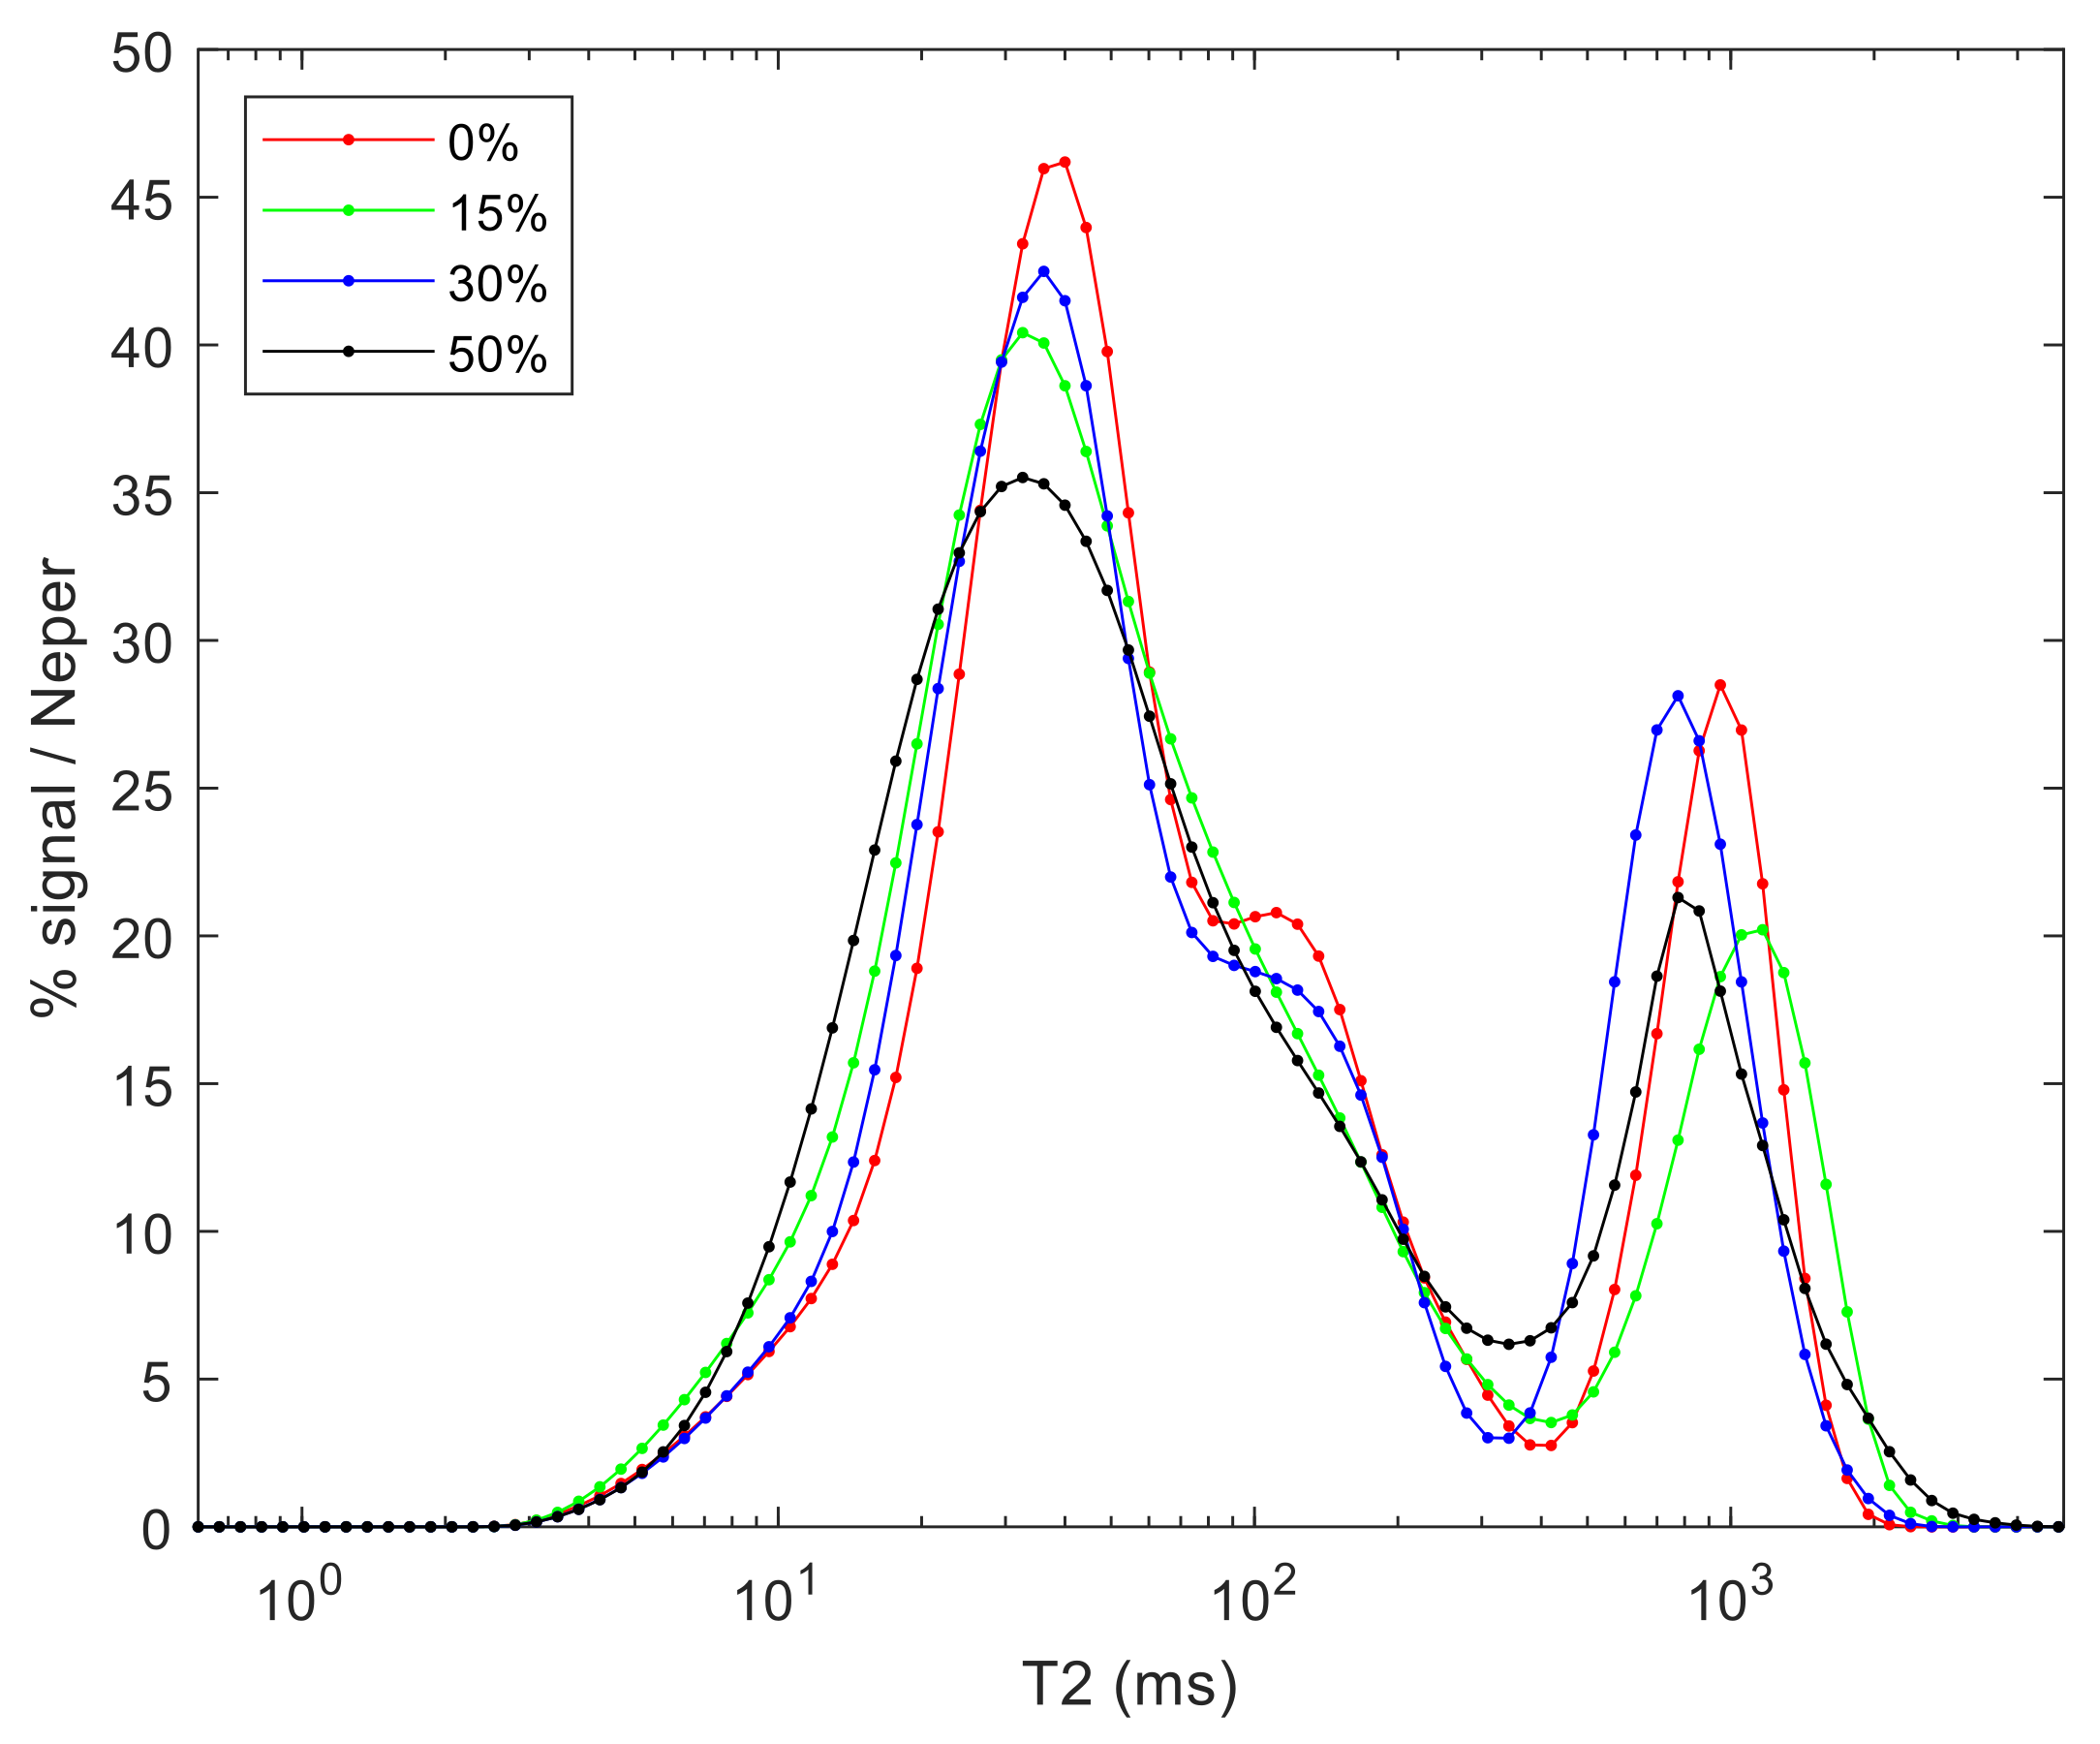
3.1. T2 Relaxation

Due to the stretching process, the mozzarella cheese structure is characterised by channels filled with serum and fat globules dispersed between the casein fibres constituting the gel network [15]. This particular structure led from Equation (1) to a multi-exponential decay, which in the case of “Mozzarella di Bufala Campana” PDO is characterised by four relaxation components, in agreement with Gianferri et al. (2007) [16]. The 1H population with shorter relaxation times (T21) can be attributed to water protons in chemical exchange with hydroxylic and aminic groups at the protein gel surface [16]. Another population with relaxation time (T22) ranging between 33 and 39 ms is represented by water protons diffusing in small channels, experiencing slow diffusion exchange. The third component with a relaxation time between 113 and 135 ms (T23) is constituted by the superimposition of signals originated by water protons in medium sized channels and the protons of the liquid fat phase [17]. The last population is made of water protons in channels with a dimension bigger than the threshold of slow diffusion exchange, with relaxation time (T24) influenced by the presence of whey proteins and saccharides in solution (serum).
No clear trend in the discrete T2 coefficients of these four components as a function of the FC content is observed in Table 2, indicating that the addition of FC does not significantly change the proton relaxation mechanisms in the system. Differently, some population intensities (e.g., I0,1 at day 6) show some trend as a function of FC addition. However, in most cases these trends are not followed by statistical significance. On the other hand, differences in T2 relaxation times of mozzarella samples during storage are due to water migration processes [9] and documented through T2 measurements in mozzarella di bufala cheese [16], and therefore are not treated in this work. As a matter of fact, experiments were performed at two different storage days for evaluating whether the time has an effect on the discriminative power associated to the relaxation data of cheese with different curd additions, not for studying the influence of the storage.
In T2 distributions (Figure 1), it is however possible to see that at a longer T2 (water molecules in large compartments experiencing fast diffusive exchange) there is a signal reduction and shift of the population toward shorter T2 times, when comparing 0% and 50% FC distributions. A different scenario emerges for low and moderate FC concentrations: One distribution (15% FC) is only experiencing signal reduction while the other one (30% FC) is characterised by a shift of T2 times. Moreover, the 1H distribution around 30 ms tends to spread for higher FC percentages. This behaviour highlights the increase in dispersion of compartment dimensions where water molecules are subjected to a slow diffusive exchange, as well as an increase in the fraction of water molecules experiencing fast chemical exchange at the protein gel surface. Generally, an increase in dispersion of T2 distributions can be seen as a function of FC addition during the production process. Since the total signal remains constant between the formulations, this phenomenon can be explained by changes in the protein gel structure, which in turns determines the redistribution of water proton between the different relaxation sites.
Continuous fitting of T2 data resulted in more accurate information about the effect of FC content in mozzarella cheese. The presence of a continuous distribution of compartment’s dimension in the gel network is reflected in a continuous distribution of relaxation times, providing a better description of complex food structures [18]. Furthermore, in T2 relaxation measurements, different compounds can experience the same relaxation time. This phenomenon poses an issue in assigning a single system component to each exponential function. As a matter of fact, the distribution of liquid fat and of slow diffusive water molecules overlaps in mozzarella cheese [17].
T2 distributions appear to be more valuable for FC quantification than the discrete relaxation coefficients reported in Table 2, and continuous relaxation data are preferred for our purpose since parametrisation of T2 distribution can cause a loss of valuable information for the classification problem. However, continuous T2 distributions are strongly dependent on fitting parameters to be set in UPEN software, requiring some a priori knowledge of the system. Raw CPMG decays have therefore been used to build the classification model [19], in order to reduce data pre-processing and the risk of errors during Laplace inverse fitting.

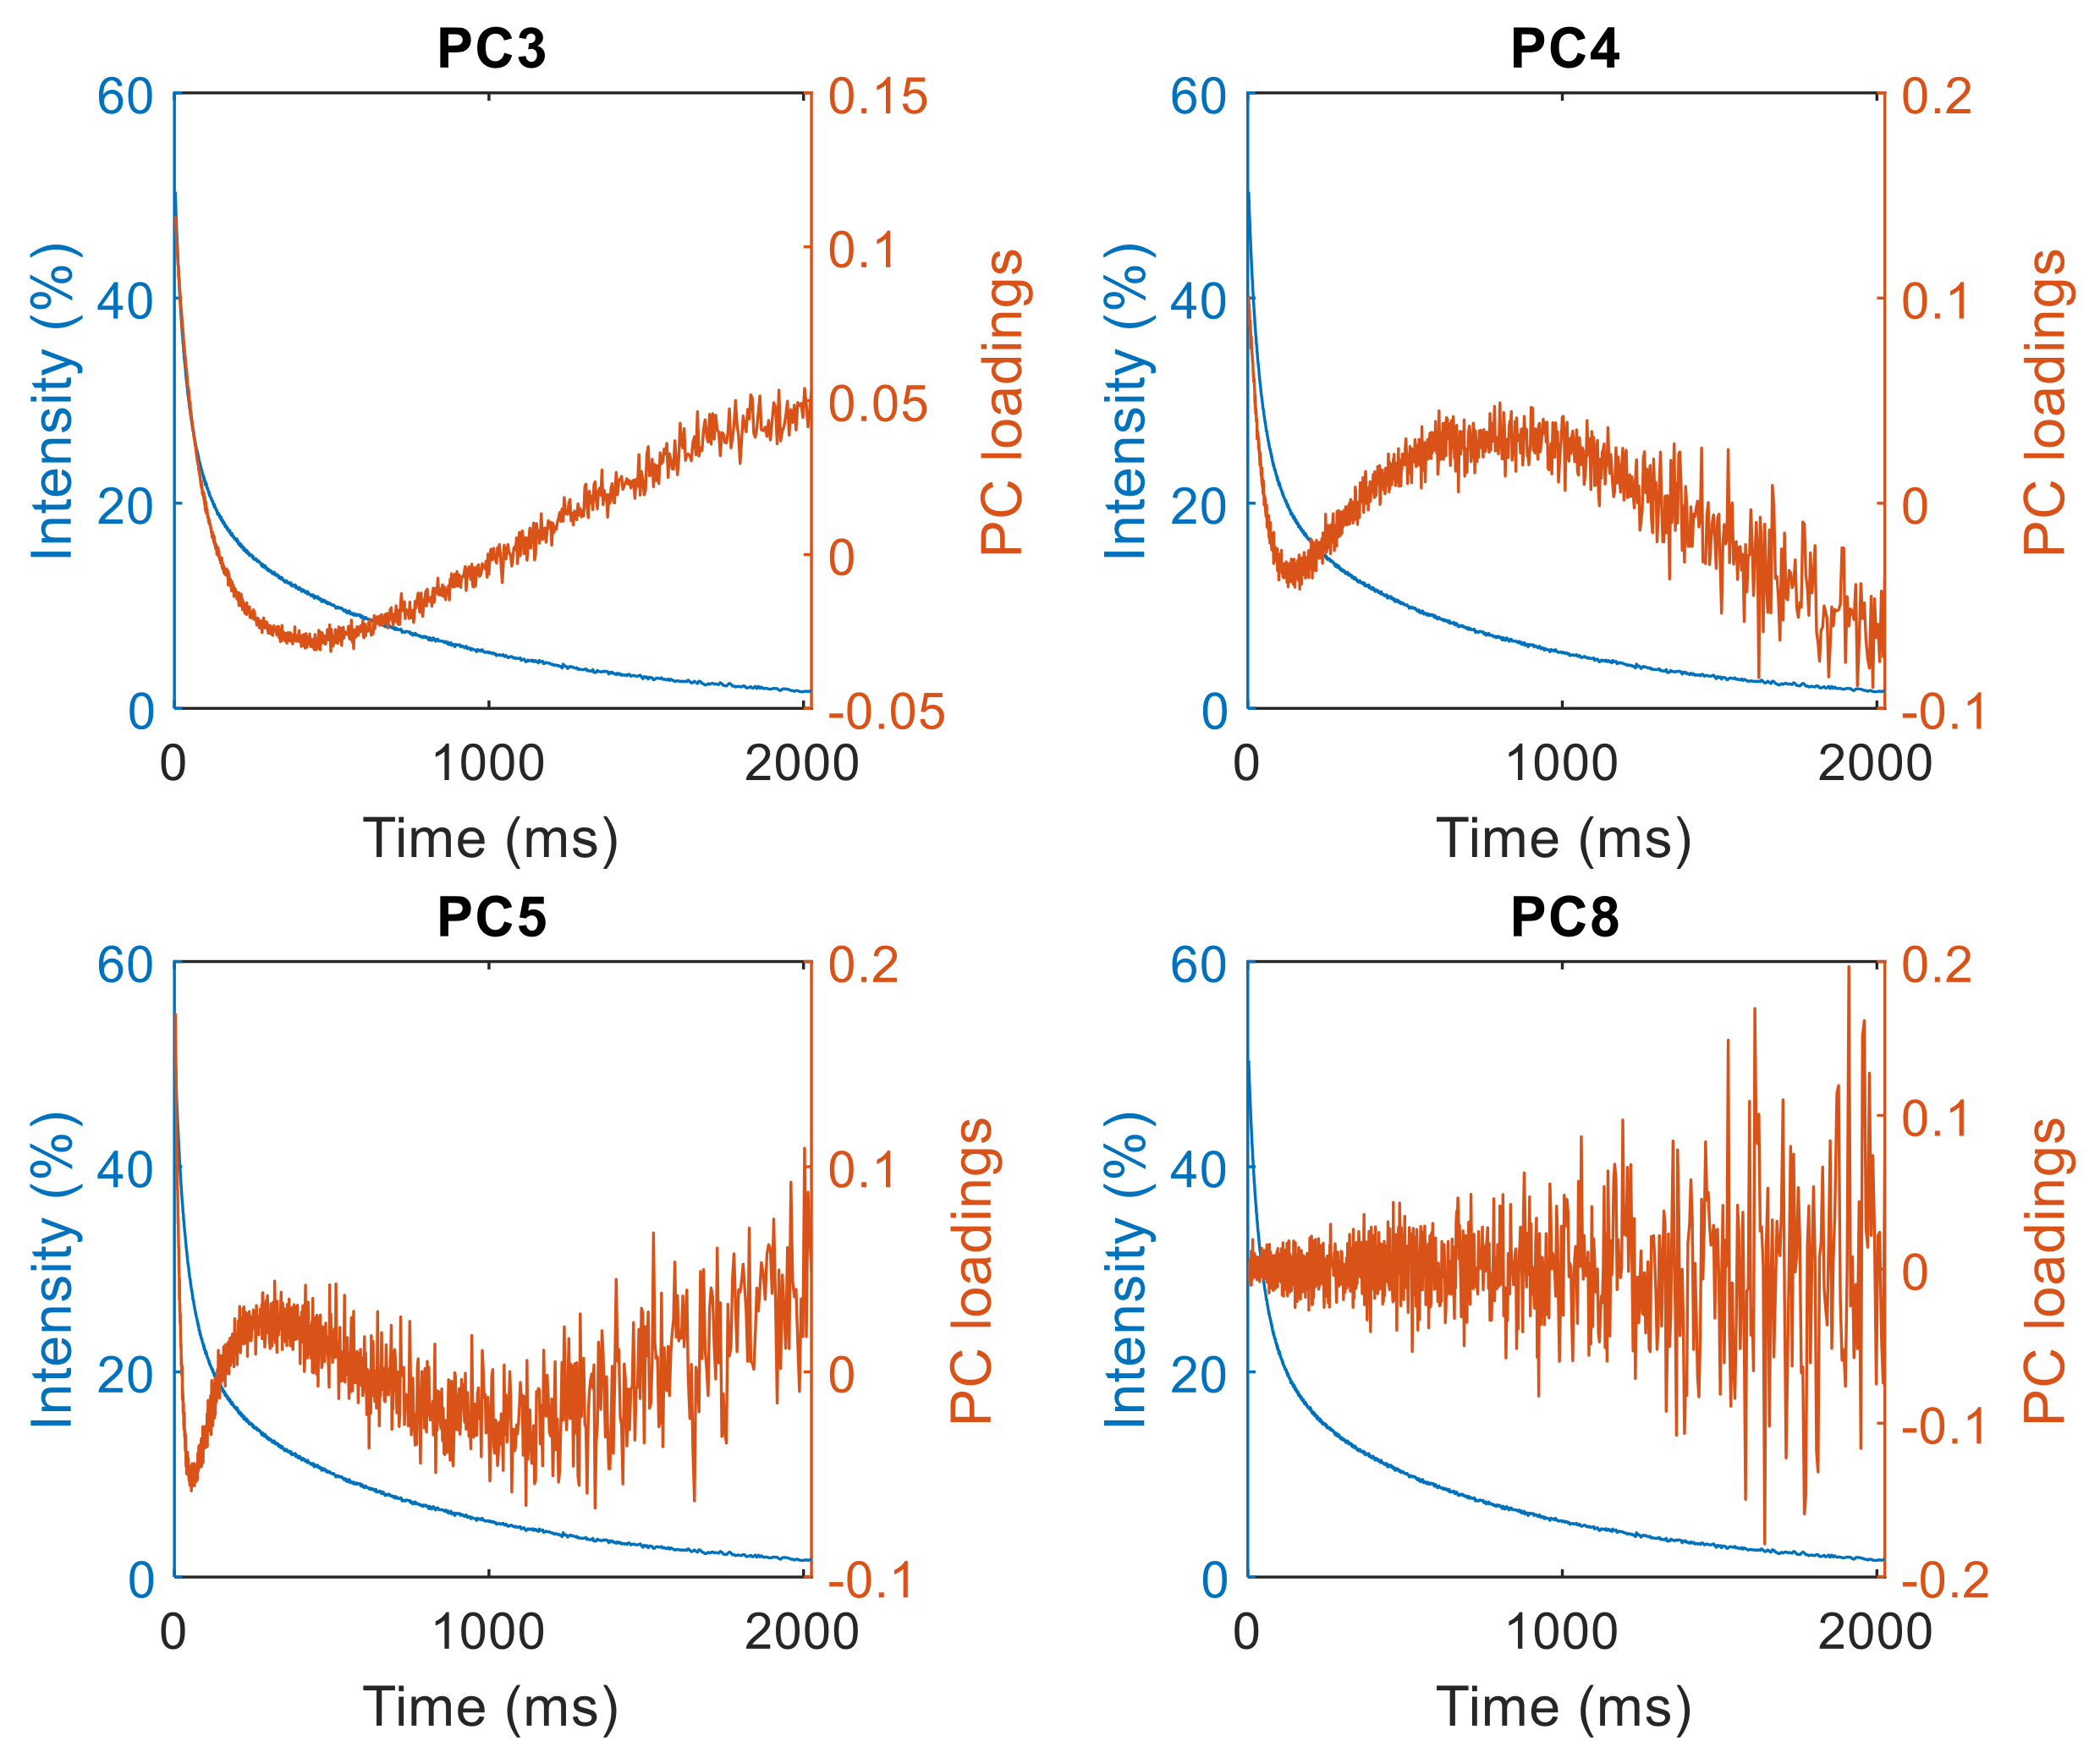
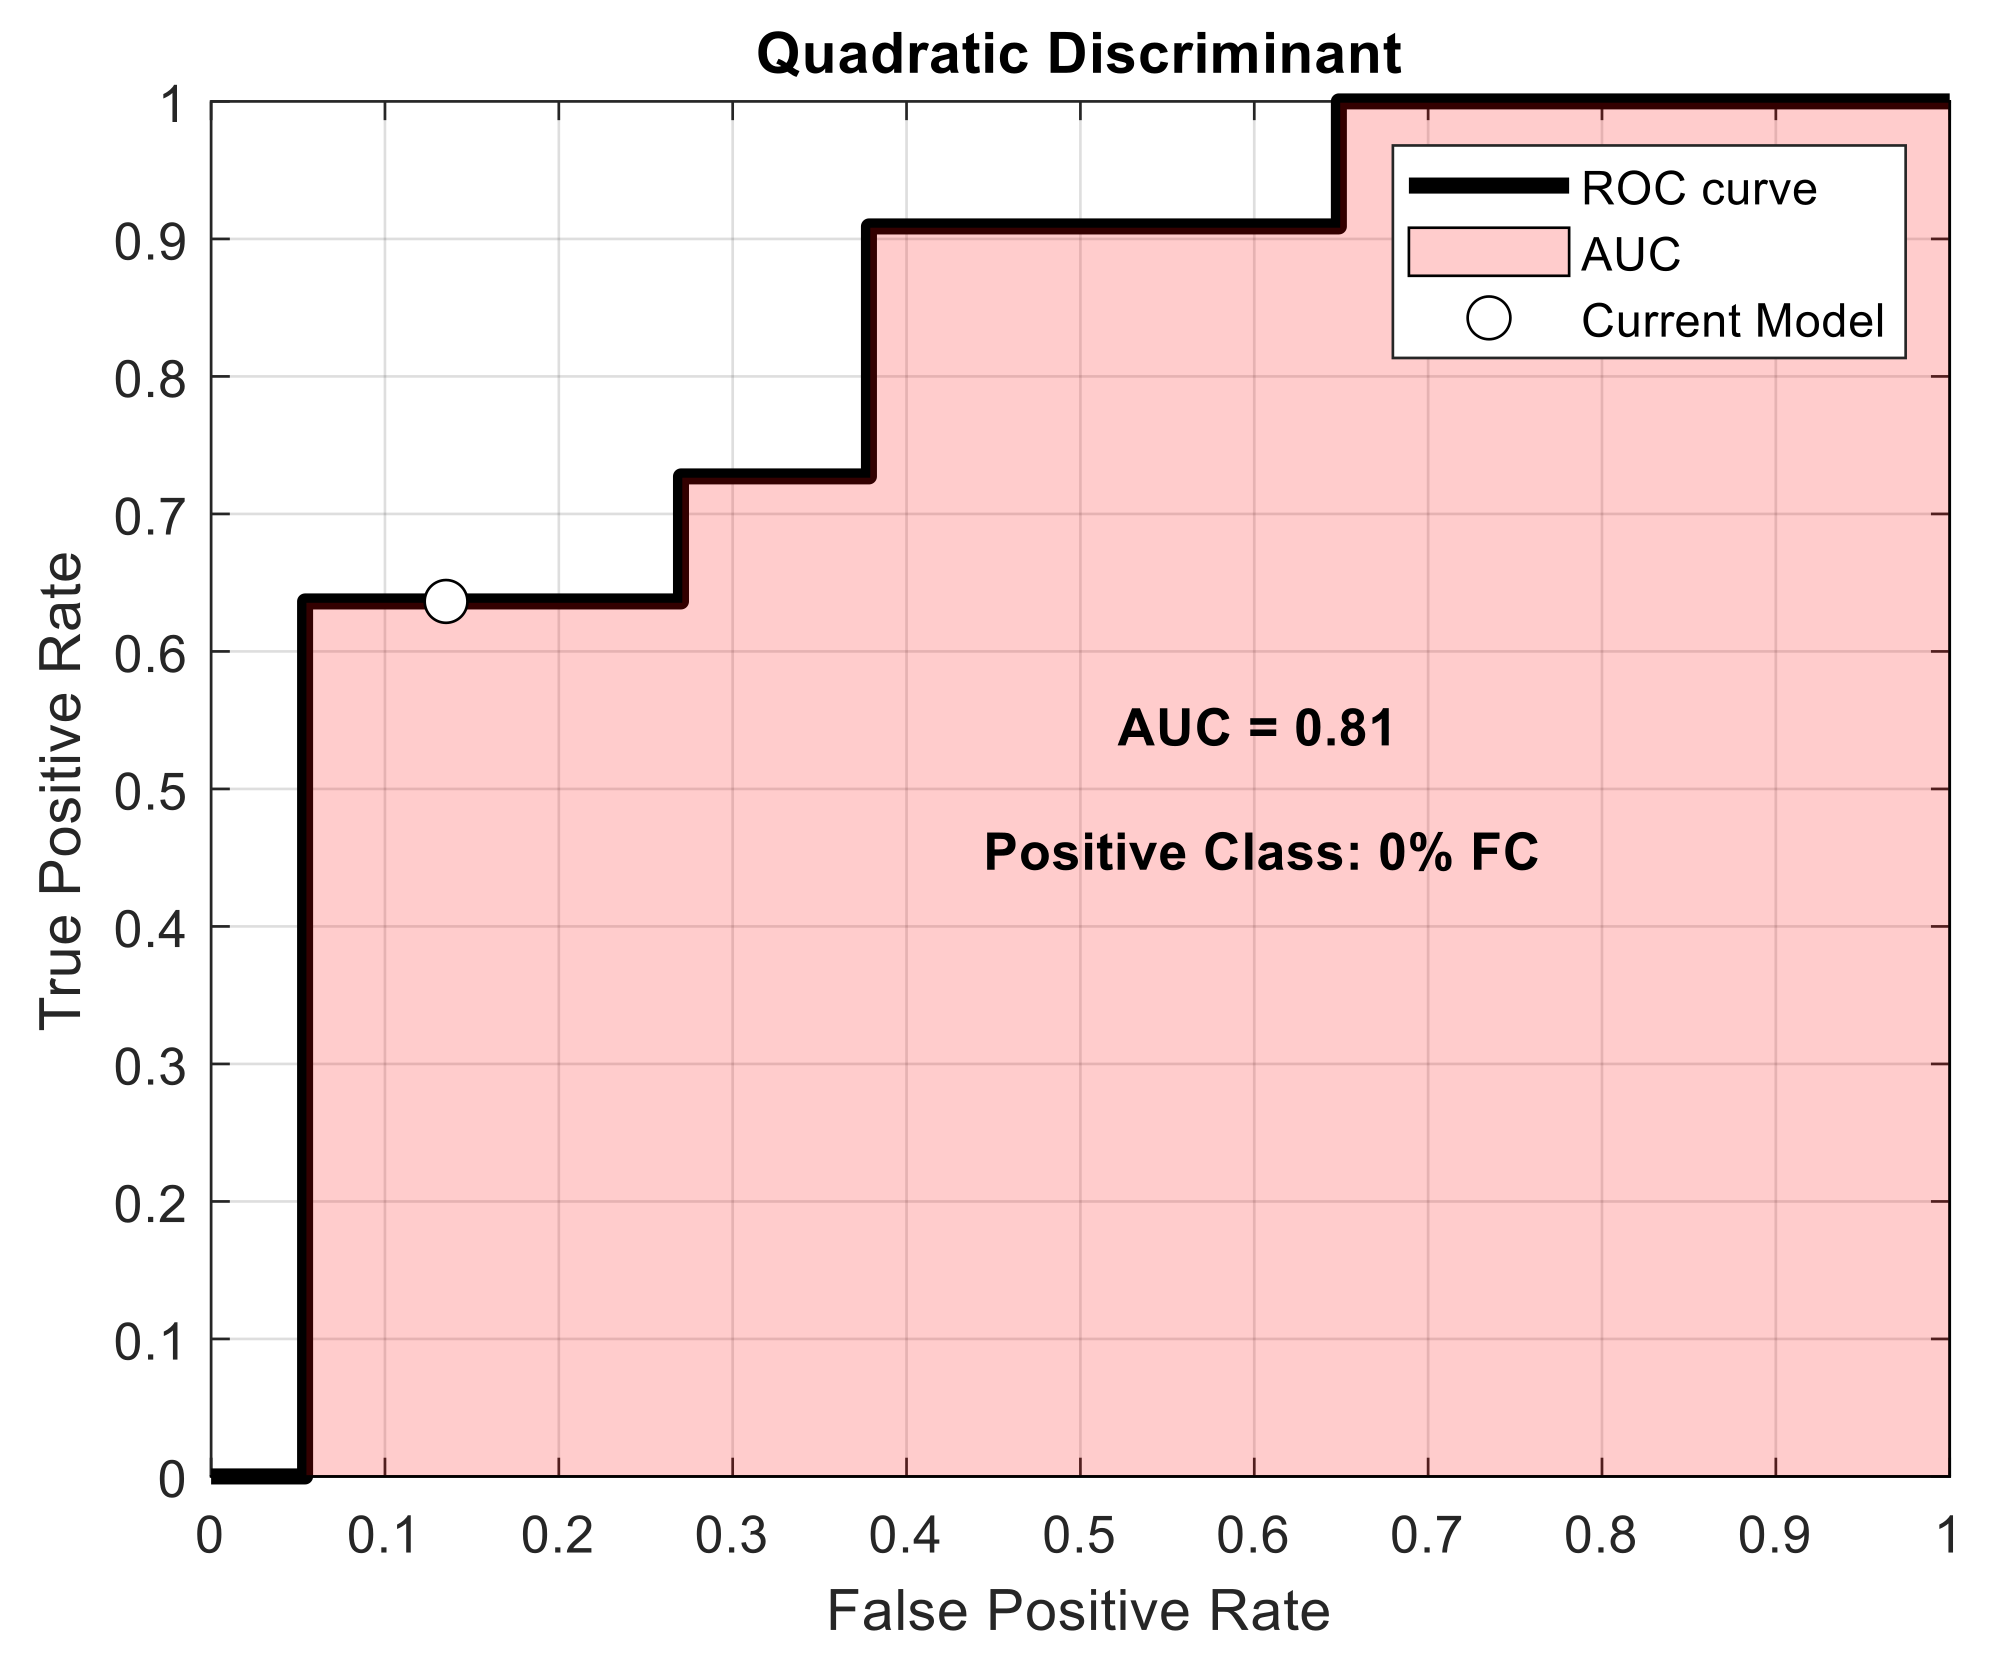
3.2. Quadratic Discriminant Analysis

After undergoing the sequential feature selection process previously described, a subset of four principal components, namely PC3, PC4, PC5, and PC8 is obtained, minimising the error rate of the 6-fold cross validated model to 0.479. As Figure 2 highlights, the fraction of variance relevant for the discrimination between classes refers to short T2 ranging from 10 to 60 ms (PC5), and long T2 (100 to 200 ms) of water protons in solution (PC4). PC3 is characterised by protons with very long T2 (above 800 ms) and is thus associated with bulk water attributable to the mozzarella’s exudate contained in the largest pores. This result reflects the water proton populations highlighted in the T2 distributions (Figure 1). On the other hand, PC8 shows a constant increase in the absolute value of PC loadings as a function of the acquisition time, representing what could be a drift in the signal characterised by high noise and apparently not relevant for the structural description of the food matrix.
The model’s predictions of the cross-validation set and of the independent test set are represented in the confusion matrices reported in Figure 3. Model sensitivity (True Positive Rate) for the cross-validation set is 0.63, 0.54, 0.27, and 0.61 for the classes 0, 15, 30, and 50% FC respectively, while the model sensitivity for the same classes from the independent test set prediction is 0.67, 0.33, 1, and 1. Model specificity (True Negative Rate) for the cross-validation set is 0.86, 0.86, 0.78, and 0.88 for the classes 0, 15, 30, and 50% FC respectively, while model specificity for the same classes from the independent test set prediction is 1, 1, 0.67, and 1. It is remarked that in this case, particular interest is given to the prediction of the 0% FC class, as it is the only class representing unadulterated samples. Thus, evaluating the model performances by focusing on specificity is a better choice for the present classification task than overall accuracy. Figure 3 shows that, in the cross-validation set, four compliant products are mistaken as adulterated (false negatives), while five (out of 37) adulterated products are incorrectly assigned to the complaint PDO class (false positives). Better results are obtained in the independent test set where only one false negative for the 0% FC class was predicted.
Figure 4 shows the receiving operator characteristic (ROC) curve for the 0% class, with an area under the curve (AUC) equal to 0.81. This result denotes a fair discrimination ability of the model for that specific class which is also remarked by the model specificity. This result is particularly important for the purposes of the classification task of this study, and considering the number of samples used to build it, the overall prediction performance of the model is satisfactory.
Although the performance oriented model would predict a classification between authentic vs. fake products, the latter category is not internally homogeneous. Moreover, the model was built on four discrete categories because the matrix effect is not linearly correlated to the fraction of FC. The confusion matrix shown in Figure 3 clearly shows that the prediction errors occur mainly between contiguous classes. Artificially building a single class with all-fake-samples will force the system to consider homogeneous a class that conversely has the same internal differences as those existing between the authentic product and the one with a lower FC content (i.e., 15%). This generates misleading results. Furthermore, the experimental design that lead to the dataset construction was focused on balancing classification performances and description of the supramolecular structure. The multiclass problem also served as a tool to detect a possible FC addition threshold that when surpassed leads to very low misclassification.

4. Conclusions

Four classes of “Mozzarella di Bufala Campana” cheese samples containing respectively 0, 15, 30, and 50% FC were produced and their transversal relaxation decays measured. The acquired relaxation data were analysed through three different approaches, e.g., (i) discrete exponential decay fitting, (ii) continuous Laplace inverse transform, and (iii) chemometric techniques, to determine the best strategy to address the classification problem tied to fraud detection. Univariate statistical analysis of exponential decay model’s coefficients did not highlight a significant pattern to discriminate between the classes. On the contrary, differences in T2 frequency distributions obtained from Laplace inverse transform were detected, although not robust enough to justify a further investigation aimed at conducting validation experiments with more samples. However, the frequency distribution allowed us to mechanistically explain the changes in 1H T2 distributions as a function of the FC addition, in terms of chemical and diffusion exchange models, reflecting the bulk and interface physico-chemical properties of the material. Finally, a chemometric analysis of raw CPMG data resulted in a PC-QDA model, able to discriminate samples based on the FC content, with particular accuracy between compliant (0% FC) and adulterated (15%, 30%, and 50% FC) samples. Therefore, chemometric analysis of raw CPMG decays proved to be the best strategy to discriminate between compliant and non-compliant products. This approach tackles the necessary use of continuous relaxation data to avoid loss of valuable information, while reducing pre-processing and model fitting errors. The proposed approach allows one to determine food authenticity with a method applicable in the specific cases where common analytical techniques based on chemical composition changes fail, due to little or null chemical transformations in the food matrix.
Regarding the method sensitivity, it should be considered that, in most cases, whenever the FC is exploited, approximately 20–40% of frozen material is used, since higher percentages lead to sensory and quality defects that are immediately evident to consumers and inspectors, while frauds with FC concentrations lower than 15% are not economically convenient, also considering the risk to be caught. Therefore, the results here described show that the method can be adequate to detect adulterated samples available on the market with an acceptable specificity, which can be improved by repeating experiments and expanding the dataset with production batches.
In conclusion, the proposed method poses the basis for a systematic exploitation of the approach, based on TD-NMR experiments coupled with chemometrics. Such a fraud detection system is useful in case of adulterations for which changes are expected at the structural level rather than in the chemical composition. It should also be considered that the technique could be in principle performed with bench instruments. Moreover, by using such a framework coupled with wide bore magnets, large enough to accommodate whole food products, the same fraud detection could be performed without opening the package. To this end, the prediction model must consider the bias arising from the governing liquid contained in the package. This work introduced a framework based on TD-NMR experiments coupled with machine learning. Besides the overall good performances for final food fraud detection, the various methods of analysis, presented in this study to obtain the final model, resulted in useful insights on the supramolecular structure of complex food.

Author Contributions

Conceptualisation, C.M., P.F., and F.C.; methodology, D.R., G.P., and A.A.; validation, C.M., D.R., and E.U.; investigation, R.R., P.F., and F.C.; resources, R.R., P.F., and F.C.; data curation, D.R., E.U., and G.P.; writing—original draft preparation, D.R. and C.M.; writing—review and editing, R.R., A.A., P.F., and F.C.; supervision, P.F. and F.C.; funding acquisition, P.F. and F.C. All authors have read and agreed to the published version of the manuscript.

Funding

This research was supported by the PhD Program in Nanoscience for Medicine and Environment established by the Alma Mater Studiorum University of Bologna.

Institutional Review Board Statement

Not applicable.

Informed Consent Statement

Not Applicable.

Data Availability Statement

Datasets generated and analysed during the study, supporting the reported results, are available, upon request via email to F.C., by the Bio-NMR lab.

Acknowledgments

Authentic samples were kindly provided by Caseificio Fratelli Di Lascio srl, 84047 Capaccio Paestum (SA) Italy. The spiked samples were prepared in the same production plant under the supervision of the Department of Agricultural Sciences of the University of Naples ‘Federico II’.

Conflicts of Interest

The authors declare no conflict of interest. The funders had no role in the design of the study; in the collection, analyses, or interpretation of data; in the writing of the manuscript, or in the decision to publish the results.

References

  1. Reid, L.M.; O’Donnell, C.P.; Downey, G. Recent technological advances for the determination of food authenticity. Trends Food Sci. Technol. 2006, 17, 344–353. [Google Scholar] [CrossRef]
  2. Danezis, G.P.; Tsagkaris, A.S.; Camin, F.; Brusic, V.; Georgiou, C.A. Food authentication: Techniques, trends & emerging approaches. TrAC Trends Anal. Chem. 2016, 85, 123–132. [Google Scholar] [CrossRef] [Green Version]
  3. Caira, S.; Pinto, G.; Nicolai, M.A.; Novi, G.; Addeo, F.; Scaloni, A. A non-canonical phosphorylation site in β-casein A from non-Mediterranean water buffalo makes quantifiable the adulteration of Italian milk with foreign material by combined isoelectrofocusing-immunoblotting procedures. Food Chem. 2019, 277, 195–204. [Google Scholar] [CrossRef] [PubMed]
  4. Caira, S.; Pinto, G.; Nicolai, M.A.; Chianese, L.; Addeo, F. Simultaneously tracing the geographical origin and presence of bovine milk in Italian water buffalo Mozzarella cheese using MALDI-TOF data of casein signature peptides. Anal. Bioanal. Chem. 2016, 408, 5609–5621. [Google Scholar] [CrossRef] [PubMed]
  5. Di Luccia, A.; Picariello, G.; Trani, A.; Alviti, G.; Loizzo, P.; Faccia, M.; Addeo, F. Occurrence of β-casein fragments in cold-stored and curdled river buffalo (Bubalus bubalis L.) milk. J. Dairy Sci. 2009, 92, 1319–1329. [Google Scholar] [CrossRef] [PubMed] [Green Version]
  6. Manzo, N.; Biondi, L.; Nava, D.; Capuano, F.; Pizzolongo, F.; Fiore, A.; Romano, R. On the Possibility to Trace Frozen Curd in Buffalo Mozzarella Cheese. J. Food Res. 2017, 6, 104. [Google Scholar] [CrossRef] [Green Version]
  7. Mezzenga, R.; Schurtenberger, P.; Burbidge, A.; Michel, M. Understanding foods as soft materials. Nat. Mater. 2005, 4, 729–740. [Google Scholar] [CrossRef] [PubMed]
  8. Kuo, M.-I.; Anderson, M.; Gunasekaran, S. Determining Effects of Freezing on Pasta Filata and Non-Pasta Filata Mozzarella Cheeses by Nuclear Magnetic Resonance Imaging. J. Dairy Sci. 2003, 86, 2525–2536. [Google Scholar] [CrossRef] [Green Version]
  9. Kuo, M.-I.; Gunasekaran, S.; Johnson, M.; Chen, C. Nuclear Magnetic Resonance Study of Water Mobility in Pasta Filata and Non-Pasta Filata Mozzarella. J. Dairy Sci. 2001, 84, 1950–1958. [Google Scholar] [CrossRef]
  10. Italian Ministry of Agriculure & Forestry. Disciplinary of Production of Mozzarella di Bufala Campana DOP, 11 February 2008, According to CE Regulation n. 1107. 12 June 1996. Available online: https://www.mozzarelladop.it/wp-content/uploads/2019/03/disciplinare_mozzarella_2008-2.pdf (accessed on 15 December 2020).
  11. Hills, B.; Takacs, S.; Belton, P. He effects of proteins on the proton N.M.R. transverse relaxation times of water I. Native bovine serum albumin. Mol. Phys. 1989, 67, 903–918. [Google Scholar] [CrossRef]
  12. Hills, B.; Takacs, S.; Belton, P. The effects of proteins on the proton N.M.R. transverse relaxation time of water—II. Mol. Phys. 1989, 67, 919–937. [Google Scholar] [CrossRef]
  13. Alinovi, M.; Corredig, M.; Mucchetti, G.; Carini, E. Water status and dynamics of high-moisture Mozzarella cheese as affected by frozen and refrigerated storage. Food Res. Int. 2020, 137, 109415. [Google Scholar] [CrossRef] [PubMed]
  14. Borgia, G.; Brown, R.; Fantazzini, P. Uniform-Penalty Inversion of Multiexponential Decay Data. J. Magn. Reson. 1998, 132, 65–77. [Google Scholar] [CrossRef] [PubMed] [Green Version]
  15. McMahon, N.J.; Fife, R.L.; Oberg, C.J. Water Partitioning in Mozzarella Cheese and Its Relationship to Cheese Meltability. J. Dairy Sci. 1999, 82, 1361–1369. [Google Scholar] [CrossRef]
  16. Gianferri, R.; D’Aiuto, V.; Curini, R.; Delfini, M.; Brosio, E. Proton NMR transverse relaxation measurements to study water dynamic states and age-related changes in Mozzarella di Bufala Campana cheese. Food Chem. 2007, 105, 720–726. [Google Scholar] [CrossRef]
  17. Vermeir, L.; Declerck, A.; To, C.M.; Kerkaert, B.; Van Der Meeren, P. Water and oil signal assignment in low-moisture mozzarella as determined by time-domain NMR T2 relaxometry. Magn. Reson. Chem. 2019, 57, 674–685. [Google Scholar] [CrossRef] [PubMed]
  18. Brown, R.J.; Capozzi, F.; Cavani, C.; A Cremonini, M.; Petracci, M.; Placucci, G. Relationships between 1H NMR Relaxation Data and Some Technological Parameters of Meat: A Chemometric Approach. J. Magn. Reson. 2000, 147, 89–94. [Google Scholar] [CrossRef] [PubMed]
  19. Bianchi, M.; Capozzi, F.; Cremonini, M.A.; Laghi, L.; Petracci, M.; Placucci, G.; Cavani, C. Influence of the season on the relationships between NMR transverse relaxation data and water-holding capacity of turkey breast meat. J. Sci. Food Agric. 2004, 84, 1535–1540. [Google Scholar] [CrossRef]
Figure 1. Mean T2 distribution of day 2 samples as function of frozen curd (FC) content. Different FC concentrations are denoted by solid coloured lines.
Applsci 11 01466 g001
Figure 2. Comparison between principal components (PC) loadings and a sample’s Carr-Purcell-Meiboom-Gill (CPMG) decay curves; high loadings in absolute value indicate the most important original features in that principal component.
Applsci 11 01466 g002
Figure 3. Confusion matrices of the 6-fold cross-validation set and independent test set. On the diagonal are reported the true positive and true negative cases for each class. Along the rows there are false negative cases and along the column are reported the false positive cases.
Applsci 11 01466 g003
Figure 4. Receiving operator characteristic (ROC) curve and area under the curve (AUC) for the 0% frozen curd samples class.
Applsci 11 01466 g004
Table 1. Training and test set composition: Frozen curd (FC).
Class0% FC15% FC30% FC50% FCTotal
Number of Observations
Training Set1113111348
Test Set333312
Table 2. Means and standard deviations of discrete coefficients from the exponential decay model for each 1H population, population intensities (I0) are normalised on the total signal intensity.
FC%I0,1 (%)T21 (ms)I0,2 (%)T22 (ms)I0,3 (%)T23 (ms)I0,4 (%)T24 (ms)
Day 2013.220 ± 2.187 a11.944 ± 1.846 a43.629 ± 2.740 a39.771 ± 3.856 a21.906 ± 2.147 a135.085 ± 13.323 a21.244 ± 2.862 a846.984 ± 47.347 a
1516.316 ± 1.667 b11.823 ± 1.676 a42.418 ± 2.974 a38.316 ± 4.485 a21.629 ± 0.994 a131.194 ± 16.175 a19.637 ± 2.180 a918.424 ± 168.591 a
3014.054 ± 2.823 a11.277 ± 1.619 a43.439 ± 2.294 a36.629 ± 4.355 a21.541 ± 2.479 a127.584 ± 17.635 a20.966 ± 2.241 a705.069 ± 89.450 b
5017.924 ± 2.410 b11.409 ± 0.725 a39.937 ± 1.260 b36.804 ± 1.989 a20.922 ± 1.767 a129.341 ± 9.782 a21.216 ± 1.243 a807.657 ± 177.846 a
Day 6012.503 ± 3.623 a10.680 ± 1.164 a38.806 ± 2.075 a34.153 ± 3.021 a19.300 ± 1.140 a114.991 ± 8.721 a29.390 ± 3.776 a682.550 ± 88.990 a
1511.556 ± 2.334 a11.054 ± 1.601 a 37.320 ± 3.067 a36.040 ± 3.414 a21.626 ± 2.100 b120.579 ± 10.478 a29.498 ± 4.498 a661.462 ± 86.248 a
309.922 ± 2.180 a,b9.797 ± 1.624 a 39.658 ± 2.067 a33.360 ± 1.955 a22.172 ± 2.121 b114.198 ± 6.283 a28.274 ± 3.213 a629.142 ± 46.564 a
509.091 ± 1.759 b9.523 ± 1.116 a38.290 ± 1.888 a33.366 ± 2.950 a22.907 ± 1.690 b113.300 ± 9.415 a29.711 ± 3.950 a542.335 ± 88.236 b
a|b different letters indicate significant difference with Mann–Whitney U test (p < 0.05).
Publisher’s Note: MDPI stays neutral with regard to jurisdictional claims in published maps and institutional affiliations.

