Article

Exploration of Fall-Evaluation Scores Using Clinical Tools with the Short-Form Berg Balance Scale and Timed Up and Go and Motion Detection Sensors

1
Department of Industrial Management, National Taiwan University of Science and Technology, Taipei 106, Taiwan
2
Department of Industrial Engineering and Management, Yuan Ze University, Taoyuan 320, Taiwan
*
Author to whom correspondence should be addressed.
Appl. Sci. 2020, 10(19), 6931; https://doi.org/10.3390/app10196931
Submission received: 12 August 2020 / Revised: 21 September 2020 / Accepted: 1 October 2020 / Published: 3 October 2020

Abstract

:
The results obtained by medical experts and inertial sensors via clinical tests to determine fall risks are compared. A clinical test is used to perform the whole timed up and go (TUG) test and segment-based TUG (sTUG) tests, considering various cutoff points. In this paper, (a) t-tests are used to verify fall-risk categorization; and (b) a logistic regression with 100 stepwise iterations is used to divide features into training (80%) and testing sets (20%). The features of (a) and (b) are compared, measuring the similarity of each approach’s decisive features to those of the clinical-test results. In (a), the most significant features are the Y and Z axes, regardless of the segmentation, whereas sTUG outperforms TUG in (b). Comparing the results of (a) and (b) based on the overall TUG test, the Z axis multiscale entropy (MSE) features show significance regardless of the approach: expert opinion or logistic prediction. Among various clinical test combinations, the only commonalities between (a) and (b) are the Y-axis MSE features when walking. Thus, machine learning should be based on both expert domain knowledge and a preliminary analysis with objective screening. Finally, the clinical test results are compared with the inertial sensor results, prompting the proposal for multi-oriented data analysis to objectively verify the sensor results.

1. Introduction

Falling is a common problem among older people living in the community and can have serious consequences for their lives and the society [1]. As reported by the World Health Organization (WHO), the population of elderly people (aged 60 or over) will increase from 900 million in 2015 to about 20 billion by 2050, accounting for 22% of the world’s 2050 population [2]. Fall prediction is a multifaceted problem involving complex interactions among physiological, behavioral, and environmental factors [3]. Clinical fall-risk assessments typically include questionnaires and functional assessment of the posture, gait, cognition, and other risk factors with respect to falling [3]. These clinical assessments provide an overview of the fall-risk snapshots but are usually subjective, and those who use threshold assessment scores for performing the classification are considered to be decreasing rather than increasing [4]. Therefore, previous relevant studies have used the timed up and go (TUG) time score as a clinical evaluation item to overcome the subjective interpretation of falls [5]. The objective of clinical screenings is to find the outliers. The most common method used for clinically determining the thresholds is the clustering criteria. The TUG test performs a simple, rapid, and applicable clinical assessment of the balance and mobility of older people. However, the environmental assessment tools use clinical assessment scales or test data for analyzing the fall risk. The TUG assessment has been used to assess the fall risk in previous cohort studies of different versions and approaches using wearable sensors [5,6,7,8,9,10,11], predominantly by testing in controlled laboratory environments [9] or focusing on inpatients [11] and healthy subjects [5,11,12,13]. In addition, although a few studies have focused on community-dwelling older people, there is no consensus about the scores for this group, most of which can be attributed to subjects belonging to different groups. For example, Shumway-Cook et al. [14] discriminated a community within 13.5 s. Steffen et al. [15] used 15 s to determine whether there is an optimal cutoff point for the risk of falling and whether the older people living in a family have a risk of falling. Subjects of different groups have different cutoff points. However, in the older-people community, there is no way to clearly divide this point. In case of the same problem, most research intends to select specific subjects for discussion; however, it is considerably difficult to select subjects applicable to the health of the real environment or the subhealth.
Under first-line clinical diagnosis, clinical-test evaluation allows a comprehensive quantitative comparison of the performances of different tasks; however, most fall-risk assessments require the supervision of a medical professional [16]. Therefore, these tests are usually not applicable to large groups, such as community-dwelling older people, under first-line clinical diagnosis because of medical manpower constraints. Screenings for older people surviving a fall must avoid cumbersome processes, minimize the time required for case screening, and reduce dropout. In community service, the risk of falling and the use of artificial intelligence machine learning techniques must be discussed as part of the Internet of Things (IoT) to support medical services and improve the medical quality. “Connected health” brings the concept of intelligent health, which is an application based on the IoT. The effectiveness of sensor-based care models in clinical outcomes and cost savings was mentioned in a literature review on connected medicine; however, an understanding of how to use the value of the data can be derived from the patients by monitoring them at home and in the community, so obtaining information and then combining it with other biopsychosocial data to obtain information about whether patients need intervention, knowing that corresponding care information is less discussed [17]. We believe that the use of data to optimize the development and verification of, and practical integration into, medical services, will be discussed as a benchmark study for the introduction of connected health.
Furthermore, the data collected by a sensor for determining the risk of falls has shown academic research value. Previous studies have shown that high specificity and sensitivity are the main objectives of a reliable fall prediction system [18] because the final decision will affect the classification and influence of the intermediate voters in case of several patients and crossovers. In some previous studies [16,19], inertial sensors were introduced in the community for ensuring community care services, and the TUG features were calculated using a stopwatch and by performing entropy measurements using sensors [9]. These methods are frequently utilized to evaluate physiological data, such as blood pressure, heart rate, and postural stability. Entropy analysis is used for gait evaluation across a spectrum of pathologies [20,21,22,23]. Sample entropy measures the probability that two sequences will remain similar at the next point of a time series. More random signals that are produced by healthy limbs are associated with higher sample entropy values [24]. Healthy human physical conditions are more complex when compared with the pathological movement. This entropy measurement indicates that the low entropy values represent a less random signal produced by an injured limb. A more random signal produced by a healthy condition is associated with a high entropy value. Unlike statistical measures or asymmetry indices, entropy values can provide insight with respect to the presence of what is considered to be desirable variability [24]. The entropy measures for time series, such as sample entropy (SampEn) and approximated entropy (ApEn) [25], can be used to measure the unpredictability (opposite of regularity) of a time series. More recently, Costa et al. [26,27] proposed multiscale entropy (MSE), a new entropy-based measure for time series that seems to better quantify complexity. These sensors can objectively understand the risk of falling; however, it is difficult to perform subsequent analysis in field experiments because of the large amount of data obtained from different axes of the sensor and because of the implementation of multiple evaluations.
Moreover, the sensor does not have a cutoff point for classification; furthermore, there is no comparable experiment group, and it is impossible to extract the association of the fall-risk factors one-by-one. Therefore, when classifying high-dimensional data obtained from devices such as sensors, it is unclear whether the dataset is clearly separable (i.e., whether the interval between similar types is small or the interval between the different types is large).
If the dataset is not large (e.g., only a few hundred or thousand data items or only dozens or hundreds of fields per pen), training complex artificial intelligence algorithms may be insufficient. In contrast, small parts of large datasets can be sampled before the operation, and the data can be rapidly understood visually, albeit with limited accuracy, using a simple algorithm with low computational complexity. Recently, Wu et al. [28] used multiscale entropy to analyze the triaxial acceleration signals of the overall TUG and found that segment-based TUG (sTUG) was more irregular and complex for the non-fall-risk subjects compared with the fall risk one’s subjects. These results indicate that, compared with the overall TUG, sTUG can reveal more information about postural (transition/gait) stability and provide more predictors of fall risk for assessment among community-dwelling elderly people. Therefore, we attempted to further explore the correlation between the internal sensor and the clinical test as further feedback. We must ensure the correlation of the data with clinical variables. We also need to learn more about how we used the MSE analysis sensor features for the best clinical capture and inform the patients about the environment in which the target data are obtained. By transforming data into information, we hope to use these data as physiological data for primary medical institutions for preliminary screening and prediction.
For those who actually perform the data analysis tasks, many ambiguous areas remain, such as the crossover among older people between fallers and non-fallers, as well as the different classification cut points. Therefore, a perception of the feasibility, acceptability, and availability of new tools and techniques in clinical practice [29,30] via data visualization is essential. This perception is far more critical than the usage of community services in obtaining an initial judgment of subhealth. Assessing the physical balance of older people in the community helps to identify a follow-up of those individuals who are likely to fall [31,32,33]. However, clinical trials of the scale filters are too sensitive, making older people likely to underestimate the risk of falling [15,34,35,36,37,38]. In addition, fall-risk assessment should be verified across various aspects [20,39,40,41] to ensure that the patient can reach a thoroughly informed decision. Such an assessment’s main purposes include understanding the principles of data, discovering potential data structures, and extracting important variables. This approach also involves the detection of outliers, verification of hypotheses, development of data reduction models, and determination of optimization factor settings [40]. Therefore, in this study we hope to use the cutoff points of clinical tasks as benchmark results to explore how to incorporate sensors in the auxiliary tasks of TUG and short-form Berg balance scale (SFBBS) clinical tasks to reflect the results of patients in the past and to assess the value of the sensor data. This aim integrates connected health thinking into the environment, allowing individuals to shift from a “Reaction” mode to “Preaction” mode.

2. Materials and Methods
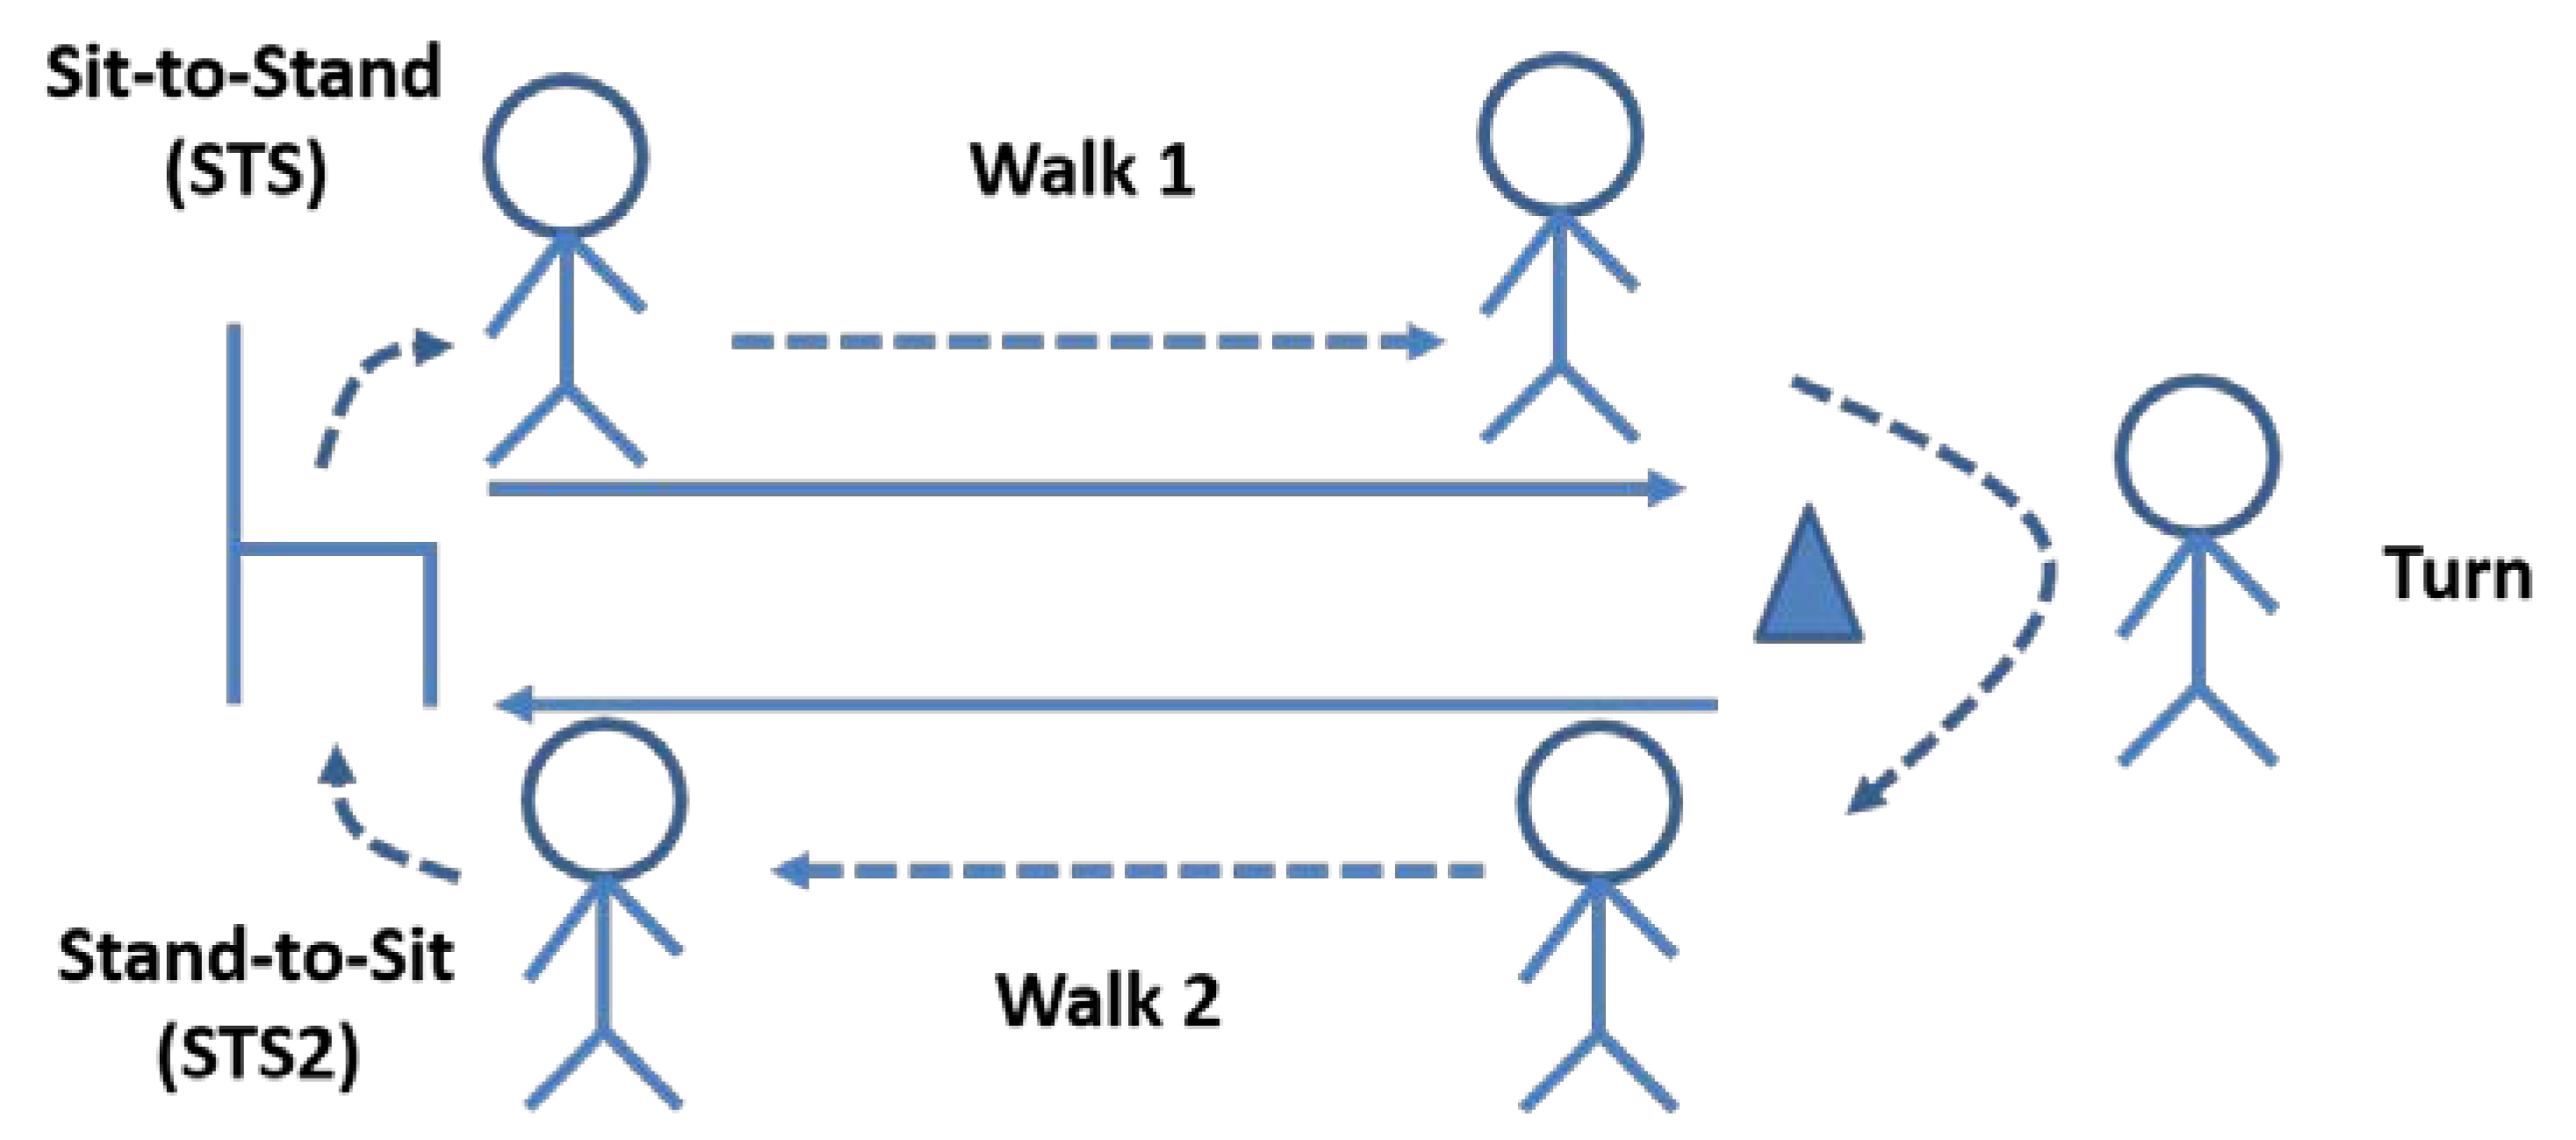
2.1. Protocol

The experimental design of this research is cross-sectional. The research data were sourced from a cross-disciplinary professional team in a regional hospital in central Taiwan, including geriatric physicians, rehabilitation physicians, physical therapists, occupational therapists, and social workers. From April 2014 to May 2015, a community fall risk assessment for the elderly in the neighborhood of the Feng Yuan hospital (including 7 administrative regions) was conducted, randomly including clinical tests such as TUG and the SFBBS. On average, older people spent 20 min to complete the suite of fall assessment tests. Simultaneously, data were collected using TUG tests with sensors. The X, Y, and Z axes were aligned with vertical (V; Up, +; Down, −), mediolateral (ML; Right, +; Left, −), and anterior–posterior (AP; Forward, +; Backward, −) directions; accordingly, a segment-based TUG (sTUG) test was designed, which can be obtained according to the domain knowledge, including the “sit-to-stand (STS)”, “sit-to-walk”, “turn”, and “stand-to-sit (STS2)” segments. This study was approved by the Institutional Review Board of Tsaotun Psychiatric Center, Ministry of Health and Welfare.

2.2. Subjects

We present a field experiment conducted by a professional team from a hospital in central Taiwan that recruited older people in communities to assess their risk of falling. Seventy-four community-dwelling older people persons living in different communities in Taiwan were recruited as the convenience sample (17 males, age: 75.23 ± 11.50; 57 females, age: 73.12 ± 8.56). As reviewed by the professional team, the enrolment criteria for the subjects excluded those with musculoskeletal system injuries, any history of central nervous system injuries, and/or walking dependently with or without the use of any aid within the previous three months. After the researchers explained the details, each subject agreed to participate and signed consent forms prior to entering the laboratory.

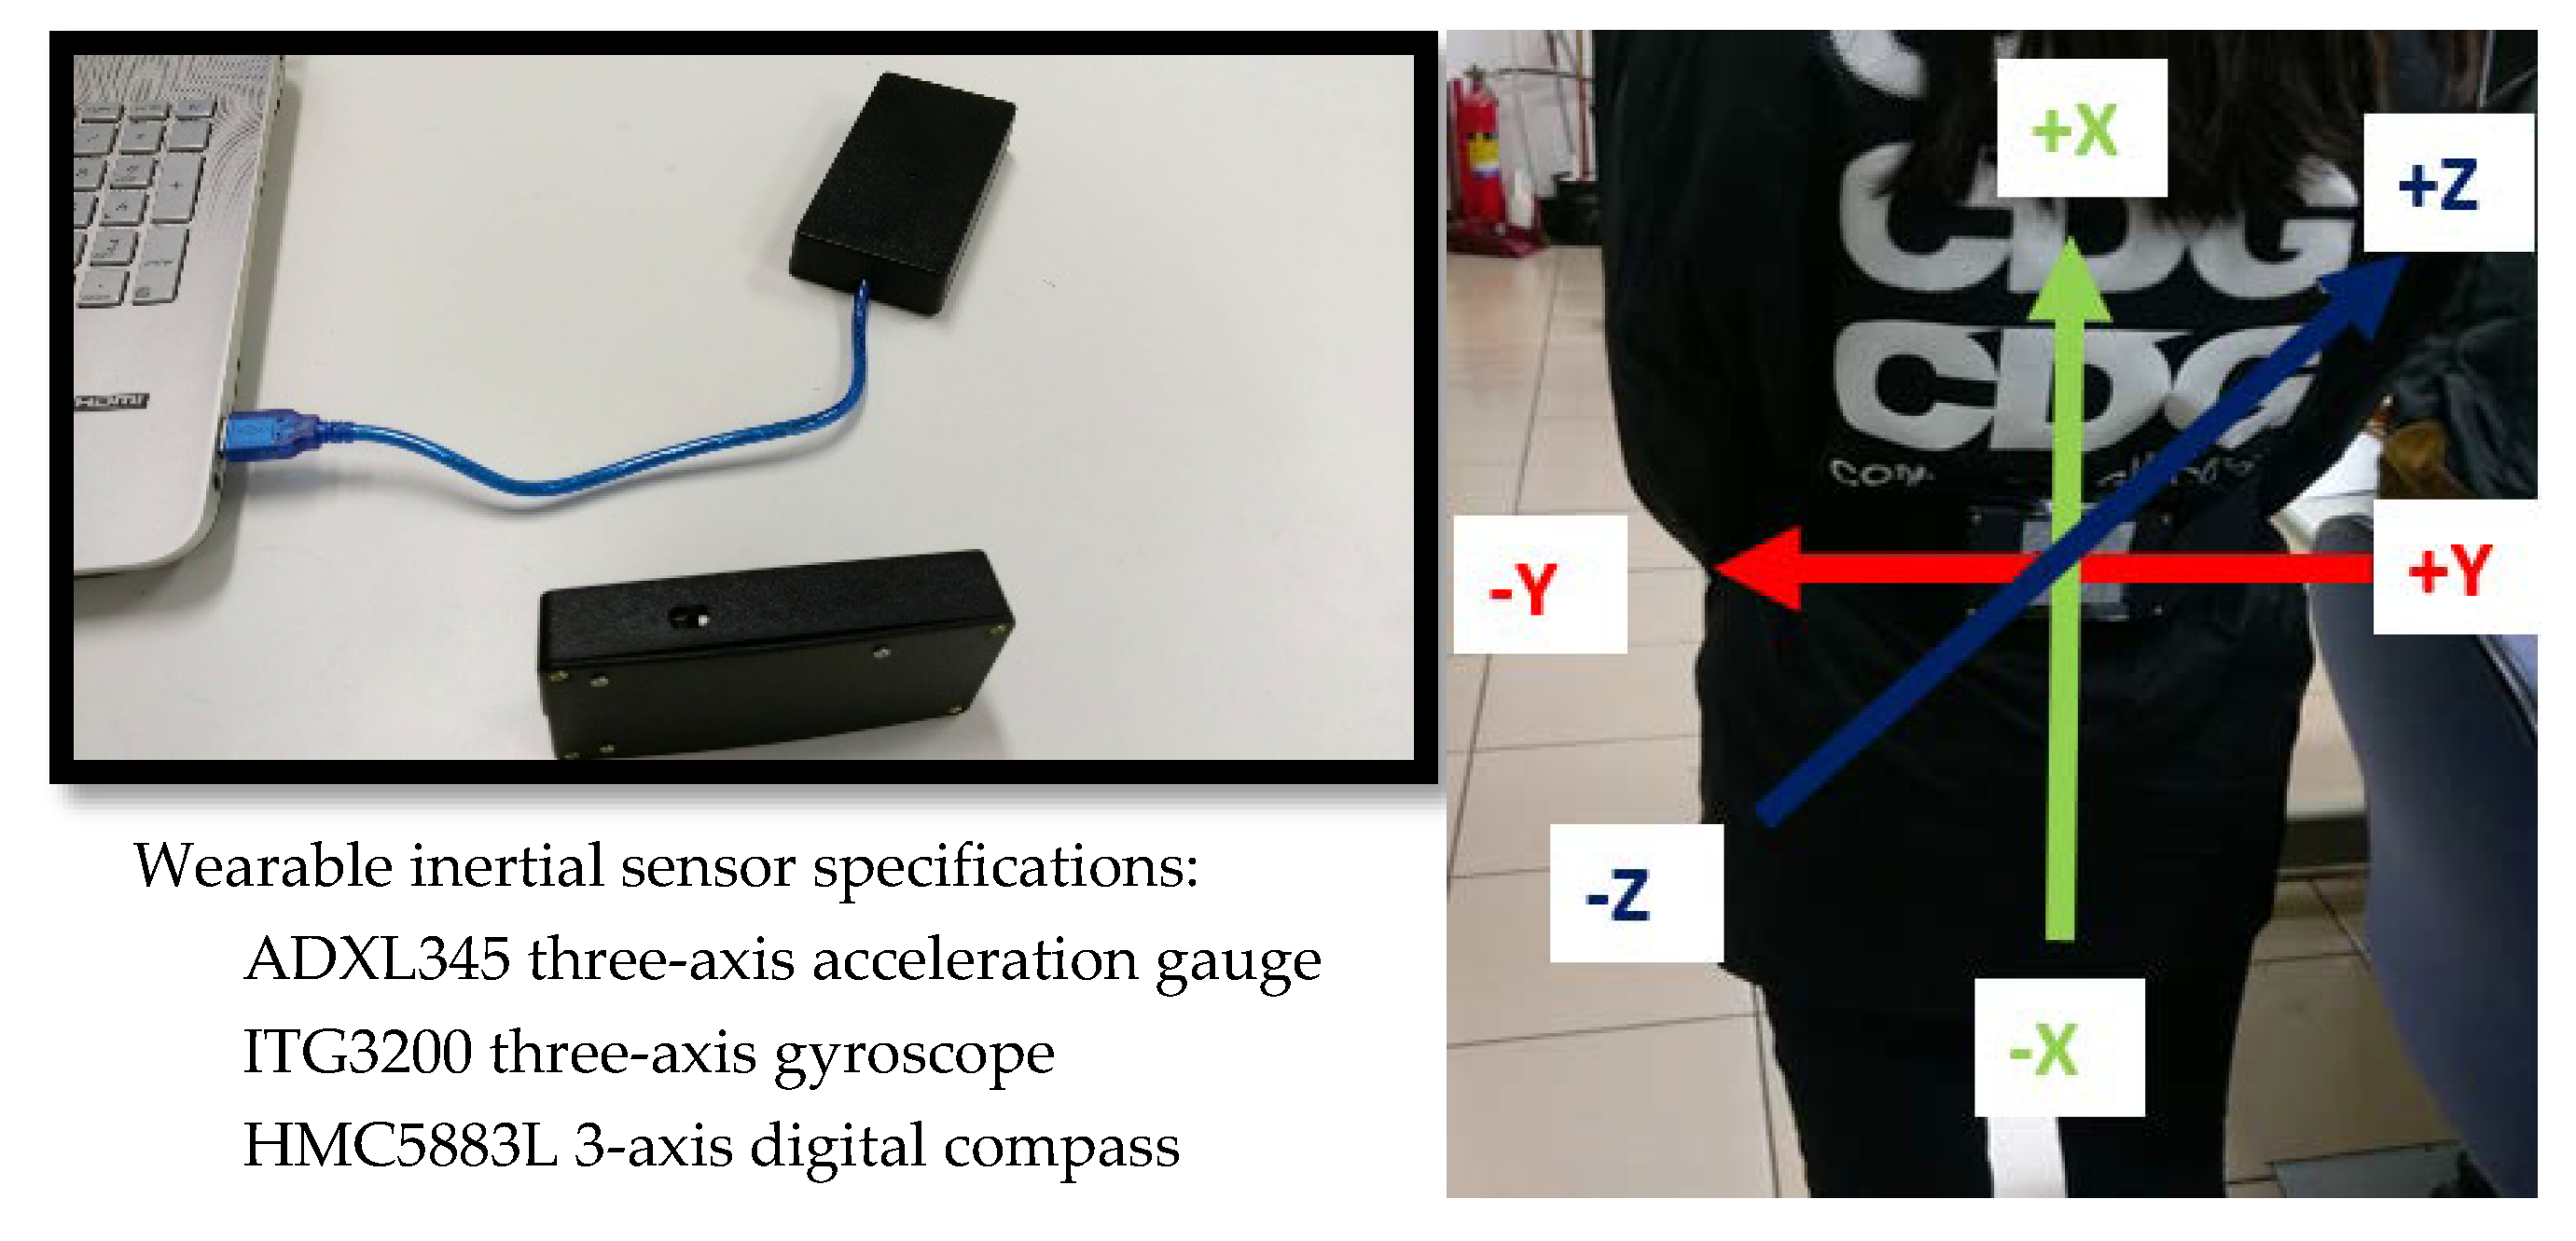
2.3. Inertial Sensor

The inertial sensor used to collect data during the TUG test included a triaxial accelerometer sensor board (Freescale RD3152MMA7260Q) with a sampling rate of 45 readings/s, an internal battery, and an SD storage card placed inside a plastic box. The sensor was small and lightweight and could be worn by the test subjects without causing any discomfort. The location of the strapped sensor approximated the center of mass location with respect to the belt; it was placed between the 3rd and 5th lumbar vertebrae (L3–L5) [22], as shown in Figure 1. The sensor weighed approximately 26.5 g, and the length, width, and height were 232, 7, and 21 mm, respectively, placing no substantial burden on the subject. The accelerometer collected data from the X (vertical, V; up: +, down: −), Y (mediolateral, ML; right: +, left: −), and Z (anterior-posterior, AP; forward: +, backward: −) axes. We used MSE to calculate the complexity of the three axes as features. While calculating the sample entropy for each coarse-grained series, the MSE calculation process involved the following sub-processes [27]: (1) coarse granulation, (2) sample entropy, and (3) the complexity index. The “coarse-graining” process is based on the scale factor of the segment windows, in which the average of the data values for each segment window is calculated, forming a new time series. Each element y j ( τ ) of the new coarse-grained time series is calculated according to
y i ( x ) = 1 τ i ( j 1 ) x + 1 j x f i ,   1 j N τ
where τ is the scale factor, N is the size of the original dataset, and xi is a data point in the original time series. For a scale factor of 1, the coarse-grained time series is simply the original time series; a scale factor of 2 involves the averaging of a pair of consecutive points from the original time series, which becomes the time series from which to create a scale factor of 3, and so on. When calculating the first and remaining time series, the duration between them is determined and the maximum value is taken, as shown in Figure 2.
The sample entropy (SampEn) was calculated for each coarse-grained time series in order to obtain entropy measurement values at each scale [42]. SampEn at each time scale τ was expressed as the negative of the natural logarithm of the conditional probability C m ( r ) , where the two sequences are compared within a similarity tolerance r for consecutive points m and m + 1. The formula for SampEn is
SampEn ( N , m , r ) = ln C m + 1   ( r ) C m ( r )
where N is the total number of data points, m is the number of consecutive data points, and r is the tolerance for accepting the match, which was chosen to be between 10% and 20% of the sample standard deviation σ of the time series. In this study, the parameters were set as follows: m = 2 and r = 0.15σ.
The complexity index is a function of sample entropy, which in turn is a function of the specification factor and is calculated using Equation (3). The sum of the sample entropy (SampEn) at each scale is the complexity index (CI), as shown in Figure 3.
Complexity   Index = i = 1 N S a m p l e   E n t r o p y ( i )

2.4. Clinical Tests

Many factors contribute to the falls of older people. To enhance the participation of the older people and understand the influencing factors from different perspectives, this study used the SFBBS and TUG assessment scales that compare the results of the sensor. The details of each clinical scale are provided below. SFBBS, used to assess balance, is a performance-based measure of balance during specific movement tasks. It assesses the static and dynamic balance and fall risks in adults and the geriatric population. Karthikeyan et al. [43] suggested that a community-dwelling elderly cutoff point score of 23 or less is a deficit in balance (out of 28 points) for a better predictive value. The TUG test, used to evaluate gait ability, is a well-known clinical test for mobility and fall risk [44]. It assesses mobility, balance, walking ability, and fall risk in older adults. Shumway-Cook [14] suggested a cutoff point of 13.5 s for community-dwelling elderly (over 65 years old), but Alexandre et al. [45] suggested a cutoff point of 12.47 s to achieve a better predictive value. In this study, we will discuss each cutoff point. In addition, we refer to the past literature [9,28] to segment the TUG test (sTUG), as shown in Figure 4, dividing it into sit-to-stand (STS), walk, turn, and stand-to-sit (STS2). We also used MSE to calculate the complexity of the sTUG for each axis as a feature. Herein, we attempt to ensure that the knowledge discovered from the cutoff point-determined compassion via sensors can be communicated to domain experts, the provision of an explanation when deploying, and using this knowledge with new technology to explore the manner in which the sensor measurements are meaningful.

2.5. Data Analysis

We use different entry points for optimized clinical-test classification and substituted the multiscale entropy (MSE) analysis results of the axes and segmentation. We also resampled the row data [46] because the data length had to be considered when performing an MSE analysis. Typically, the time series of the length used herein with 1800 data points could be coarse-grained up to Scale 6, in which case the shortest coarse-grained time series would contain 300 data points [47], providing up to 1800 data points for each segment-based TUG for MSE calculation. To compare the results of the expert returns, we used the fall-risk assessment, including the MSE analysis, logistic regression, receiver operating characteristic (ROC), area under the ROC curve (AUC), and clinical tests. The data analysis will be divided into two parts: the first part is based on the fall-risk judgment of experienced clinicians, including TUG = 13.5, TUG = 12.47, and SFBBS = 23, as the basis for the fall risk of the cut-point group; and a t-test to determine the significant differences between the features. The other part uses the logistic regression path to gradually find the eigenvalues. The data are divided into two groups: an 80% training set (training set) and 20% test set (testing set). The training set data are included in the estimated parameters, and the model establishing the test set data is used to test the model built on the training set. The results of the verification can be used as an indicator of the best model selection. By comparing these two types of data analysis results, we can better understand the similarities and differences between the feature values determined using the internal sensor and the medical experts. Table 1 shows the features of the inertial sensor and TUG for analyzing fall events in this study.

3. Results

Our discussion and analysis will use internal sensor axes and a segment TUG as the features of data analysis and can be divided into three main parts. We used a clinical test in all TUG and sTUG tests and considered various cutoff points. First, we used t-test analysis to verify the fall-risk categorization. We also used a logistic regression analysis stepwise 100 times to divide the features into two groups: an 80% training set (training set) and 20% test set (testing set). (c) We compared the features between (a) and (b) to understand whether the decisive features are actually similar to the results of the clinical tests.

3.1. Clinical Test of Cut Point Based on Experienced Clinician’s Fall-Risk Evaluation

We display multiple data to discuss the results of the inertial sensor because previous publications have performed discussion and verification on the clinical-test score (according to fallers and non-fallers). Karthikeyan et al. [43] suggested the occurrence of impaired balance when the BBS score is 23 or below; therefore, this value was considered to be our cutoff point. Shumway-Cook et al. [14] recommended that the community-dwelling older adults should be considered at high risk at TUG times of greater than 13.5 s. Alexandre et al. [45] suggested that a cutoff point of 12.47 s resulted in a good predictive value. Thus, we attempted to divide each clinical test into two groups by comparing the accelerometer features with a t-test. A p-value smaller than 0.05 implies a statistically significant difference, indicating fallers distinguished by features are quite similar to the clinical-test result. We use this as the opinion of expert judgment. Table 2 shows the results for the cutoff point of the TUG and SFBBS intersection or convergence. At first glance, with or without segmentation, the most significant features are the Y and Z axes.
Moreover, we created ROC to explore the ability of the clinical measures and CI values to predict a favorable fall-risk outcome. All the results shown in Figure 5 exhibit an AUC of between 0.7 and 0.9, indicating an acceptable or excellent discrimination. The results of the sTUG AUC are all greater than 0.85, but the TUG is just greater than 0.79. However, it can be seen from Table 2 that the features of the sTUG show at least six features at different cutoff points simultaneously, but the overall TUG is 2, which can be seen in addition to the subdivision to cut off the AUC area.

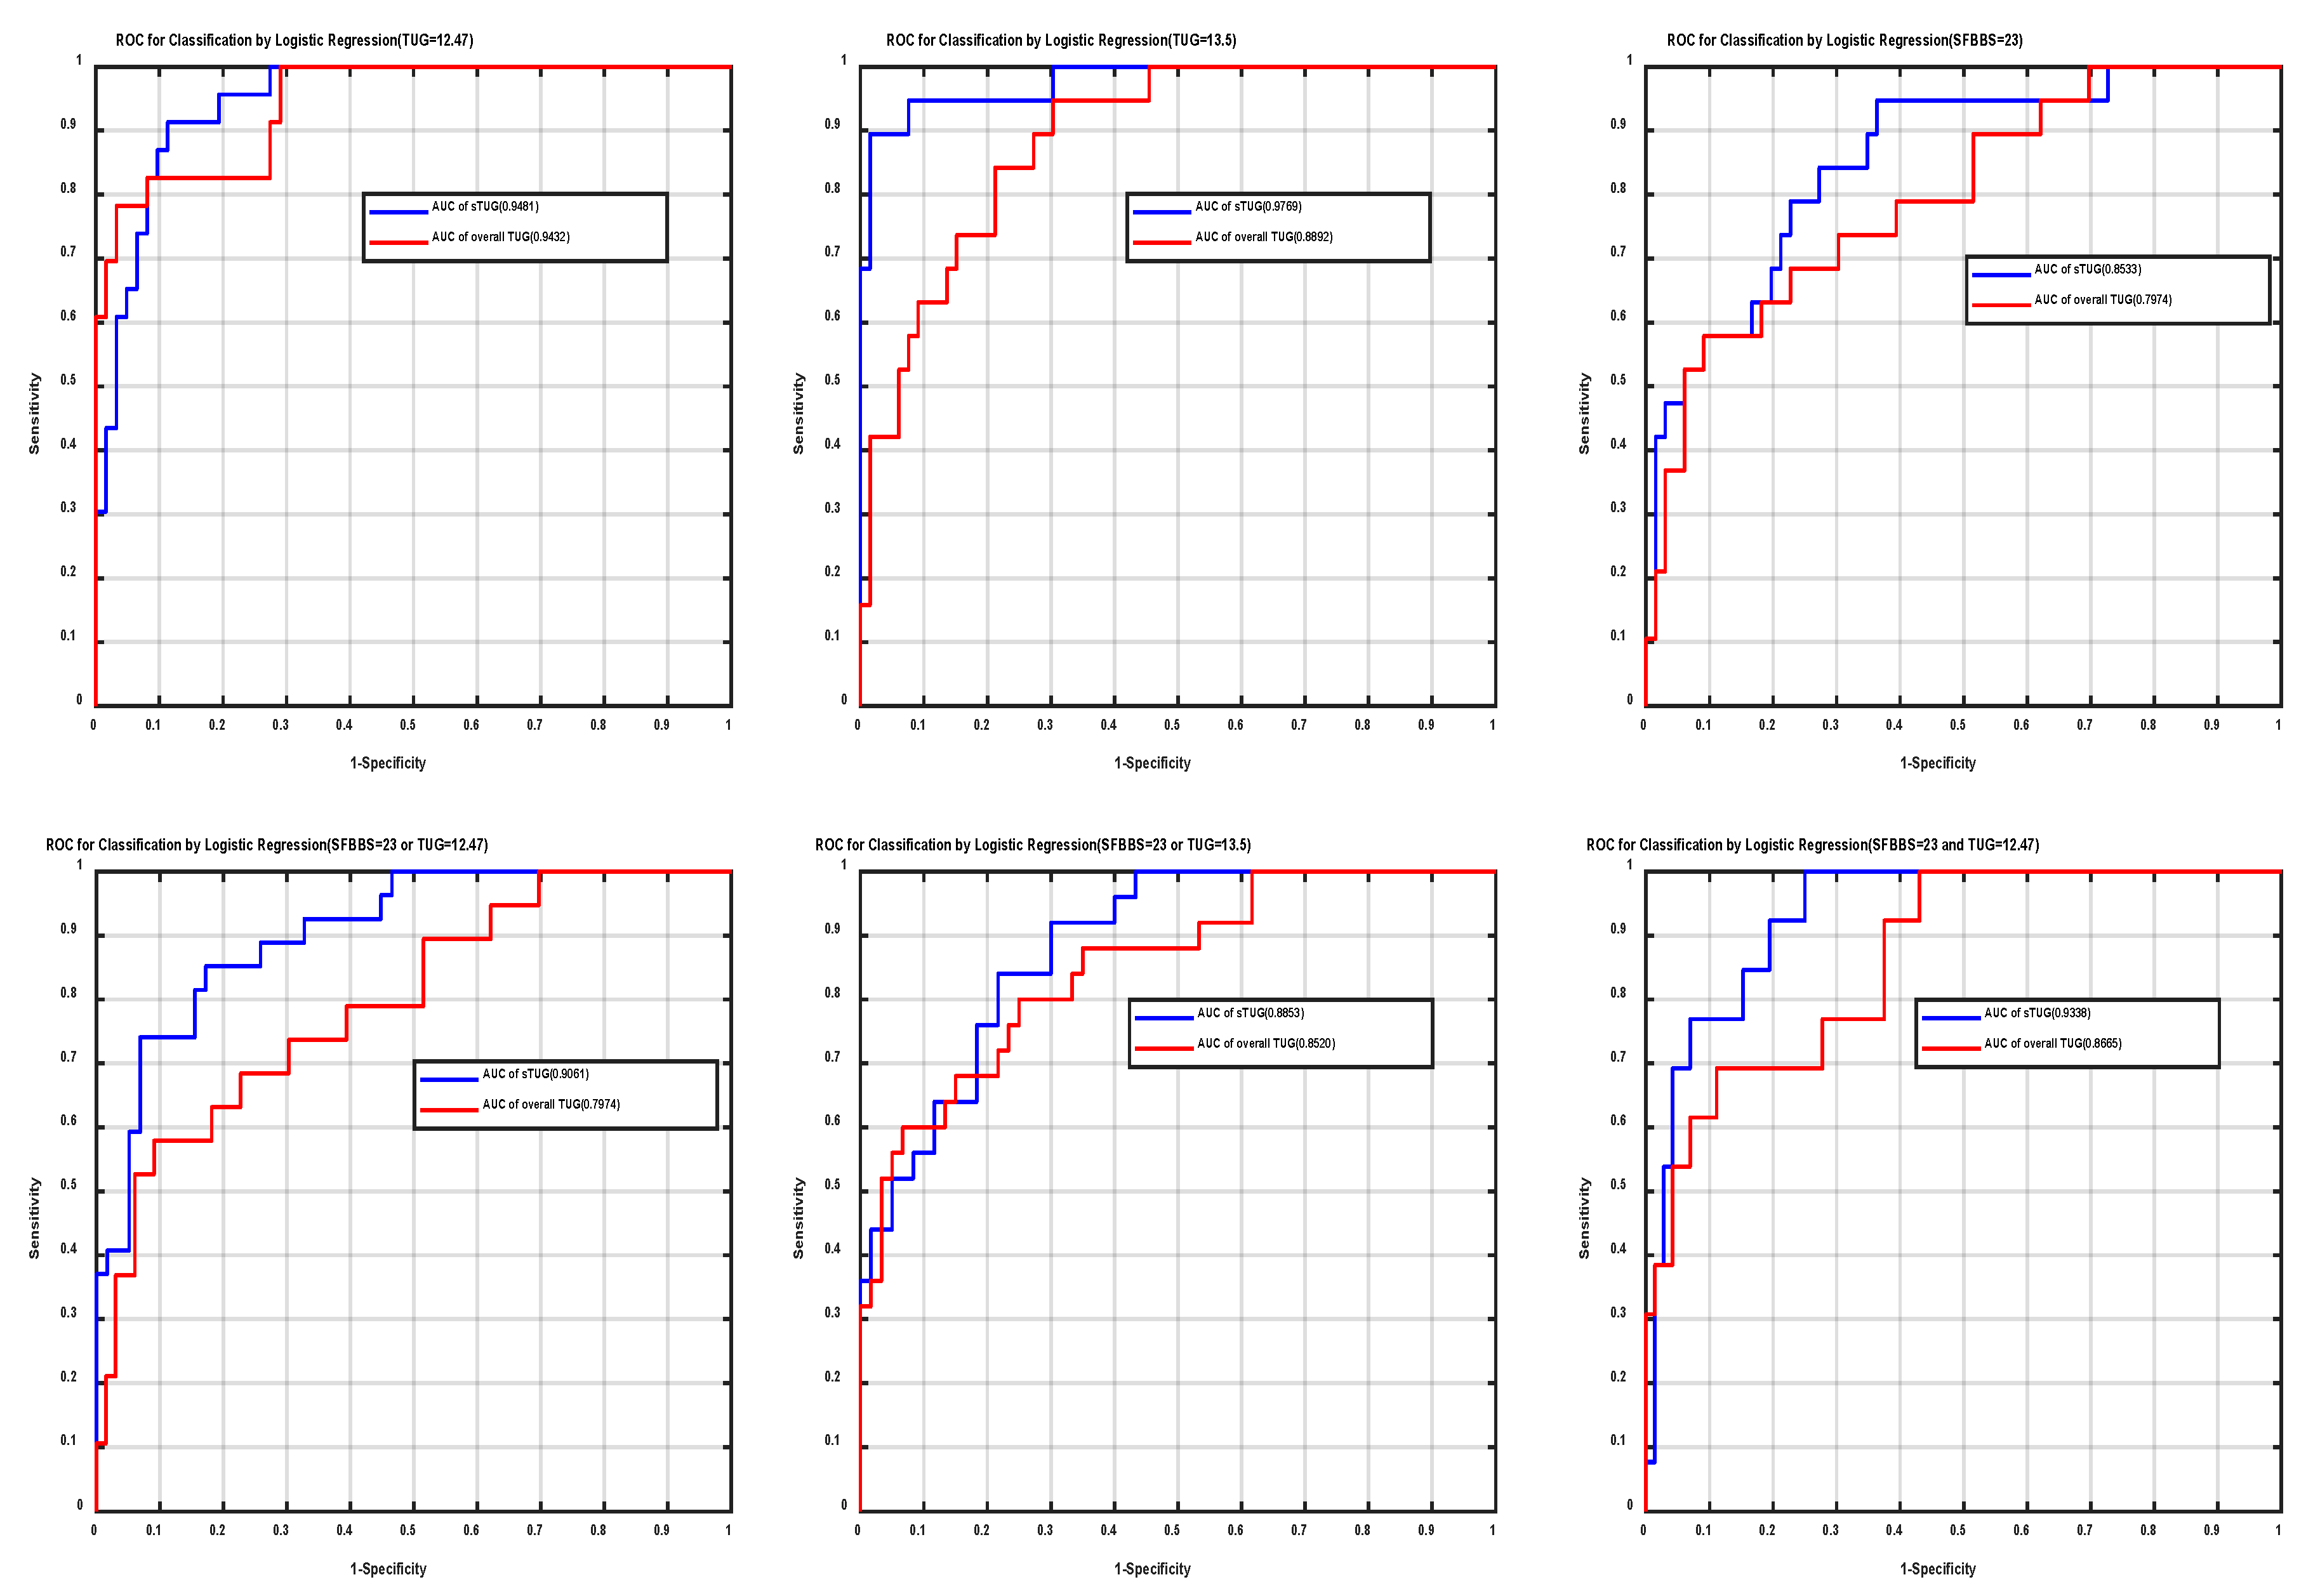
3.2. Clinical Test of Stepwise Logistic Regression as Fall-Risk Evaluation (Prediction Results)

Because the clinical test uses the cutoff point as a dichotomous categorical variable, as the expert opinion, we use the logistic-regression analysis of the machine learning scheme as the automatic selection method to explore the prediction results. Among them, we used the clinical test (including intersection or convergence of TUG = 12.47, TUG = 13.5, and SFBBS = 23) and inertial sensor axes, with or without a segmented TUG, as the features. Therefore, we used the stepwise regression method. To avoid overfitting problems and minimize the bias, we used a 100-iteration, random-shuffle-split cross-validation (100-RSSCV). To perform this, a single random-shuffle-split was configured to select a random subset of 80% of the data for training the model with the remaining 20% of the data being used as a random subset for model testing when the observing feature frequency and feature importance of fall risk. Hence, the number of times each feature was selected can be easily calculated. Table 3 shows the results. We first selected a feature with a frequency of more than 50 times as important features. The results show that in case of overall TUG, T2 and T3 are more than 50 times, even 100 times, and that in case of sTUG, F4 and F8 are the features with a frequency of more than 50 times. We also created ROC to explore the ability of the clinical measures and CI values to predict a favorable fall-risk outcome. All the results shown in Figure 6 exhibit an AUC of between 0.7 and 0.96, indicating acceptable or excellent discrimination. Thus, the results of the sTUG AUC are all greater than 0.85, whereas the results of the TUG are just greater than 0.78.

3.3. Comparing (a) and (b)

Comparing the results of (a) and (b), first, from the overall TUG of Table 2 and Table 3, T3 is a feature that has significant differences regardless of expert opinion or logistic prediction, but the differences between different clinical test combinations can still be seen. For example, the features of TUG = 12.47 are T1, T2, and T3, but the feature of TUG = 13.5 is only T3. The use of clinical test in the stepwise logistic regression for fall-risk evaluation (prediction results) under different clinical test combinations is noteworthy. T2 and T3 are significantly different. This indicates that the features selected for fall risk are all T2 and T3.
From the perspective of sTUG (Table 2 and Table 3), the expert use of the cutoff point to judge the risk of falling (clinical tests) is noted. Using different clinical test combinations, F7, F8, F9, F10, F11, and F12 exhibit significant differences. The clinical test’s stepwise logistic regression for fall-risk evaluation (prediction results) results in F4 and F8 under different clinical test combinations. The only duplicate between the two is F8. At first glance, expert opinion requires at least six features (F7, F8, F9, F10, F11, and F12) to be screened for falling risk. However, from the prediction results, a maximum of five can be screened, and most of the combinations only require four features. The results of the sTUG AUC are all more than 0.85.

4. Discussion

The current literature has identified a wide range of accelerometer-based features, but with no consensus regarding the optimal variables to be examined based on the obtained data. The chosen features or the extraction manner often differ among studies. In this study, we aimed to extract a comparison of features that had previously been associated with a fall-risk cutoff point, with an emphasis on the selection of clinically relevant features; the inertial sensor diagnosis can be considered equivalent to expert diagnosis. In our study, we attempted to refer to the fall risk judged by the cutoff point from the past literature as the result of expert opinion judgment (Table 2). In the overall TUG result, we found that, regardless of the cutoff point, T3 is important and has significant differences. T3 represents the Z (AP) axis of the inner sensor. O’Neill et al. (1994) [48] reported that most falls involve falling forward. Accordingly, the AP direction (Z axis) can classify clusters. As mentioned by Weiss et al. [37], compared with the traditional method of using a stopwatch to distinguish fallers from non-fallers, we obtained the same result, meaning to get the subject to go forward and do the task is the first inertial step. It is worth noting that T2 is also a very important feature, which is equivalent to an expert clinically observing the part where the subjects will naturally swing their hands when walking [49]. The T1 X axis (up: +, down: −) values are not easy to use as observation values because people will naturally maintain their own balance, which is the balance maintained by proprioception.
Moreover, the results of the clinical test of the cutoff point for fall-risk evaluation (expert opinion) in Table 2 show the features that are significant with each cutoff point as follows: F7, F8, F9, F10, F11, and F12. It is worth noting that compared with the overall TUG, there are significant differences in the axial view between the Y and Z axes. Nevertheless, adding segments will increase the AUC area as a whole; for example, considering the situation of SFBBS = 23 or TUG = 13.5, we can determine the AUC area from 0.7974 to 0.9061. F8 and F12 indicate the Y and Z axes for walking; we assume that this interpretation is similar to the above for both TUG and sTUG. The four segments, F9, F10, F11, and F12, also focus on the Z axis (anterior–posterior, AP; forward: +, backward: −). In our opinion, based on most of the AUC area results in Table 2, we can see that the cutoff AUC is between 0.7 and 0.9, indicating acceptable or excellent discrimination. The use of sensors as objective instruments to assist frontline personnel does not necessarily require professionals to make observations [50] or even segmentation plus axial exploration. The combined results of the clinical test can further increase the AUC area. In addition, multifactor fall prevention measures for the elderly have been recommended as one of the most effective methods [51], and multifactor analysis has been used to assess the fall risk among the elderly. In the past, scholars have successively developed and verified fall-risk assessment tools for the elderly in communities, but most of the assessment tools are designed for screening and cannot include the risk factors required for a complete fall-risk assessment [52,53]. We discussed the different clinical tests and cutoff points of the intersection and set points and found that the overall TUG was T3 (CI_Z) in each clinical test; that is, the Z-axis result can be directly used as the clinical-test classification using MSE, similar to the preliminary result of the use of SFBBS and TUG multifactors as the initial screening factors for fall-risk assessment [52,53]. We consider that in addition to more accurate results, multifactors (oriented) can also be considered. Moreover, from the perspective of action segmentation, STS and turning only have significant differences in the Z axis, and walk and STS2 have differences in the Y and Z axes, respectively. This result seems to be the axial direction. In particular, no matter which segmentation action, the Z axis shows a significant difference, but if the accuracy is improved, segmentation needs to be added. It is difficult to integrate multiple information sources to enhance clinical decision-making and provide complete patient records, which is a major finding in this study, particularly in the decision of segmentation action [9,28].
From the results of sTUG, we noted an interesting observation. The AUC results are not different. The results of the clinical test stepwise logistic regression for fall-risk evaluation (prediction results) features are F4, F8; these are the X and Y axes of walking. Compared with the clinical test’s cutoff point for fall-risk evaluation (expert opinion), the features are F7, F8, F9, F10, F11, and F12, focusing on the Y and Z axes. In addition to the observation method of the experts, the prediction results can assist to confirm the X-axis status and key actions. It is worth mentioning that the combination of prediction results and clinical test can reach the AUC level of expert opinion using only a maximum of five feature values. As auxiliary first-line medical staff, sensors can be used to replace manpower [54,55], even in the subsequent data analysis, and predicting the risk of falling can also be discussed using the multifactors of this study. It is difficult to integrate multiple information sources to enhance clinical decision-making and provide complete patient records. In our study, we compared the ways of making preliminary community screening recommendations to the hospital and constructing predictive regression models. The clustering results can reveal hidden information contained in personal health record systems to the experts and patients in a cluster. Such a sensor can effectively enable user matching, providing a new pipeline for users to collect information and allowing them to pay more attention to their own healthcare and medical plans.
Classification and regression are two of the most representative examples of problem description for both machine learning algorithms and statistical analysis. We used the same concept to analyze the classification. Note that the same idea can be expressed differently by statistical (clinical test) and machine learning (logistic regression) techniques. In addition, past studies have indicated that the cutoff points determined by different subjects are different [14,43]. Therefore, several studies [15,52,53] used multiple evaluations to resolve the conflict. Even in clinical settings, there is no shortage of fall assessment tools; however, because there are several causes for falls, multiple factors must be evaluated to improve the accuracy of fall-risk prediction [13,37]. In this study, we incorporated sensors while using logistic regression as an analytical method for prediction of multiple assessment tools, also simulating experts to verify the availability of sensors. Data collection among the elderly can be very difficult [5,56], so it is not easy to strike a balance with gender restrictions. Therefore, this study discussed the judgment of falls; any discussion of gender differences was necessarily rather limited.

5. Conclusions

This study used logistic-regression analysis to show the inertial data on a fall-risk scale with various perspectives to allow medical practitioners to screen for high-risk patients and to serve as a decision-making reference for predicting future falls, particularly during the early stages of a disease. Doctors with rigorous medical training can integrate clinical experience and scientific computing aids to make judgments and decisions. Comparing the results of the two (expert opinion vs. predication), it was found that the AUC results are not much different, but the features are not the same. In the overall TUG, by considering a higher AUC (prediction results), we found that the sensors of the Y and Z axes can classify fallers and non-fallers in each clinical-test combination. However, after the segmentation, a logistic regression was used to determine the AUC of the optimization result; the general combination only needs four features to achieve a considerable result. Therefore, this study proposes that machine learning should be based on expert domain knowledge in addition to preliminary analysis with objective screening. Hence, we used a clinical test to compare to the inertial sensor. Simultaneously, it proposes multi-oriented data analysis to objectively verify the results of the sensor.

Author Contributions

Conceptualization, C.-H.L., C.-H.W., B.C.J. and T.-L.S.; data curation, C.-H.L. and T.-L.S; formal analysis, C.-H.L. and C.-H.W.; investigation, C.-H.L., B.C.J. and T.-L.S; methodology, C.-H.L. and C.-H.W.; resources, B.C.J. and T.-L.S; software, C.-H.L. and C.-H.W.; validation, C.-H.L., C.-H.W., B.C.J. and T.-L.S; writing—original draft, C.-H.L. and C.-H.W.; writing—review and editing, B.C.J. and T.-L.S. All authors have read and agreed to the published version of the manuscript.

Funding

The author(s) disclosed receipt of the following financial support for the research, authorship, and/or publication of this article: This research was partly supported by the Ministry of Science and Technology (MOST), Taiwan, R.O.C.(contract no. MOST 103-2221-E-155 -044 -MY3, MOST 105-2218-E-011 -010 -MY3, and MOST 106-2221-E-155-023-MY3).

Acknowledgments

The researchers would like to thank the staff of the Feng-Yuan Hospital, Taiwan.

Conflicts of Interest

The funders had no role in the design of the study; in the collection, analyses or interpretation of data; in the writing of the manuscript or in the decision to publish the results.

References

  1. Lin, S. Risk of falls in community-dwelling older adults: A review of evidence and Taiwan experiences. Taiwan Geriatr. Gerontol. 2013, 8, 239–251. [Google Scholar]
  2. WHO. Number of People Over 60 Years Set to Double by 2050; Major Societal Changes Required. 2015. Available online: https://www.who.int/mediacentre/news/releases/2015/older-persons-day/en/ (accessed on 11 September 2020).
  3. Mion, L.C.; Chandler, A.M.; Waters, T.M.; Dietrich, M.S.; Kessler, L.A.; Miller, S.T.; Shorr, R.I. Is it possible to identify risks for injurious falls in hospitalized patients? Jt. Comm. J. Qual. Patient Saf. 2012, 38, 408–413. [Google Scholar] [CrossRef] [Green Version]
  4. Najafi, B.; Aminian, K.; Loew, F.; Blanc, Y.; Robert, P.A. Measurement of stand-sit and sit-stand transitions using a miniature gyroscope and its application in fall risk evaluation in the elderly. IEEE Trans. Biomed. Eng. 2002, 49, 843–851. [Google Scholar] [CrossRef] [PubMed]
  5. Montesinos, L.; Castaldo, R.; Pecchia, L. Wearable inertial sensors for fall risk assessment and prediction in older adults: A systematic review and meta-analysis. IEEE Transactions on Neural Systems and Rehabilitation Engineering,.. 2018, 26, 573–582. [Google Scholar] [CrossRef] [Green Version]
  6. Kear, B.M.; Guck, T.P.; McGaha, A.L. Timed up and go (TUG) test: Normative reference values for ages 20 to 59 years and relationships with physical and mental health risk factors. J. Prim. Care Commun. Health 2016, 8, 9–13. [Google Scholar] [CrossRef] [Green Version]
  7. Stienen, M.N.; Maldaner, N.; Joswig, H.; Corniola, M.V.; Bellut, D.; Prömmel, P.; Regli, L.; Weyerbrock, A.; Schaller, K.; Gautschi, O.P. Objective functional assessment using the “Timed Up and Go” test in patients with lumbar spinal stenosis. Neurosurg. Focus 2019, 46, E4. [Google Scholar] [CrossRef] [Green Version]
  8. Howcroft, J.; Kofman, J.; Lemaire, E. Prospective fall-risk prediction models for older adults based on wearable sensors. IEEE Trans. Neural Syst. Rehabil. Eng. 2017, 25, 1812–1820. [Google Scholar] [CrossRef]
  9. Lee, C.H.; Sun, T.L.; Jiang, B.C.; Choi, V.H. Using wearable accelerometers in a community service context to categorize falling behavior. Entropy 2016, 18, 257. [Google Scholar] [CrossRef]
  10. Cesari, M.; Penninx, B.W.; Pahor, M.; Lauretani, F.; Corsi, A.M.; Williams, G.R.; Guralnik, J.M.; Ferrucci, L. Inflammatory markers and physical performance in older persons: The InCHIANTI study. J. Gerontol. Biol. Sci. Med. Sci. 2004, 59, 242–248. [Google Scholar] [CrossRef] [Green Version]
  11. Bourke, A.K.; Van de Ven, P.; Gamble, M.; O’Connor, R.; Murphy, K.; Bogan, E.; Mcquade, E.; Finucane, P.; Olaighin, G.; Nelson, J. Evaluation of waist-mounted tri-axial accelerometer-based fall-detection algorithms during scripted and continuous unscripted activities. J. Biomech. 2010, 43, 3051–3057. [Google Scholar] [CrossRef]
  12. Bian, Z.P.; Hou, J.; Chau, L.P.; Magnenat-Thalmann, N. Fall detection based on body part tracking using a depth camera. IEEE J. Biomed. Health Inf. 2015, 19, 430–439. [Google Scholar] [CrossRef] [PubMed]
  13. Bianchi, F.; Redmond, S.J.; Narayanan, M.R.; Cerutti, S.; Lovell, N.H. Barometric pressure and triaxial accelerometry-based falls event detection. IEEE Trans. Neural Syst. Rehabil. Eng. 2010, 18, 619–627. [Google Scholar] [CrossRef] [PubMed]
  14. Shumway-Cook, A.; Brauer, S.; Woollacott, M. Predicting the probability for falls in community-dwelling older adults using the Timed Up & Go Test. Phys. Ther. 2000, 80, 896–903. [Google Scholar] [PubMed] [Green Version]
  15. Steffen, T.M.; Hacker, T.A.; Mollinger, L. Age and gender-related test performance in community-dwelling elderly people: Six-Minute Walk test, Berg Balance Scale, timed Up & Go Test, and gait speeds. Phys. Ther. 2002, 82, 128–137. [Google Scholar]
  16. Phelan, E.A.; Mahoney, J.E.; Voit, J.C.; Stevens, J.A. Assessment and management of fall risk in primary care settings. Med. Clin. North. Am. 2015, 99, 281–293. [Google Scholar] [CrossRef] [Green Version]
  17. Caulfield, B.M.; Donnelly, S.C. What is connected health and why will it change your practice? QJM Int. J. Med. 2013, 106, 703–707. [Google Scholar] [CrossRef] [Green Version]
  18. Rajagopalan, R.; Litvan, I.; Jung, T.P. Fall prediction and prevention systems: Recent trends, challenges, and future research directions. Sensors 2017, 17, 2509. [Google Scholar] [CrossRef] [Green Version]
  19. Kim, E.A.; Mordiffi, S.Z.; Bee, W.H.; Devi, K.; Evans, D. Evaluation of three fall-risk assessment tools in an acute care setting. J. Adv. Nurs. 2007, 60, 427–435. [Google Scholar] [CrossRef]
  20. Data Visualization and Infographics Graphics. Available online: https://www.smashingmagazine.com/2008/01/monday-inspiration-data-visualization-and-infographics/ (accessed on 11 September 2020).
  21. Bellazzi, R.; Zupan, B. Predictive data mining in clinical medicine: Current issues and guidelines. Int. J. Med. Inf. 2008, 77, 81–97. [Google Scholar] [CrossRef] [Green Version]
  22. Migut, M.; Worring, M. Visual exploration of classification models for various data types in risk assessment. Inf. Vis. 2012, 11, 237–251. [Google Scholar] [CrossRef] [Green Version]
  23. Hurd, W.J.; Morrow, M.M.; Kaufman, K.R. Tri-axial accelerometer analysis techniques for evaluating functional use of the extremities. J. Electromyogr. Kinesiol. 2013, 23, 924–929. [Google Scholar] [CrossRef] [PubMed] [Green Version]
  24. Tochigi, Y.; Segal, N.A.; Vaseenon, T.; Brown, T.D. Entropy analysis of tri-axial leg acceleration signal waveforms for measurement of decrease of physiological variability in human gait. J. Orthop. Res. 2012, 30, 897–904. [Google Scholar] [CrossRef] [PubMed] [Green Version]
  25. Pincus, S.M.; Goldberger, A.L. Physiological time-series analysis: What does regularity quantify? Am. J. Physiol. Heart Circ. Physiol. 1994, 266, H1643–H1656. [Google Scholar] [CrossRef] [PubMed]
  26. Costa, M.; Goldberger, A.L.; Peng, C.K. Multiscale entropy analysis of complex physiologic time series. Phys. Rev. Lett. 2002, 89, 068102. [Google Scholar] [CrossRef] [PubMed] [Green Version]
  27. Costa, M.; Goldberger, A.L.; Peng, C.K. Multiscale entropy analysis of biological signals. Phys. Rev. E 2005, 71, 021906. [Google Scholar] [CrossRef] [Green Version]
  28. Wu, C.H.; Lee, C.H.; Jiang, B.C.; Sun, T.L. Multiscale entropy analysis of postural stability for estimating fall risk via domain knowledge of timed-up-and-go accelerometer data for elderly people living in a community. Entropy 2019, 21, 1076. [Google Scholar] [CrossRef] [Green Version]
  29. Hamm, J.; Money, A.; Atwal, A. Fall prevention self-assessments via mobile 3D visualization technologies: Community dwelling older adults’ perceptions of opportunities and challenges. JMIR Hum. Factors 2017, 4, e15. [Google Scholar] [CrossRef]
  30. Chau, P.Y.; Hu, P.J. Examining a model of information technology acceptance by individual professionals: An exploratory study. J. Manag. Inf. Syst. 2014, 18, 191–229. [Google Scholar] [CrossRef]
  31. Perell, K.L.; Nelson, A.; Goldman, R.L.; Luther, S.L.; Prieto-Lewis, N.; Rubenstein, L.Z. Fall risk assessment measures: An analytic review. J. Gerontol. Biol. Sci. Med. Sci. 2001, 56, M761–M766. [Google Scholar] [CrossRef] [Green Version]
  32. Lin, M.R.; Tsai, S.L.; Chen, S.Y.; Tzeng, S.J. Risk factors for elderly falls in a rural community of central Taiwan. Taiwan J. Public Health 2002, 21, 73–82. [Google Scholar]
  33. Okumiya, K.; Matsubayash, K.; Nakamura, T.; Fujisawa, M.; Osaki, Y.; Doi, Y.; Ozawa, T. The timed “up and go” test is a useful predictor of falls in community-dwelling older people. J. Am. Geriatr. Soc. 1998, 46, 928–930. [Google Scholar] [CrossRef] [PubMed]
  34. Issacs, B. Clinical and laboratory studies of falls in old people: Prospects on prevention. Clin. Geriatr. Med. 1985, 1, 513–520. [Google Scholar] [CrossRef]
  35. Gates, S.; Smith, L.A.; Fisher, J.D.; Lamb, S.E. Systematic review of accuracy of screening instruments for predicting fall risk among independently living older adults. J. Rehabil. Res. Dev. 2008, 45, 1105–1116. [Google Scholar] [CrossRef] [PubMed]
  36. Vassallo, M.; Poynter, L.; Sharma, J.C.; Kwan, J.; Allen, S. Fall risk-assessment tools compared with clinical judgment: An evaluation in a rehabilitation ward. Age Ageing 2008, 37, 277–281. [Google Scholar] [CrossRef] [Green Version]
  37. Weiss, A.; Herman, T.; Plotnik, M.; Brozgol, M.; Maidan, I.; Giladi, N.; Gurevich, T.; Yamada, M.; Arai, H.; Nagai, K.; et al. Development of a new fall risk assessment index for older adults. Int. J. Gerontol. 2012, 6, 160–162. [Google Scholar]
  38. Pohl, P.; Nordin, E.; Lundquist, A.; Bergstrom, U.; Lundin-Olsson, L. Community-dwelling older people with an injurious fall are likely to sustain new injurious falls within 5 years-a prospective long-term follow-up study. BMC Geriatr. 2014, 14, 120. [Google Scholar] [CrossRef] [Green Version]
  39. Huang, C.H.; Sun, T.L. Interactive visualization to support fall risk assessment for community-dwelling elderly. Inf. Vis. 2017, 18, 33–44. [Google Scholar]
  40. Mischel, P.S.; Cloughesy, T. Using molecular information to guide brain tumor therapy. Nat. Clin. Pract. Neurol. 2006, 2, 232–233. [Google Scholar] [CrossRef]
  41. Azzam, T.; Evergreen, S.; Germuth, A.A.; Kistler, S.J. Data visualization and evaluation. New Directions Eval. 2013, 2013, 7–32. [Google Scholar] [CrossRef]
  42. Riva, F.; Toebes, M.J.P.; Pijnappels, M.A.G.M.; Stagni, R.; Van Dieën, J.H. Estimating fall risk with inertial sensors using gait stability measures that do not require step detection. Gait Posture 2013, 38, 170–174. [Google Scholar] [CrossRef] [Green Version]
  43. Karthikeyan, G.; Sheikh, S.G.; Chippala, P. Test-retest reliability of short form of berg balance scale in elderly people. Glob. Adv. Res. J. Med. Med. Sci. 2012, 1, 139–144. [Google Scholar]
  44. Chien, W.L. Prediction of Falling Risk of the Elderly by Data Mining Techniques. Master’s Thesis, Tatung University, Taipei City, Taiwan, February 2012. [Google Scholar]
  45. Alexandre, T.S.; Meira, D.M.; Rico, N.C.; Mizuta, S.K. Accuracy of timed up and go test for screening risk of falls among community-dwelling elderly. Rev. Bras. Fisioter. 2012, 16, 381–388. [Google Scholar] [CrossRef] [PubMed] [Green Version]
  46. Liu, Q.; Wei, Q.; Fan, S.; Lu, C.; Lin, T.; Abbod, M.F.; Shieh, J. Adaptive computation of multiscale entropy and its application in EEG signals for monitoring depth of anesthesia during surgery. Entropy 2012, 14, 978–992. [Google Scholar] [CrossRef] [Green Version]
  47. Costa, M.; Priplata, A.A.; Lipsitz, L.A.; Wu, Z.; Huang, N.E.; Goldberger, A.L.; Peng, C.K. Noise and poise: Enhancement of postural complexity in the elderly with a stochastic-resonance–based therapy. Europhys. Lett. 2007, 77, 68008. [Google Scholar] [CrossRef] [PubMed] [Green Version]
  48. O’Neill, T.W.; Varlow, J.; Silman, A.J.; Reeve, J.; Reid, D.M.; Todd, C.; Woolf, A.D. Age and sex influences on fall characteristics. Ann. Rheum. Dis. 1994, 53, 773–775. [Google Scholar]
  49. Meyns, P.; Bruijn, S.M.; Duysens, J. The how and why of arm swing during human walking. Gait Posture 2013, 38, 555–562. [Google Scholar] [CrossRef]
  50. Podsiadlo, D.; Richardson, S. The timed “Up & Go”: A test of basic functional mobility for frail elderly persons. J. Am. Geriatr. Soc. 1991, 39, 142–148. [Google Scholar]
  51. Freeland, K.N.; Thompson, A.N.; Zhao, Y.; Leal, J.E.; Mauldin, P.D.; Moran, W.P. Medication use and associated risk of falling in a geriatric outpatient population. Ann. Pharmacother. 2012, 46, 1188–1192. [Google Scholar] [CrossRef]
  52. Russell, M.A.; Hill, K.D.; Day, L.M.; Blackberry, I.; Gurrin, L.C.; Dharmage, S.C. Development of the falls risk for older people in the community (FROP-Com) screening tool. Age Ageing 2009, 38, 40–46. [Google Scholar] [CrossRef] [Green Version]
  53. Russell, M.A.; Hill, K.D.; Blackberry, I.; Day, L.M.; Dharmage, S.C. The reliability and predictive accuracy of the falls risk for older people in the community assessment (FROP-Com) tool. Age Ageing 2008, 37, 634–639. [Google Scholar] [CrossRef] [Green Version]
  54. Sun, R.; Sosnoff, J.J. Novel sensing technology in fall risk assessment in older adults: A systematic review. BMC Geriatr. 2018, 18, 14. [Google Scholar] [CrossRef] [PubMed] [Green Version]
  55. Howcroft, J.; Kofman, J.; Lemaire, E.D. Review of fall risk assessment in geriatric populations using inertial sensors. J. Neuroeng. Rehabil. 2013, 10, 91. [Google Scholar] [CrossRef] [PubMed] [Green Version]
  56. Shi, G.; Zhang, J.; Dong, C.; Han, P.; Jin, Y.; Wang, J. Fall detection system based on inertial mems sensors: Analysis design and realization. In Proceedings of the IEEE International Conference on Cyber Technology in Automation, Control, and Intelligent Systems, Shenyang, China, 8–12 June 2015; pp. 1834–1839. [Google Scholar]
Figure 1. Schematic of the wearable sensor and triaxial.
Applsci 10 06931 g001
Figure 2. Schematic of Phase 2 (sample entropy) of the multiscale entropy (MSE) analysis.
Applsci 10 06931 g002
Figure 3. Complexity index (CI).
Applsci 10 06931 g003
Figure 4. Timed up and go (TUG) test segment diagram.
Applsci 10 06931 g004
Figure 5. ROC for classification by logistic regression with clinical test and TUG segmentation.
Applsci 10 06931 g005
Figure 6. ROC for classification by logistic regression for the clinical test and TUG segmentation.
Applsci 10 06931 g006
Table 1. Features used by the TUG segmentation and sub-axis with the sensors, whose descriptions are abbreviated.
TUG
CodeT1T2T3
NameCI_XCI_YCI_Z
Segment-based TUG (sTUG)
CodeF1F2F3F4F5F6
NameCI_X_STSCI_X_TurnCI_X_STS2CI_X_walkCI_Y_STSCI_Y_Turn
CodeF7F8F9F10F11F12
NameCI_Y_STS2CI_Y_walkCI_Z_STSCI_Z_TurnCI_Z_STS2CI_Z_walk
Table 2. The results for the cutoff point of the TUG and SFBBS intersection or convergence.
Cutoff PointTUG = 12.47TUG = 13.5SFBBS = 23SFBBS = 23 or
TUG = 12.47
SFBBS = 23 or
TUG = 13.5
SFBBS = 23 and
TUG = 13.5/12.47
TUGcodep-valuecodep-valuecodep-valuecodep-valuecodep-valuecodep-value
T10.015T10.130T10.027T10.015T10.045T10.085
T20.000T20.191T20.000T20.000T20.000T20.000
T30.000T30.023T30.000T30.000T30.000T30.000
sTUGF10.233F10.513F10.213F10.252F10.305F10.390
F20.292F20.038F20.022F20.268F20.039F20.020
F30.08F30.203F30.059F30.026F30.044F30.283
F40.489F40.000F40.192F40.316F40.199F40.182
F50.078F50.018F50.007F50.039F50.016F50.002
F60.009F60.066F60.639F60.146F60.309F60.204
F70.003F70.000F70.001F70.002F70.006F70.001
F80.000F80.000F80.000F80.000F80.000F80.000
F90.000F90.000F90.001F90.000F90.000F90.000
F100.007F100.025F100.025F100.017F100.035F100.007
F110.000F110.000F110.001F110.000F110.000F110.000
F120.000F120.000F120.018F120.000F120.001F120.016
| Bold-face values: p-value < 0.05.
Table 3. The results for the stepwise regression of the 100-iteration, random-shuffle-split cross-validation frequency.
Cutoff PointTUG = 12.47TUG = 13.5SFBBS = 23SFBBS = 23 or
TUG = 12.47
SFBBS = 23 or
TUG = 13.5
SFBBS = 23 and
TUG = 13.5/12.47
TUGcodeFrequentcodeFrequentcodeFrequentcodeFrequentcodeFrequentcodeFrequent
T114T135T110T11T14T17
T2100T2100T268T2100T297T262
T3100T3100T391T3100T3100T3100
sTUGF19F119F17F12F16F110
F25F219F279F21F248F288
F35F37F326F36F315F39
F476F486F493F484F493F495
F54F511F519F58F517F59
F646F630F61F62F63F621
F74F79F766F712F73F738
F8100F899F874F8100F8100F861
F931F996F945F955F974F973
F1010F109F1015F1018F107F1020
F1152F1197F118F1160F1155F1160
F1275F120F1223F1246F1226F1224
Bold-face values: We used a 100-iteration, random-shuffle-split cross-validation (100-RSSCV). The feature is selected with a frequency of more than 50 times.

