Imaging of Cell Structures Using Optimized Soft X-ray Contact Microscopy


 ,
,  , and
, and 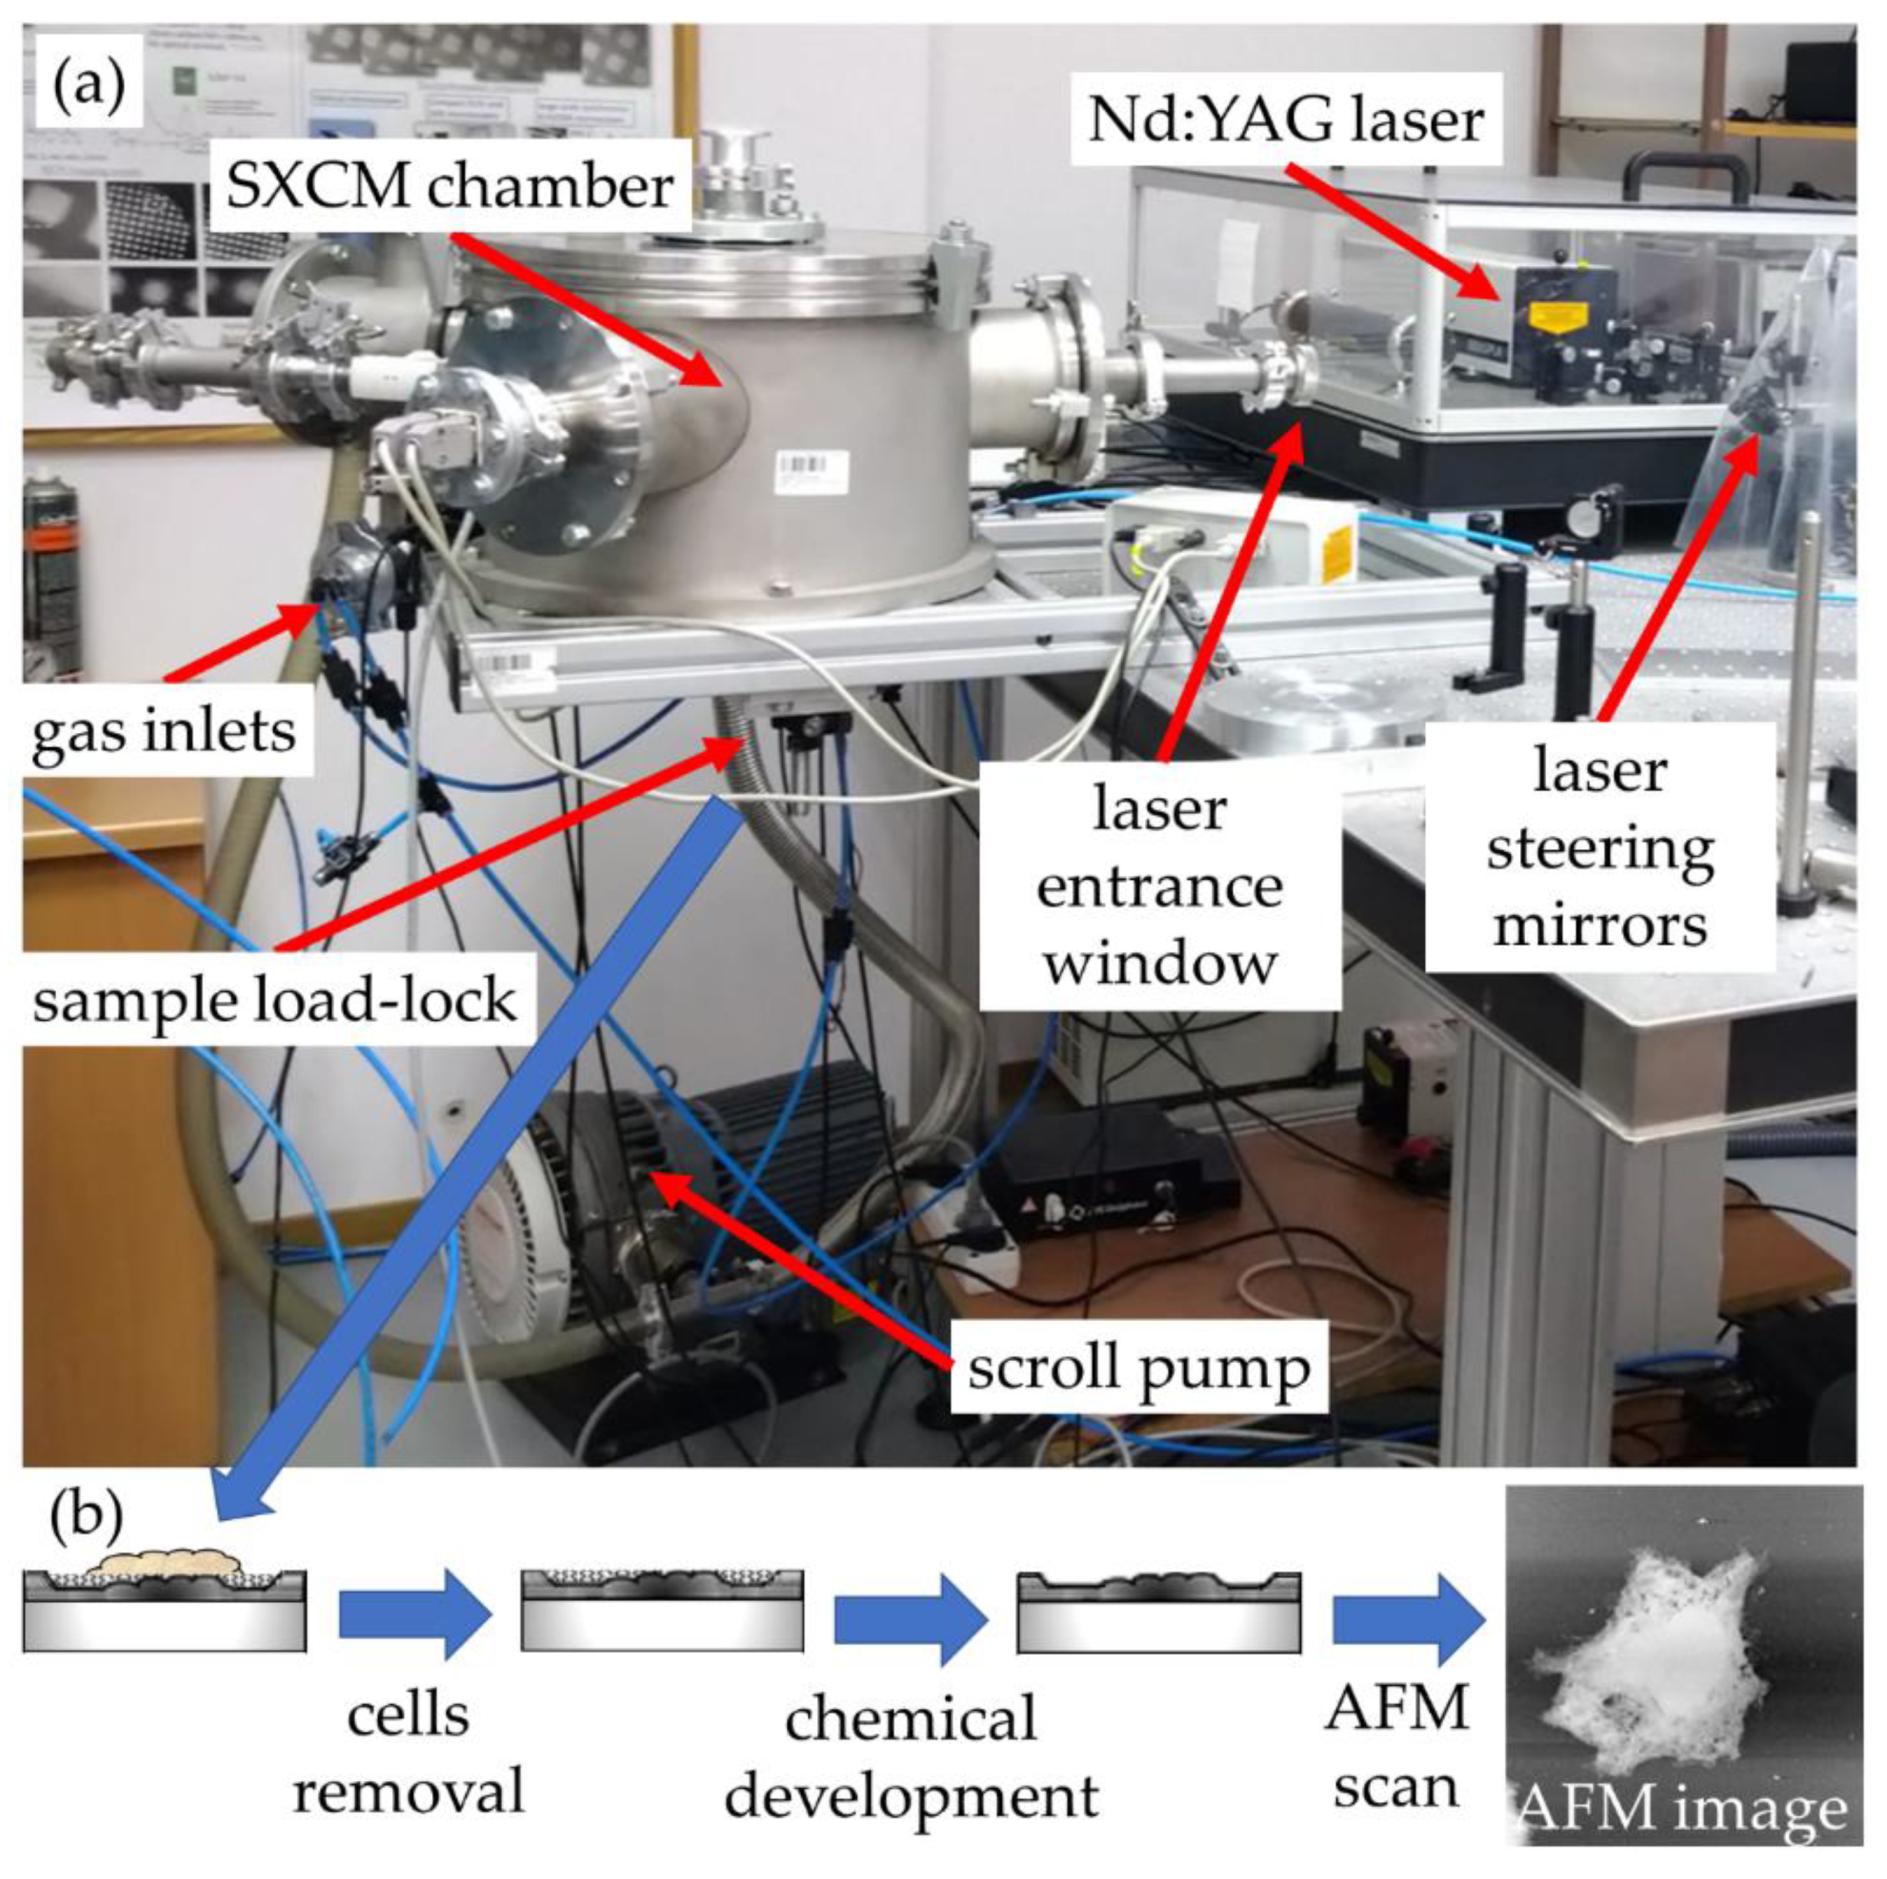
Abstract
1. Introduction
2. Materials and Methods
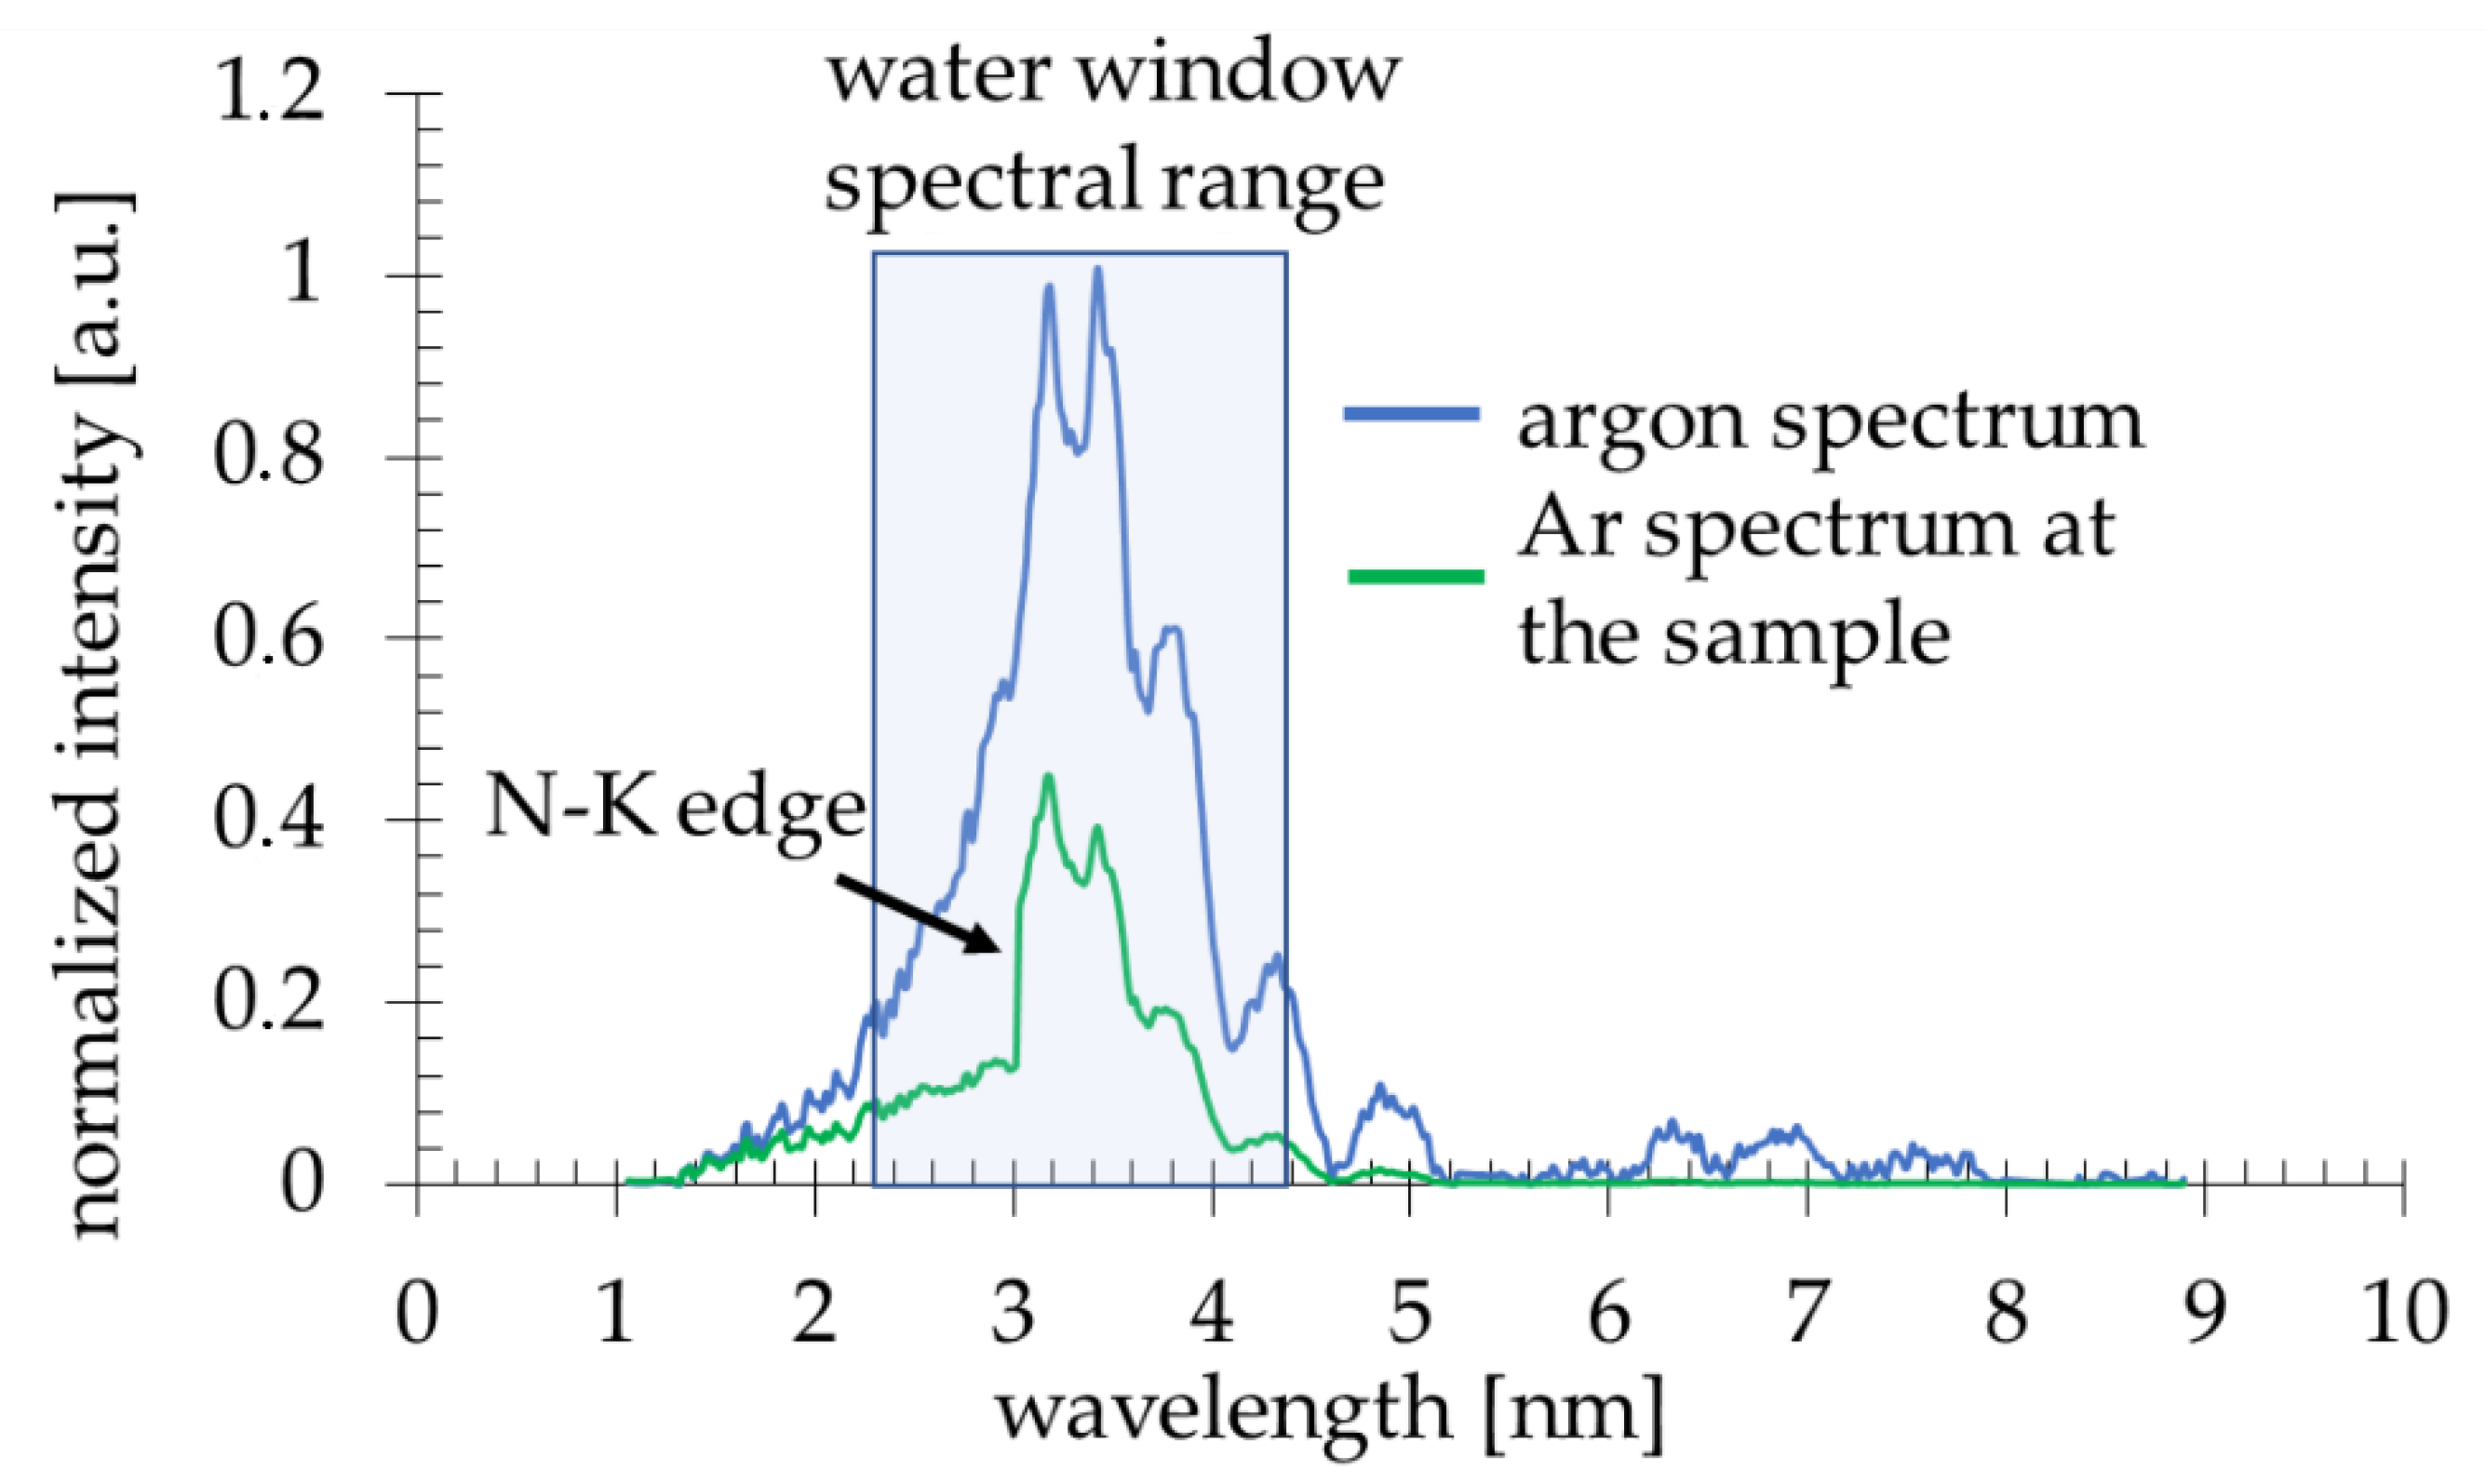
2.1. Characterization of Soft X-ray Contact Microscope (SXCM) System
2.2. Cell Culture
2.3. Optimization of the Polymethyl Methacrylate (PMMA) Exposure to Soft X-ray Radiation
2.4. Cell Imaging
3. Results and Discussion
3.1. Optimization of SXCM Technique for Cell Imaging
3.1.1. Optimization of the PMMA Development
3.1.2. Soft X-ray (SXR) Pulses Number Optimization
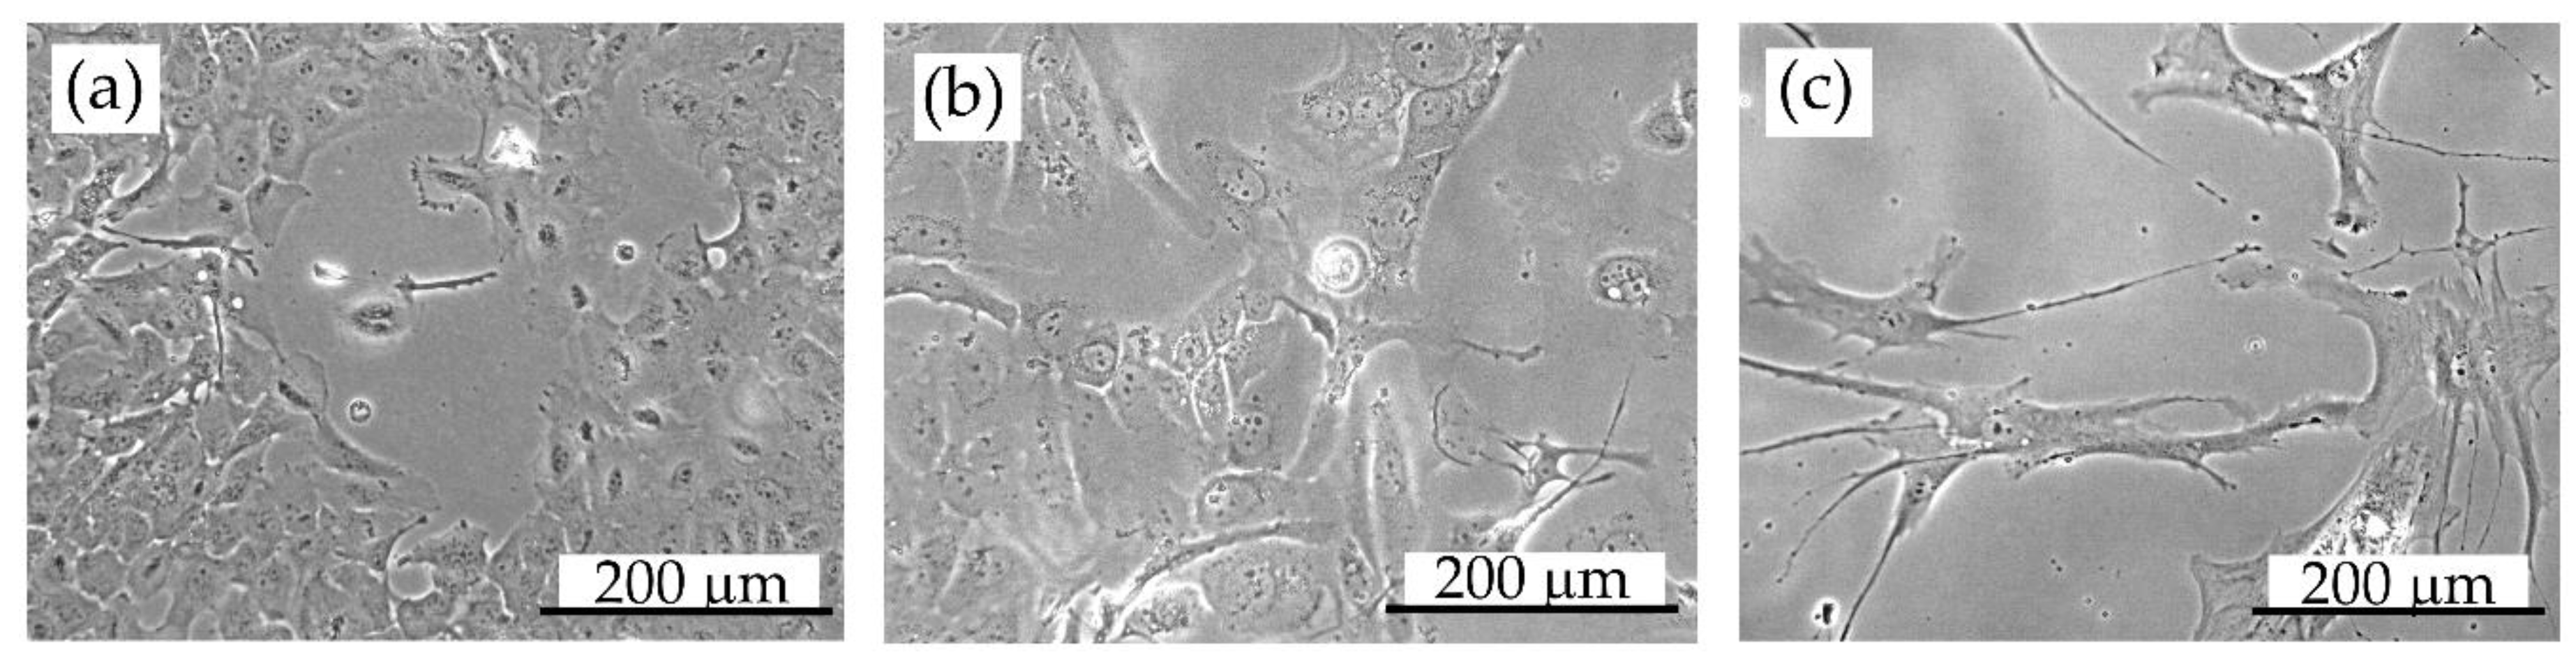
3.2. SXCM Imaging of Various Cell Lines
4. Conclusions
Supplementary Materials
Author Contributions
Funding
Conflicts of Interest
References
- Kado, M.; Kishimoto, M.; Tamotsu, S.; Yasuda, K.; Aoyama, M.; Tone, S.; Shinohara, K. Correlative imaging of live biological cells with a soft x-ray microscope and a fluorescence microscope. Aip Conf. Proc. 2016, 1696, 020019. [Google Scholar]
- Reale, L.; Bonfigli, F.; Lai, A.; Flora, F.; Albertano, P.; ML, D.I.G.; Mezi, L.; Montereali, R.M.; Faenov, A.; Pikuz, T.; et al. Contact X-ray microscopy of living cells by using LiF crystal as imaging detector. J. Microsc. 2015, 258, 127–139. [Google Scholar] [CrossRef]
- Cohen Hyams, T.; Mam, K.; Killingsworth, M.C. Scanning electron microscopy as a new tool for diagnostic pathology and cell biology. Micron 2020, 130, 102797. [Google Scholar] [CrossRef]
- Thorn, K. A quick guide to light microscopy in cell biology. Mol. Biol. Cell 2016, 27, 219–222. [Google Scholar] [CrossRef] [PubMed]
- Yamamoto, Y.; Shinohara, K. Application of X-ray microscopy in analysis of living hydrated cells. Anat. Rec. 2002, 269, 217–223. [Google Scholar] [CrossRef] [PubMed]
- Poletti, G.; Orsini, F.; Batani, D. Study of Multicellular Living Organisms by SXCM (Soft X-Ray Contact Microscopy). Solid State Phenom. 2005, 107, 7–10. [Google Scholar] [CrossRef]
- Kado, M.; Kishimoto, M.; Tamotsu, S.; Yasuda, K.; Shinohara, K. In situ observation of cellular organelles with a contact x-ray microscope. J. Phys. Conf. Ser. 2013, 463, 012056. [Google Scholar] [CrossRef]
- Sakdinawat, A.; Attwood, D. Nanoscale X-ray imaging. Nat. Photonics 2010, 4, 840–848. [Google Scholar] [CrossRef]
- Kirz, J.; Sayre, D. Soft X-Ray Microscopy of Biological Specimens. In Synchrotron Radiation Research; Winick, H., Doniach, S., Eds.; Springer: Boston, MA, USA, 1980; pp. 277–322. [Google Scholar]
- Gowa, T.; Takahashi, T.; Oshima, A.; Tagawa, S.; Washio, M. Study on resist sensitivities for nano-scale imaging using water window X-ray microscopy. Radiat. Phys. Chem. 2011, 80, 248–252. [Google Scholar] [CrossRef]
- Kirz, J.; Jacobsen, C.; Howells, M. Soft X-ray microscopes and their biological applications. Q. Rev. Biophys. 1995, 28, 33–130. [Google Scholar] [CrossRef]
- Ayele, M.G.; Wachulak, P.W.; Czwartos, J.; Adjei, D.; Bartnik, A.; Wegrzynski, Ł.; Szczurek, M.; Pina, L.; Fiedorowicz, H. Development and characterization of a laser-plasma soft X-ray source for contact microscopy. Nucl. Instrum. Methods Phys. Res. Sect. B Beam Interact. Mater. At. 2017, 411, 35–43. [Google Scholar] [CrossRef]
- Wachulak, P.; Torrisi, A.; Ayele, M.; Czwartos, J.; Bartnik, A.; Wegrzynski, L.; Fok, T.; Parkman, T.; Salacova, S.; Turňová, J.; et al. Bioimaging Using Full Field and Contact EUV and SXR Microscopes with Nanometer Spatial Resolution. Appl. Sci. 2017, 7, 548. [Google Scholar] [CrossRef]
- Pu, S.; Gong, C.; Robertson, A. Liquid cell transmission electron microscopy and its applications. R. Soc. Open Sci. 2020, 7, 191204. [Google Scholar] [CrossRef] [PubMed]
- Sayre, D.; Kirz, J.; Feder, R.; Kim, D.; Spiller, E. Transmission microscopy of unmodified biological materials. Comparative radiation dosages with electrons and ultrasoft X-ray photons. Ultramicroscopy 1977, 2, 337–349. [Google Scholar] [CrossRef]
- Sousa, A.A.; Leapman, R.D. Development and application of STEM for the biological sciences. Ultramicroscopy 2012, 123, 38–49. [Google Scholar] [CrossRef]
- Jacobsen, C.; Kirz, J. X-ray microscopy with synchrotron radiation. Nat. Struct. Biol. 1998, 5, 650–653. [Google Scholar] [CrossRef]
- Takman, P.A.C.; Stollberg, H.; Johansson, G.A.; Holmberg, A.; Lindblom, M.; Hertz, H.M. High-resolution compact X-ray microscopy. J. Microsc. 2007, 226, 175–181. [Google Scholar] [CrossRef] [PubMed]
- Kondo, H.; Tomie, T. Optimization of a laser-plasma x-ray source for contact x-ray microscopy. J. Appl. Phys. 1994, 75, 3798–3805. [Google Scholar] [CrossRef]
- Dhareshwar, L.; Chaurasia, S. Laser plasma interaction in solid metal, mixed metal alloy and metal nano-particle coated targets. J. Phys. Conf. Ser. 2008, 112, 032050. [Google Scholar] [CrossRef]
- Park, J.J.; Kim, D.S.; Jeon, S.C.; Park, J.; Lee, K.H.; Lee, J.-H.; Kim, K.N.; Yoo, J.J.; Nam, C.H. Soft x-ray microscope constructed with a PMMA phase-reversal zone plate. Opt. Lett. 2009, 34, 235–237. [Google Scholar] [CrossRef]
- Poletti, G.; Orsini, F.; Batani, D.; Bernardinello, A.; Desai, T.; Ullschmied, J.; Skala, J.; Kralikova, B.; Krousky, E.; Juha, L.; et al. Soft X-ray contact microscopy of nematode Caenorhabditis elegans. Eur. Phys. J. D At. Mol. Opt. Plasma Phys. 2004, 30, 235–241. [Google Scholar] [CrossRef]
- Shinozaki, D.M. High Resolution Image Storage in Polymers, X-Ray Microscopy II; Sayre, D., Kirz, J., Howells, M., Rarback, H., Eds.; Springer: Berlin/Heidelberg, Germany, 1988; pp. 118–123. [Google Scholar]
- Jacobsen, C. Future challenges for x-ray microscopy. Aip Conf. Proc. 2016, 1696, 020035. [Google Scholar]
- Weinhardt, V.; Chen, J.; Ekman, A.A.; McDermott, G.; Gros, M.A.L.; Larabell, C.A. Imaging cell morphology and physiology using X-rays. Biochem. Soc. Trans. 2019, 472, 489–508. [Google Scholar] [CrossRef] [PubMed]
- Broers, A.N. Resolution limits for electron-beam lithography. IBM J. Res. Dev. 1988, 32, 502–513. [Google Scholar] [CrossRef]
- Patel, S.; Thakar, R.G.; Wong, J.; McLeod, S.D.; Li, S. Control of cell adhesion on poly(methyl methacrylate). Biomaterials 2006, 27, 2890–2897. [Google Scholar] [CrossRef]
- Yaghmaie, F.; Fleck, J.; Gusman, A.; Prohaska, R. Improvement of PMMA electron-beam lithography performance in metal liftoff through a poly-imide bi-layer system. Microelectron. Eng. 2010, 87, 2629–2632. [Google Scholar] [CrossRef]
- Rooks, M.J.; Kratschmer, E.; Viswanathan, R.; Katine, J.R.E.F., Jr.; MacDonald, S.A. Low stress development of poly(methylmethacrylate) for high aspect ratio structures. J. Vac. Sci. Technol. B Microelectron. Nanometer Struct. Process. Meas. Phenom. 2002, 20, 2937–2941. [Google Scholar] [CrossRef]
- Schleunitz, A.; Schift, H. Fabrication of 3D nanoimprint stamps with continuous reliefs using dose-modulated electron beam lithography and thermal reflow. J. Micromech. Microeng. 2010, 20, 095002. [Google Scholar] [CrossRef]
- Yasin, S.; Hasko, D.; Ahmed, H. Comparison of MIBK/IPA and water/IPA as PMMA developers for electron beam nanolithography. Microelectron. Eng. 2002, 61, 745–753. [Google Scholar] [CrossRef]
- Mohammad, M.A.; Dew, S.K.; Westra, K.; Li, P.; Aktary, M.; Lauw, Y.; Kovalenko, A.; Stepanova, M. Nanoscale resist morphologies of dense gratings using electron-beam lithography. J. Vac. Sci. Technol. B Microelectron. Nanometer Struct. Process. Meas. Phenom. 2007, 25, 745–753. [Google Scholar] [CrossRef]
- Yan, M.; Choi, S.; Subramanian, K.R.V.; Adesida, I. The effects of molecular weight on the exposure characteristics of poly(methylmethacrylate) developed at low temperatures. J. Vac. Sci. Technol. B Microelectron. Nanometer Struct. Process. Meas. Phenom. 2008, 26, 2306–2310. [Google Scholar] [CrossRef]
- Gilloteaux, J.; Jamison, J.M.; Neal, D.; Arnold, D.; Taper, H.S.; Summers, J.L. Human prostate DU145 carcinoma cells implanted in nude mice remove the peritoneal mesothelium to invade and grow as carcinomas. Anat. Rec. 2013, 296, 40–55. [Google Scholar] [CrossRef] [PubMed]
- Katsube, Y.; Hirose, M.; Nakamura, C.; Ohgushi, H. Correlation between proliferative activity and cellular thickness of human mesenchymal stem cells. Biochem. Biophys. Res. Commun. 2008, 368, 256–260. [Google Scholar] [CrossRef] [PubMed]

 ) and at the sample plane (
 ).
) and at the sample plane ().
).
) and at the sample plane ().


© 2020 by the authors. Licensee MDPI, Basel, Switzerland. This article is an open access article distributed under the terms and conditions of the Creative Commons Attribution (CC BY) license (http://creativecommons.org/licenses/by/4.0/).
Share and Cite
Osuchowska, P.N.; Wachulak, P.; Nowak-Stępniowska, A.; Bartnik, A.; Gnanachandran, K.; Lekka, M.; Czwartos, J.; Fiedorowicz, H.; Trafny, E.A. Imaging of Cell Structures Using Optimized Soft X-ray Contact Microscopy. Appl. Sci. 2020, 10, 6895. https://doi.org/10.3390/app10196895
Osuchowska PN, Wachulak P, Nowak-Stępniowska A, Bartnik A, Gnanachandran K, Lekka M, Czwartos J, Fiedorowicz H, Trafny EA. Imaging of Cell Structures Using Optimized Soft X-ray Contact Microscopy. Applied Sciences. 2020; 10(19):6895. https://doi.org/10.3390/app10196895
Chicago/Turabian StyleOsuchowska, Paulina Natalia, Przemysław Wachulak, Agata Nowak-Stępniowska, Andrzej Bartnik, Kajangi Gnanachandran, Małgorzata Lekka, Joanna Czwartos, Henryk Fiedorowicz, and Elżbieta Anna Trafny. 2020. "Imaging of Cell Structures Using Optimized Soft X-ray Contact Microscopy" Applied Sciences 10, no. 19: 6895. https://doi.org/10.3390/app10196895
APA StyleOsuchowska, P. N., Wachulak, P., Nowak-Stępniowska, A., Bartnik, A., Gnanachandran, K., Lekka, M., Czwartos, J., Fiedorowicz, H., & Trafny, E. A. (2020). Imaging of Cell Structures Using Optimized Soft X-ray Contact Microscopy. Applied Sciences, 10(19), 6895. https://doi.org/10.3390/app10196895