Article

Building Energy an Simulation Model for Analyzing Energy Saving Options of Multi-Span Greenhouses

1
Department of Agricultural Engineering, Kyungpook National University, Daegu 41566, Korea
2
Smart Farm System Department, Culti Labs CO. LTD, Gangneung 25440, Korea
3
Department of Bio-Industrial Machinery Engineering, Institute of Agricultural and Life Sciences, Gyeongsang National University, Jinju 52828, Korea
4
Institute of Agricultural Science & Technology, Kyungpook National University, Daegu 41566, Korea
5
Smart Agriculture Innovation Center, Kyungpook National University, Daegu 41566, Korea
*
Author to whom correspondence should be addressed.
These authors contributed equally to this work.
Appl. Sci. 2020, 10(19), 6884; https://doi.org/10.3390/app10196884
Submission received: 16 September 2020 / Revised: 28 September 2020 / Accepted: 29 September 2020 / Published: 1 October 2020
(This article belongs to the Special Issue Building Physics and Building Energy Systems)

Abstract

:
This study proposes a multi-span greenhouse Building Energy Simulation (BES) model using a Transient System Simulation (TRNSYS)-18 program. A detailed BES model was developed and validated to simulate the thermal environment in the greenhouse under different design parameters for the multi-span greenhouse. Validation of the model was carried out by comparing the results from computed and experimental greenhouse internal temperatures. The statistical analyses produced an R2 value of 0.84, a root mean square error (RMSE) value of 1.8 °C, and a relative (r)RMSE value of 6.7%, showing good agreement between computed and experimental results. The validated proposed BES model was used to evaluate the effect of multi-span greenhouse design parameters including thermal screens, number of screens, orientation, covering materials, double glazing, north-wall insulation, roof geometry, and natural ventilation, on the annual energy demand of the greenhouse, subjected to Taean Gun (latitude 36.88° N, longitude 126.24° E), Chungcheongnam-do, South Korea winter and summer season weather conditions. Additionally, the proposed BES model is capable of evaluating multi-span greenhouse design parameters with daily and seasonal dynamic control of thermal and shading screens, natural ventilation, as well as heating and cooling set-points. The TRNSYS 18 program proved to be highly flexible for carrying out simulations under local weather conditions and user-defined design and control of the greenhouse. The statistical analysis of validated results should encourage the adoption of the proposed model when the underlying aim is to evaluate the design parameters of multi-span greenhouses considering local weather conditions and specific needs.

1. Introduction

Worldwide, greenhouses are used to provide favorable climate conditions to crops, where outdoor weather conditions are not suitable for crop production [1]. In severe climatic conditions, to achieve the desired temperature condition inside the greenhouse for optimal crop growth, different heating and cooling systems are used. Although good crop yields can be obtained in well-controlled micro-environments within the greenhouse, such systems tend to increase operational costs [2]. The heating cost in South Korean greenhouses is 30–40% of total production costs, which makes the greenhouse sector one of the most energy-intensive [3]. Ahmed et al. [4] reported that the heating costs in Canadian greenhouses are 15–20% of total production costs [1]. Globally, various technologies, especially renewable energy technologies, have been utilized to fulfill the energy demands of buildings, including those in the agricultural sector [5]. In addition to using different energy sources, energy saving techniques can be helpful in reducing energy costs [6]. Hence, the reduction in the energy demand of greenhouses is very important. Having an energy-efficient greenhouse can contribute to reducing its energy demand. Therefore, the design parameters of the greenhouse significantly affect its the energy consumption [4].
Several studies [7,8,9,10,11,12,13,14] performed by different researchers considered single-span greenhouse design analyses, including varying the greenhouse’s shape and orientation and evaluating the saving potentials of each. In our previous studies, Rasheed et al. [15] and Ahmed et al. [1] evaluated the design parameters of a single-span greenhouse with fully closed conditions including the shape, orientation, span, and width of the single-span greenhouse. The studies found that the single-span gothic shaped, east–west orientated greenhouse covered with double glazing of Polymethylmethacrylate (PMMA) is the most energy efficient greenhouse design parameter. Two studies conducted by Lee at al., [16] and Ha et al. [17] analyzed the heating and cooling loads of the Venlo type and wide-span greenhouse roof geometry under different weather conditions in different parts of South Korea. The outcomes of the studies show that the wide-span greenhouse required less energy when compared with the venlo type multi-span greenhouse. Lee et al. [18] designed a Building Energy Simulation (BES) model of the multi-span greenhouse to predict the annual and maximum heating load at six different locations of the greenhouse in South Korea and evaluated the performance of the heating system. On behave of the maximum heating load at each location feasibility of the heating system was evaluated.
The most feasible and practical approach to selecting energy-efficient greenhouses according to local weather conditions is through simulations. There are many types of Building Energy Simulation (BES) software such as Energy Plus, RETScreen, and the Transient System Simulation Program (TRNSYS)-18. Baglivo et al. [19] suggested that the TRNSYS program is more convenient and easier to use for this kind of simulation including energy modeling of greenhouse control strategies. For this specific study, TRNSYS-18 software, which is widely used for the estimation of building energy load and energy system performance, was selected. Moreover, in agricultural greenhouses, the software demonstrates a very high level of flexibility in terms of improving the structure of varying case studies as well as carrying out their energy analysis [20].
The specific objectives of this study are as follows:
  • To provide the necessary input data (Pre-processing) to carry out multi-span greenhouse simulation using the TRNSYS 18 program.
  • To propose a Building Energy Simulation (BES) model using the TRNSYS-18 program to evaluate the multi-span greenhouse design parameters under dynamic weather conditions while considering the dynamic daily and seasonal control of screen and natural ventilation, heating and cooling set points.
  • To study the effects of different design parameters on the performance of the multi-span greenhouse. These parameters are different angular orientations namely, 0°, 30°, 45°, 60°, 75°, 90°; covering material type namely, Polyethylene (PE), Polyvinylchloride (PVC), Horticulture glass (HG), Polymethylmethacrylate (PMMA), and Polycarbonate (PC); and double-glazing type (and thickness) namely, PC (4, 6, 8, 10, 16 mm) and PMMA (8, 16 mm). In addition, the effect of screen types (Ph-77, Ph-super, Luxous, Tempa, Polyester); natural ventilation, north-wall insulation, different roof geometries and wide-span greenhouses are considered.
The proposed BES model provides a tool for efficiently analyzing multi-span greenhouse design parameters while taking into account local weather conditions and crop needs. The proposed model allows the dynamic simulation of greenhouse systems and also enables the application of different control strategies.

2. Materials and Methods

2.1. Experimental Greenhouse for Validation

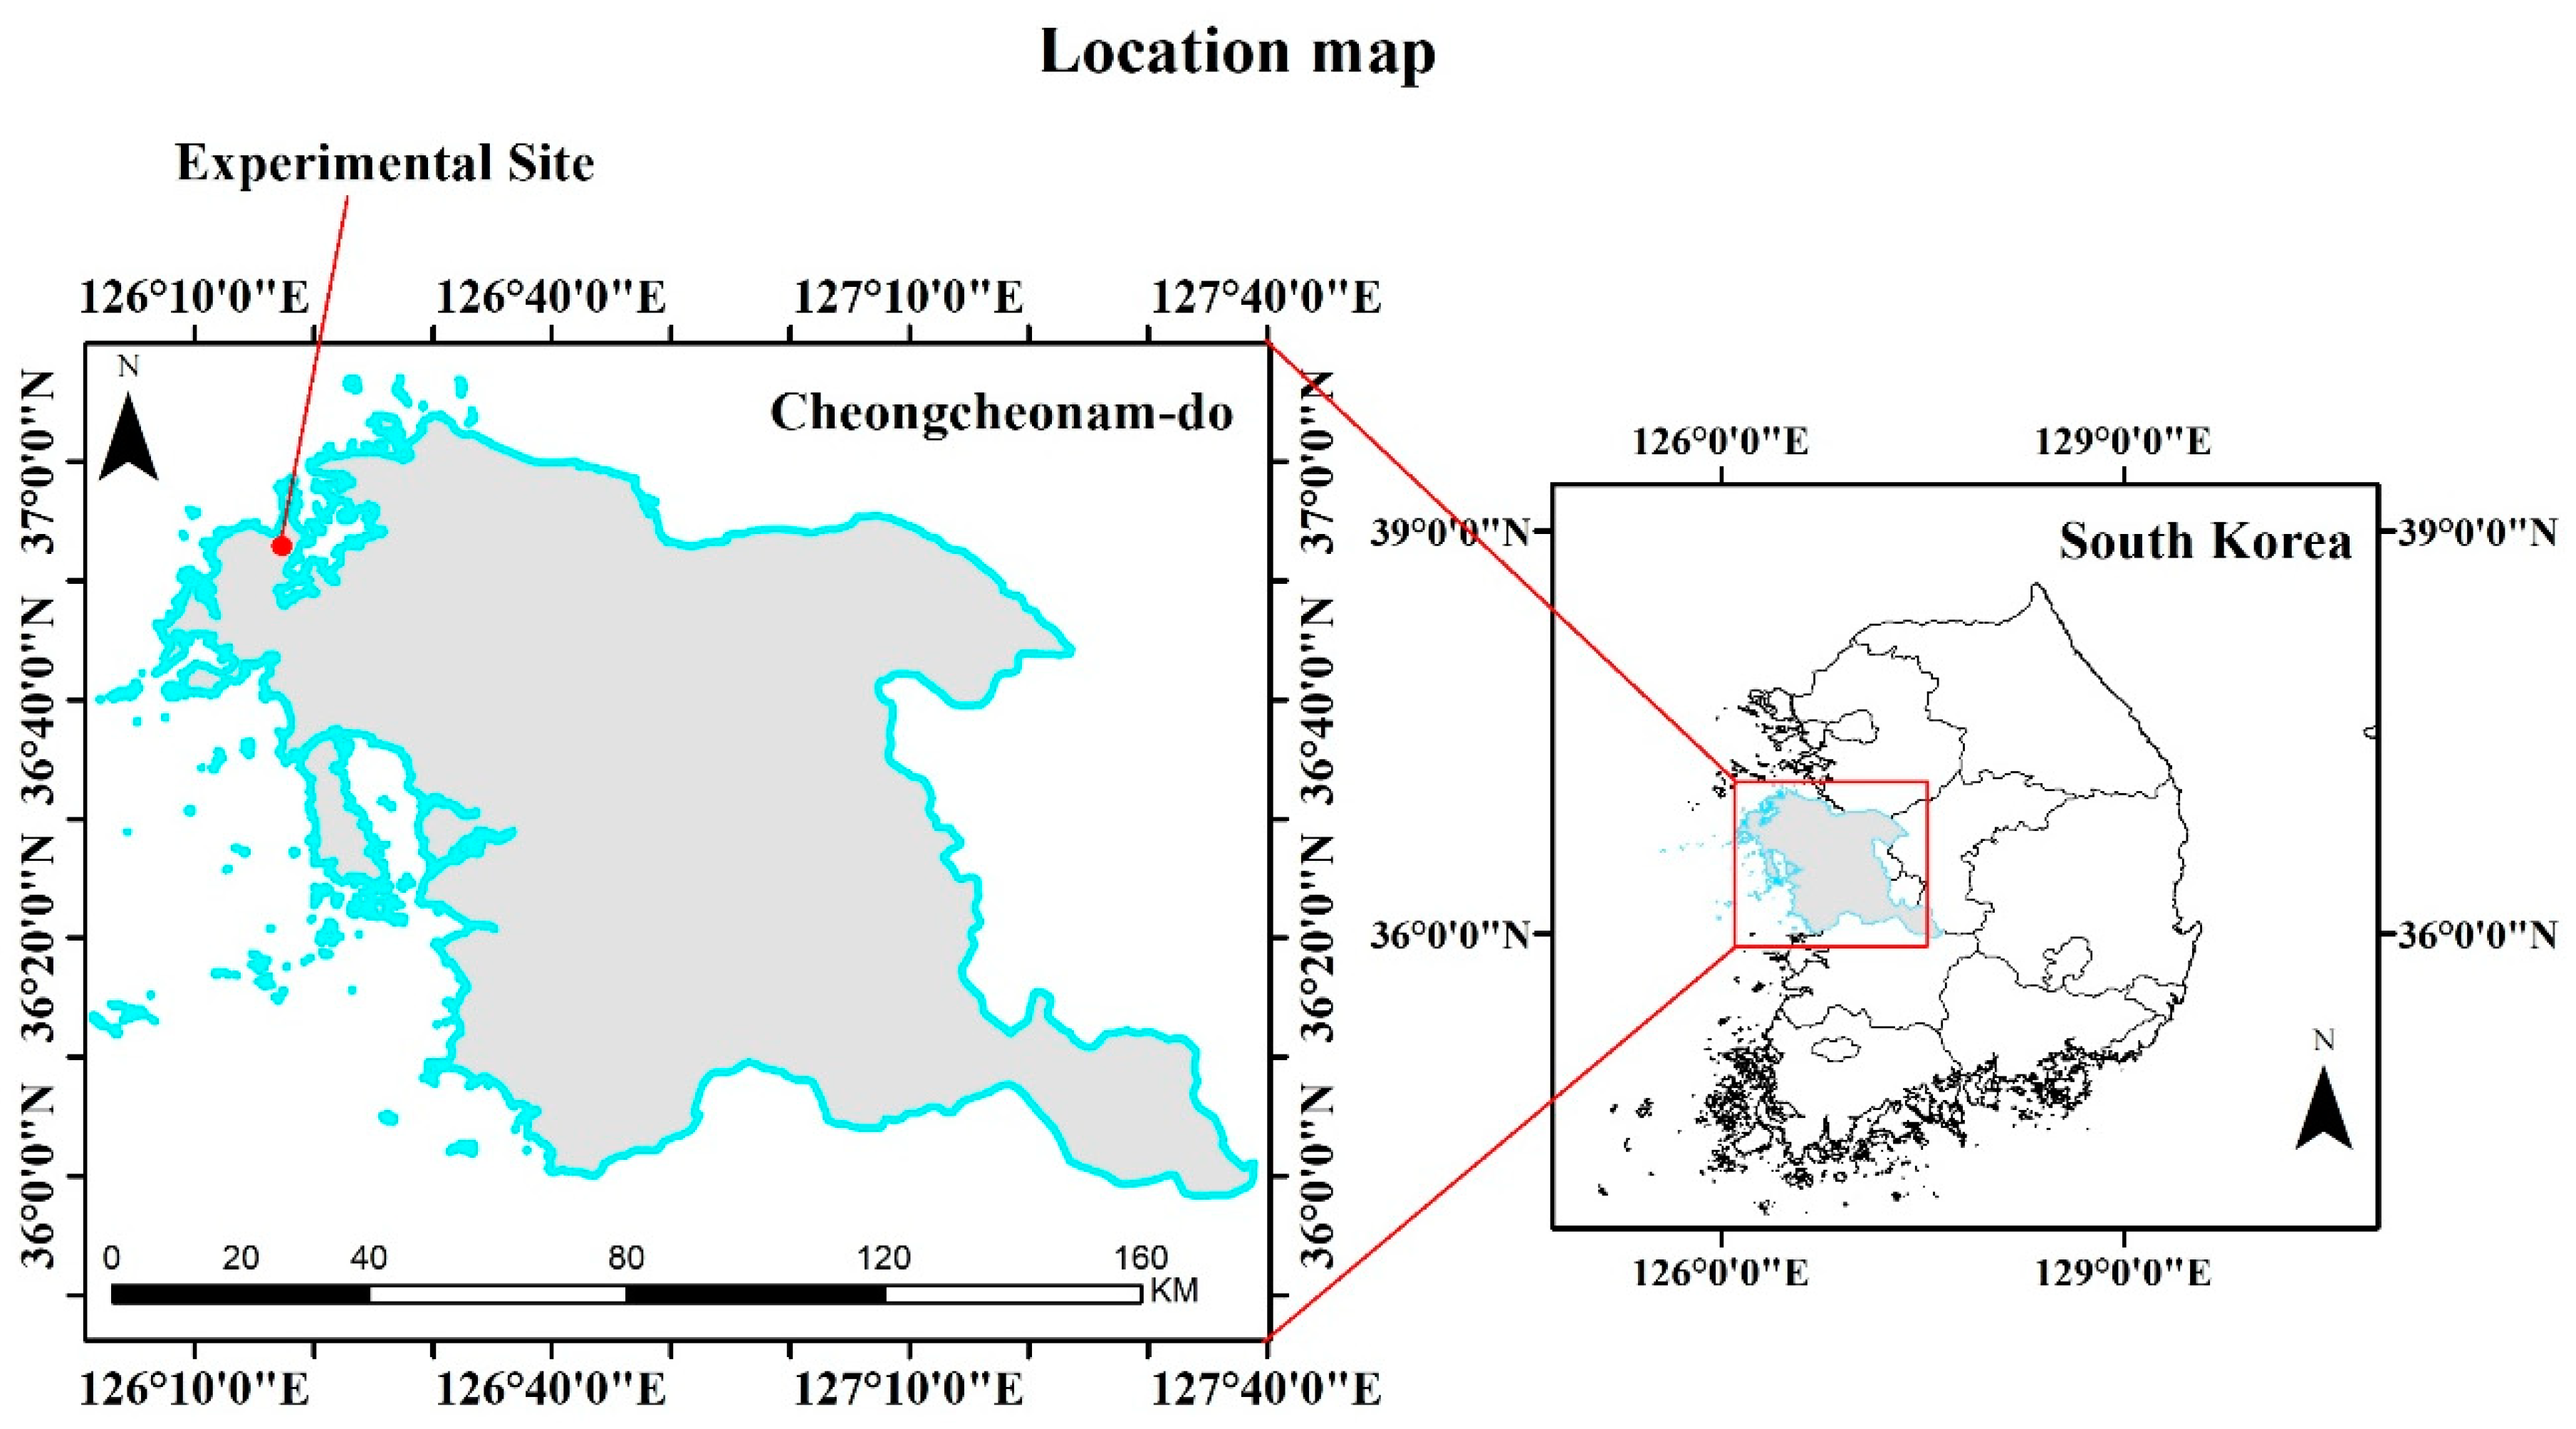
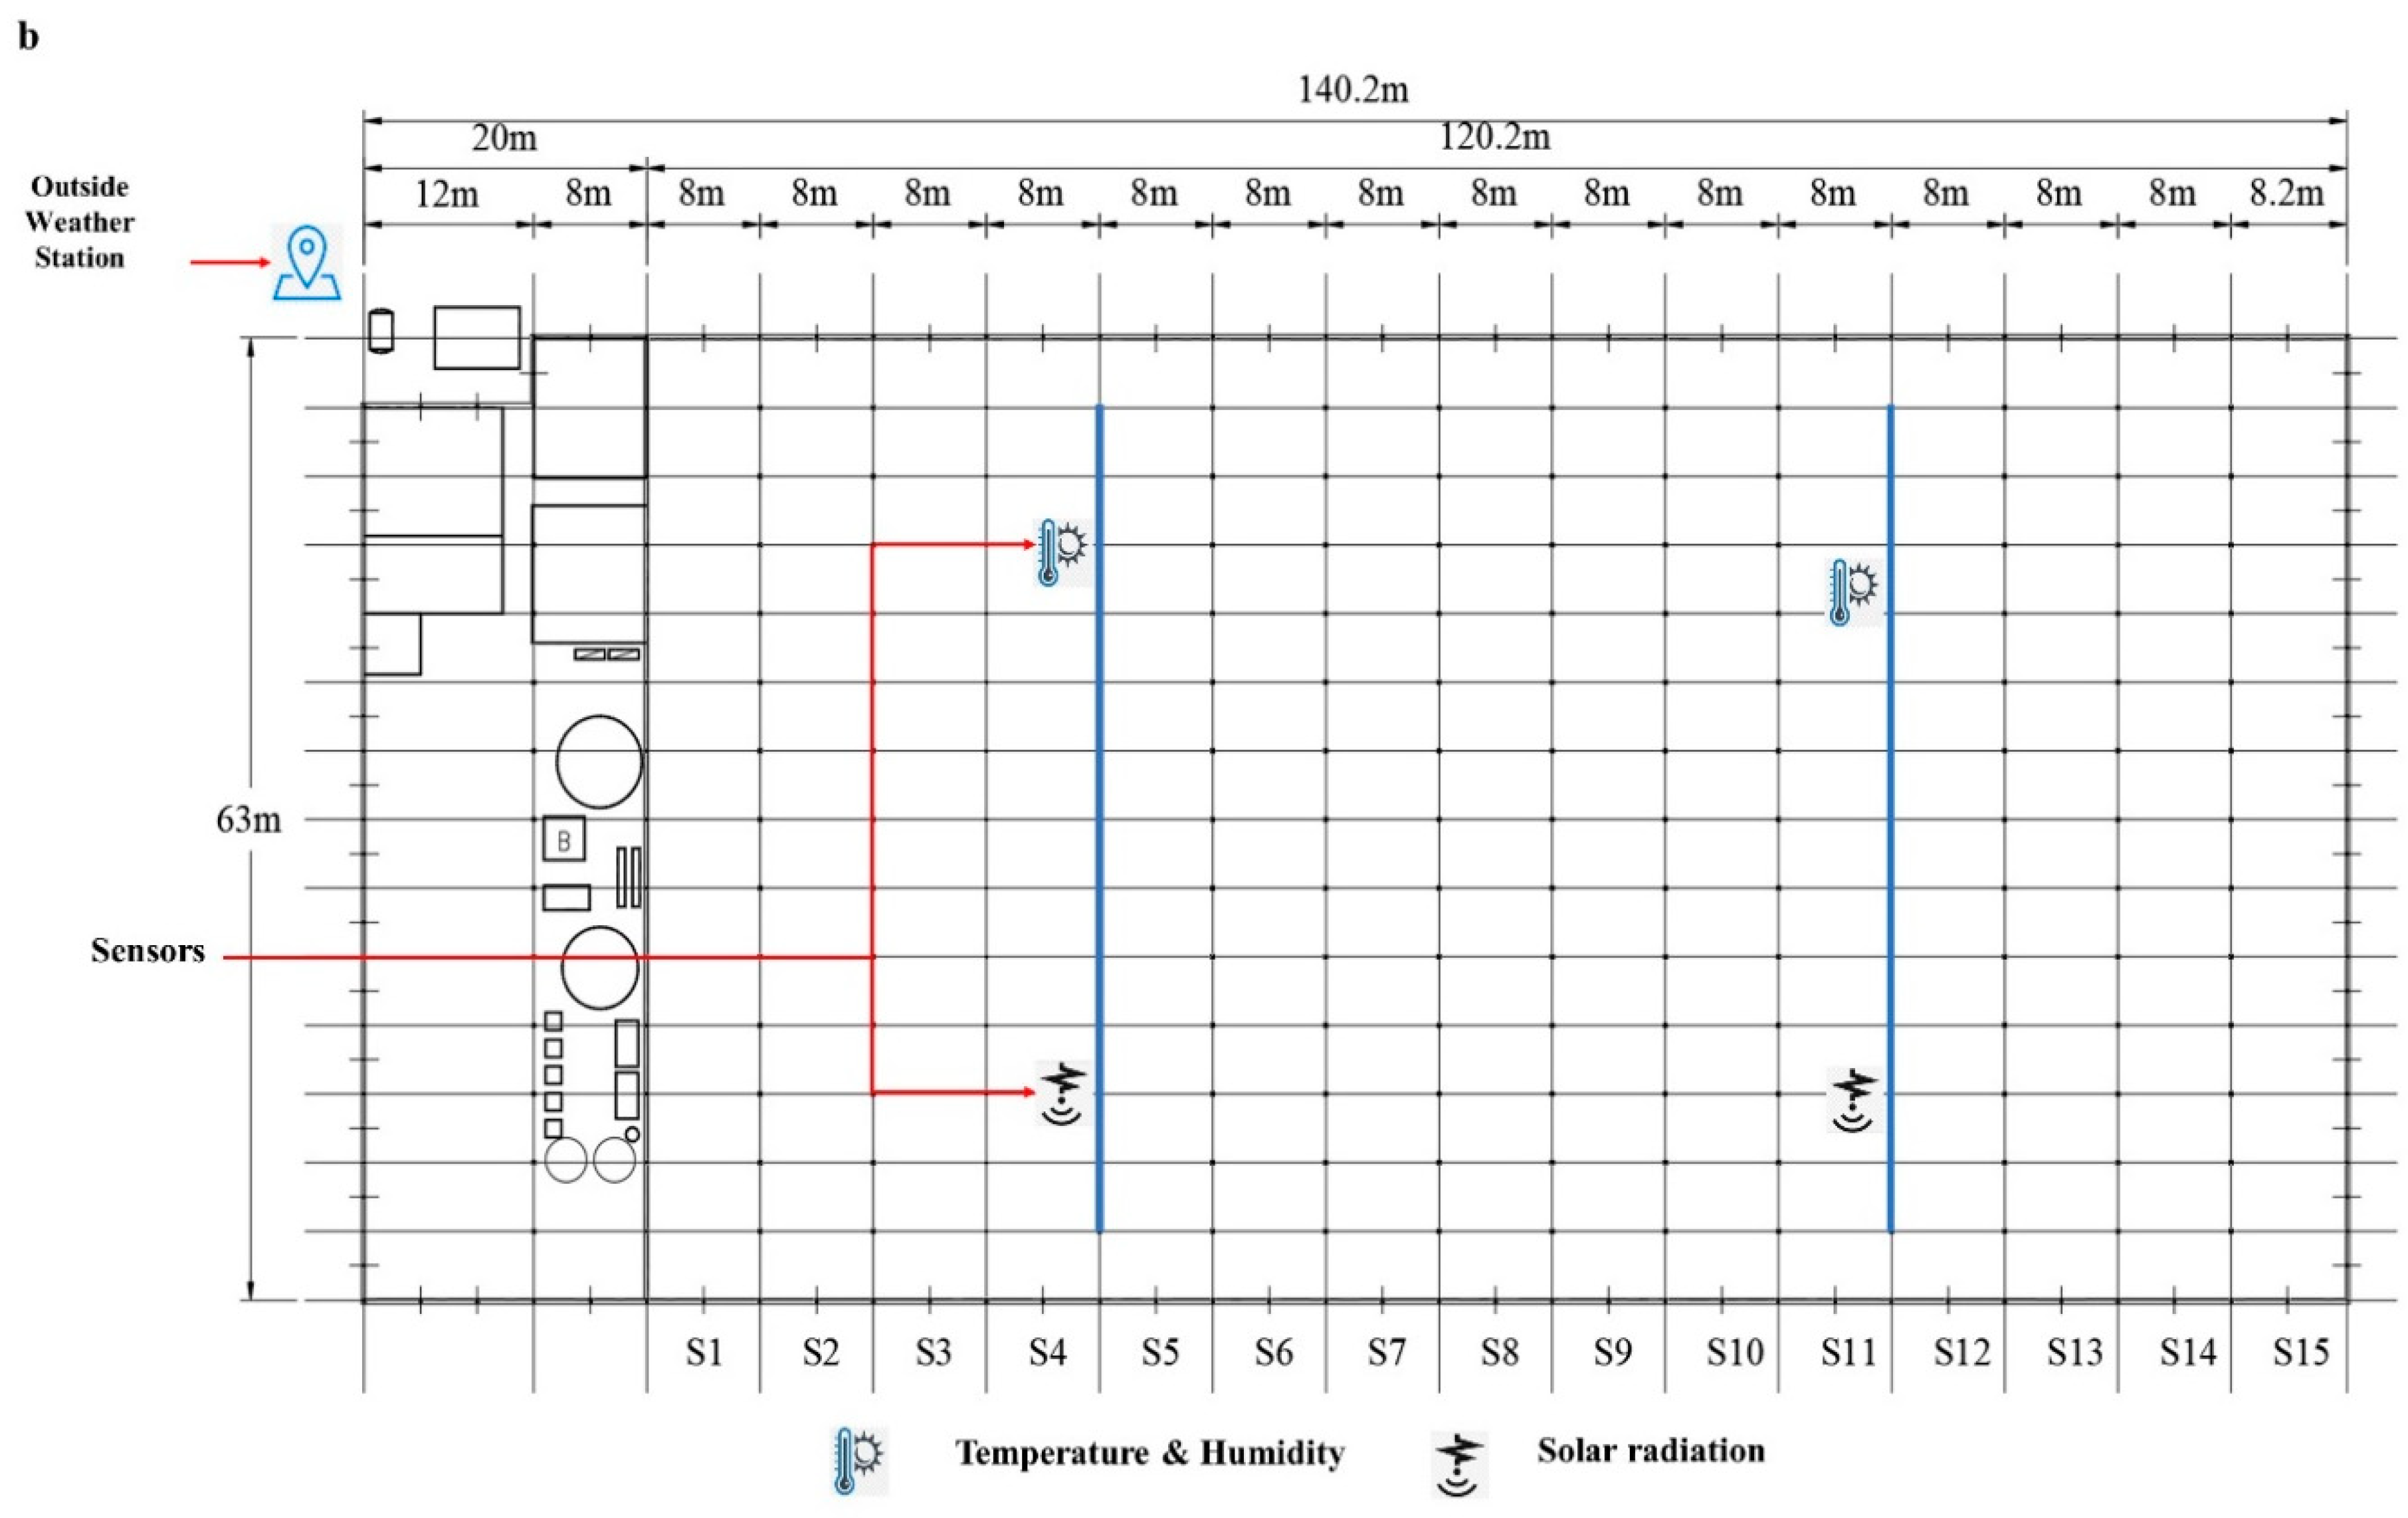
The 15-span experimental greenhouse located in Taean Gun (latitude 36.88° N, longitude 126.24° E, elevation 45 m asl), as shown in Figure 1, was used for validation purposes. The geographic location of the experimental greenhouse is presented in Figure 2. The multi-span experimental greenhouse had a rectangular based, Venlo type roof-shaped; the roof was covered with horticulture glass (HG-4 mm) and the side walls were covered with 16-mm polycarbonate (PC) material. Furthermore, inside of greenhouse, three thermal screens two Ph-super and one Ph-77 were under the roof, and one Ph-77 on the side of the roof was applied. The total floor area of the greenhouse was 7572.6 m2, with length, width, and volume of the greenhouse as 120.2 m and 63 m, 57 m3·m−2, respectively, while each span width, ridge height, and eve height were 8 m, 7.48 m, and 6.5 m, respectively. The schematic diagram of the experimental greenhouse, as depicted in Figure 3a, shows the vertical view of one span while Figure 3b shows the horizontal view. The weather data, including air temperature, solar radiation, relative humidity, wind speed, and wind direction, were recorded at the site. The ambient air pressure data were not recorded at the experimental site but obtained from the Korean Meteorological Administration (KMA) from nearest weather station—Seosan (129) weather station, latitude 36.7° N, longitude 126.4° E. The weather data were recorded from January to December 2019, and the characteristics of the weather data are shown in Table 1. Furthermore, the weather data were used as an input in the Building Energy Simulation (BES) model to simulate the real weather condition of the experimental site. Moreover, the greenhouse inside temperature was monitored for validation purposes.

2.2. BES Modeling

This study was conducted using TRNSYS 18, a BES modeling tool program as earlier stated. TRNSYS, which stands for “Transient System Simulation Program”, is a versatile component-based program that provides tools for simulating both simple and complex energy flows in buildings. This program has been used for many different applications. Examples of simulations carried out using TRNSYS are those for energy systems research, energy building simulation, solar thermal processes, solar applications, ground-coupled heat transfer, geothermal heat pump systems, air-flow modeling, system calibration, hydrogen fuel cells, wind and Photovoltaic (PV) systems, and power plants [21].
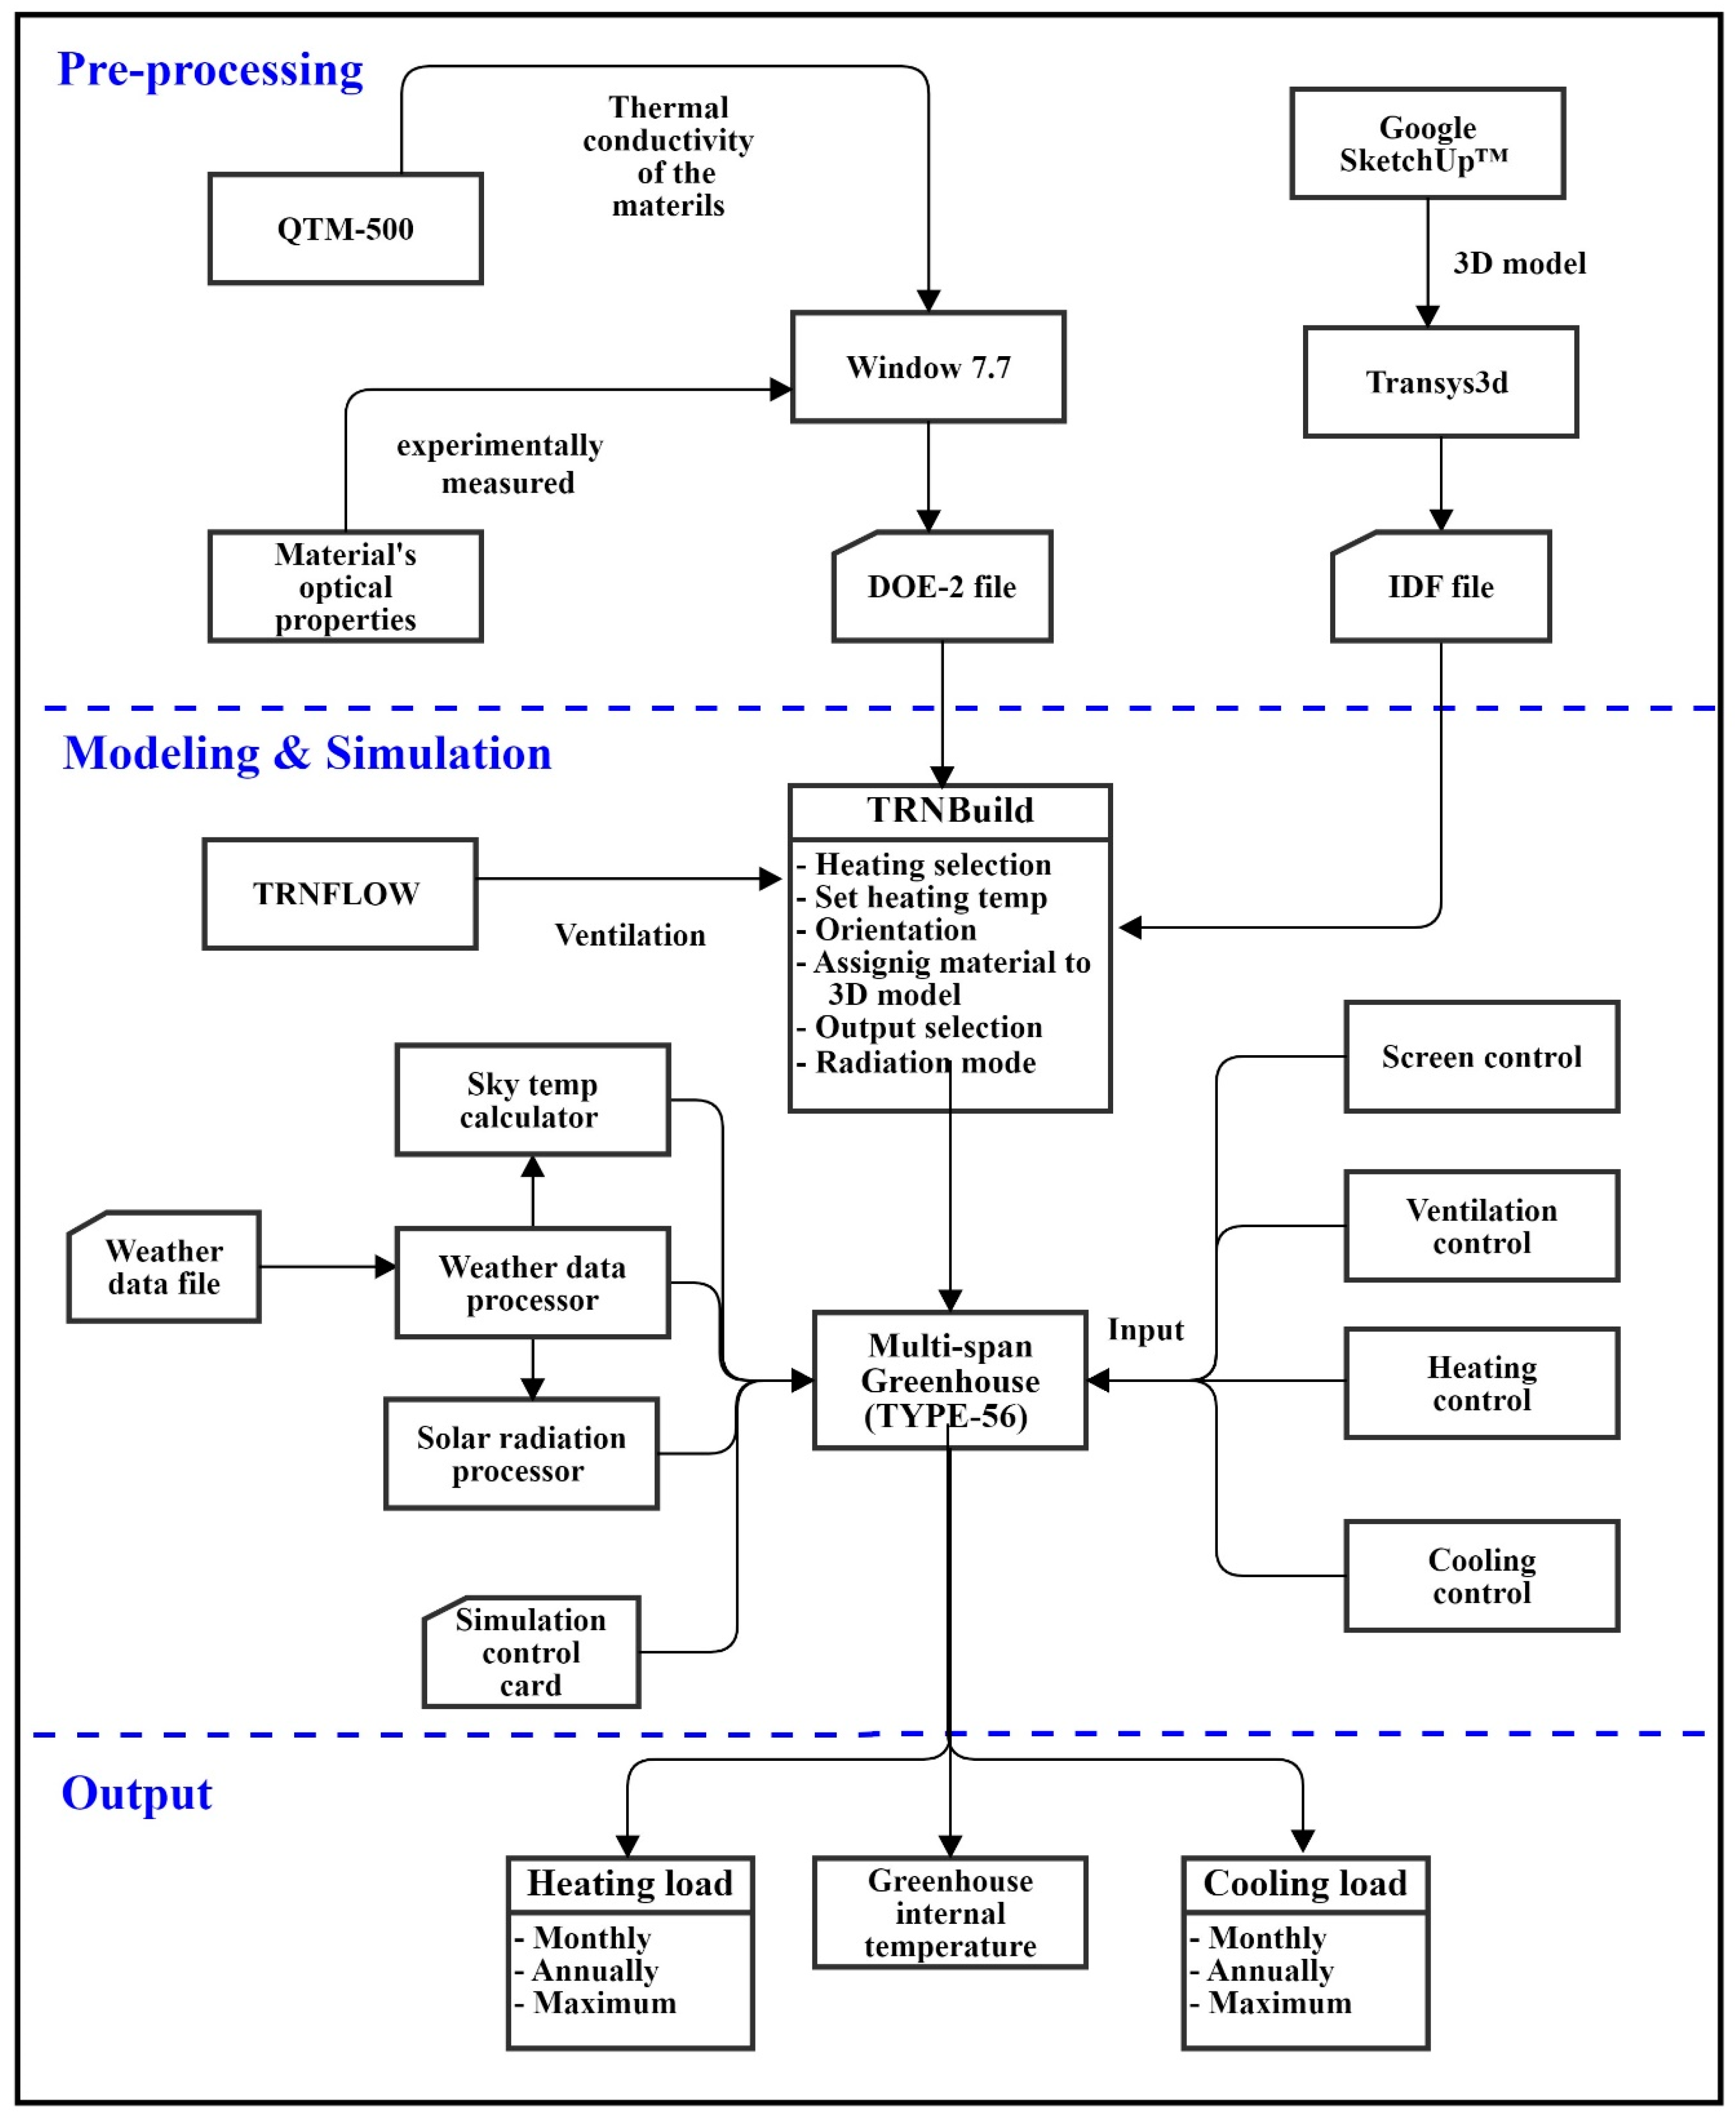
The modeling process was completed in three parts, including, pre-processing, modeling, and simulation. The details of each are discussed below in the corresponding sub-sections. An overview of the complete modeling process is detailed in Figure 4.

2.2.1. Pre-Processing

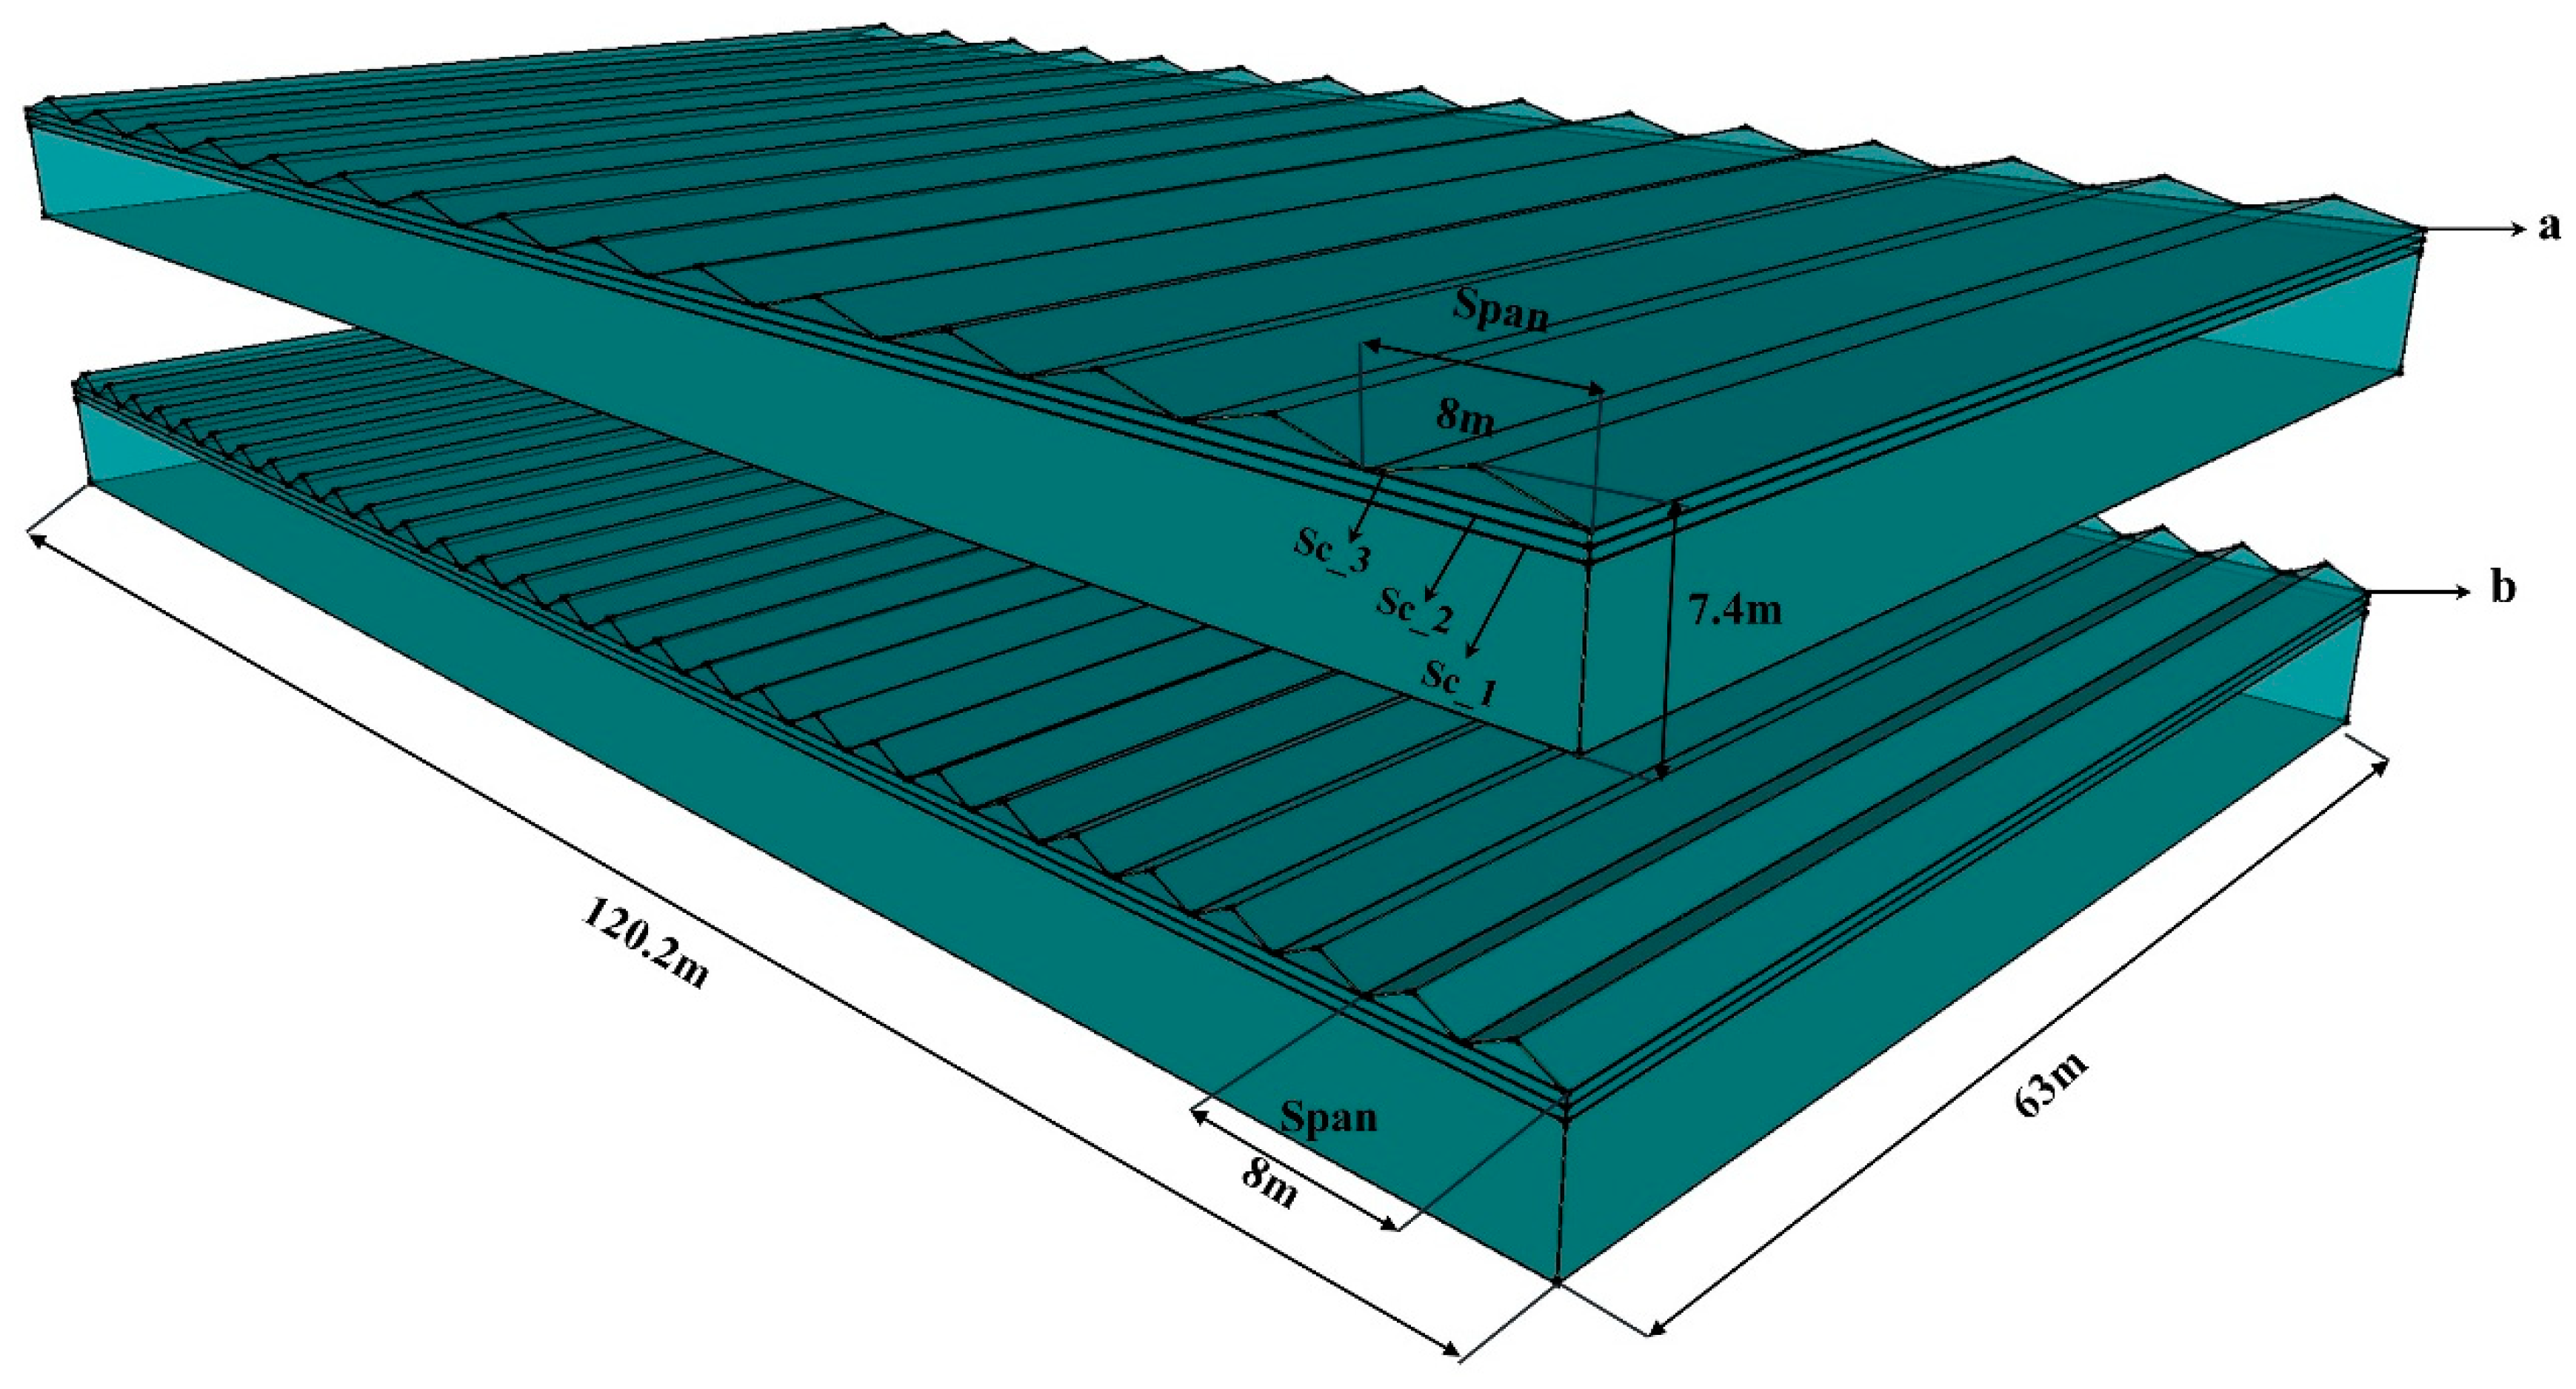
The pre-processing of the BES model was carried out to prepare the input data using the following programs: Google SketchUp™ (3-D modeling program) software, and Transys3d (Add-on of TRNSYS program), Lawrence Berkeley National Laboratory (LBNL) Windows 7.7 software, Quick thermal conductivity meter (QTM-500). It is worth noting that the 3-D models for the multi-span greenhouse used in this study were prepared by using Google SketchUp™. Furthermore, Transys3d, an add-on of the TRNSYS program for Google SketchUp™, was used to prepare the IDF file of 3-D model. This was then imported as an input to TRNSYS-18. Figure 5 shows the 3-D model of the studied multi-span greenhouse with the Wide-span and the Venlo denoted as (a) and (b), respectively. The greenhouse coverings and screen materials are specific and cannot be used in conventional buildings; thermal screens are used inside the greenhouse during heating period to reduce heat loss to ambient weather to save heat energy and shading screens are used inside or outside of the greenhouse during the cooling period to minimize the solar heat gain inside the greenhouse which reduces greenhouse inside temperature and consequently reduces the cooling energy demand of the greenhouse, as well as different shading screens and strategies which effect the crop quality and yield [22]. To simulate the actual greenhouse indoor environment, greenhouse covers and thermal screens’ physical, optical and thermal properties including thickness, thermal conductivity, solar, visible, and thermal, transmittance, emittance, and reflectance were used. For this specific purpose, the greenhouse covers’ properties were taken from a study conducted by Valera et al. [23], with the summarized details presented in Table 2.
Furthermore, specific thermal and shading screens available in the South Korean market were used. It is worth noting that the properties of these materials are not in the literature, hence the need for characterization. The thermal conductivities of all the screens were measured by the QTM-500, a thermal conductivity measurement device; the details of the measuring process have earlier been published in Rasheed et al. [24]. Other properties of the screens, such as transmissivity, emissivity, and reflectivity for different types of radiation, were measured by the methodology described by Rafiq et al. [25]. A detailed summary of the physical, optical and thermal properties of the characterized screen are presented in Table 3. In addition, the greenhouse covers and screen material’s properties were introduced into the LBNL Window 7.4 program to prepare a DOE-2 (readable by TRNBuild) file for each material. The DOE-2 is a specific file type which is used to introduce materials properties into the TRNSYS-18 for application on greenhouse 3-D models for further real-time simulation process.

2.2.2. Model Creation

The model was created using Simulation Studio, which is the main interface of the TRNSYS-18 program. TRNSYS-18 is a component-based program, and the simulation studio allows for the connection of all the components of the simulation together to create a model. The TRNSYS-18 Simulation studio for multi-span greenhouse model is presented in Figure 6 with the types used and their interconnections of this specific multi-span greenhouse BES model. Type-56 is first used to build the model component an interface is called TRNBuild. This is followed by the importation of IDF file for the 3-D model created by Transys3d of the multi-span greenhouse with DOE-2 files for all the cover and screen materials into TRNBuild. Application of the prepared materials into the 3-D TRNBuild is next. The TRNBuild deals with all the parameters and calculations of the greenhouse model, including solar radiation calculation on each surface of the greenhouse, convective, conductive, and radiative heat exchanges, heating and cooling set-points. The greenhouse ground properties, thermal conductivity, capacitance, and density were, 1.89 kJ·h−1·m−1·K−1, 1.5 kJ·kg−1·K−1, and 2000 kg·m−3, respectively, were also added in TRNBuild. The TRNFLOW, a tool for the calculation of the natural ventilation of the greenhouse, is also included in the TRNBuild interface. TRNBuild combines the thermal and ventilation model of the greenhouse. In simulation studio, the weather data is connected to Type-56 for the simulation of the greenhouse in the real situation. In the simulation studio different types were used to process the weather data and controllers for the dynamic day/night and seasonal control of natural vents opening and closing with inside temperature, screens control with outside solar radiations and heating and cooling set-points. A detailed description of all the specific components (Types) used in this modeling process is presented in Table 4.

2.2.3. Validation of the BES Model

To validate the proposed multi-span greenhouse BES model, the computed internal air temperature of the greenhouse was compared with those obtained experimentally using the same physical and operating conditions. Validation was carried out during a 10-day period in each of the summer and winter seasons of 2019 i.e., 20–29 August, and 1–10 December, respectively. These periods were chosen as operating conditions in greenhouses are different in these two periods. A summary of reference physical and operating conditions of the greenhouse during both time periods is given in Table 5. Furthermore, a statistical analysis of the validation results was performed in quantitative terms using the coefficient of determination (R2), Equation (1); the root mean square error (RMSE), Equation (2); and the relative root mean square error (rRMSE), Equation (3). The R2 value ranges between 0 and 1. A value nearer to 1 means the model is very accurate. The RMSE gives the standard deviation of the difference between computed and measured values. The rRMSR value is considered good if it is <10%, fair if it is <20%, and poor if it is >30%. They are mathematically defined as follows:
R 2 = 1 [ i = 0 n   ( T i exp T i sim ) 2 i = 0 n   ( T i exp T i mean ) 2 ]
RMSE = i = 0 n   ( T i exp T i sim ) 2 n
r RMSE = 100 T i exp ( i = 0 n   ( T i exp T i sim ) 2 n )
where T i exp is the experimentally obtained internal temperature of the greenhouse, T i sim is the simulated internal temperature of the greenhouse, T i mean is the mean of the experimental temperature, and n is the total number of observations.

2.2.4. Simulation

After validating our proposed model, further simulations were performed to investigate the effect of different greenhouse design parameters from an energy conservation point of view. Table 6 shows details of all the studied parameters. Firstly, an analysis was carried out to determine the effect of different orientations on the heating and cooling loads of the greenhouse that maintain the desired temperatures of 18 °C and 30 °C inside the greenhouse for heating and cooling, respectively. Further analysis was carried out with different covering materials and double glazing using the same greenhouse operating conditions that were used for validation (i.e., those presented in Table 5). Further analyses were performed to evaluate the effect of using no screen and using different thermal screens on the cooling and heating loads of the greenhouse. Comparisons were made to find the best solution. Moreover, the total annual energy load, including heating and cooling loads, was estimated with a fully closed and naturally ventilated greenhouse to predict the cooling energy reduction due to the use of natural ventilation. The effect of north wall insulation was estimated for the winter season only and heating load was calculated with and without insulation and a comparison was made. Finally, a venlo type and wide-span greenhouse heating and looing load was estimated.

3. Results and Discussion

Figure 7a,b shows the summer and winter validation results. The computed results were obtained with the same physical and operating conditions as those of the experimental greenhouse, and are detailed in Table 5. Specifically, the internal greenhouse temperatures were compared. The statistical analysis of both validation results (given in Figure 7a,b) indicate R2 values of 0.84 and 0.63; RMSE values of 1.8 °C and 1.3 °C; and rRMSE values of 6.7% and 7.4%, respectively. The R2 value of 7a indicates that the model is accurate enough to calculate the inside temperature. In the case of the 7b, the value is a little less at 0.63, which is because the temperature fluctuations are much less. The RMSE value for the prediction of the greenhouse’s internal temperature is less than those of the studies conducted by Ahamed et al. and Vanthoor et al. [26,27]. Their studies indicated that an rRMSE value less than 10% is reasonable. According to that, our model prediction is sufficiently accurate. The good agreement between the computed and experimental internal temperatures encourages the adoption of the proposed multi-span greenhouse BES model.
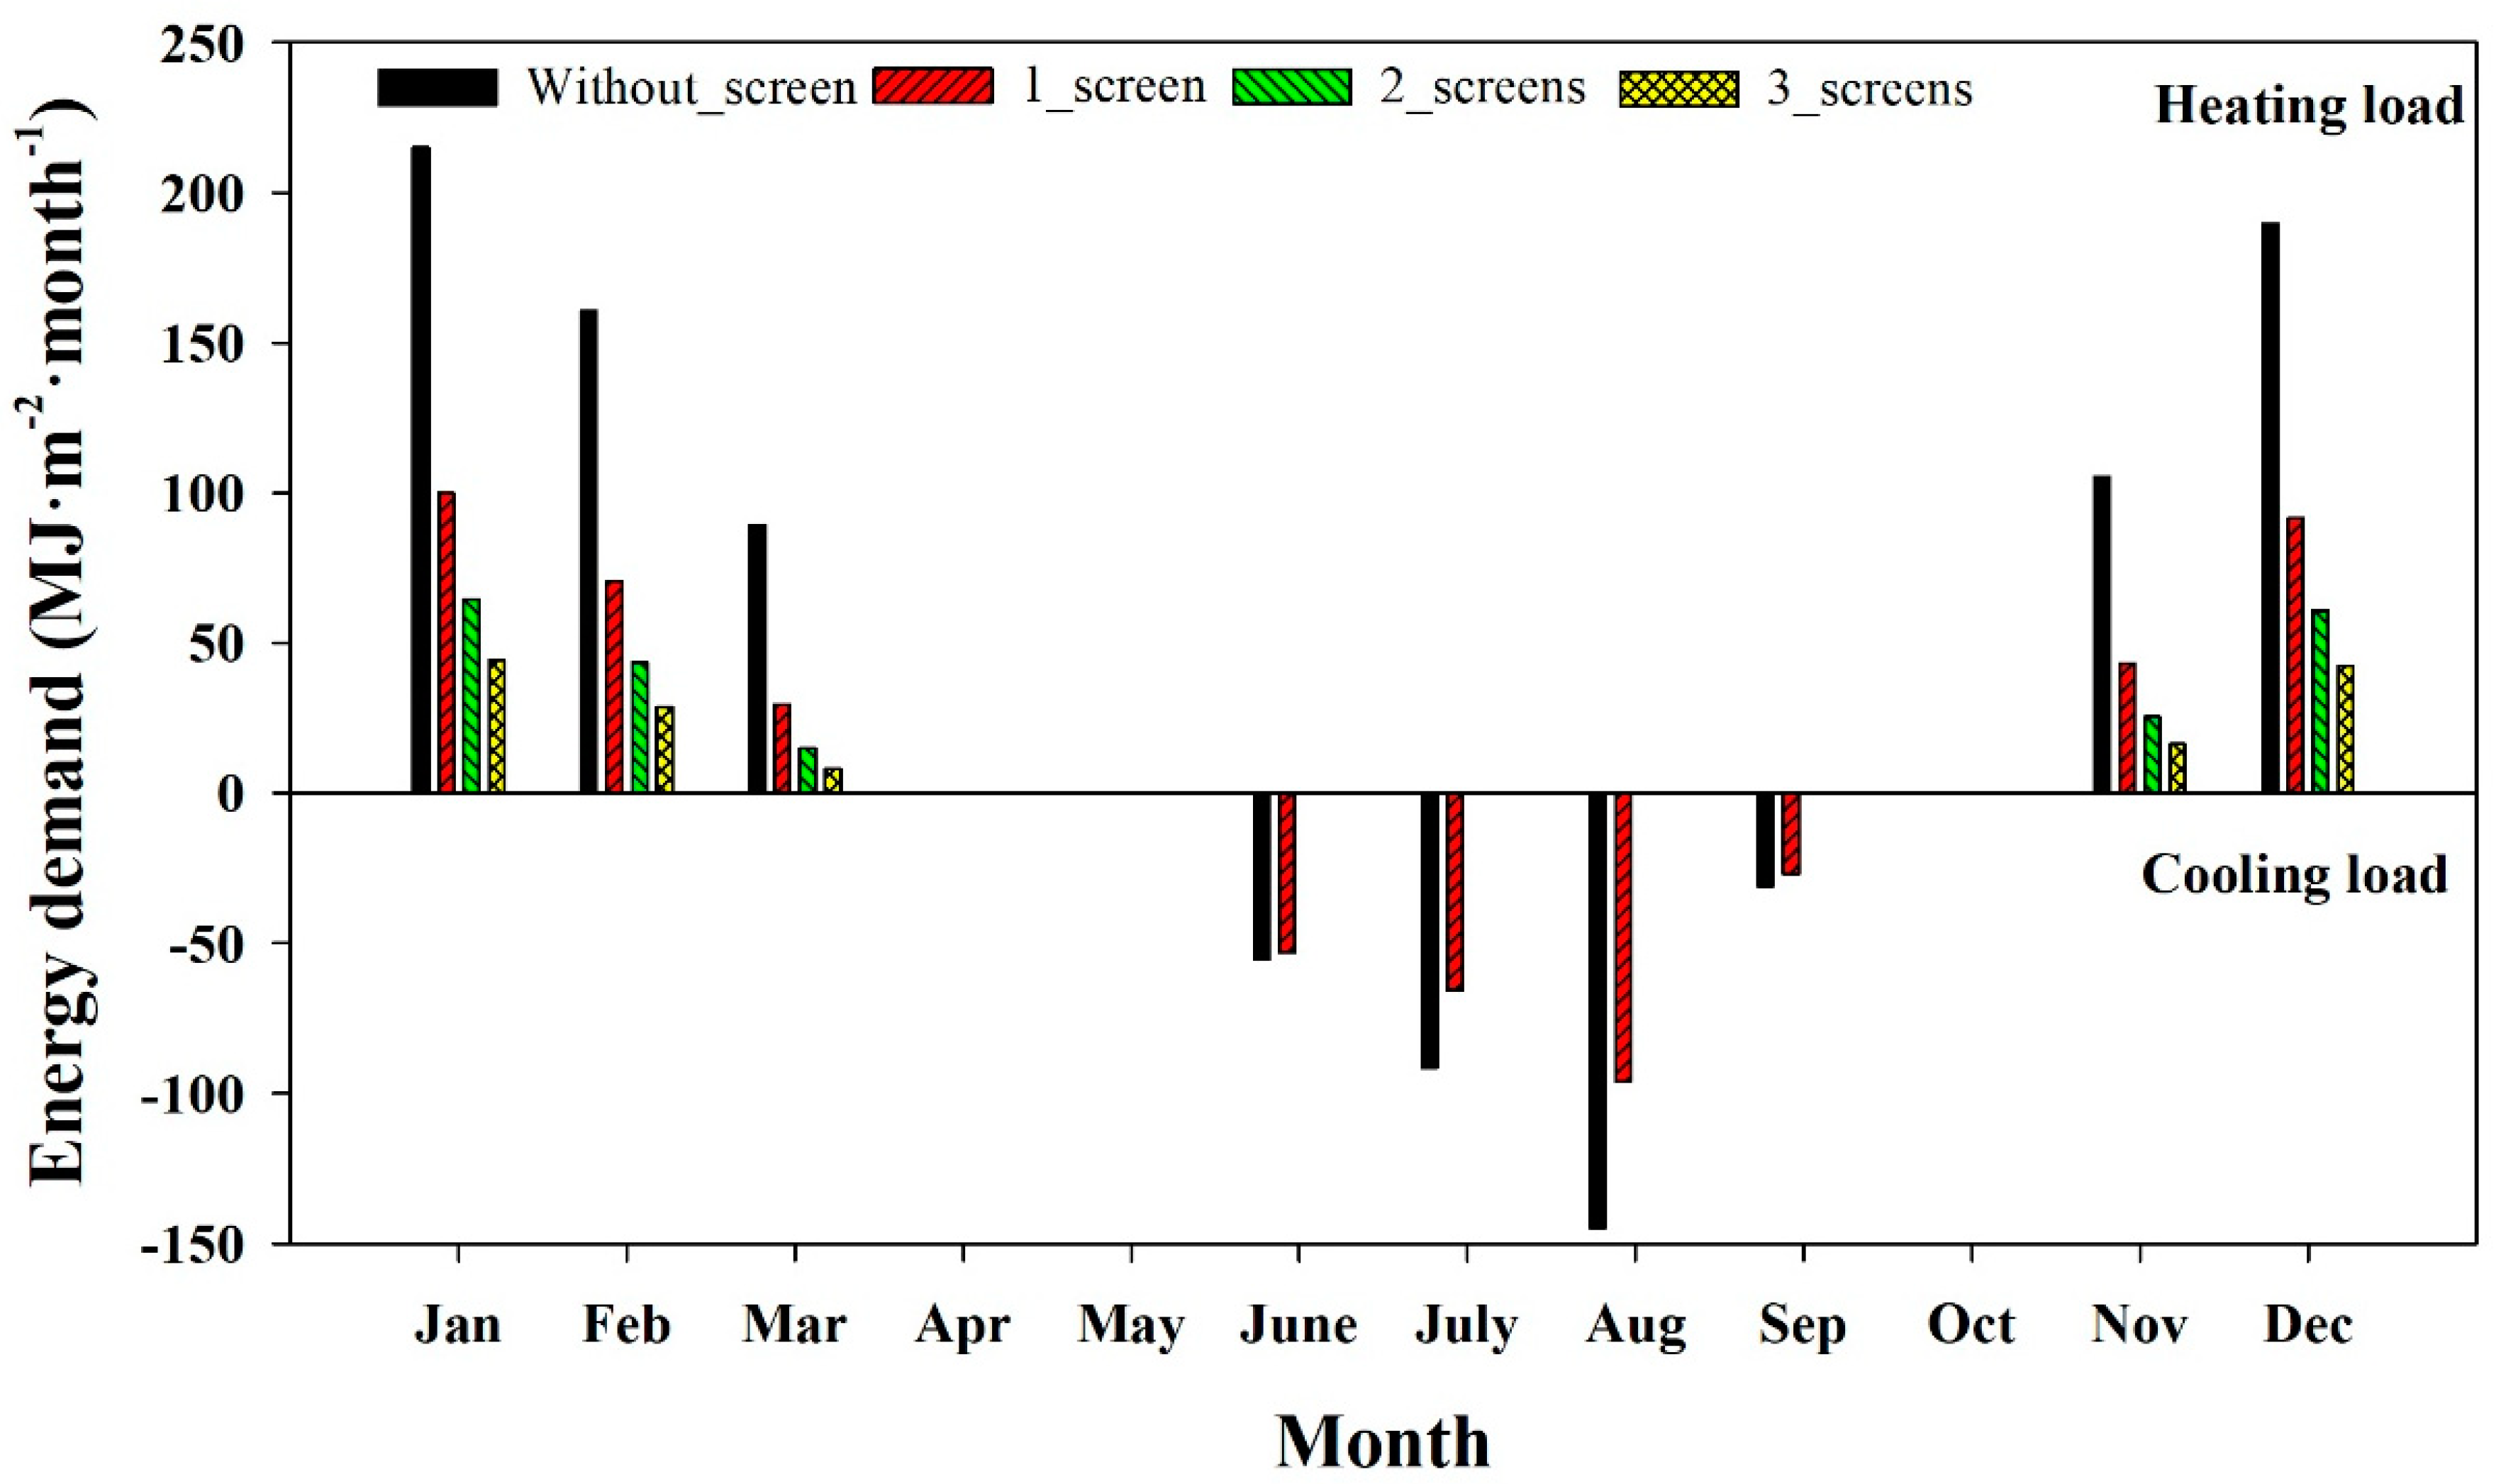
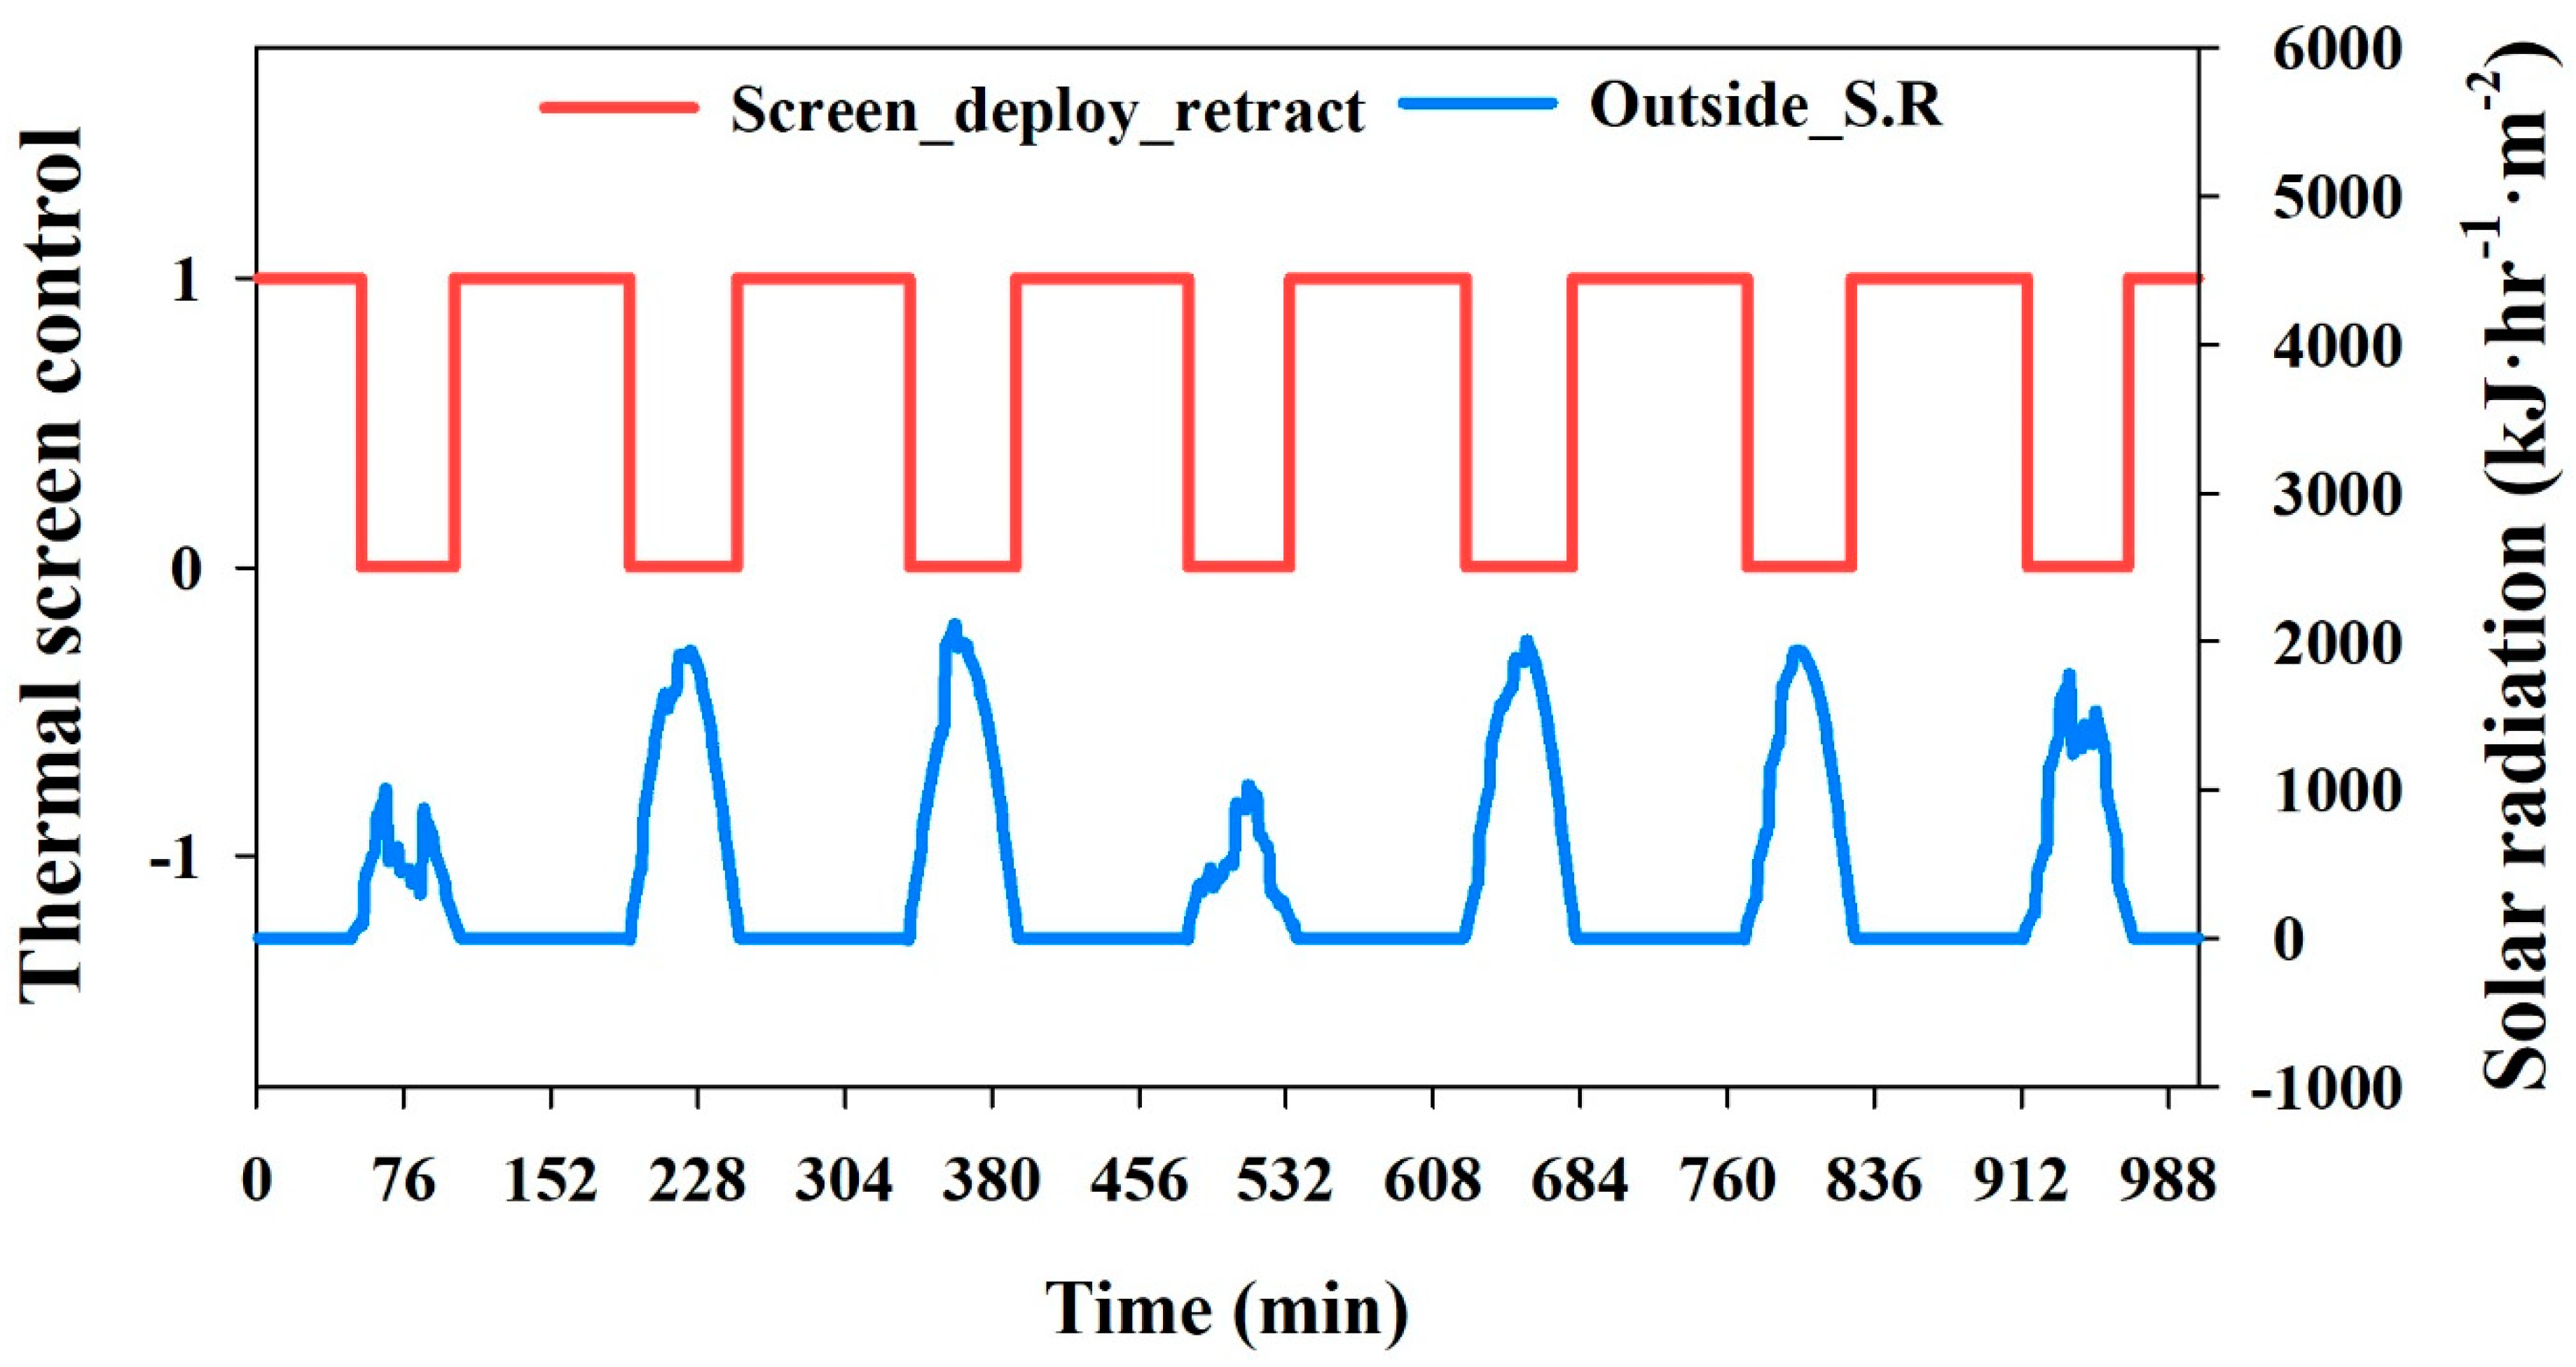
After successfully creating and validating the multi-span greenhouse BES model, simulations were carried out for all the multi-span greenhouse design parameters presented in Table 6 (simulation section). Further analyses were conducted with the same greenhouse description and operating conditions presented in Table 5. (validation section). Only heating and cooling set points were changed to 18 °C and 30 °C for winter and summer, respectively. Firstly, we evaluated the effect of using a number of screens in the greenhouse during heating and shading screens during cooling, and made a comparison. Figure 8 shows the monthly heating and cooling energy demand when thermal and shading screens were used. The months for heating and cooling were selected based on South Korean weather and crop needs. In the periods November to March we used heating, while cooling was used for June to September. The results showed significant heat energy savings during the winter period by using screens and compared with the no screen greenhouse case. Moreover, when using three screens inside the greenhouse, the heat energy demand was 70% and 40% lower than when the single and double layered screens were used. Normally, in greenhouses, one or two thermal screens are used. Geoola et al. [28,29], in two studies and our previous study (Rasheed et al. [30]) on the U-value of greenhouse cladding with thermal screens, reported that the use of thermal screens can reduce heating energy demand by 50–60%. Taki et al. [31] also reported a reduction in heating energy demand using thermal screens in comparison with cases without thermal screens. Their results are for the particular screens used in the current study, and can be different for other screen materials, as heat loss characteristics depend on the screen’s properties. Furthermore, during summer months the shading screen showed 25% less cooling energy demand for the greenhouse. Therefore, during winter, thermal screens reduce heat loss to the ambient environment. Conversely, during summer, shading screens reduce the amount of solar radiation entering the greenhouse. This causes energy savings to be made and using screens in the greenhouse causes a volume decrease and hence a reduced energy demand. Ahmed et al. [32], who conducted a review on greenhouse shading for greenhouse energy savings improvement, and Abdel-Ghany et al. [33] who predicted the potential of different shading methods for greenhouses, also reported the same trend. In addition, Figure 9 shows the proposed model’s capability in evaluating the thermal and shading screens effect on the greenhouse’s energy demand under dynamic outside weather conditions and dynamic control of the screens (as in the real greenhouse).
Further analyses were conducted to estimate the maximum heating and cooling demands for the reference multi-span greenhouse with and without screens, and the results are presented in Table 7. The maximum heating demand occurred at 8:00 a.m. on 9 January 2019 when the outside temperature was −10.7 °C and the solar radiation was 0 kJ·h−1·m−2. The maximum cooling demand occurred at 3:00 PM on 7 July 2019 when the outside temperature was 35.7 °C and solar radiation was 3570 kJ·h−1·m−2. An estimation of the maximum heating and cooling demand of the greenhouse with fully controlled systems helps to design an energy providing facility for the greenhouse. Lee et al. [34,35] conducted two studies to estimate the maximum heating and cooling demand of a multi-span greenhouse to design a facility to fulfil its energy demand. They assessed the performance of the facility in fulfilling energy requirement in peak times.
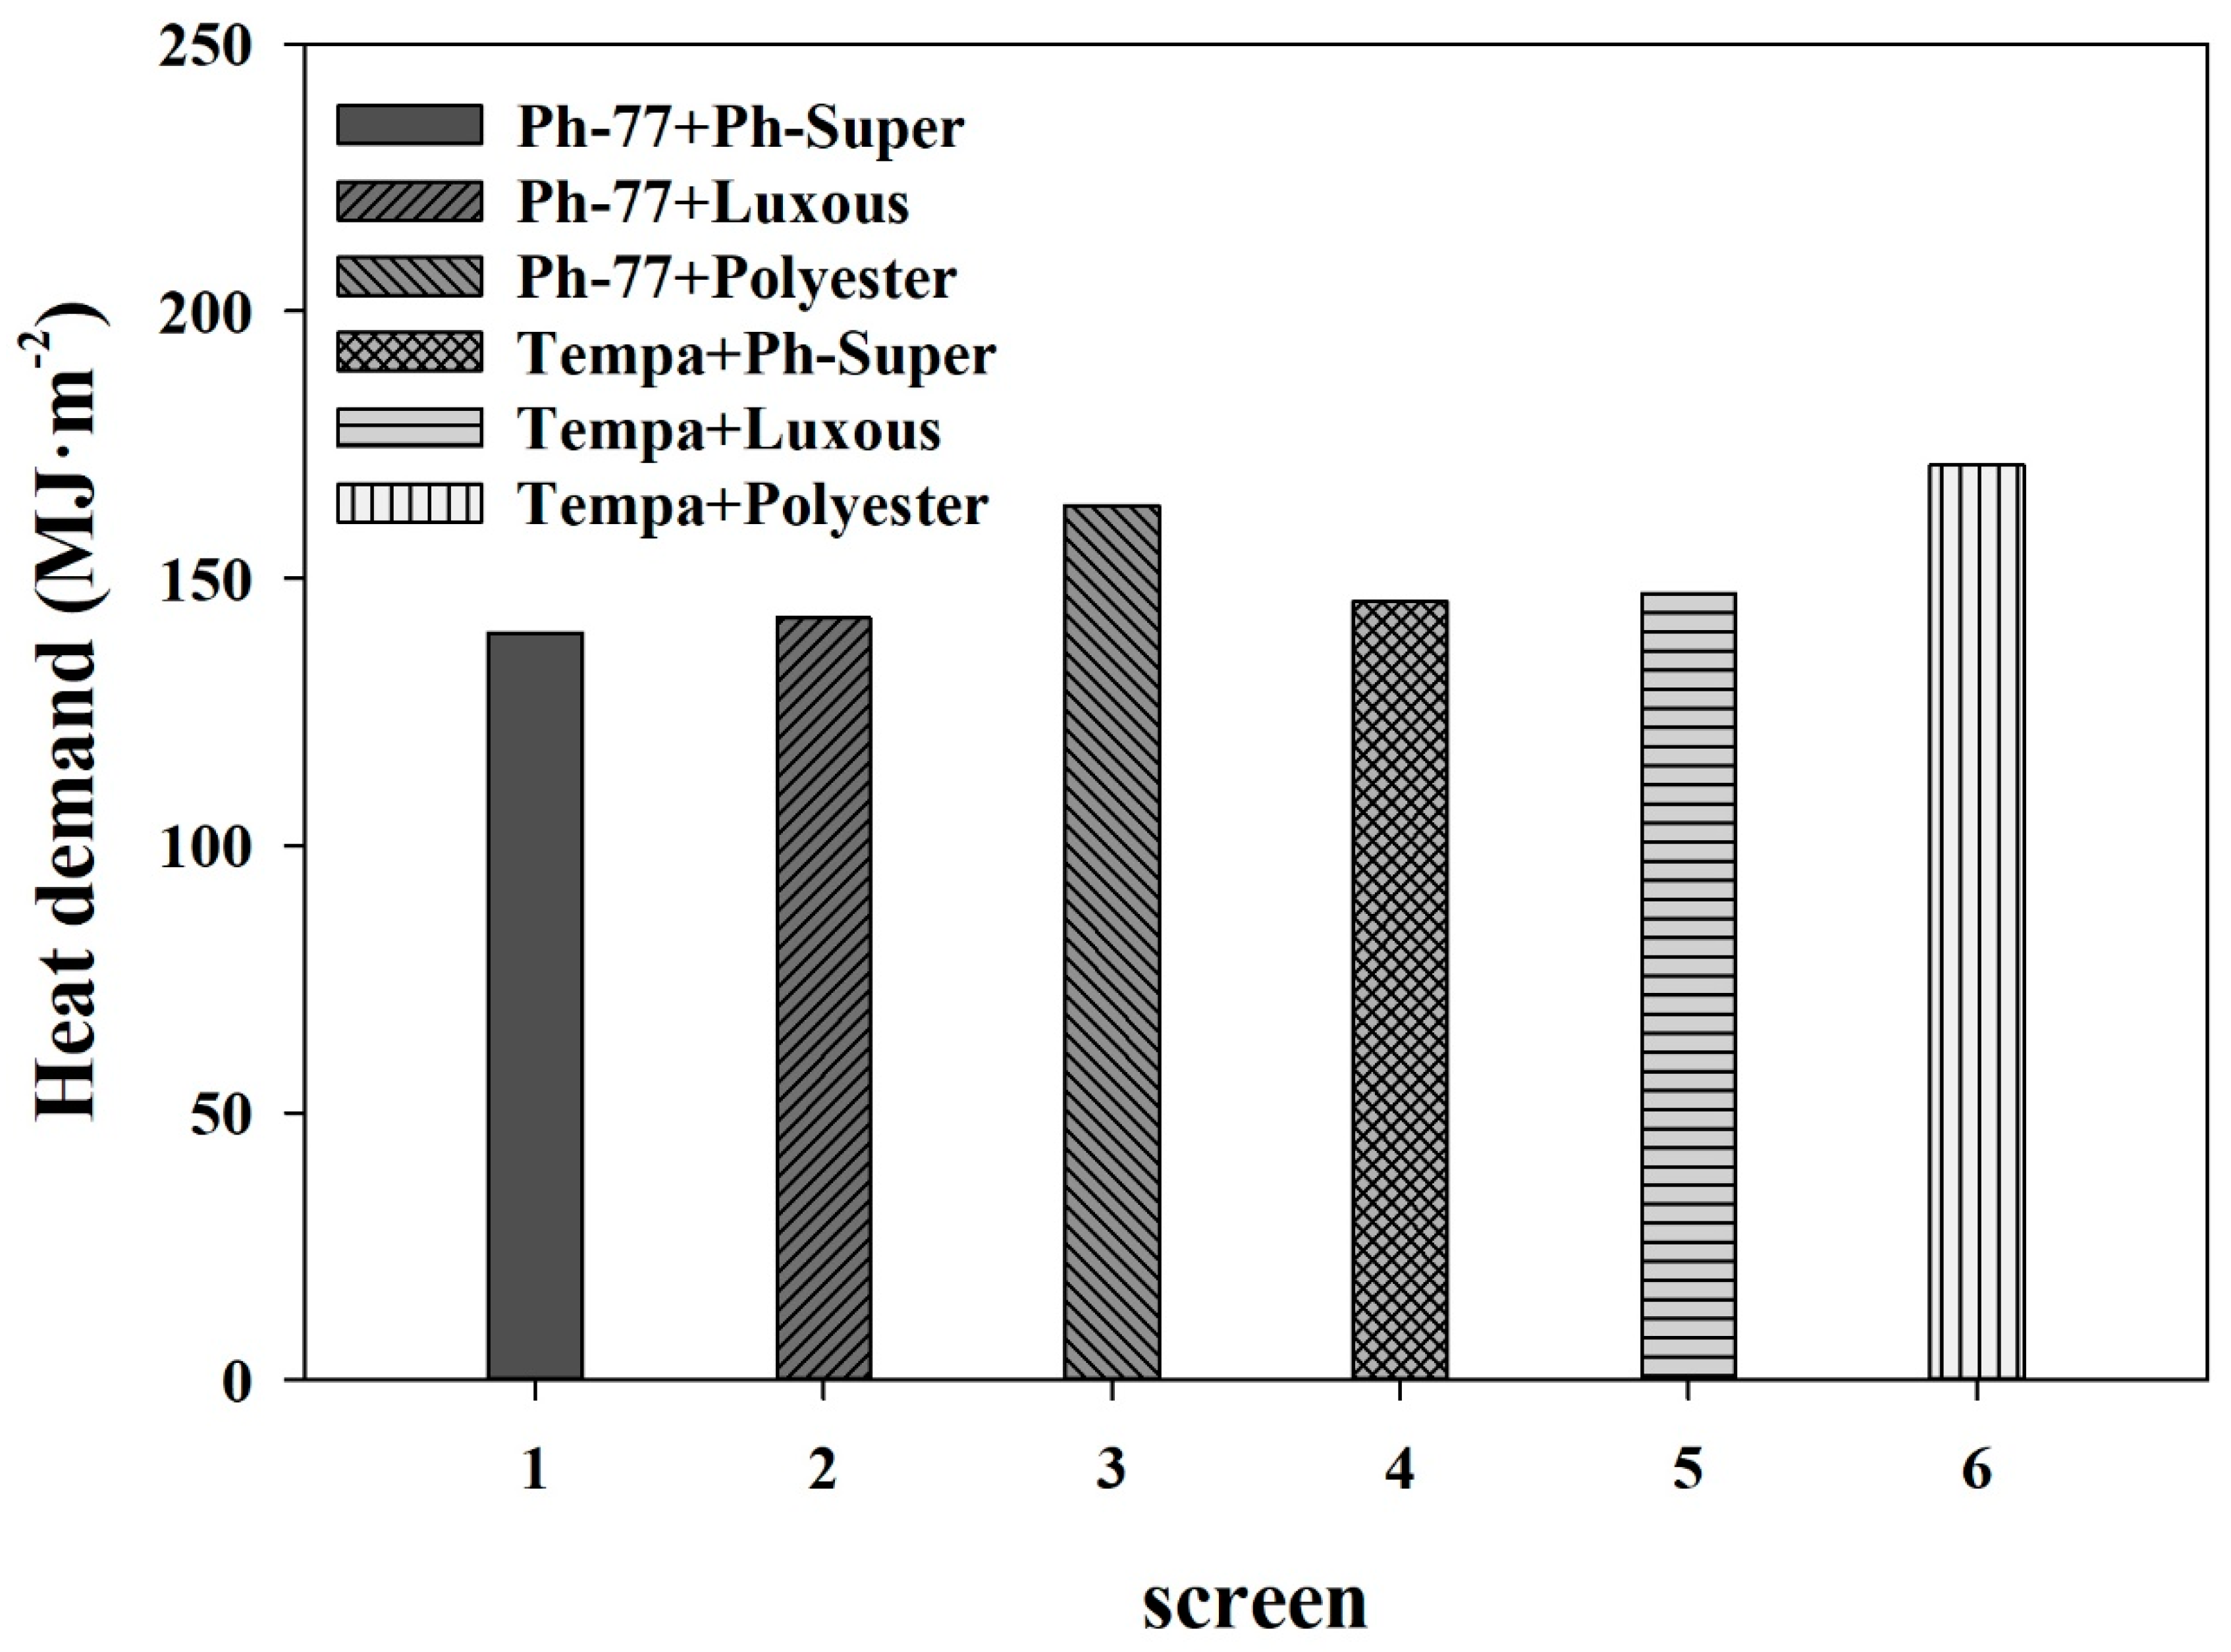
Different kinds of thermal screens are available in markets all over the world. Our screen analyses can help researchers and growers to choose the right screens according to their specific needs. For this reason, the heating energy demand of the different thermal screen materials available on the South Korean market were evaluated and compared. Their properties are described in Table 3. Figure 10 shows that Ph-77 combined with Ph-Super gives lowest least energy demand 139 MJ·m−2 compared with the others including Ph-77+Luxous, Ph-77+Polyester, Tempa+Ph-Super, Tempa+Ph-Luxous, Tempa+Polyester, which give demands of 142, 163, 145, 147, 171 MJ·m−2, respectively. This is due to the fact that Ph-77 and Ph-super’s emissivity values are lower than those of the others. Our previous study Rasheed et al. [28] and that of Ahamed et al. [30,36], on the sensitivity analyses of the effect of material properties on energy demand, confirmed these results.
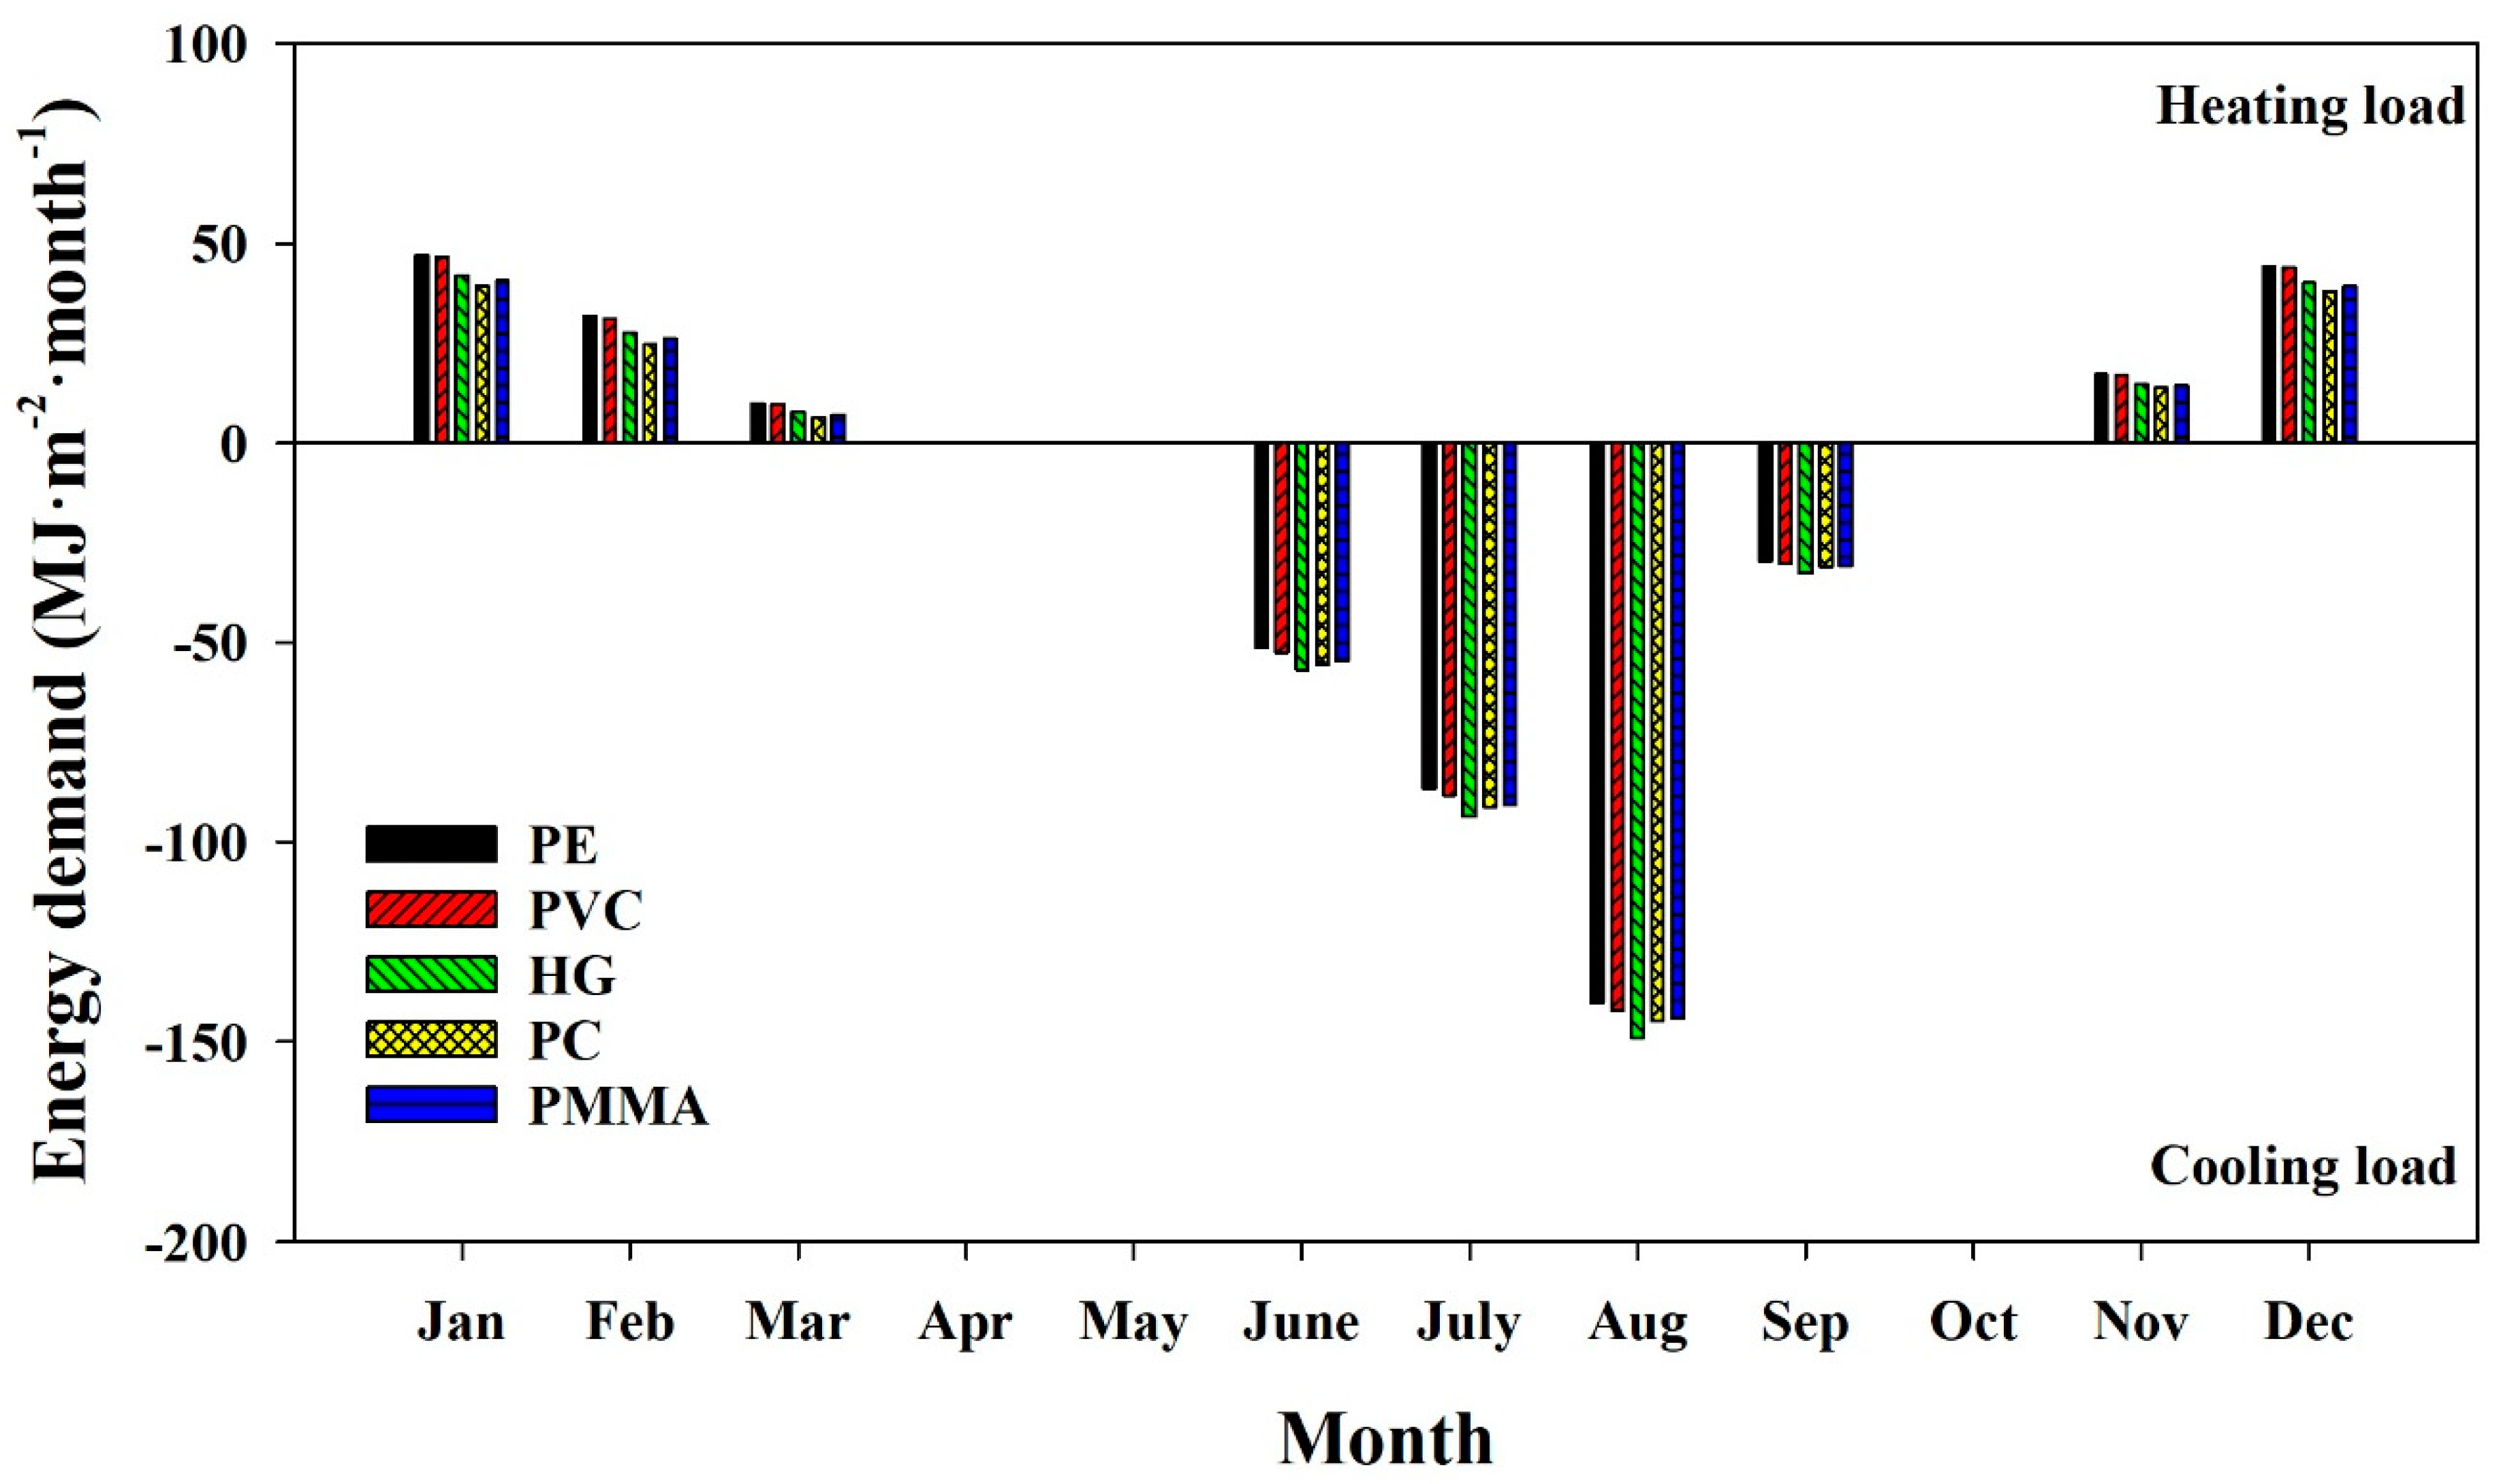
Greenhouse covering material is also an important factor, as there are many covering materials available on the market. It has a direct effect on the solar gain and the energy requirement of the greenhouse, and choosing the most appropriate one according to crop needs can help in minimizing energy costs [15]. Figure 11 shows the monthly heating and cooling demand of the most commonly used greenhouse covers including, PE, PVC, HG, PC, PMMA. All the conditions were same as in the previous analysis and only side walls were replaced with different covering materials. A comparison was made of the estimated energy demand for all of them. The PC-16 mm material gave the smallest heating demand of, 20%, 19%, 7%, 4% during the heating months (Jan, Feb, Mar, Nov, Dec) than the other materials.. Furthermore, PE gave the smallest cooling demand of 2%, 7%, 5%, 4%, lower than the others during summer months (June, July, August, September).
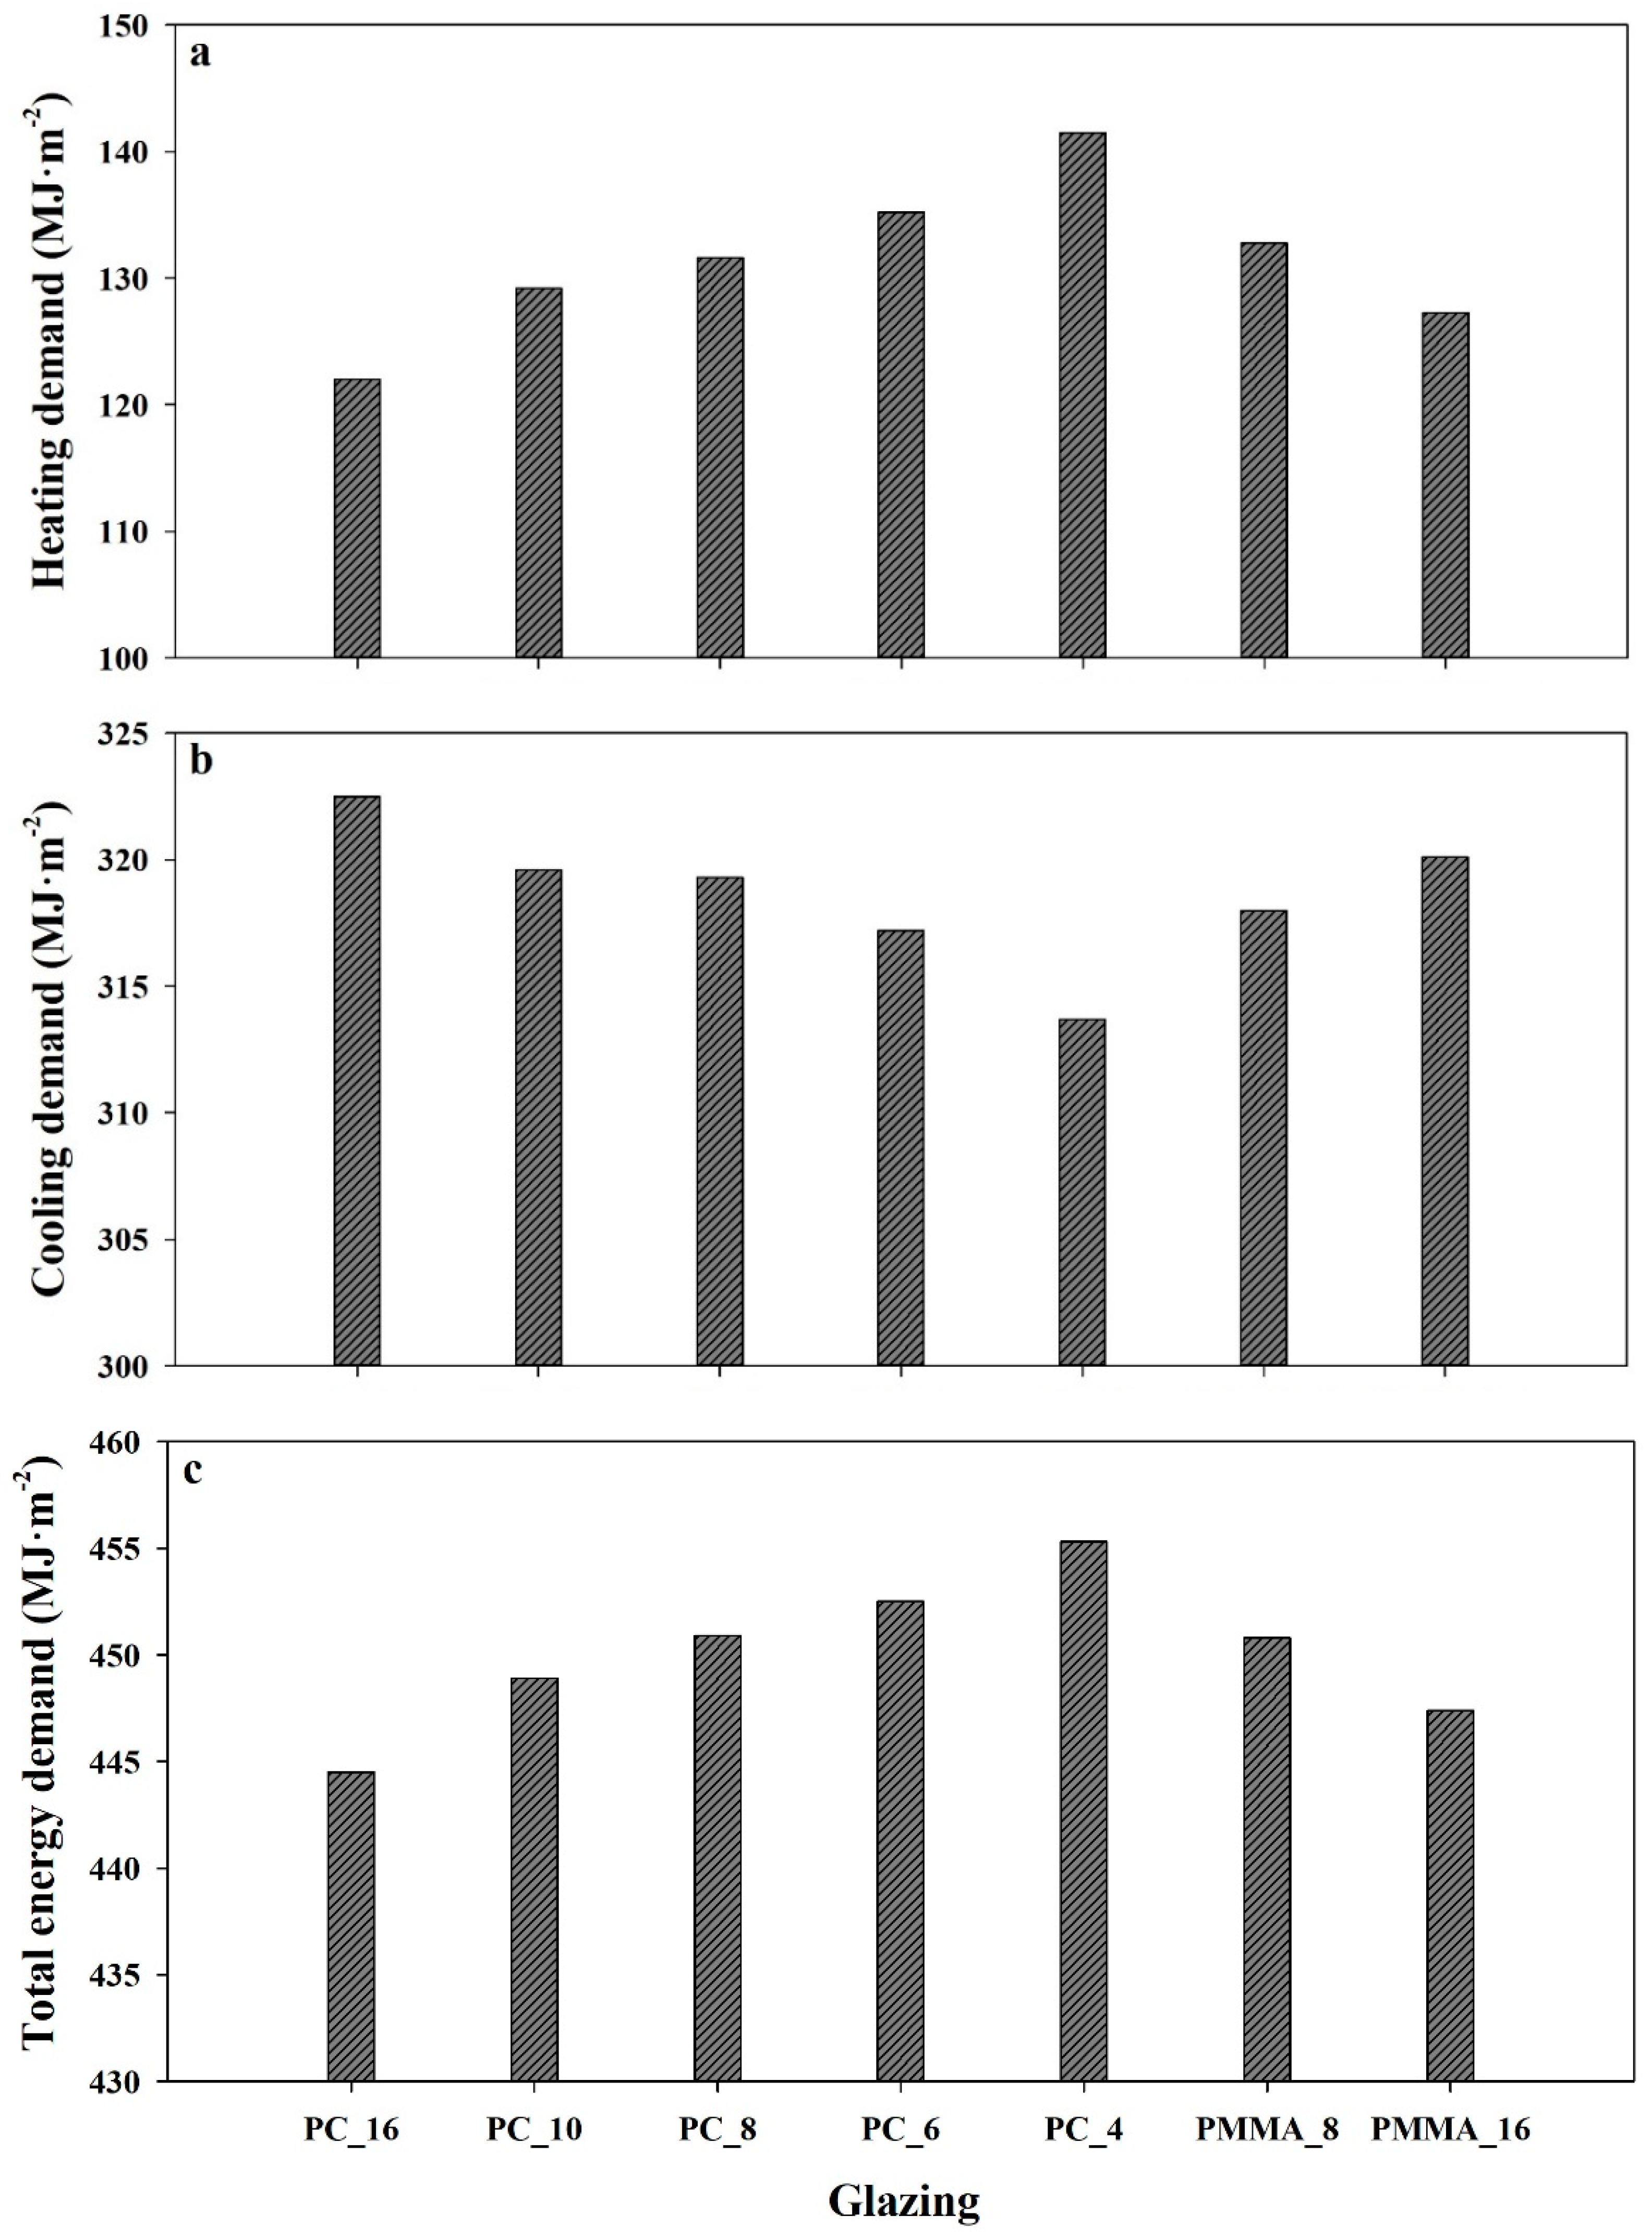
Further analyses were carried out for the investigation of the effect of side wall multi-glazing on heating and cooling energy demand for the multi-span greenhouse. The triple-, double-glazing materials PC, and PMMA with different thicknesses available on the South Korean market were evaluated. Figure 12 depicts the results for triple-layered PC-16, and double-layered PC (10, 8, 6, 4 mm), and PMMA (16, 10 mm) thickness. Each sheet of material was 0.8 mm thick, and hence the total thickness depends on the air gap between two sheets. The results in Figure 12a showed that the smallest heating demand is for the PC-16 mm material, and that the heating demand increased significantly for lower thicknesses. This is due to the fact that a thicker material serves better in preventing heat loss. Moreover, PC-16 mm gave 4% less heating demand than PMMA-16 mm. In Figure 12b, the cooling demand trend is the inverse of the heating demand and the lower thickness of PC-4 mm showed the smallest cooling demand. This is due to the fact that a higher thickness will resist heat loss to the ambient weather, thereby causing the internal temperature of the greenhouse to increase more than with the thinner material. Consequently, the cooling demand is increased. Figure 12c shows the total annual energy demand including heating and cooling for all the selected double glazing. The PC-16 mm material is more energy efficient than the double-glazed material.
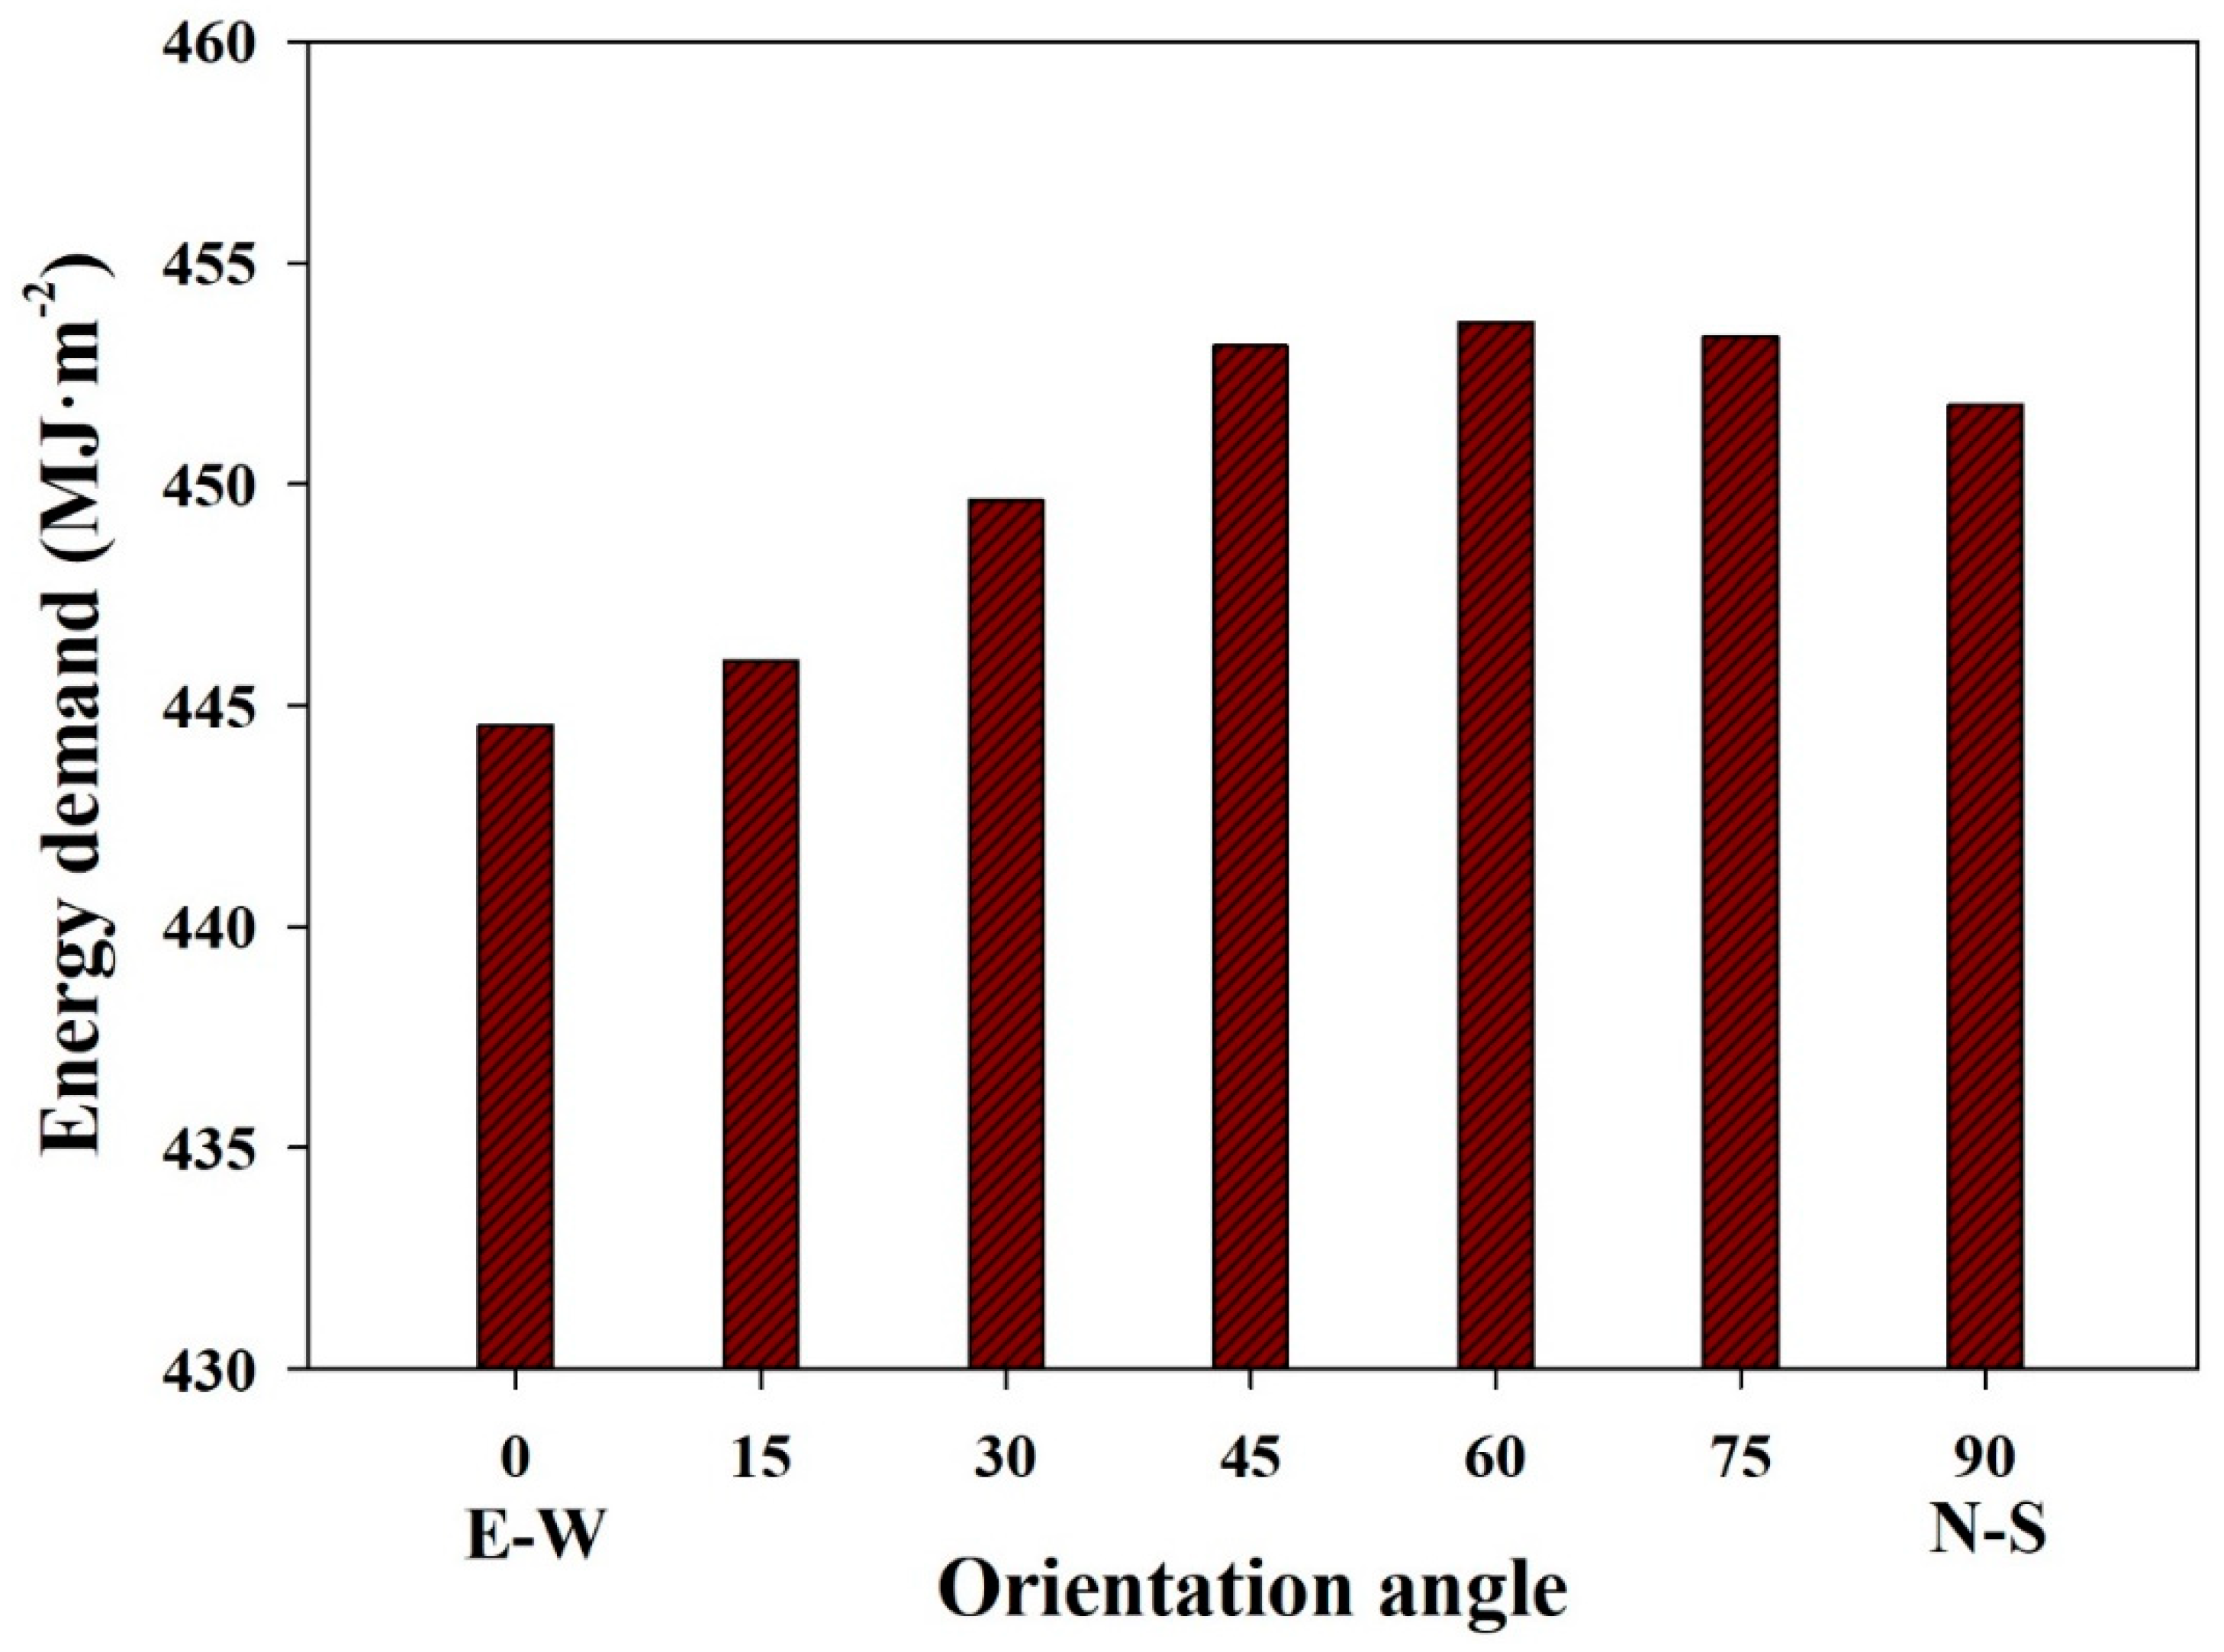
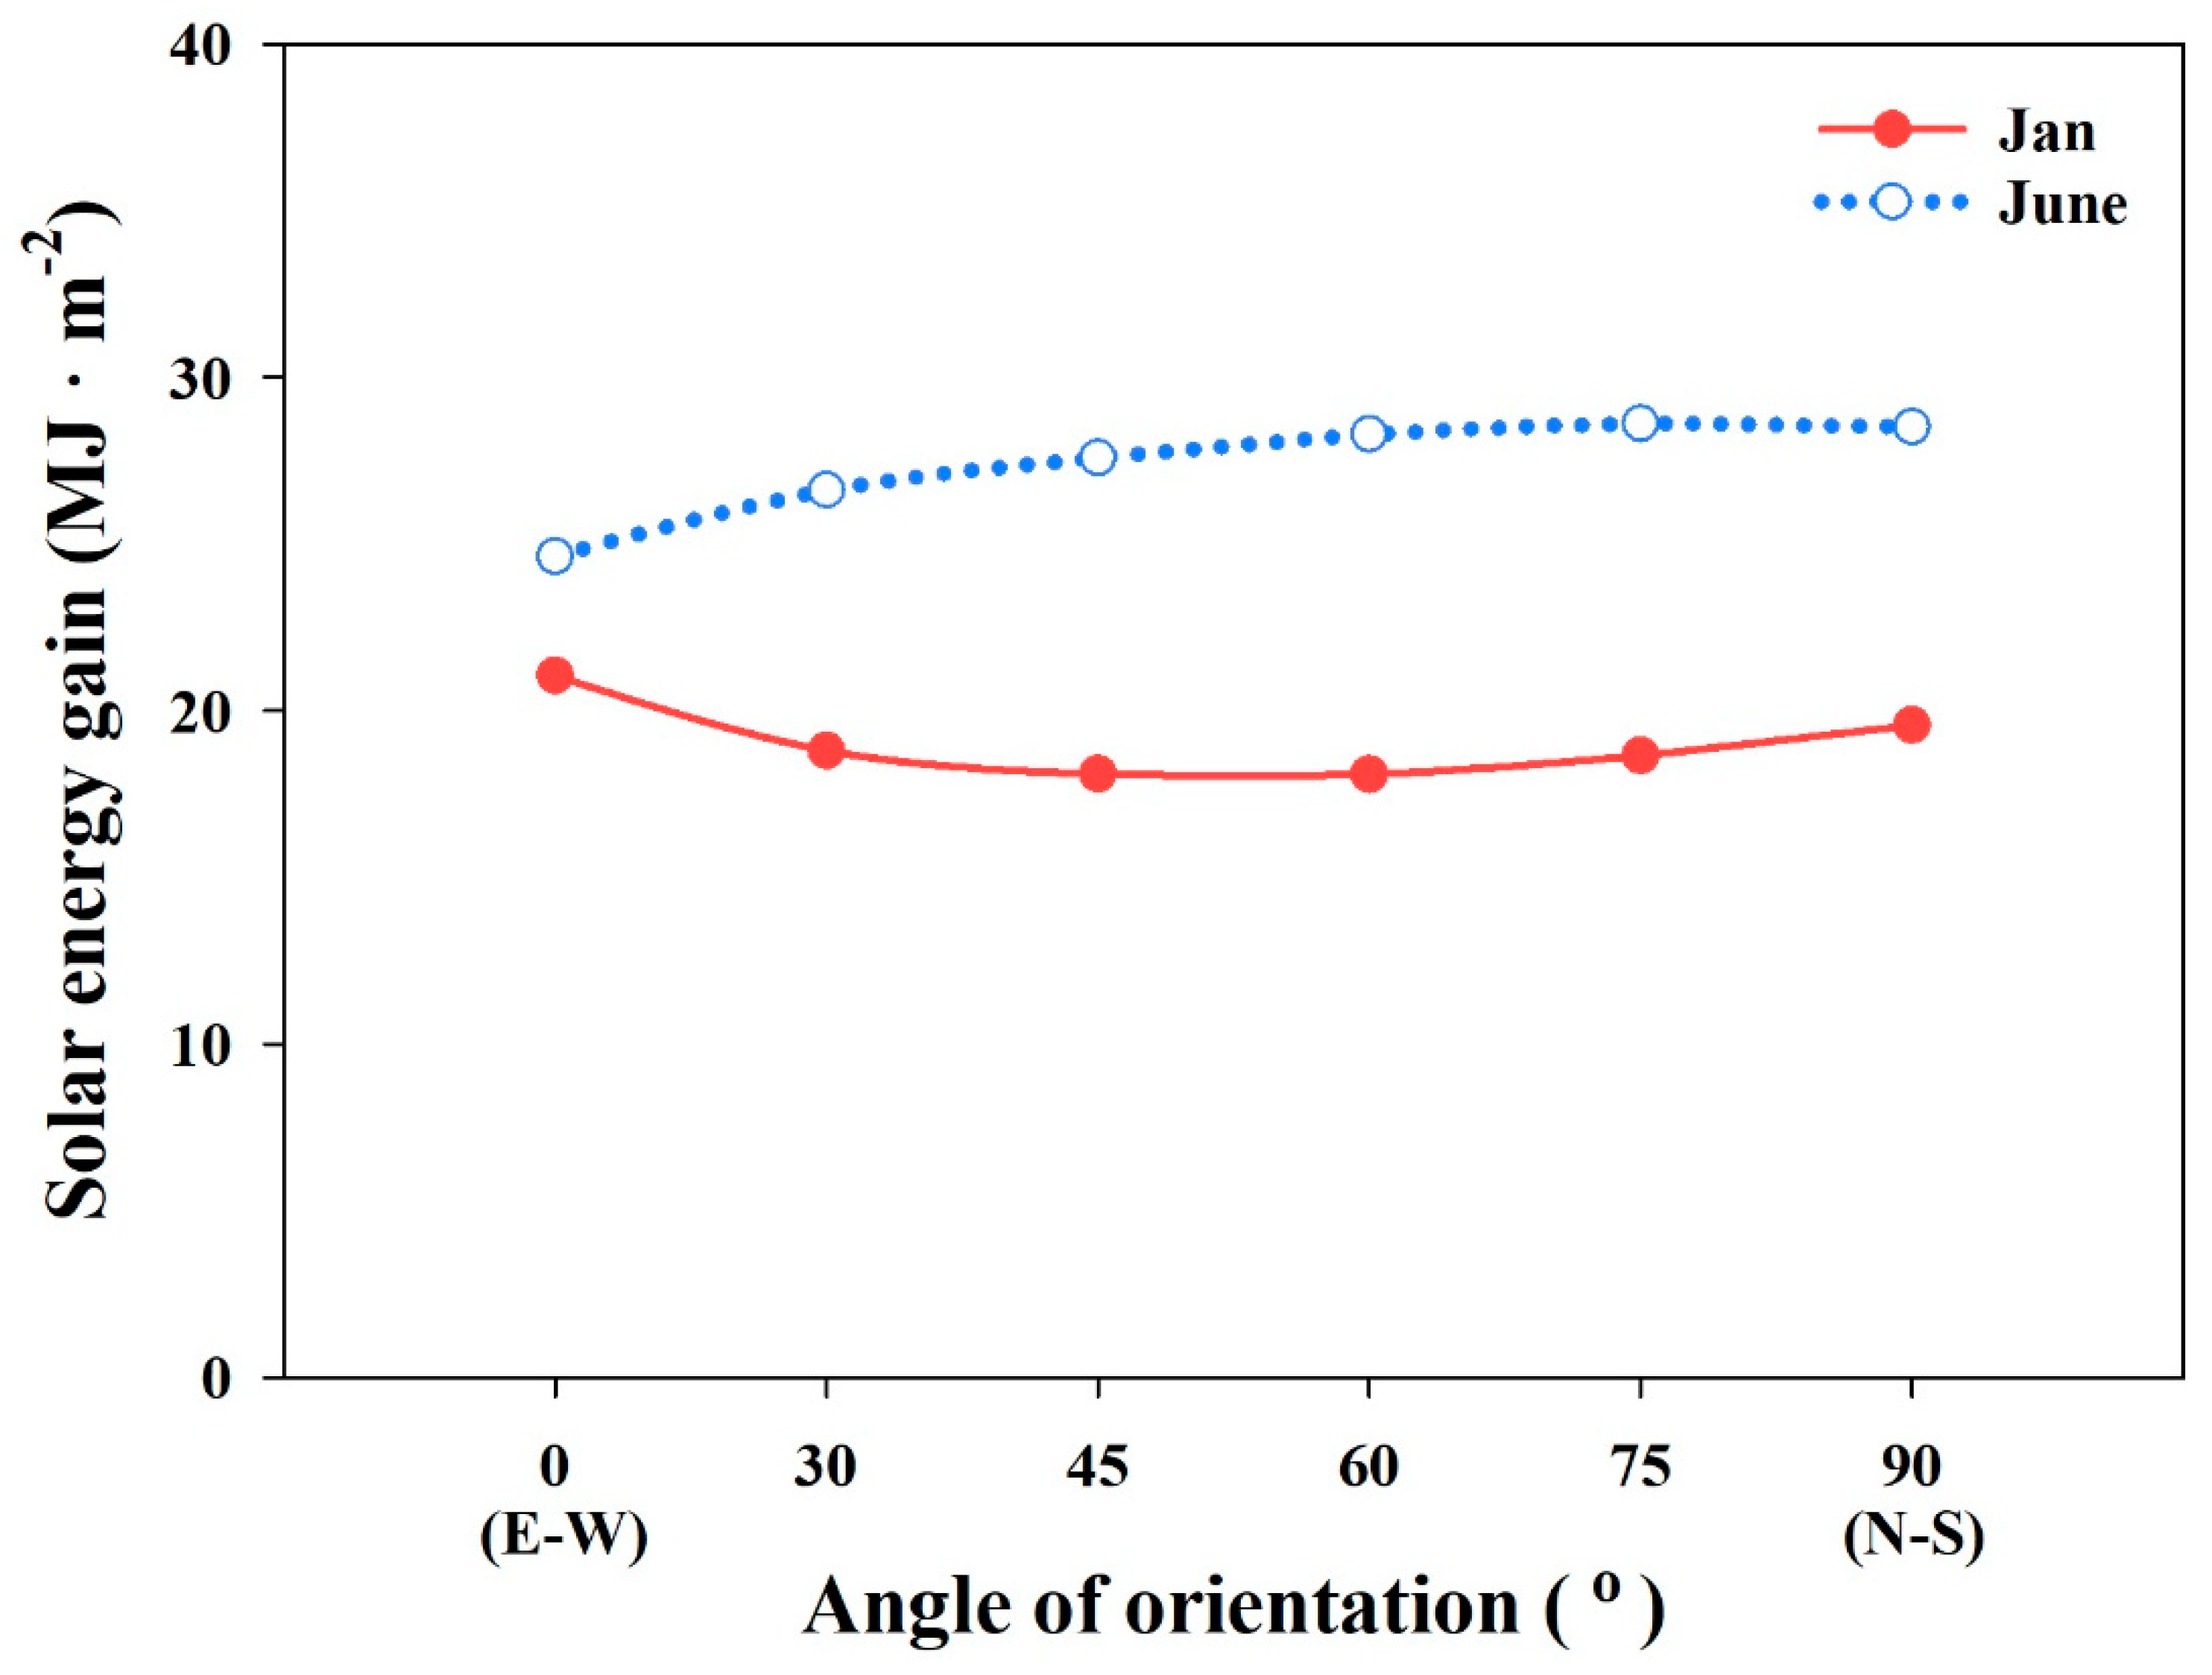
Greenhouse orientation has a significant effect on passive energy saving techniques. The effect of different greenhouse orientations was studied with the physical operating conditions described in Table 5. The total annual energy demand, including heating and cooling, was estimated for each orientation and the results are shown in Figure 13. The results indicate that the E–W orientation has the smallest annual energy requirement. This is due to the fact that, in winter, the E–W orientation receives more solar radiation than the other orientations, and the reverse happens in summer. Figure 14 shows the average daily solar energy gain inside the greenhouse during January (winter) and June (summer). The result indicates that, in January, the average daily solar gain of the E–W (0°) orientation was 11%, 14%, 15%, 12%, and 7% higher than the 15°, 30°, 45°, 60°, 75°, and 90° (N–S) orientations, respectively. Moreover, during June, the E–W (0°) orientation received 7%, 11%, 13%, 15%, and 15% less average solar gain than that of the 15°, 30°, 45°, 60°, 75°, and 90° (N–S) orientations, respectively. A similar study conducted for energy efficient design of a multi-span greenhouse also confirmed this trend [1].
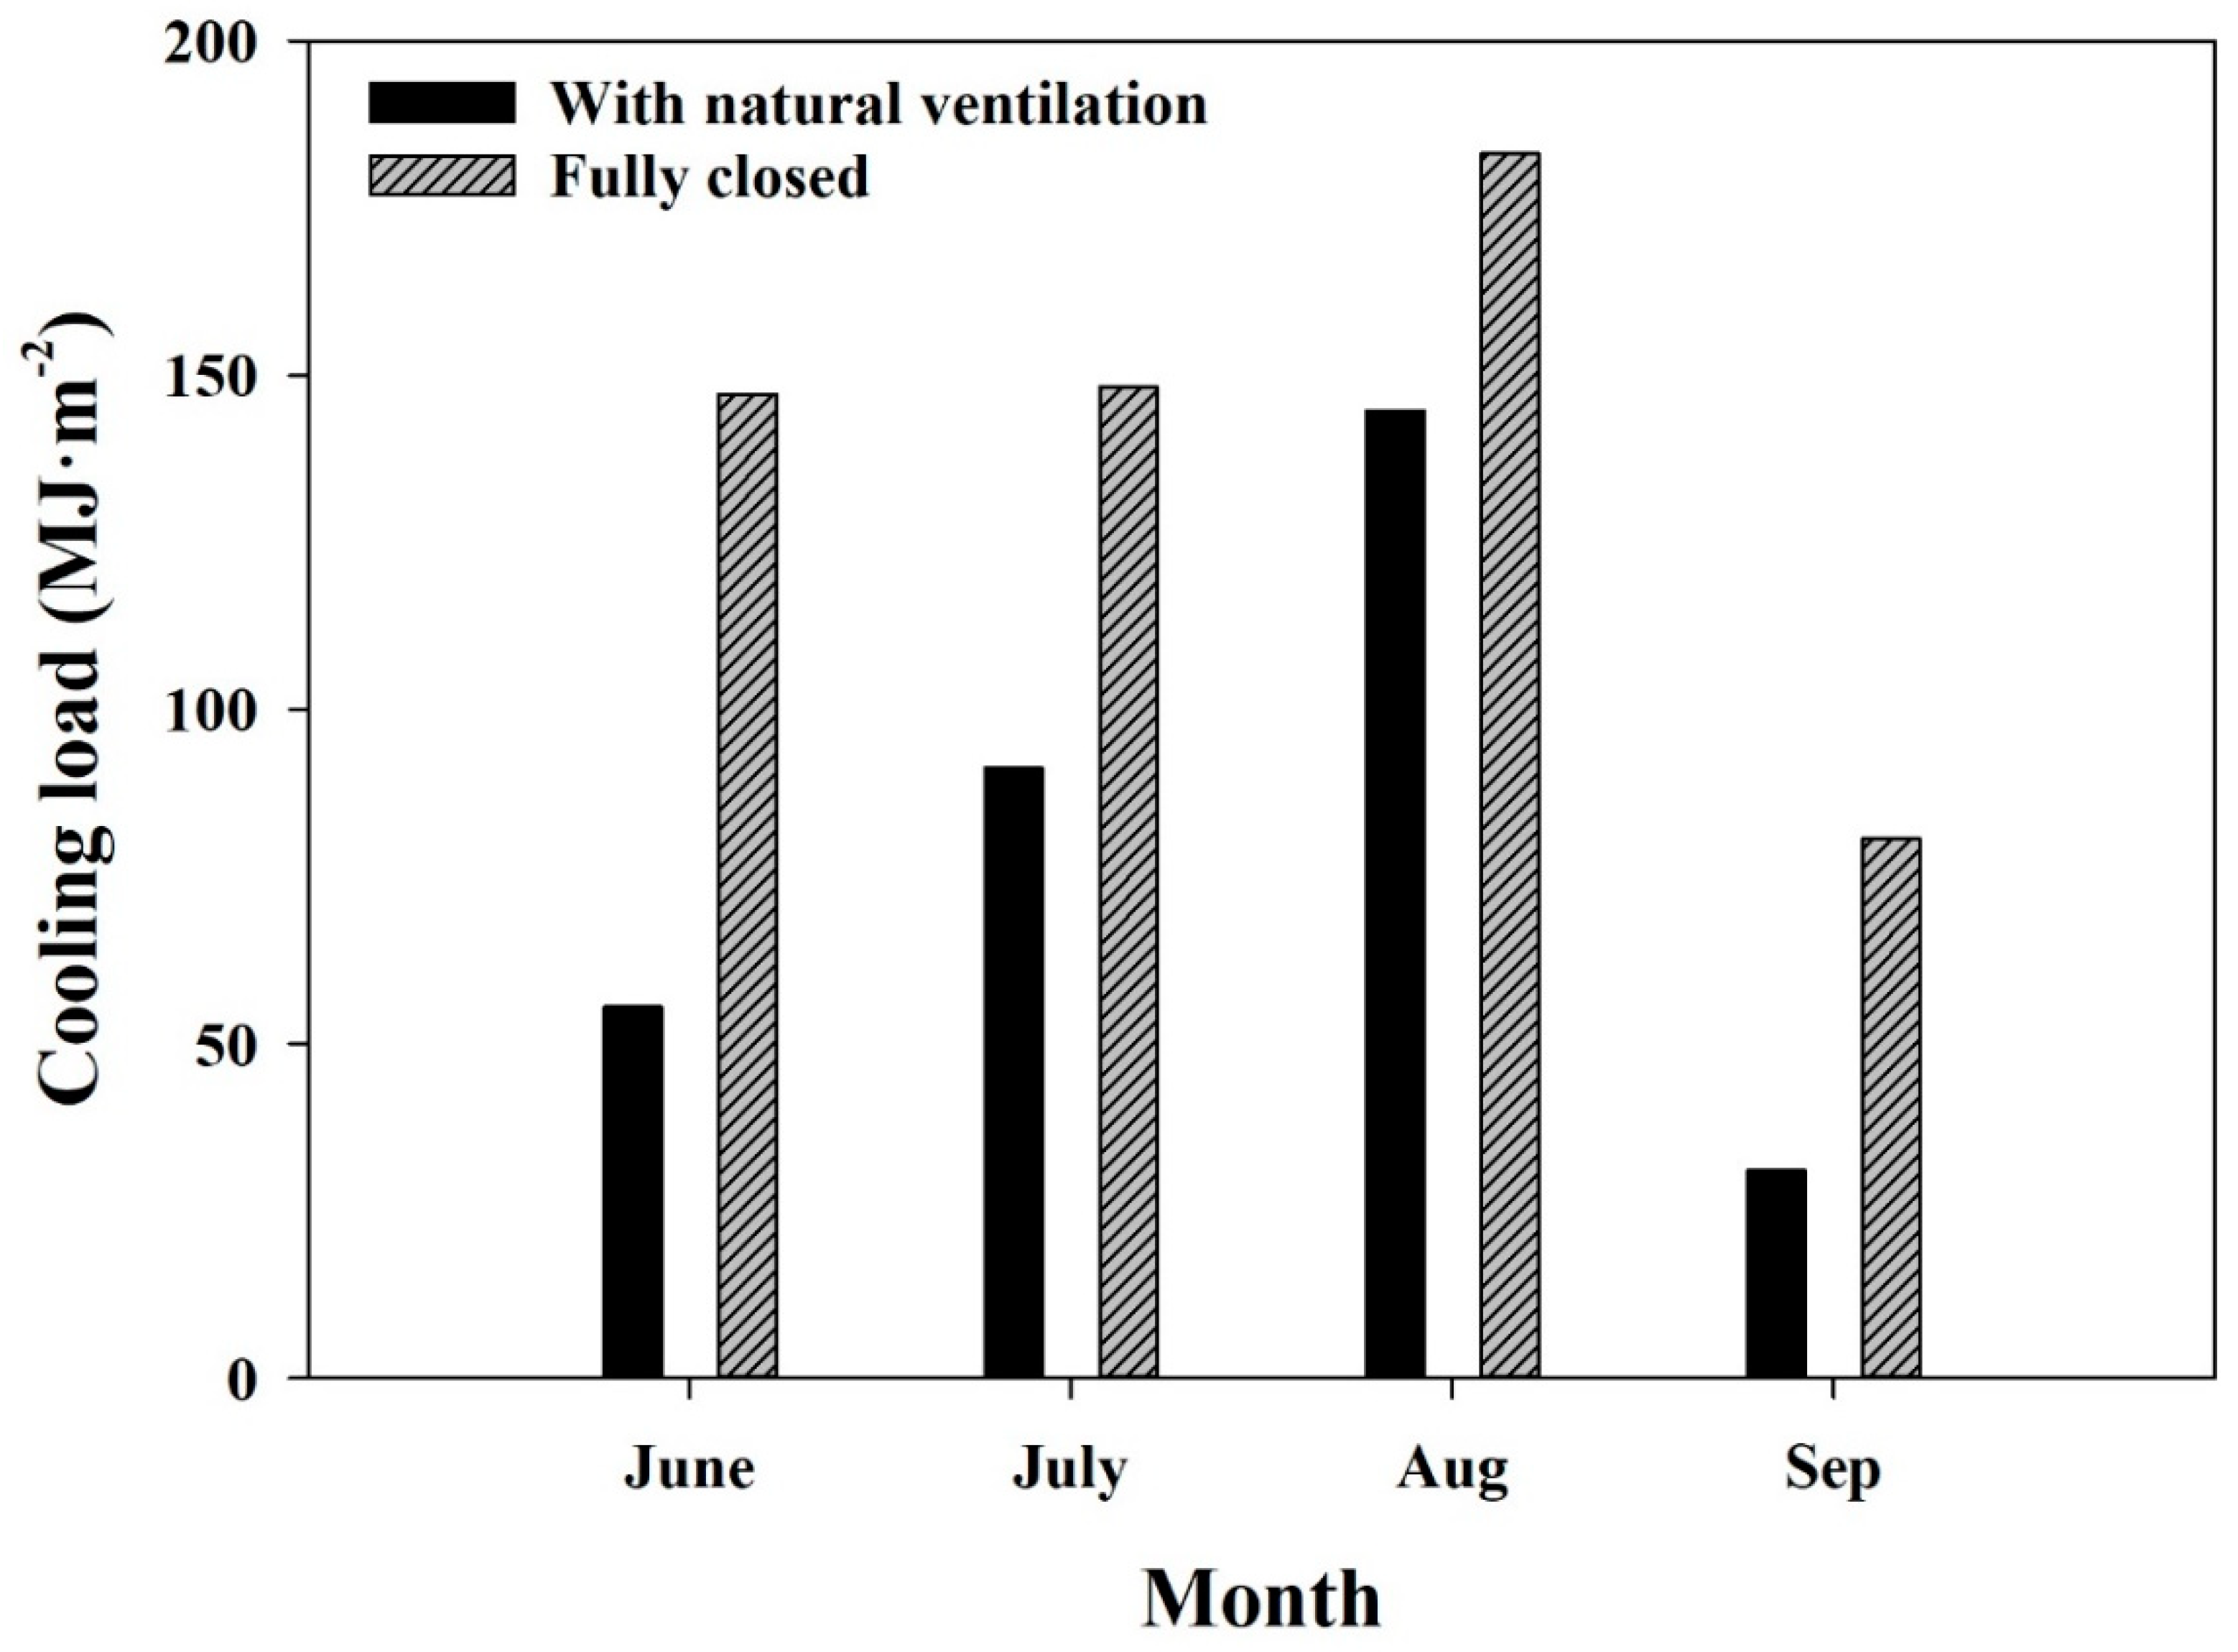
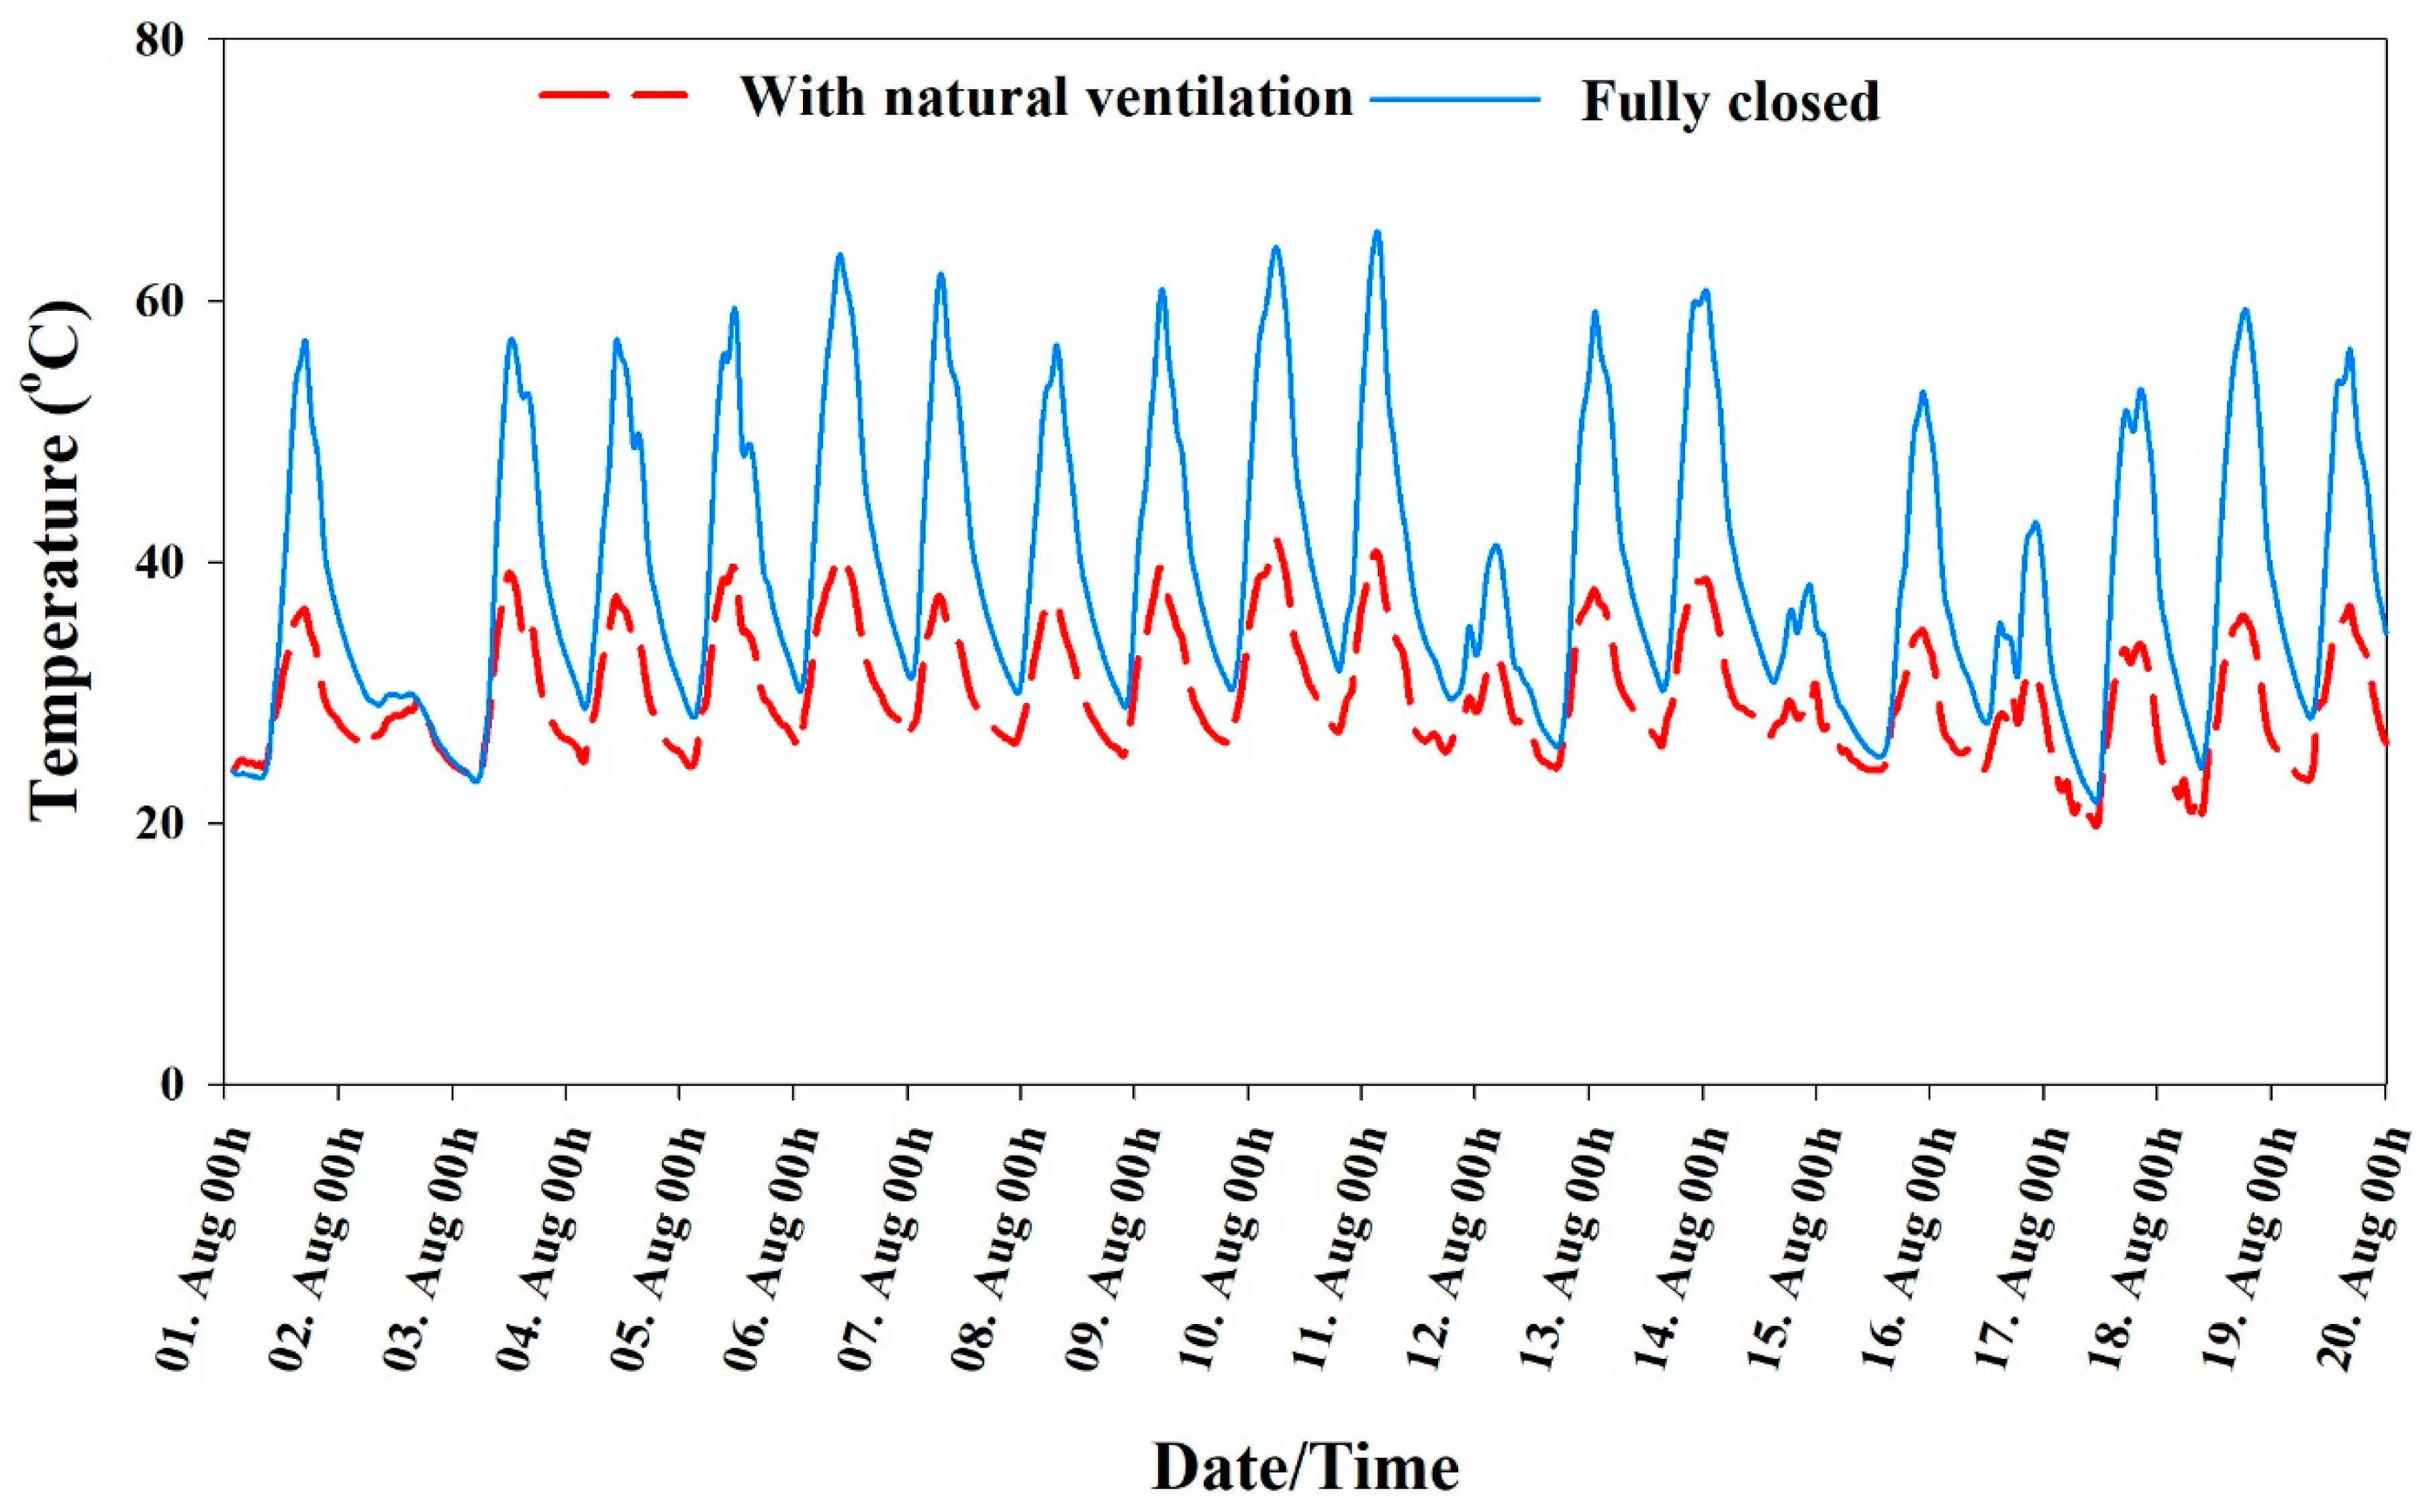
Natural ventilation is widely used to decrease the internal temperature of greenhouses, especially in the summer. In this study, we evaluated the effect of natural ventilation on the cooling demand of the multi-span greenhouse. We estimated a monthly cooling demand of a fully closed and naturally ventilated greenhouse and the results are shown in Figure 15. Again, all physical and operating conditions are same ones presented in Table 5. The results indicate a 50% reduction in cooling demand during the whole summer season using natural ventilation combined with cooling. Figure 16 shows the internal temperature of the greenhouse with natural ventilation and a fully-closed condition. It can be seen that in the fully-closed condition with no ventilation, the greenhouse’s internal temperature increases to 60 °C. However, with natural ventilation, it reduces to 40 °C, which causes a reduction in the cooling demand in the natural ventilation condition. The TRNSYS model successfully described the natural ventilation effect combined with a greenhouse thermal model.
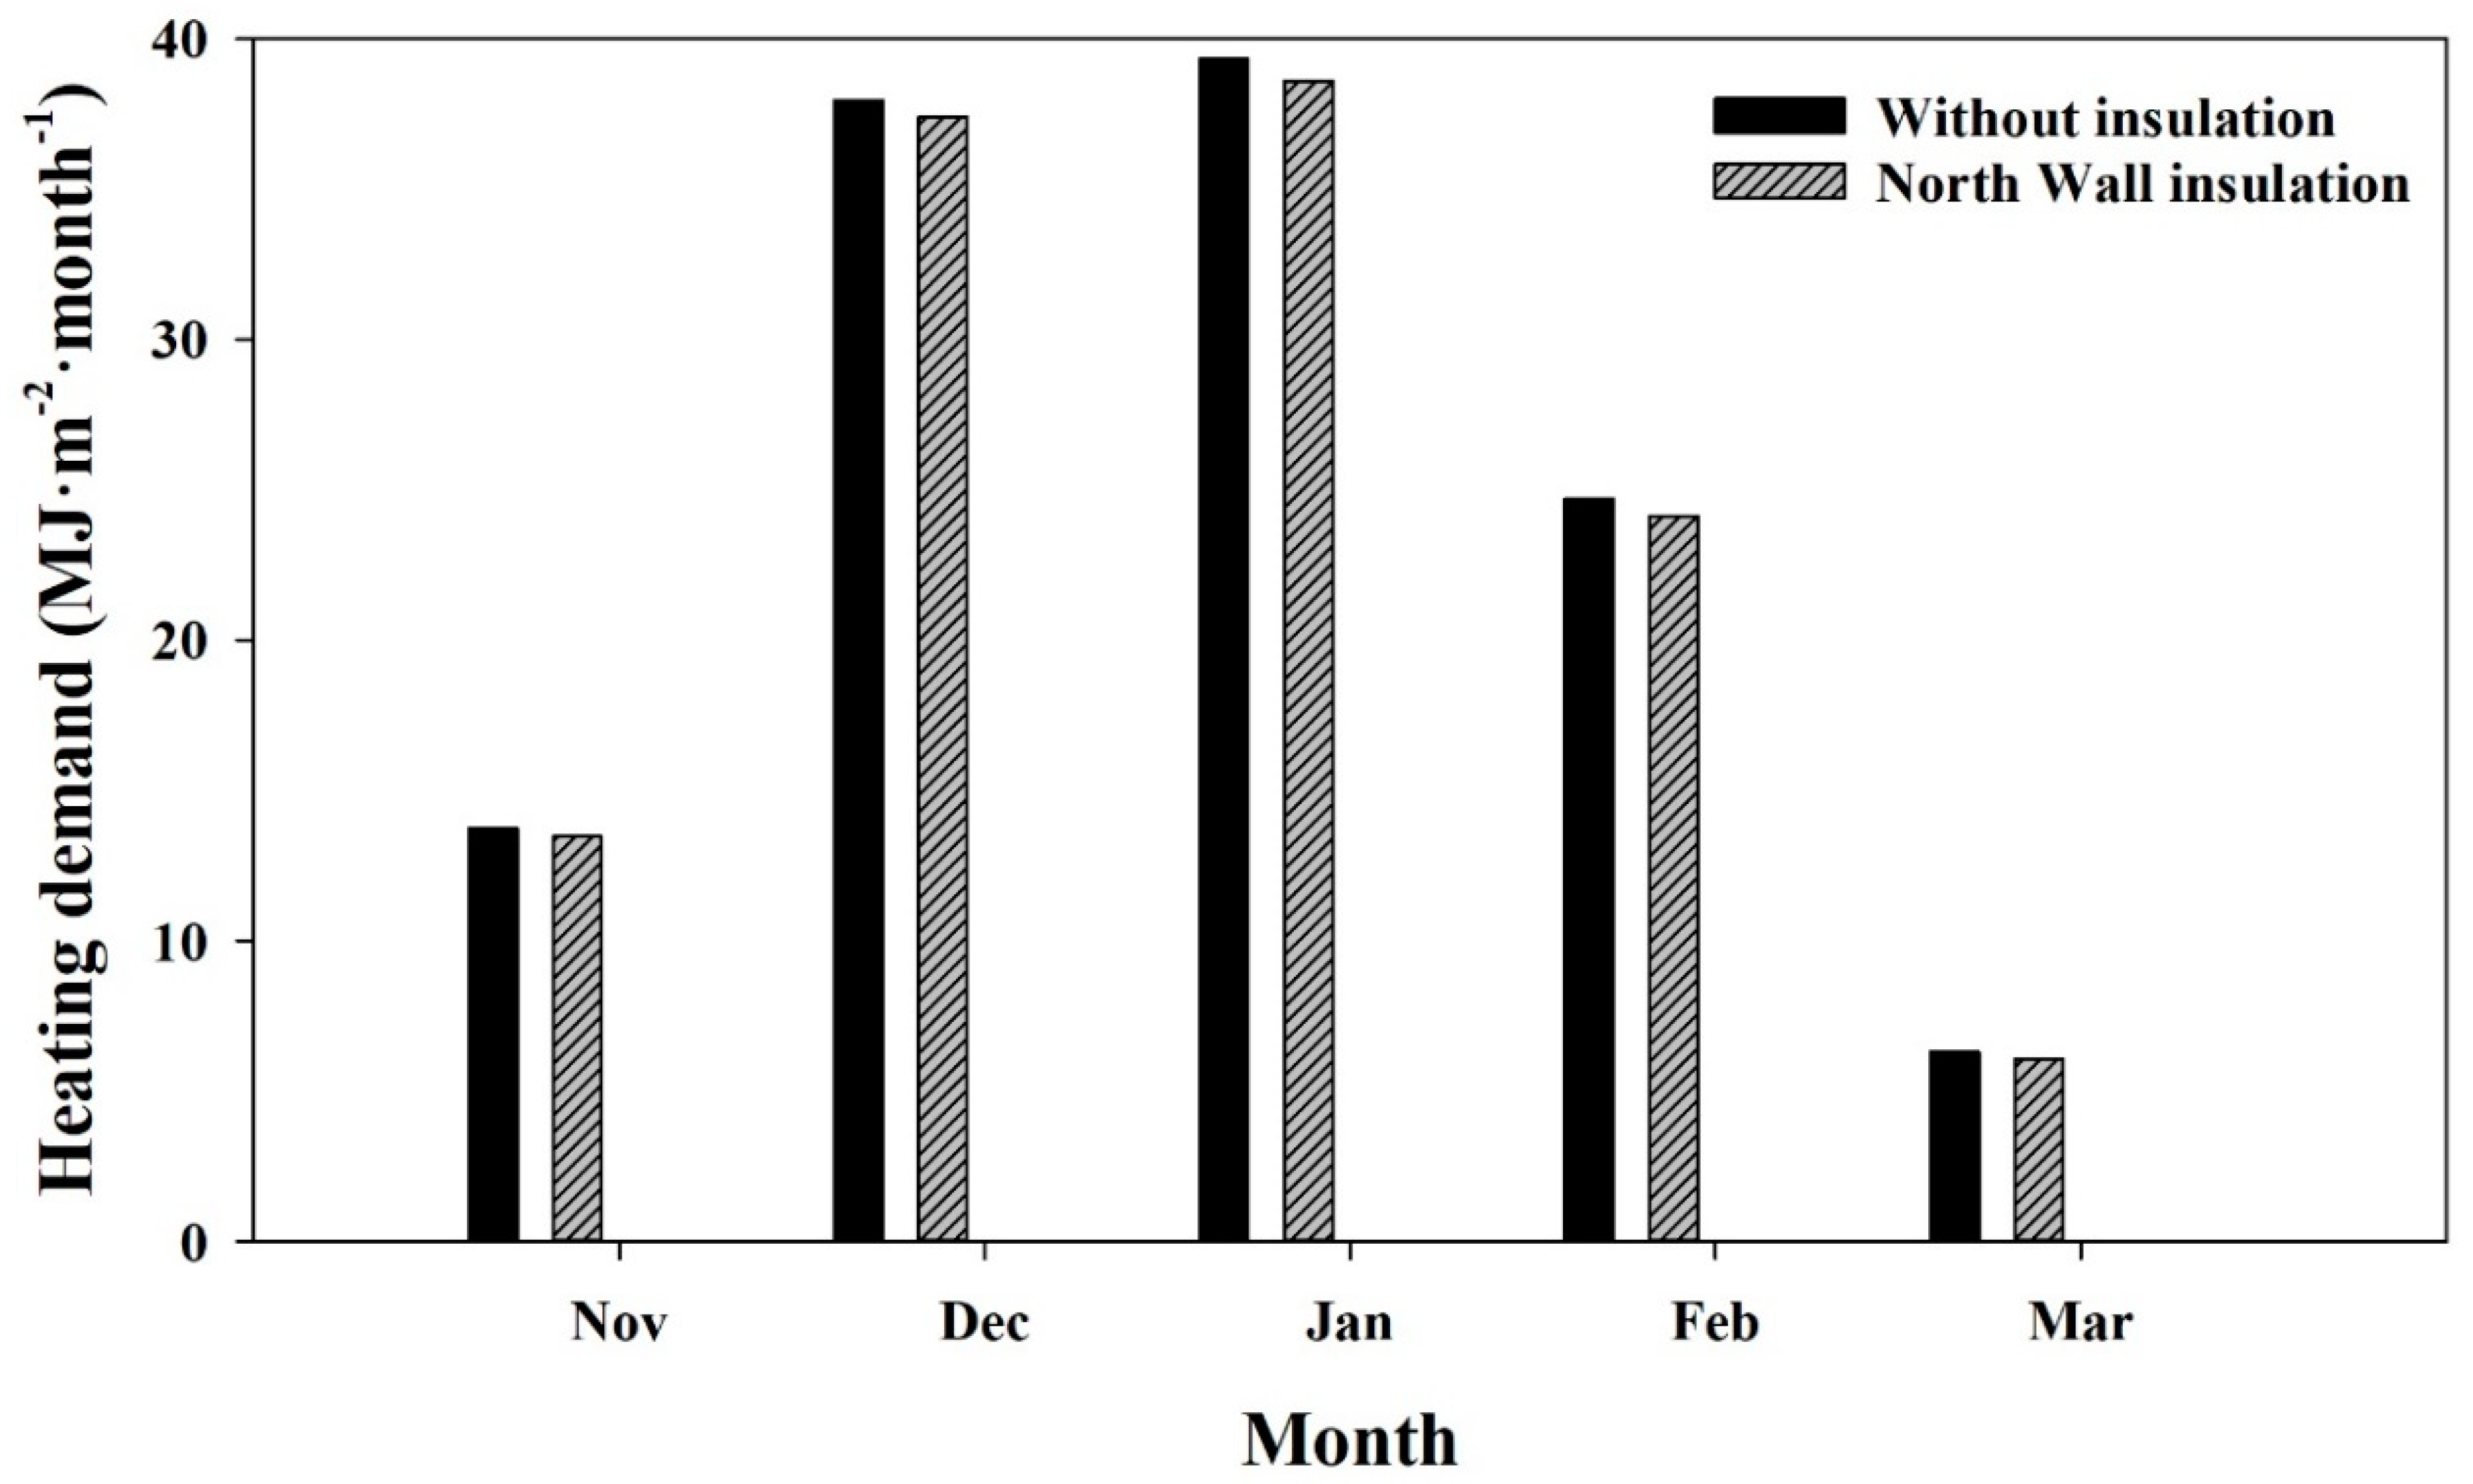
In the northern hemisphere, the sun stays at the south side and north wall of the greenhouse and contributes less to the solar heat gain inside the greenhouse. Other studies reported that the use of an opaque north wall can reduce 25–30% of the heating requirement in winter when compared to using a transparent north wall during the daytime. Therefore, it is recommended that insulation should be used on the north wall of the greenhouse to reduce heat loss, especially in colder regions during winter [4,37]. Commonly, multi-layered thermal screens are used for north wall insulation in South Korea. To simulate the specific insulation, we need to have the physical, optical and thermal properties of that material as described in Table 3. Due to lack of availability of these properties, for this specific reason (to show the model’s capability) the available Ph-77 material was used as north wall insulation. Figure 17 shows the comparison between the heating demand of the multi-span greenhouse with north wall insulation and without insulation (transparent wall). The conditions are the same as those in aforementioned analyses. The overall results indicate that a 5% reduction in heating demand during the whole winter season was achieved using north wall insulation. The reduction of the heating demand purely depends on the material used for the north wall. Moreover, the specific energy saving is different as location and available solar radiation are different and the insulation material can also affect energy savings. Other similar studies for greenhouse design parameters, conducted by Gupta and Chandra [7], and Ahamed et al. [4], also confirmed this trend.
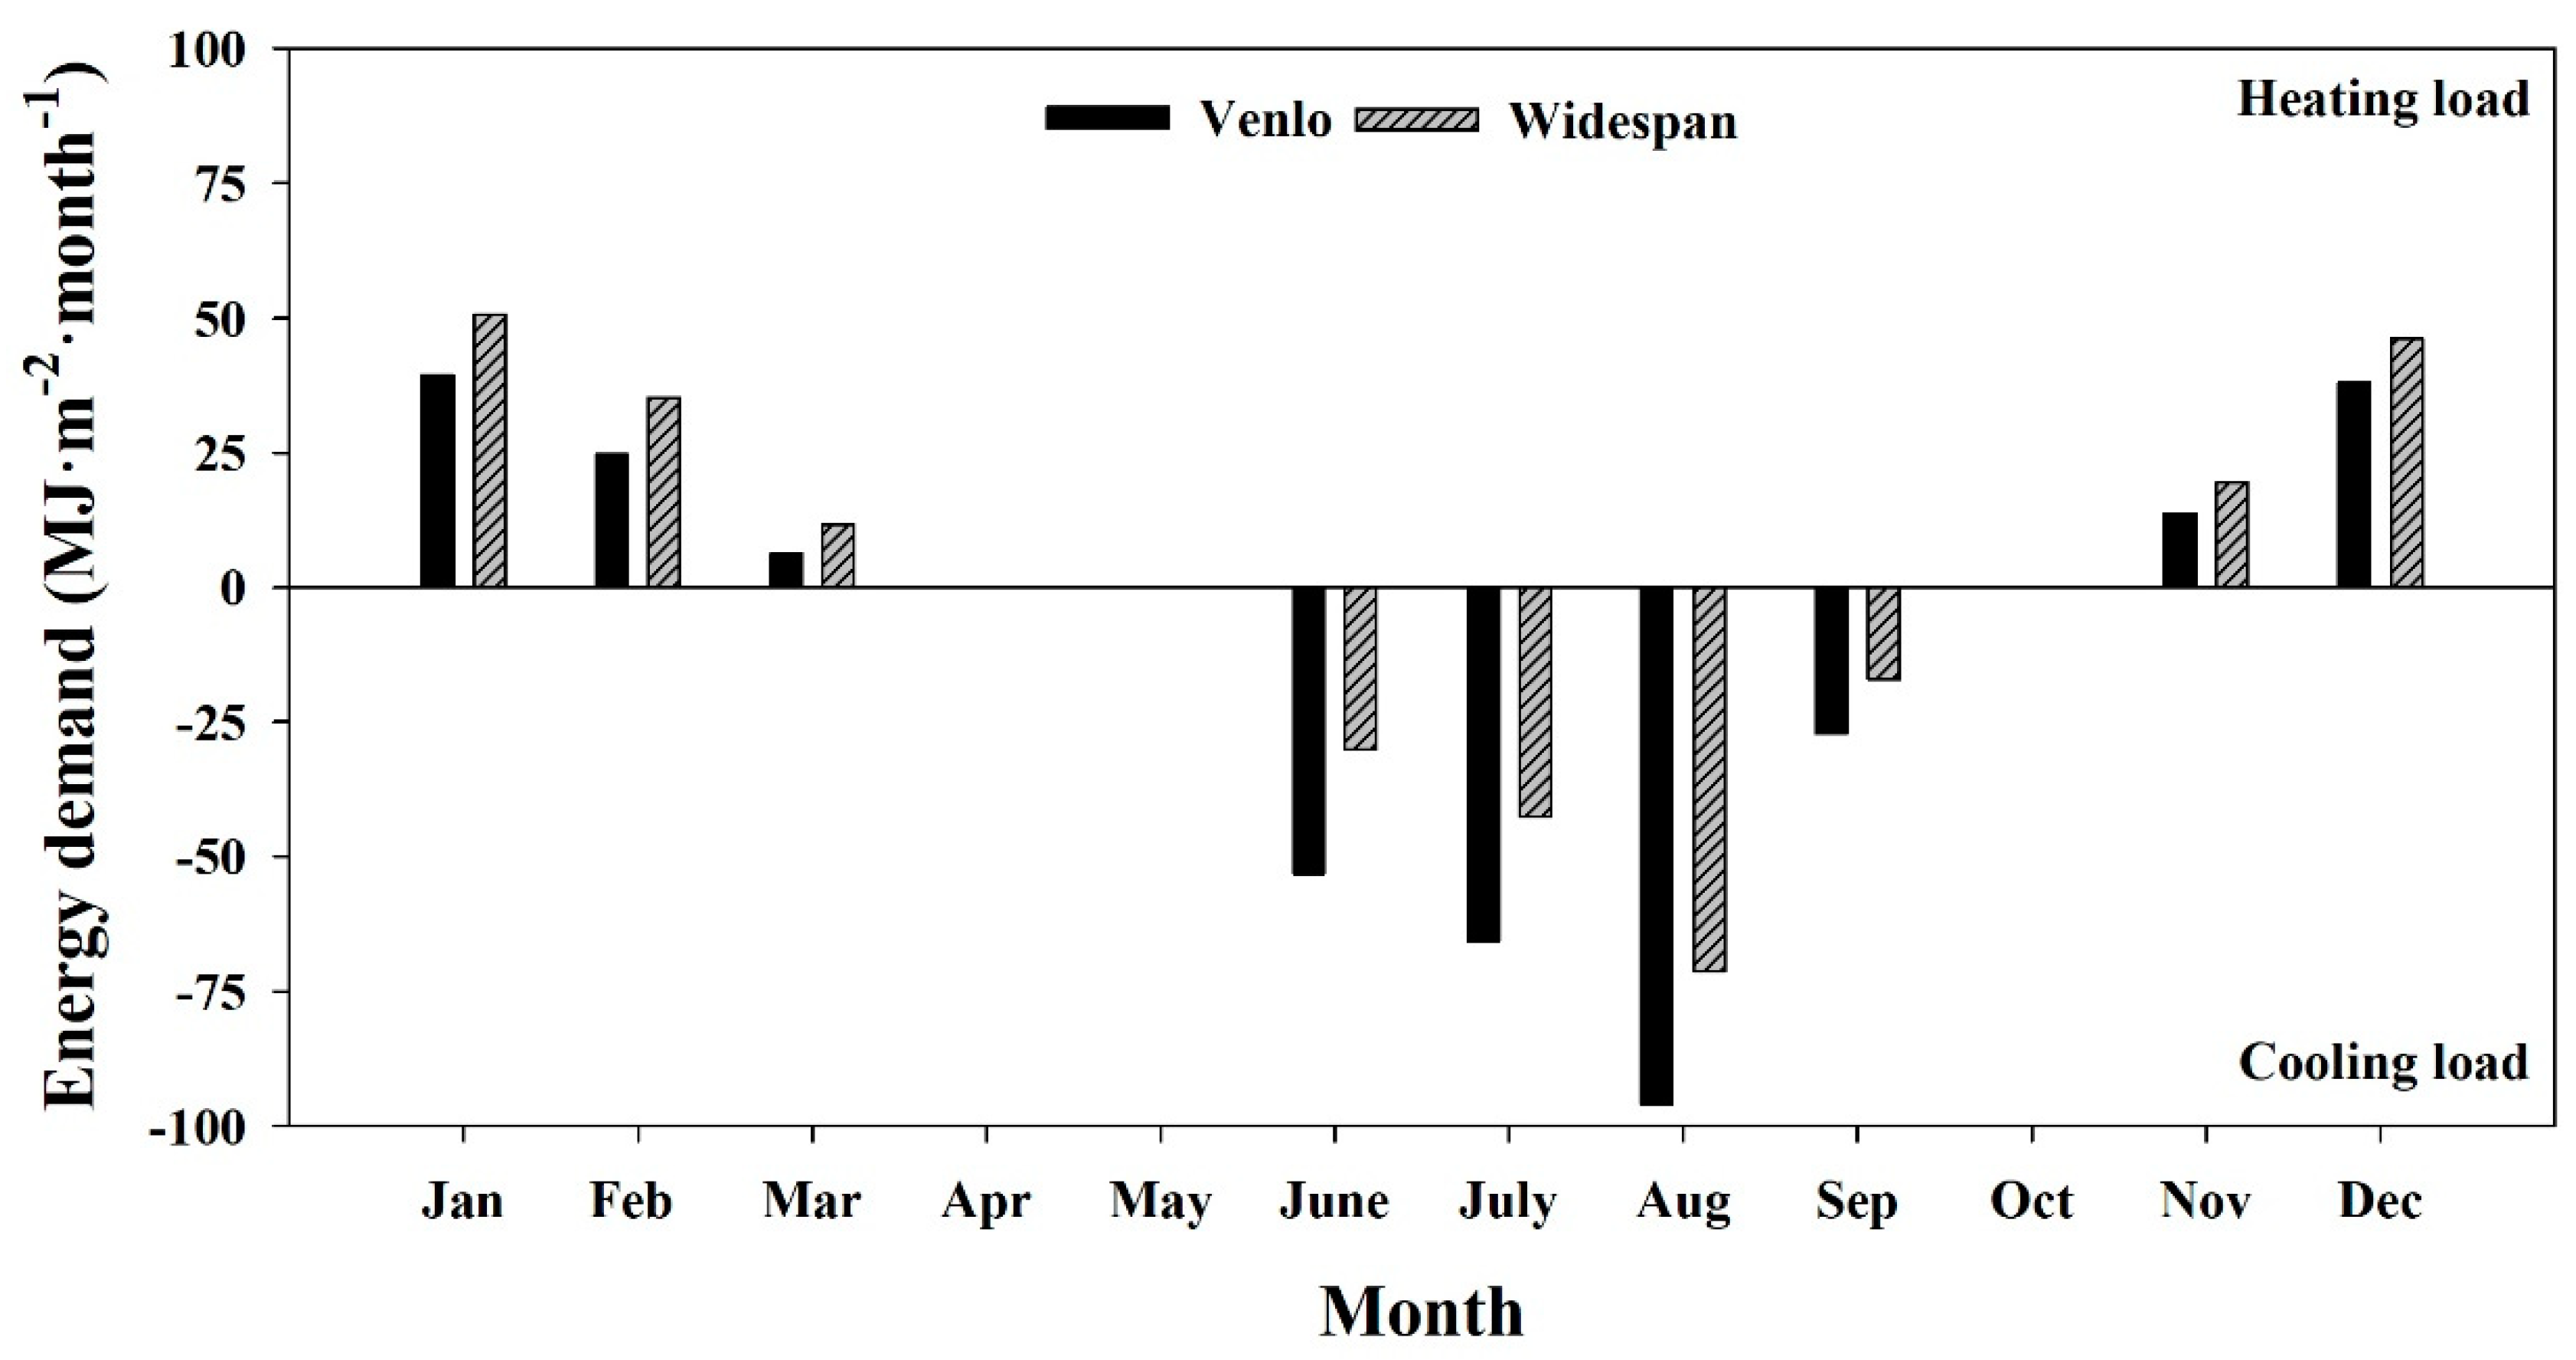
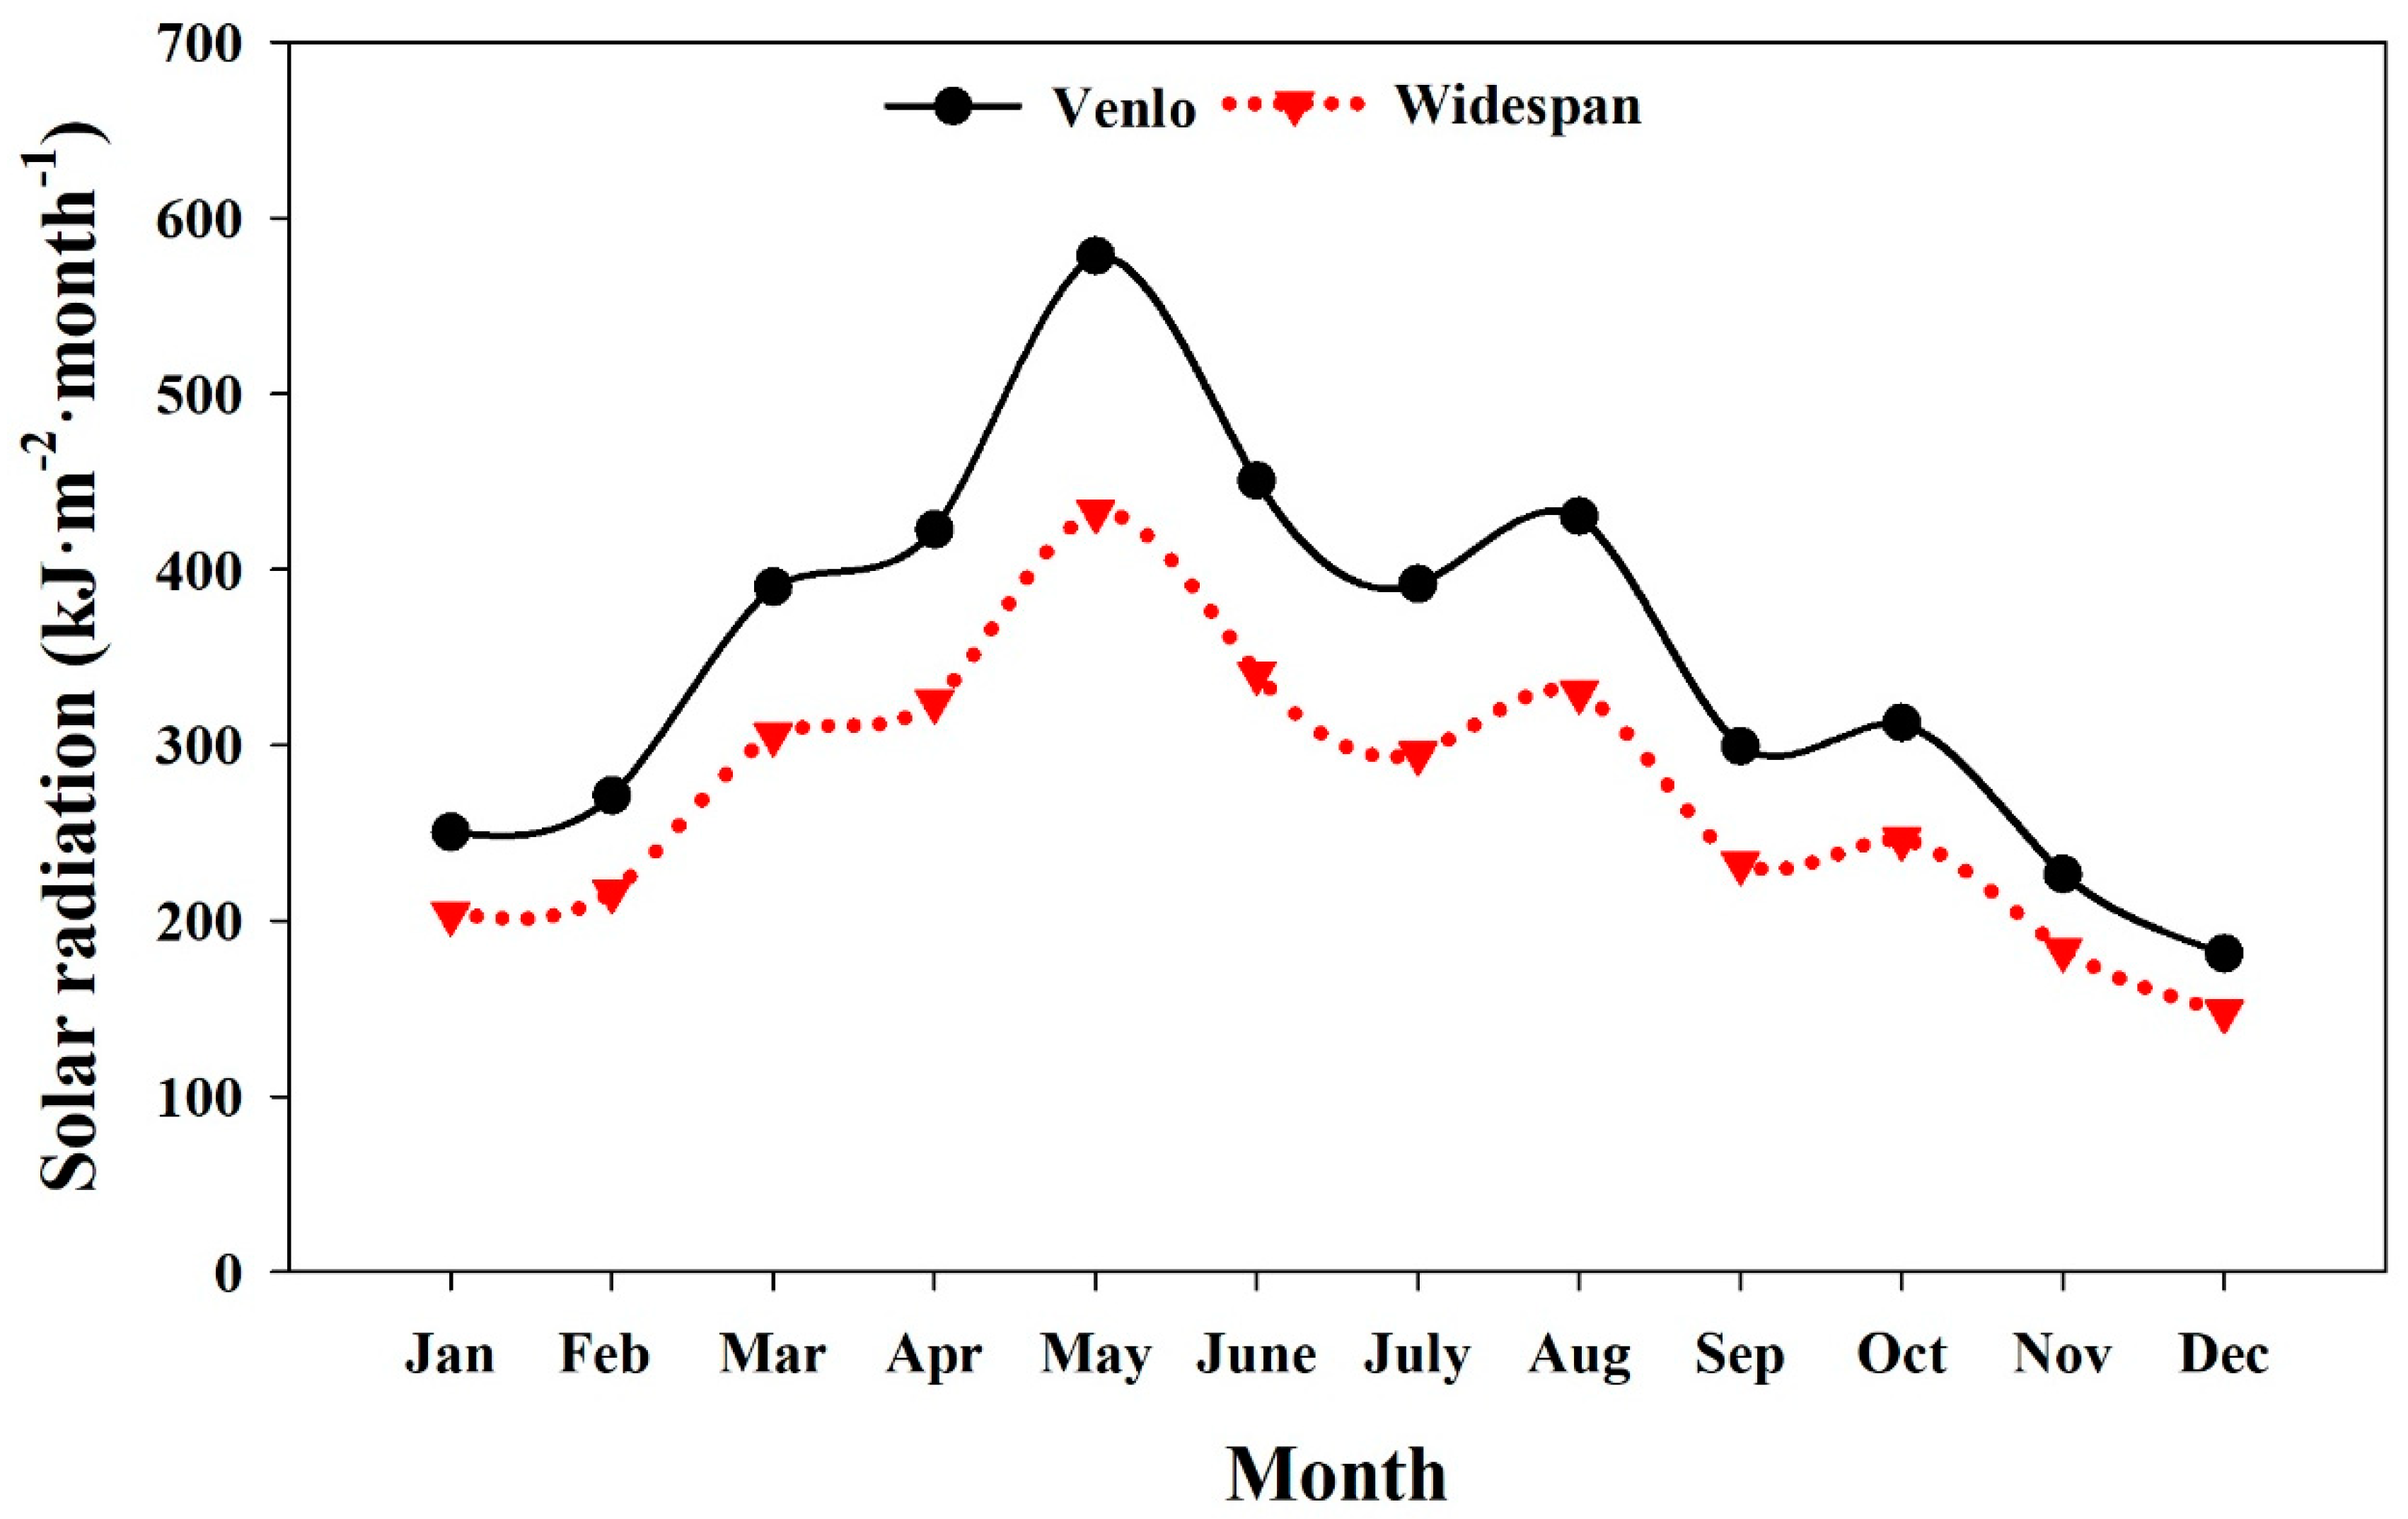
Greenhouse roof geometry has a huge influence on the annual energy demand of the greenhouse, as solar radiation received by the greenhouse influences its internal temperature [12]. Two multi-span greenhouse roof geometries (venlo and wide-span) were selected in order to compare their annual energy demands. The designs were selected according to South Korean standards for multi-span greenhouses. The results of both greenhouses’ annual energy demand are shown in the Figure 18. The results indicate that during the winter season the venlo type greenhouse requires 25% less heating energy than the wide-span. In contrast, during the cooling season, the wide-span greenhouse requires 35% less cooling energy than the venlo type. This is due to the fact that the solar energy gain of the greenhouse with the wide-span roof geometry is less than that of the venlo type greenhouse. Figure 19 shows the monthly solar energy gain of both greenhouses. The venlo type greenhouse received more solar energy than that of the wide-span greenhouse. The solar gain inside the greenhouse was different due to the fact that the wide-span greenhouse has a lower angle of incidence—which causes low transmission—than that of the venlo type greenhouse with high angle of incidence—which causes high transmission. A study was conducted by Ha et al. [17] with the same type of greenhouse but the outcomes of the study show the wide-span greenhouse needs less annual energy than that of venlo type greenhouse. In that study, the greenhouse dimensions were not the same, so comparisons cannot be made. In our study, we used the same greenhouse dimension with but with a different roof geometry as shown in Figure 5.

4. Conclusions

This study proposed a multi-span greenhouse BES model utilizing the TRNSYS 18 program. We detailed the creation and validation of the BES model for multi-span greenhouses to simulate the thermal environment of the greenhouse under different design parameters. The model was used to evaluate the effect of the parameters on the annual energy demand of the greenhouse. The proposed BES model is capable of evaluating the multi-span greenhouse’s design parameters with daily and seasonal dynamic control of thermal and shading screens, natural ventilation, as well as heating and cooling set-points. The TRNSYS 18 program shows a high level of flexibility to carry out simulations under local weather conditions and can handle user-defined design and control of the greenhouse. The statistical analysis of the validated results encourages the adoption of the proposed model when the underlaying aim is to evaluate the multi-span greenhouse design parameters under local weather conditions and specific needs. The main findings of the study are as follows:
1-
In winter, it is best use to three layers of thermal screens, as the analysis showed a 70% and 40% heat energy reduction compared with single and double layers of thermal screens. Moreover, the use of a shading screen in summer can reduce cooling energy demand by up to 25%.
2-
The maximum heating loads of a multi-span greenhouse with conditions of without thermal screen, one screen, two screens, and three screens, were 0.65, 0.46, 0.41, and 0.344 MJ·h−1·m−2, respectively. Moreover, the maximum cooling loads without and with shading screen were, 1.5, and 1.18 MJ·h−1·m−2, respectively.
3-
The Ph-77 thermal screen combined with Ph-super is more energy efficient and reduces heating energy demand during winter.
4-
The PC-16mm showed the smallest heating demands of 20%, 19%, 7%, and 4% during the heating months than the other materials and thicknesses studied. Furthermore, PE showed the smallest cooling demands of 2%, 7%, 5%, and 4%. This was lower than the others studied.
5-
PC-16 mm is a more energy efficient double-glazed material than the other materials studied.
6-
The E–W orientation has smallest annual energy requirement when compared with the other orientations considered. The result indicates that in January, the average daily solar gain of the E–W (0°) orientation was, 11%, 14%, 15%, 12%, and 7%; and it was higher than the 15°, 30°, 45°, 60°, 75°, and 90° (N–S) orientations, respectively. Moreover, during June, the E–W (0°) orientation received 7%, 11%, 13%, 15%, and 15% less average solar gain than that of the 15°, 30°, 45°, 60°, 75°, and 90° (N–S) orientations, respectively.
7-
A 50% reduction in cooling demand was experienced during the whole summer season using natural ventilation combined with cooling.
8-
Using north wall insulation during the day, a 5% reduction in heating energy demand was achieved during whole winter season.
9-
The Venlo type greenhouse requires 25% less heat energy compared with the wide-span type and vice versa in the cooling season. The wide-span greenhouse requires 35% less cooling energy than the venlo type. Moreover, the solar energy gain of a wide-span greenhouse roof geometry is less than that of the venlo type greenhouse.

Author Contributions

Conceptualization, A.R., H.W.L., C.S.K. and H.T.K.; Methodology, A.R., C.S.K., and H.W.L.; Software, A.R., C.S.K.; Validation, C.S.K. and H.T.K.; Investigation, A.R., C.S.K.; Resources, W.H.L.; Writing—Original Draft Preparation, A.R. and C.S.K.; Writing—Review and Editing, C.S.K., H.T.K. and H.W.L.; Supervision, H.W.L. All authors have read and agreed to the published version of the manuscript.

Funding

This work was supported by Korea Institute of Planning and Evaluation for Technology in Food, Agriculture, Forestry and Fisheries (IPET) through Agriculture, Food and Rural Affairs Convergence Technologies Program for Educating Creative Global Leader, funded by Ministry of Agriculture, Food and Rural Affairs (MAFRA) (717001-7). This research was supported by Basic Science Research Program through the National Research Foundation of Korea (NRF) funded by the Ministry of Education (NRF-2019R1I1A3A01051739).

Conflicts of Interest

There is no conflict of interest regarding the publication of this research.

References

  1. Ahamed, M.S.; Guo, H.; Tanino, K. Energy-efficient design of greenhouse for canadian prairies using a heating simulation model. Int. J. Energy Res. 2018, 42, 2263–2272. [Google Scholar] [CrossRef]
  2. Vadiee, A.; Martin, V. Solar blind system- solar energy utilization and climate mitigation in glassed buildings. Energy Procedia 2014, 57, 2023–2032. [Google Scholar] [CrossRef] [Green Version]
  3. Yang, S.H.; Lee, C.G.; Lee, W.K.; Ashtiani, A.A.; Kim, J.Y.; Lee, S.D.; Rhee, J.Y. Heating and cooling system for utilization of surplus air thermal energy in greenhouse and its control logic. J. Biosyst. Eng. 2012, 37, 19–27. [Google Scholar] [CrossRef]
  4. Ahamed, M.S.; Guo, H.; Tanino, K.J.B.E. Energy saving techniques for reducing the heating cost of conventional greenhouses. Biosyst. Eng. 2019, 178, 9–33. [Google Scholar] [CrossRef]
  5. Xaman, J.; Hernandez-Perez, I.; Arce, J.; Alvarez, G.; Ramirez-Davila, L.; Noh-Pat, F. Numerical study of earth-to-air heat exchanger: The effect of thermal insulation. Energy Build. 2014, 85, 356–361. [Google Scholar] [CrossRef]
  6. Rasheed, A.; Lee, J.W.; Lee, H.W. Development of a model to calculate the overall heat transfer coefficient of greenhouse covers. Span. J. Agric. Res. 2017, 15, 1–11. [Google Scholar] [CrossRef] [Green Version]
  7. Gupta, M.J.; Chandra, P. Effect of greenhouse design parameters on conservation of energy for greenhouse environmental control. Energy 2002, 27, 777–794. [Google Scholar] [CrossRef]
  8. Gupta, A.; Tiwari, G. Performance evaluation of greenhouse for different climatic zones of india. J. Sol. Energy Soc. India 2002, 12, 45. [Google Scholar]
  9. Kumari, N.; Tiwari, G.; Sodha, M. Performance evaluation of greenhouse having passive or active heating in different climatic zones of india. Agric. Eng. Int. CIGR J. 2007, 9, 1–19. [Google Scholar]
  10. Sethi, V.P. On the selection of shape and orientation of a greenhouse: Thermal modeling and experimental validation. Sol. Energy 2009, 83, 21–38. [Google Scholar] [CrossRef]
  11. Çakır, U.; Şahin, E. Using solar greenhouses in cold climates and evaluating optimum type according to sizing, position and location: A case study. Comput. Electron. Agric. 2015, 117, 245–257. [Google Scholar] [CrossRef]
  12. Djevic, M.; Dimitrijevic, A. Energy consumption for different greenhouse constructions. Energy 2009, 34, 1325–1331. [Google Scholar] [CrossRef]
  13. Mobtaker, H.G.; Ajabshirchi, Y.; Ranjbar, S.F.; Matloobi, M. Solar energy conservation in greenhouse: Thermal analysis and experimental validation. Renew. Energy 2016, 96, 509–519. [Google Scholar] [CrossRef]
  14. El-Maghlany, W.M.; Teamah, M.A.; Tanaka, H. Optimum design and orientation of the greenhouses for maximum capture of solar energy in north tropical region. Energy Convers. Manag. 2015, 105, 1096–1104. [Google Scholar] [CrossRef]
  15. Rasheed, A.; Lee, J.; Lee, H. Development and optimization of a building energy simulation model to study the effect of greenhouse design parameters. Energies 2018, 11, 2001. [Google Scholar] [CrossRef] [Green Version]
  16. Lee, S.-B.; Lee, I.-B.; Homg, S.-W.; Seo, I.-H.; Bitog, P.J.; Kwon, K.-S.; Ha, T.-H.; Han, C.-P. Prediction of greenhouse energy loads using building energy simulation (bes). J. Korean Soc. Agric. Eng. 2012, 54, 113–124. [Google Scholar]
  17. Ha, T.; Lee, I.-B.; Kwon, K.-S.; Hong, S.-W. Computation and field experiment validation of greenhouse energy load using building energy simulation model. Int. J. Agric. Biol. Eng. 2015, 8, 116–127. [Google Scholar]
  18. Lee, S.-N.; Park, S.-J.; Lee, I.-B.; Ha, T.-H.; Kwon, K.-S.; Kim, R.-W.; Yeo, U.-H.; Lee, S.-Y. Design of energy model of greenhouse including plant and estimation of heating and cooling loads for a multi-span plastic-film greenhouse by building energy simulation. Prot. Hortic. Plant Fact. 2016, 25, 123–132. [Google Scholar] [CrossRef]
  19. Baglivo, C.; Mazzeo, D.; Panico, S.; Bonuso, S.; Matera, N.; Congedo, P.M.; Oliveti, G. Complete greenhouse dynamic simulation tool to assess the crop thermal well-being and energy needs. Appl. Therm. Eng. 2020, 179, 115698. [Google Scholar] [CrossRef]
  20. Carlini, M.; Castellucci, S. Modelling and simulation for energy production parametric dependence in greenhouses. Math. Probl. Eng. 2010, 2010. [Google Scholar] [CrossRef] [Green Version]
  21. Klein, S.A. Trnsys, A Transient System Simulation Program; Solar Energy Laborataory, University of Wisconsin: Madison, WI, USA, 2012. [Google Scholar]
  22. Castronuovo, D.; Russo, D.; Libonati, R.; Faraone, I.; Candido, V.; Picuno, P.; Andrade, P.; Valentao, P.; Milella, L. Influence of shading treatment on yield, morphological traits and phenolic profile of sweet basil (Ocimum basilicum L.). Sci. Hortic. 2019, 254, 91–98. [Google Scholar] [CrossRef]
  23. Valera, M.D.; Molina, A.F.; Alvarez, M.A. Protocolo de Auditoría Energética en Invernaderos. Auditoría Energética de un Invernadero Para Cultivo de flor Cortada en Mendigorría; Instituto para la diversificacion y ahorro de la energia: Madrid, Spain, 2008. [Google Scholar]
  24. Rasheed, A.; Na, W.H.; Lee, J.W.; Kim, H.T.; Lee, H.W.J.E. Optimization of greenhouse thermal screens for maximized energy conservation. Energies 2019, 12, 3592. [Google Scholar] [CrossRef] [Green Version]
  25. Rafiq, A.; Na, W.H.; Rasheed, A.; Kim, H.T.; Lee, H.W.J.P.H.; Factory, P. Determination of thermal radiation emissivity and absorptivity of thermal screens for greenhouse. Prot. Hortic. Plant Fact. 2019, 28, 311–321. [Google Scholar] [CrossRef]
  26. Ahamed, M.S.; Guo, H.; Tanino, K. Development of a thermal model for simulation of supplemental heating requirements in chinese-style solar greenhouses. Comput. Electron. Agric. 2018, 150, 235–244. [Google Scholar] [CrossRef]
  27. Vanthoor, B.H.E.; Stanghellini, C.; van Henten, E.J.; de Visser, P.H.B. A methodology for model-based greenhouse design: Part 1, a greenhouse climate model for a broad range of designs and climates. Biosyst. Eng. 2011, 110, 363–377. [Google Scholar] [CrossRef]
  28. Geoola, F.; Kashti, Y.; Levi, A.; Brickman, R. A study of the overall heat transfer coefficient of greenhouse cladding materials with thermal screens using the hot box method. Polym. Test. 2009, 28, 470–474. [Google Scholar] [CrossRef]
  29. Geoola, F.; Kashti, Y.; Teitel, M.; Levi, A.; Brickman, R.; Esquira, I. A Study of u Value of Greenhouse Films with Thermal Screens Using the Hot Box Method; International Society for Horticultural Science (ISHS): Leuvenz, Belgium, 2011; pp. 367–372. [Google Scholar]
  30. Rasheed, A.; Lee, J.W.; Lee, H.W. Evaluation of overall heat transfer coefficient of different greenhouse thermal screens using building energy simulation. Prot. Hortic. Plant Fact. 2018, 27, 294–301. [Google Scholar] [CrossRef]
  31. Taki, M.; Ajabshirchi, Y.; Ranjbar, S.F.; Rohani, A.; Matloobi, M. Modeling and experimental validation of heat transfer and energy consumption in an innovative greenhouse structure. Inf. Process. Agric. 2016, 3, 157–174. [Google Scholar] [CrossRef] [Green Version]
  32. Ahemd, H.A.; Al-Faraj, A.A.; Abdel-Ghany, A.M. Shading greenhouses to improve the microclimate, energy and water saving in hot regions: A review. Sci. Hortic. 2016, 201, 36–45. [Google Scholar] [CrossRef]
  33. Abdel-Ghany, A.; Al-Helal, I.; Alkoaik, F.; Alsadon, A.; Shady, M.; Ibrahim, A. Predicting the cooling potential of different shading methods for greenhouses in arid regions. Energies 2019, 12, 4716. [Google Scholar] [CrossRef] [Green Version]
  34. Lee, M.; Lee, I.-B.; Ha, T.-H.; Kim, R.-W.; Yeo, U.-H.; Lee, S.-Y.; Park, G.; Kim, J.-G. Estimation on heating and cooling loads for a multi-span greenhouse and performance analysis of pv system using building energy simulation. Prot. Hortic. Plant Fact. 2017, 26, 258–267. [Google Scholar] [CrossRef]
  35. Hassanien, R.H.E.; Li, M.; Lin, W.D. Advanced applications of solar energy in agricultural greenhouses. Renew. Sustain. Energy Rev. 2016, 54, 989–1001. [Google Scholar] [CrossRef]
  36. Ahamed, M.S.; Guo, H.; Tanino, K. Sensitivity analysis of csgheat model for estimation of heating consumption in a chinese-style solar greenhouse. Comput. Electron. Agric. 2018, 154, 99–111. [Google Scholar] [CrossRef]
  37. Wei, B.; Guo, S.; Wang, J.; Li, J.; Wang, J.; Zhang, J.; Qian, C.; Sun, J. Thermal performance of single span greenhouses with removable back walls. Biosyst. Eng. 2016, 141, 48–57. [Google Scholar] [CrossRef]
Figure 1. Experimental multi-span venlo type greenhouse at Taean Gun, Chungcheongnam-do, Korea.
Applsci 10 06884 g001
Figure 2. Geographic location of experimental greenhouse (latitude 36.88° N, longitude 126.24° E).
Applsci 10 06884 g002
Figure 3. Experimental greenhouse dimensions (a) single span vertical view (b) horizontal view.
Applsci 10 06884 g003aApplsci 10 06884 g003b
Figure 4. Flow diagram of the multi-span greenhouse Building Energy Simulation (BES) modeling.
Applsci 10 06884 g004
Figure 5. 3-D model of the studied multi-span greenhouse (a) Wide-span (b) Venlo.
Applsci 10 06884 g005
Figure 6. Transient System Simulation (TRNSYS) Simulation studio multi-span greenhouse model.
Applsci 10 06884 g006
Figure 7. Computed versus measured internal air temperature of the greenhouse for validation in (a) summer, and (b) winter.
Applsci 10 06884 g007aApplsci 10 06884 g007b
Figure 8. Comparison of heating and cooling loads of the greenhouse using thermal and shading screens.
Applsci 10 06884 g008
Figure 9. Screen control with outside solar radiation.
Applsci 10 06884 g009
Figure 10. Heating demand of greenhouse using different thermal screens.
Applsci 10 06884 g010
Figure 11. Monthly heating and cooling energy demand for the multi-span greenhouse using different greenhouse side wall covers. PE: Polyethylene, PVC: Polyvinyl chloride, HG: Horticulture Glass, PC: Poly carbonate, PMMA: Polymethylmethacrylate.
Applsci 10 06884 g011
Figure 12. Annual energy demand of greenhouse with double-glazing (a) Heating (b) Cooling, (c) Total.
Applsci 10 06884 g012
Figure 13. Annual energy demand for the greenhouse with different orientations.
Applsci 10 06884 g013
Figure 14. Annual energy demand for the greenhouse with different orientations.
Applsci 10 06884 g014
Figure 15. Comparison of monthly cooling demand of the greenhouse with natural ventilation and fully closed conditions.
Applsci 10 06884 g015
Figure 16. Comparison of greenhouse internal temperature with natural ventilation and fully closed conditions.
Applsci 10 06884 g016
Figure 17. Comparison of monthly heating demand of the greenhouse with and without north wall insulation.
Applsci 10 06884 g017
Figure 18. Comparison of monthly heating and cooling demand for selected greenhouse roof geometries.
Applsci 10 06884 g018
Figure 19. Comparison of monthly solar radiation gain for selected greenhouse roof geometries.
Applsci 10 06884 g019
Table 1. Characteristics of the recorded weather data.
Weather ParameterUnitTime IntervalSensorPrecision of SensorData Recorded
Temperature°C1 minIC, SHT75, SENSIRION±0.3 °CField recorded
Relative humidity%1 minIC, SHT75, SENSIRION±1.8%Field recorded
Solar radiationW·m−21 minML-01C, Technox Inc±2.0%Field recorded
Wind speedm·s−11 minModel_Vantage Pro 2 6152CEU (Davis)±5%Field recorded
Wind directiondegree 1 minModel_Vantage Pro 2 6152CEU (Davis)±5%Field recorded
Ambient pressurehPa1 minPTB-220TS, VAISALA±0.15%KMA
Table 2. Physical, optical, and thermal properties of the greenhouse coverings.
Cover CharacteristicsGreenhouse Materials
PCHGPEPVCPMMA
Solar radiation (300–2500 nm)
Transmittance0.780.890.860.910.78
Reflectance0.140.080.100.070.14
Visible radiation (380–760 nm)
Visible radiation transmittance0.750.910.890.920.75
Visible radiation reflectance0.150.080.080.140.15
Thermal radiation (2500–40,000 nm)
Transmittance0.020.100.180.060.02
Emmitance0.890.900.790.620.89
Conductivity (W·m−1·K−1)0.190.760.330.130.19
Thickness (mm)0.804.000.100.100.80
Table 3. Physical, optical, and thermal properties of the screens.
Cover CharacteristicsGreenhouse Materials
Ph-77Ph-SuperPolyesterLuxousTempa
Solar radiation (300–2500 nm)
Transmittance front0.17----
Transmittance back0.17----
Reflectance front0.59----
Reflectance back0.51----
Visible radiation (380–760 nm)
Transmittance front0.17----
Transmittance back0.17----
Reflectance front0.59----
Reflectance back0.51----
Thermal radiation (2500–40,000 nm)
Transmittance0.200.380.020.380.01
Emmitance front0.380.600.940.440.67
Emmitance back0.480.600.940.440.67
Conductivity (W·m−1·K−1)0.590.080.050.040.21
Thickness (mm)0.400.300.400.220.25
Table 4. Components of the greenhouse model in TRNSYS 18.
ComponentTypeDescription
Weather data reader9eThis component serves the purpose of reading data at regular time intervals from a data file, converting it to a desired unit system.
Solar radiation processor16cEstimates total, beam, reflected, and diffused radiation on all greenhouse surfaces by utilizing total solar radiation on horizontal.
Sky temperature calculator69bInput: dew point temperature, beam and diffuse radiation on horizontal to calculate sky temperature for long-wave radiation exchange, the calculated sky temp.
Psychrometric chart33eThis component calculates dew point temperature by utilizing inputs including, dry bulk temperature and humidity ratio.
Equation editor This type was used to insert an equation. Equations were used to control, orientation, heat and cooling annual set-points, natural ventilation and screens deploy and retract.
Greenhouse building model
with natural ventilation
56-a TRNFlow
1-
This type is used to call TRNBuild to process the physical greenhouse 3D model.
2-
TRNFlow is used to calculate natural ventilation air flow incorporation with a thermal model.
Controller165This type is a differential controller used to generate a control function which has a value of 0 and 1 for closed and open, respectively, used to control for deploying and retracting screens and opening and closing of vents for natural ventilation.
Monthly Function Scheduler518This type is used to generate, daily and monthly control values for the controller.
Time dependent forcing Function14It is used to control daily time varying set-points of heating and cooling
Printer25dThis type was used to print results on the external user- provided file
Plotter65cThis type was used to plot the results in an online plotter
Table 5. Summary of reference greenhouse conditions.
ParameterCondition (a)Condition (b)
Greenhouse typeMulti-spanMulti-span
No. of span1515
Roof typeVenloVenlo
Roof GlazingHG-4 mmHG-4 mm
Side GlazingPC-16 mmPC-16 mm
Dimension120.2 m × 63 m × 7.5 m120.2 m × 63 m × 7.5 m
Floor area7572.6 m27572.6 m2
OrientationNorth–SouthNorth–South
Period20–29 August 20191–10 December 2019
ScreenShading (Ph-77)Ph-77, Ph-Super
Screen controlSunrise: 10:30 a.m.Ph-77 retract (After sunrise, or Temp 10, or S.R 100 W)
Ph-77 deploy (After sunset, or Temp 12, and S.R 100 W)
Ph-Super_1 retract (After sunrise, or Temp 5, or S.R 50 W)
Ph-Super_1 deploy (After sunset, or Temp 12, and S.R 50 W)
Ph-Super_2 retract (After sunrise, or Temp 12, or S.R 150 W)
Ph-Super_2 deploy (After sunset, or Temp 14, and S.R 150 W)
Natural ventilationRoof vents Roof vents
Natural vents control set point temperature18 °C (00:00–04:00)18 °C (00:00–05:30)
20 °C (04:00–10:00)19 °C (05:30–16:15)
26 °C (10:00–18:00)15 °C (16:15–21:30)
18 °C (18:00–24:00)18 °C (21:30–24:00)
HeatingNo17 °C (00:00–16:15)
15 °C (16:15–21:30)
17 °C (21:30–24:00)
Table 6. Details of studied parameters.
ParameterTest Condition
Orientation0 (E-W)3045607590 (N-S)
Covering materialPEPVCHGPMMAPC
Double glazingPC (mm)4681016
PMMA (mm)816
No. of ScreensThermal 123
Shading 1
Screen MaterialsPh-77Ph-SuperLuxousTempaPolyester
Natural ventilationFully closedNaturally ventilated
North-wall insulationWithWithout
Roof shapeVenloWide-span
Table 7. Details of studied parameters.
Maximum Heating Load
Load (MJ·h−1·m−2)Outside Temperature (°C)Outside Solar Radiation (kJ·h−1·m−2)
Without screen0.65−10.70
1 screen0.46−10.70
2 screens0.41−10.70
3 screens0.34−10.70
Maximum Cooling Load
Without shading screen1.5035.73570
with shading screen1.1835.73570